Correlation between optimal carsharing locations and ...
10
ORIGINAL PAPER Correlation between optimal carsharing locations and carbon dioxide emissions in urban areas J.-B. Lee • W. Byun • S. H. Lee • M. Do Received: 12 December 2013 / Revised: 7 May 2014 / Accepted: 30 June 2014 / Published online: 23 July 2014 Ó Islamic Azad University (IAU) 2014 Abstract Carsharing, an alternative to car ownership, is being encouraged by many national governments as a means to alleviate air pollution and traffic congestion. Previously, many carsharing companies determined service locations through trial and error, but they currently define their parking locations in metropolitan cities for maximum customer coverage. However, identifying carsharing loca- tions according to the experiences of the pioneering cities might not yield valid results in some Asian countries where carsharing systems are unknown. Hence, this study exam- ines the characteristics of carsharing users in Daejeon, a small Korean city, to determine that city’s optimal car- sharing service locations. A geographic information system was used to analyze and determine the best spatial areas according to two data categories: internal and external demand factors. Suitable carsharing locations were ranked by the results of a grid analysis. Thirty optimal locations were then determined from the location-allocation model in a network analysis module. Determining optimal carsharing locations should also be directly correlated with the reduction of carbon dioxide emissions. Carbon dioxide emission reduction from carsharing was predicted at 62,070 tCO2eq for the year 2013; emission reductions were predicted to increase further to 172,923 tCO2eq by 2020. Thus, carsharing is an innovative strategy for traffic demand management that can alleviate air pollution. The results of this study indicate that further research is nec- essary to examine the relationship between optimal car- sharing locations and carbon dioxide emission reduction from using lower-emission carsharing vehicles, such as electric vehicles. Keywords Carsharing Carbon dioxide emission Correlation analysis Geographic information system Introduction Previously, people would ride bicycles that they owned. However, they do not do so anymore because bike sharing has become commonly available near subways, universi- ties, and commercial areas, especially in many urban areas. Presently, people rent a bicycle to travel short distances and then return it. This change indicates a shift from bicycle ownership to bicycle sharing. Similarly, carsharing could potentially replace car ownership and could be made an ‘‘anywhere and at anytime’’ service. Carsharing, an alternative to car ownership, is being encouraged by many national governments, including those of the USA and Europe, as a means to alleviate air pollution and traffic congestion (Shaheen et al. 2002; Martin and Shaheen 2011; Litman 2000). Despite the availability of public transpor- tation systems such as buses, subways, and trams, people still prefer to travel by car as it is more comfortable and J.-B. Lee Daejeon Development Institute, 85, Jungang-Ro, Jung-Gu, Daejeon 301-763, Korea W. Byun Urban Planning and Architecture Division, Land and Housing Institute (LHI), 462-2, Jeonmin-Dong, Yusong-Gu, Daejeon 305-731, Korea S. H. Lee U-City Research Cluster, Construction and Transportation Information Center, Hanbat National University, 16-1, Dukmyung-Dong, Yusong-Gu, Daejeon, Korea M. Do (&) Department of Urban Engineering, Hanbat National University, 16-1, Dukmyung-Dong, Yusong-Gu, Daejeon 305-719, Korea e-mail: [email protected] 123 Int. J. Environ. Sci. Technol. (2014) 11:2319–2328 DOI 10.1007/s13762-014-0640-x
Transcript of Correlation between optimal carsharing locations and ...

ORIGINAL PAPER
Correlation between optimal carsharing locations and carbondioxide emissions in urban areas
J.-B. Lee • W. Byun • S. H. Lee • M. Do
Received: 12 December 2013 / Revised: 7 May 2014 / Accepted: 30 June 2014 / Published online: 23 July 2014
� Islamic Azad University (IAU) 2014
Abstract Carsharing, an alternative to car ownership, is
being encouraged by many national governments as a
means to alleviate air pollution and traffic congestion.
Previously, many carsharing companies determined service
locations through trial and error, but they currently define
their parking locations in metropolitan cities for maximum
customer coverage. However, identifying carsharing loca-
tions according to the experiences of the pioneering cities
might not yield valid results in some Asian countries where
carsharing systems are unknown. Hence, this study exam-
ines the characteristics of carsharing users in Daejeon, a
small Korean city, to determine that city’s optimal car-
sharing service locations. A geographic information system
was used to analyze and determine the best spatial areas
according to two data categories: internal and external
demand factors. Suitable carsharing locations were ranked
by the results of a grid analysis. Thirty optimal locations
were then determined from the location-allocation model
in a network analysis module. Determining optimal
carsharing locations should also be directly correlated with
the reduction of carbon dioxide emissions. Carbon dioxide
emission reduction from carsharing was predicted at
62,070 tCO2eq for the year 2013; emission reductions were
predicted to increase further to 172,923 tCO2eq by 2020.
Thus, carsharing is an innovative strategy for traffic
demand management that can alleviate air pollution. The
results of this study indicate that further research is nec-
essary to examine the relationship between optimal car-
sharing locations and carbon dioxide emission reduction
from using lower-emission carsharing vehicles, such as
electric vehicles.
Keywords Carsharing � Carbon dioxide emission �Correlation analysis � Geographic information system
Introduction
Previously, people would ride bicycles that they owned.
However, they do not do so anymore because bike sharing
has become commonly available near subways, universi-
ties, and commercial areas, especially in many urban areas.
Presently, people rent a bicycle to travel short distances
and then return it. This change indicates a shift from
bicycle ownership to bicycle sharing. Similarly, carsharing
could potentially replace car ownership and could be made
an ‘‘anywhere and at anytime’’ service. Carsharing, an
alternative to car ownership, is being encouraged by many
national governments, including those of the USA and
Europe, as a means to alleviate air pollution and traffic
congestion (Shaheen et al. 2002; Martin and Shaheen 2011;
Litman 2000). Despite the availability of public transpor-
tation systems such as buses, subways, and trams, people
still prefer to travel by car as it is more comfortable and
J.-B. Lee
Daejeon Development Institute, 85, Jungang-Ro, Jung-Gu,
Daejeon 301-763, Korea
W. Byun
Urban Planning and Architecture Division, Land and Housing
Institute (LHI), 462-2, Jeonmin-Dong, Yusong-Gu, Daejeon
305-731, Korea
S. H. Lee
U-City Research Cluster, Construction and Transportation
Information Center, Hanbat National University, 16-1,
Dukmyung-Dong, Yusong-Gu, Daejeon, Korea
M. Do (&)
Department of Urban Engineering, Hanbat National University,
16-1, Dukmyung-Dong, Yusong-Gu, Daejeon 305-719, Korea
e-mail: [email protected]
123
Int. J. Environ. Sci. Technol. (2014) 11:2319–2328
DOI 10.1007/s13762-014-0640-x
convenient. Carsharing affords two benefits: the conve-
nience of a personal car and a low price compared with
traditional car rental. Carsharing is a new and innovative
transportation system that can easily be made available to
people in high-density areas. Therefore, it has rapidly
grown throughout metropolitan areas in North America and
Europe (Shaheen and Cohen 2007). The number of car-
sharing members in North America increased from 25,640
in 2003 to 279,174 in 2008 (Shaheen et al. 2009). Leveque
and Moosa (2013) estimated the numbers of carsharing
members and vehicles worldwide at 3 million and 70,000,
respectively, as of 2013; they predicted a further increase
in the number of members to 26.2 million by 2020. Zhao
(2010) predicted that the number of carsharing members
would increase to 4.4 million and 5.5 million in North
America and Europe, respectively, by 2016.
Previous studies on carsharing mostly focused on evalu-
ating benefits in terms of traffic demand management and
greenhouse gas emission reduction (Litman 2000; Cervero
and Tsai 2004; Catalano et al. 2008; Martin and Shaheen
2011; Rodier and Shaheen 2003; Liao et al. 2013). Cervero
and Tsai (2004) estimated the extent to which carsharing
reduces car ownership and traffic volume. Martin and
Shaheen (2011) evaluated the effect of carsharing on
greenhouse gas emissions by monitoring the lifestyle
changes of carsharing members. Rodier and Shaheen (2003)
evaluated the extent to which carsharing affects vehicle
emission reduction, as well as its economic benefits. Several
recent studies have examined carsharing users’ behavior and
demand modeling. Costain et al. (2012) investigated car-
sharing members’ behavior using a dataset on carsharing in
Toronto. Accessibility is one of the most important factors,
and membership varies with increasing parking lot size. In
addition, more than 60 % of carsharing members traveled
less than 40 km per year. Jorge and Correia (2013) reviewed
previous studies on demand estimation in carsharing sys-
tems. Many demand modeling studies had explored vehicle
relocation to balance one-way carsharing systems rather
than round trips. Correia and Antunes (2012) performed an
optimization study for depot locations in one-way carshar-
ing systems. They used mixed-integer programming models
as a profit-maximizing optimization approach.
However, most studies are yet to adequately address
location determination issues. Although location determi-
nation is a factor that directly affects the sustainability of
carsharing services, only a few studies have focused on
methods to identify optimal carsharing locations. Ion et al.
(2009) investigated optimal locations for electric carshar-
ing services by modeling user preferences. Celsor and
Millard-Ball (2007) analyzed potential carsharing locations
by using a geographic information system (GIS) tool, based
on the characteristics of existing locations. Determining
optimal carsharing locations is very important, because it
can result in maximizing carsharing operational rates. As
previously mentioned, Martin and Shaheen (2011) suggest
that carsharing can directly change lifestyle choices, lead-
ing in turn to a reduction in greenhouse gas emissions,
particularly carbon dioxide (CO2). Thus, the correlations
between optimal carsharing locations and CO2 emission
reduction need to be studied.
In the early stages, most carsharing companies deter-
mined their service locations through trial and error. Now,
economically viable carsharing locations in a metropolitan
city such as New York, San Francisco, or Paris can be easily
determined according to the pioneering cities’ model. Such
cities generally have a high population density, various
public transportation systems, and excellent traffic net-
works; moreover, the indicators for determining carsharing
locations are similar. However, identifying carsharing
locations according to the experiences of pioneering cities
may not yield sustainable and profitable results for car-
sharing companies in a smaller city or in some Asian
countries where carsharing systems are unknown. One
reason for this is the fact that carsharing users in Asian
countries, including Korea, have different characteristics.
For example, accessibility to carsharing locations is one of
the most important factors for the sustainability of car-
sharing services in pioneering metropolitan cities. How-
ever, small- and medium-sized cities generally have low-
quality public transportation systems with long allocation
times, and some areas have a low population density. Both
of these factors are obstacles to determining optimal car-
sharing locations. In addition, even though carsharing has
become common in North America and Europe, it is still an
unfamiliar concept in most Asian countries. Most Asians
are not comfortable with sharing a vehicle. However, this
situation is likely to change, albeit slowly. China has started
encouraging carsharing as an innovative transportation
method with environmental and social advantages (Shaheen
and Martin 2010). Therefore, a more systematic approach is
necessary to determine optimal service locations for making
carsharing sustainable and profitable. This study investi-
gates the characteristics of Daejeon, an urban city in Korea,
and identifies the best carsharing locations using a GIS tool.
In addition, we have calculated CO2 emission reductions
from carsharing when operation rates are maximized.
Materials and methods
General carsharing survey results
Distribution of carsharing usage time
In Korea, carsharing was introduced in 2008. As of 2012,
six carsharing companies operate in Korea. For this study,
2320 Int. J. Environ. Sci. Technol. (2014) 11:2319–2328
123
we obtained data for 5 months from Green Point, one of the
most successful carsharing companies in Korea. Green
Point’s marketing team conducted a survey from October
1, 2011, to February 28, 2012, targeting people who had
experienced carsharing. They obtained 661 valid responses
from among 15,865 members. The data collected enabled
us to analyze the characteristics of carsharing users.
The main distinction between carsharing and traditional
car rental is that, in the latter case, cars are rented for a
minimum of 24 h. The survey results of this study suggest
that 35.9 % of carsharing users in Korea rent a car for less
than 3 h, which is a relatively short period considering US
data. For example, some 90 % of City CarShare members
in San Francisco normally rent a car for\5 h (Cervero and
Tsai 2004). Furthermore, a significant percentage of car-
sharing members in Korea rent a vehicle for more than
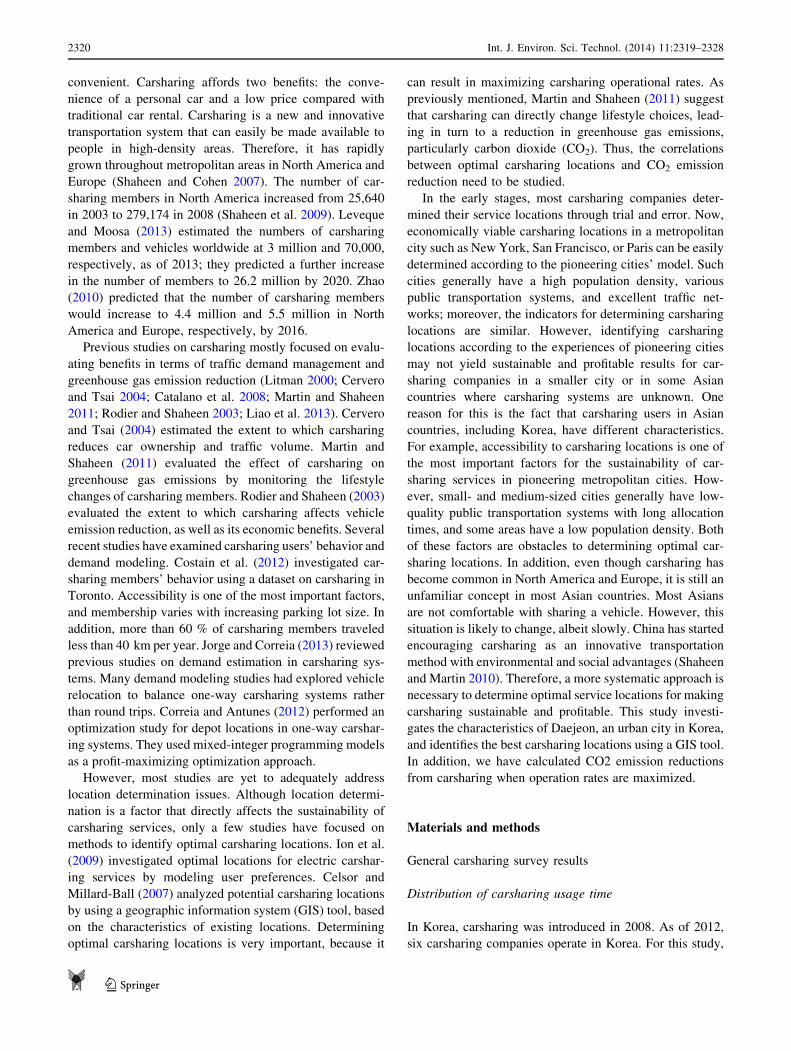
1 day: 11.0 % rent for 1 day and 8.7 %, for 2 days (Fig. 1).
These results suggest that many carsharing members in
Korea are yet to differentiate traditional car rental from
carsharing. However, some members consider it more
convenient to reserve and use a shared car than to interact
with classical renting companies.
Carsharing purposes
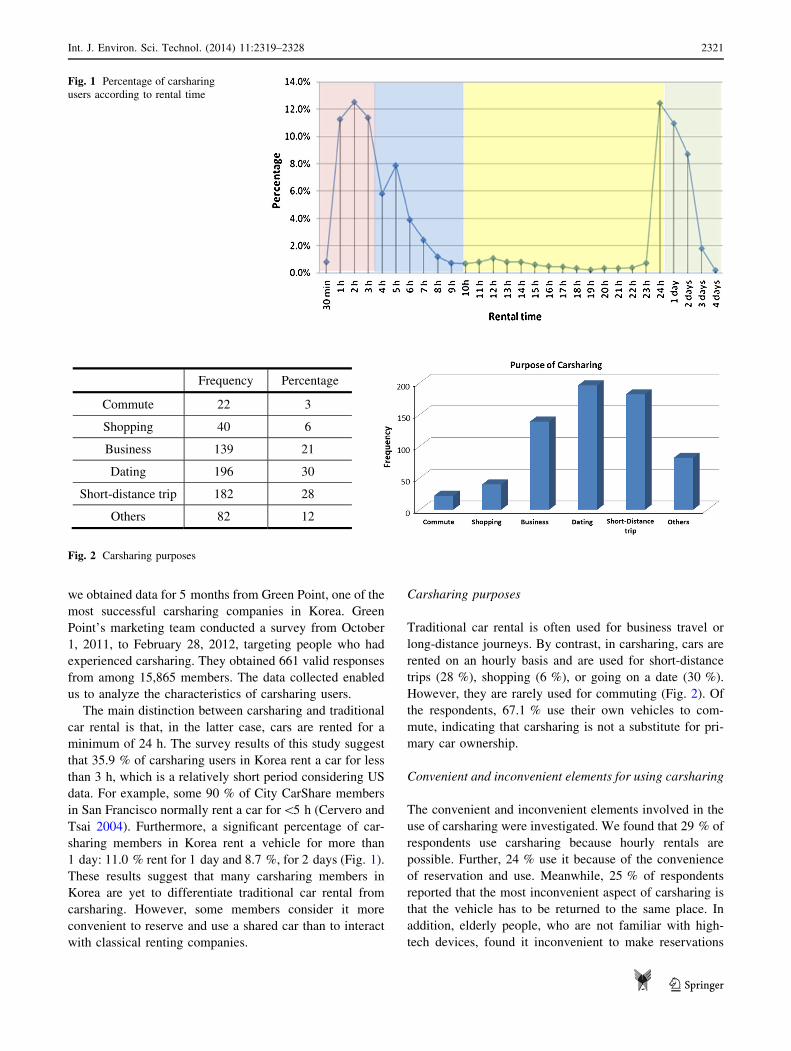
Traditional car rental is often used for business travel or
long-distance journeys. By contrast, in carsharing, cars are
rented on an hourly basis and are used for short-distance
trips (28 %), shopping (6 %), or going on a date (30 %).
However, they are rarely used for commuting (Fig. 2). Of
the respondents, 67.1 % use their own vehicles to com-
mute, indicating that carsharing is not a substitute for pri-
mary car ownership.
Convenient and inconvenient elements for using carsharing
The convenient and inconvenient elements involved in the
use of carsharing were investigated. We found that 29 % of
respondents use carsharing because hourly rentals are
possible. Further, 24 % use it because of the convenience
of reservation and use. Meanwhile, 25 % of respondents
reported that the most inconvenient aspect of carsharing is
that the vehicle has to be returned to the same place. In
addition, elderly people, who are not familiar with high-
tech devices, found it inconvenient to make reservations
Fig. 1 Percentage of carsharing
users according to rental time
Frequency Percentage
Commute 22 3
Shopping 40 6
Business 139 21
Dating 196 30
Short-distance trip 182 28
Others 82 12
Fig. 2 Carsharing purposes
Int. J. Environ. Sci. Technol. (2014) 11:2319–2328 2321
123
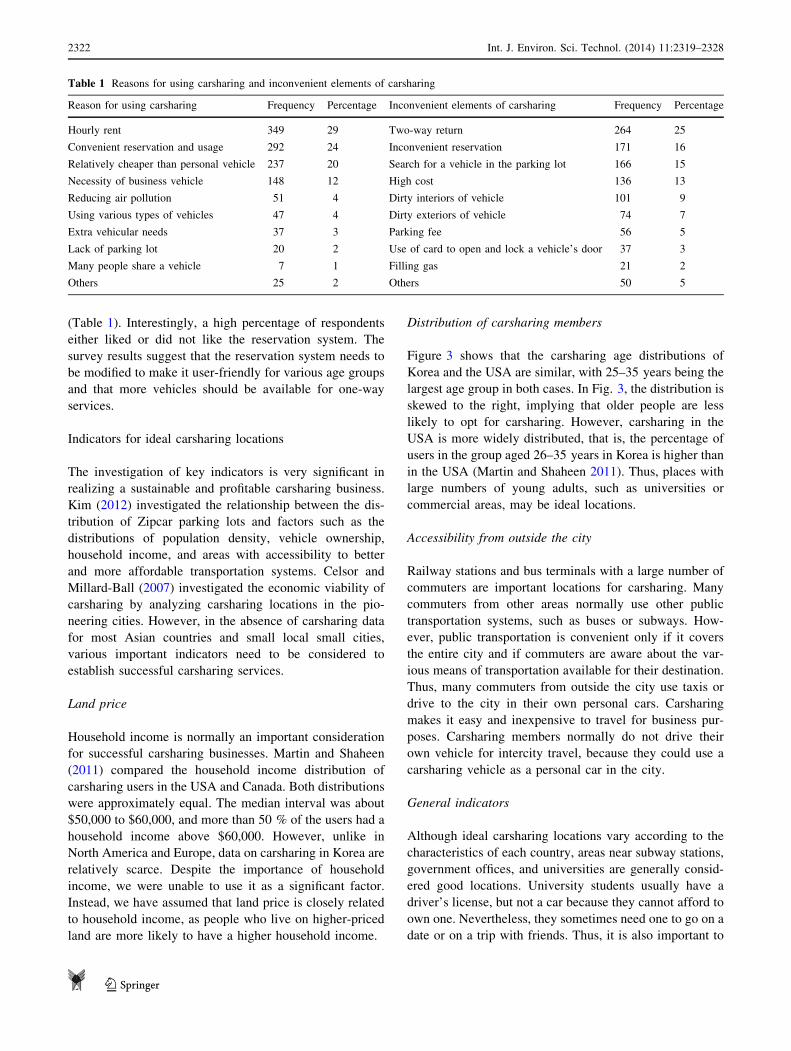
(Table 1). Interestingly, a high percentage of respondents
either liked or did not like the reservation system. The
survey results suggest that the reservation system needs to
be modified to make it user-friendly for various age groups
and that more vehicles should be available for one-way
services.
Indicators for ideal carsharing locations
The investigation of key indicators is very significant in
realizing a sustainable and profitable carsharing business.
Kim (2012) investigated the relationship between the dis-
tribution of Zipcar parking lots and factors such as the
distributions of population density, vehicle ownership,
household income, and areas with accessibility to better
and more affordable transportation systems. Celsor and
Millard-Ball (2007) investigated the economic viability of
carsharing by analyzing carsharing locations in the pio-
neering cities. However, in the absence of carsharing data
for most Asian countries and small local small cities,
various important indicators need to be considered to
establish successful carsharing services.
Land price
Household income is normally an important consideration
for successful carsharing businesses. Martin and Shaheen
(2011) compared the household income distribution of
carsharing users in the USA and Canada. Both distributions
were approximately equal. The median interval was about
$50,000 to $60,000, and more than 50 % of the users had a
household income above $60,000. However, unlike in
North America and Europe, data on carsharing in Korea are
relatively scarce. Despite the importance of household
income, we were unable to use it as a significant factor.
Instead, we have assumed that land price is closely related
to household income, as people who live on higher-priced
land are more likely to have a higher household income.
Distribution of carsharing members
Figure 3 shows that the carsharing age distributions of
Korea and the USA are similar, with 25–35 years being the
largest age group in both cases. In Fig. 3, the distribution is
skewed to the right, implying that older people are less
likely to opt for carsharing. However, carsharing in the
USA is more widely distributed, that is, the percentage of
users in the group aged 26–35 years in Korea is higher than
in the USA (Martin and Shaheen 2011). Thus, places with
large numbers of young adults, such as universities or
commercial areas, may be ideal locations.
Accessibility from outside the city
Railway stations and bus terminals with a large number of
commuters are important locations for carsharing. Many
commuters from other areas normally use other public
transportation systems, such as buses or subways. How-
ever, public transportation is convenient only if it covers
the entire city and if commuters are aware about the var-
ious means of transportation available for their destination.
Thus, many commuters from outside the city use taxis or
drive to the city in their own personal cars. Carsharing
makes it easy and inexpensive to travel for business pur-
poses. Carsharing members normally do not drive their
own vehicle for intercity travel, because they could use a
carsharing vehicle as a personal car in the city.
General indicators
Although ideal carsharing locations vary according to the
characteristics of each country, areas near subway stations,
government offices, and universities are generally consid-
ered good locations. University students usually have a
driver’s license, but not a car because they cannot afford to
own one. Nevertheless, they sometimes need one to go on a
date or on a trip with friends. Thus, it is also important to
Table 1 Reasons for using carsharing and inconvenient elements of carsharing
Reason for using carsharing Frequency Percentage Inconvenient elements of carsharing Frequency Percentage
Hourly rent 349 29 Two-way return 264 25
Convenient reservation and usage 292 24 Inconvenient reservation 171 16
Relatively cheaper than personal vehicle 237 20 Search for a vehicle in the parking lot 166 15
Necessity of business vehicle 148 12 High cost 136 13
Reducing air pollution 51 4 Dirty interiors of vehicle 101 9
Using various types of vehicles 47 4 Dirty exteriors of vehicle 74 7
Extra vehicular needs 37 3 Parking fee 56 5
Lack of parking lot 20 2 Use of card to open and lock a vehicle’s door 37 3
Many people share a vehicle 7 1 Filling gas 21 2
Others 25 2 Others 50 5
2322 Int. J. Environ. Sci. Technol. (2014) 11:2319–2328
123

consider locations near universities. In addition, high
population density areas such as commercial areas com-
monly provide various types of public transportation sys-
tems in easily accessible locations. Carsharing users in
such areas are more likely to choose carsharing over other
alternatives.
Results and discussion
Study area
Daejeon, an urban Korean city, was selected for this case
study (Fig. 4). Daejeon has a population density of 2,535/
km2, the sixth highest in Korea. It has five boroughs: Dong-
Gu, a commercial and financial center; Jung-Gu and Seo-
Gu, residential areas; Daedeok-Gu, an information tech-
nology (IT) center; and Yuseong-Gu, a green area and a
venue for international events. Typically, people belonging
to the higher-income groups live in Jung-Gu, Seo-Gu, and
Yuseong-Gu, whereas those belonging to the lower-income
groups live in Dong-Gu. Residents of Yuseong-Gu value
higher education very much because most of them have
higher educational qualifications. Daedeok-Gu and Dong-
Gu are both well-known new industry and business areas.
GIS analysis for determining optimal carsharing
locations
Building base data for GIS analysis
To investigate optimal carsharing locations, grid analysis
was performed by GIS, which is a useful tool to analyze
and determine the best spatial areas for a certain purpose
using geographical data. Vlachopoulou et al. (2001) used
the GIS tool to select warehouse sites. Atabi et al. (2013)
Fig. 3 Comparison of
carsharing user age distributions
in Korea and the USA
Fig. 4 Map of Daejeon, the case study area
Int. J. Environ. Sci. Technol. (2014) 11:2319–2328 2323
123

investigated levels of benzene concentration produced
from vehicles and gas stations at Tehran in Iran by using
the GIS tool. The data for this study were classified into
two categories for grid analysis: internal demand factors
and external demand factors. Eight indicators were used to
standardize the units of measure and transform the area into
a matrix of cells (Fig. 5). Then, the data were weighted
based on the proportion of cells within a walking sphere of
500 m 9 500 m. Through overlay analysis, optimal car-
sharing locations were determined. Figure 5 shows the
process for identifying those locations. In the calculation,
Wi indicates the weight based on the proportion of cells
within the 500 m 9 500 m area. The values were calcu-
lated by multiplying each indicator by its weight.
Figure 6 shows the distribution of spatial elements, such
as population distributions of ages between 25 and
35 years, land price, commercial areas, government offices,
universities, subway and railway stations, and bus termi-
nals. Daejeon has only one subway line and insufficient
city bus lines. Commercial areas are dispersed around the
city. In contrast, the city has relatively many universities
with 0.1 million students out of a population of 1.5 million.
Compared with the other boroughs, Jung-Gu, Seo-Gu, and
Yuseong-Gu have a high percentage of households.
Analytic hierarchy process for standardization
The analytic hierarchy process (AHP) technique was
adopted to analyze complex decisions. The AHP helps
decision makers to determine options that would best suit
their goal. Nouri et al. (2013) made environmental deci-
sions for new towns using the AHP model. Tuzkaya (2009)
applied fuzzy-AHP methodology to consider the environ-
mental effects of transportation modes. The preference-
ranking organization method for enrichment evaluation
was used to rank transportation modes. In this paper, the
AHP model was used to reflect the relative importance of
indicators, which may affect optimal carsharing locations.
Figure 7 shows the results of the survey, eliminating more
than 0.15 of the consistency ratio (CR). A CR of no more
than 0.15 indicates that respondents performed pairwise
comparisons of elements consistently. Here, the CR is
calculated from the relationship between the consistency
index and the random consistency index. On the basis of
the AHP results, age distribution and commercial areas (as
internal demand factors), as well as railway stations and
bus terminals (as external demand factors), proved to be
more important than others.
CI ¼ kmax � N
N � 1ð1Þ
CR ¼ CI
RIð2Þ
Here, CI: consistency index, kmax: max eigenvalue, N:
size of matrix, RI: random consistency index.
Optimal carsharing locations
With these spatial elements, every cell was ranked by
overlay analysis. Then, the location-allocation model in the
network analysis module was adopted to determine 30
optimal locations. This paper adopted the minimize
weighted impedence (p-median) model to determine opti-
mal carsharing service locations. This model determines
the optimal carsharing locations with the minimum total
distance between carsharing users and 30 locations on the
assumption that all users use the minimum-distance vehi-
cle. The equation is represented below (Chan 2004):
Fig. 5 Process for identifying carsharing locations
2324 Int. J. Environ. Sci. Technol. (2014) 11:2319–2328
123

Min Z ¼X
i2I
X
j2I
fidijxij ð3Þ
Here, s.t.P
j2Ixij C 1, Vi 2 IX
j2I
xjj ¼ p
I: set of nodes, p: number of facilities, fi: frequency of
demand at node i, dij: distance between nodes i and j, xij = 1
if facility j serves i, = 0 otherwise.
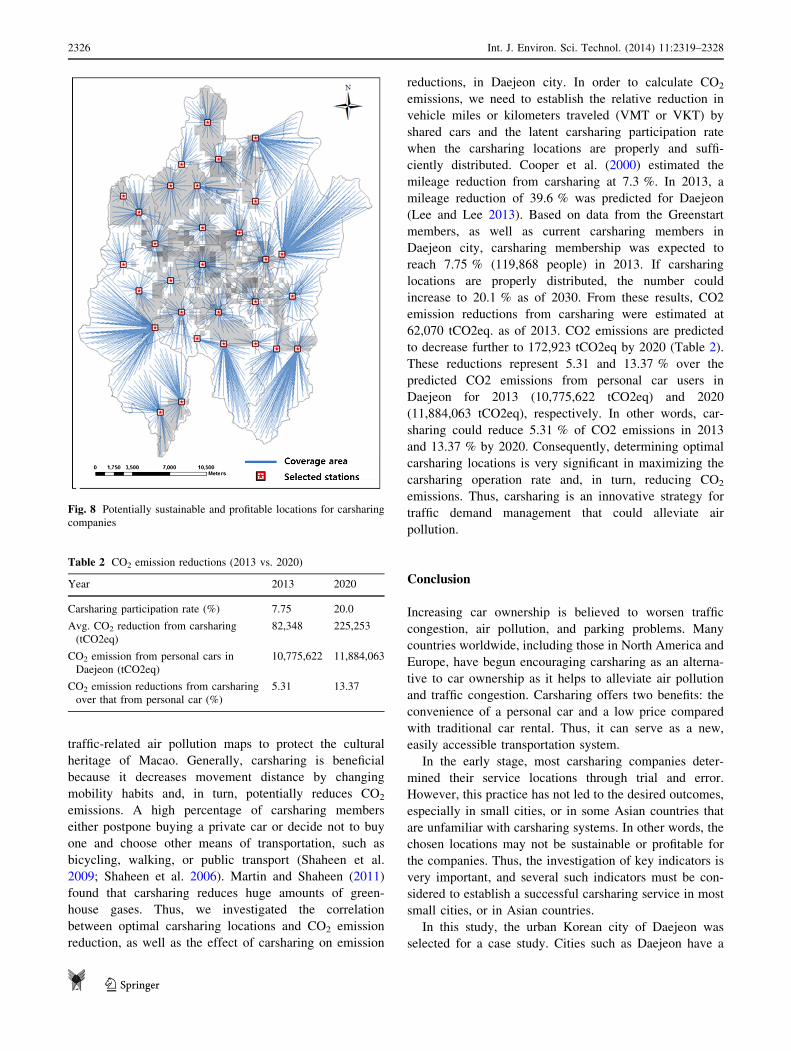
These results yielded 30 potentially sustainable and
profitable locations (Fig. 8), similar to those of previous
studies. Martin and Shaheen (2011) found that carsharing is
highly correlated with the urban environment such as
public transit and pedestrian infrastructure. Costain et al.
(2012) mentioned that members are more likely to use
carsharing vehicles from within a distance of 1 km. Celsor
and Millard-Ball (2007) found that carsharing is closely
related to car ownership and locations are characterized by
large parking spaces and high population density. The
locations proposed in this paper are mostly near places with
a high daytime population density, such as major stations
and terminals, are easily accessible and have high walking
rates.
Effect of carsharing on carbon dioxide emission
reduction
Alleviating vehicle-related air pollution requires traffic
demand management. Sheng and Tang (2013) presented
Fig. 6 Distributions of spatial elements
Fig. 7 Weight of assessment indicators
Int. J. Environ. Sci. Technol. (2014) 11:2319–2328 2325
123
traffic-related air pollution maps to protect the cultural
heritage of Macao. Generally, carsharing is beneficial
because it decreases movement distance by changing
mobility habits and, in turn, potentially reduces CO2
emissions. A high percentage of carsharing members
either postpone buying a private car or decide not to buy
one and choose other means of transportation, such as
bicycling, walking, or public transport (Shaheen et al.
2009; Shaheen et al. 2006). Martin and Shaheen (2011)
found that carsharing reduces huge amounts of green-
house gases. Thus, we investigated the correlation
between optimal carsharing locations and CO2 emission
reduction, as well as the effect of carsharing on emission
reductions, in Daejeon city. In order to calculate CO2
emissions, we need to establish the relative reduction in
vehicle miles or kilometers traveled (VMT or VKT) by
shared cars and the latent carsharing participation rate
when the carsharing locations are properly and suffi-
ciently distributed. Cooper et al. (2000) estimated the
mileage reduction from carsharing at 7.3 %. In 2013, a
mileage reduction of 39.6 % was predicted for Daejeon
(Lee and Lee 2013). Based on data from the Greenstart
members, as well as current carsharing members in
Daejeon city, carsharing membership was expected to
reach 7.75 % (119,868 people) in 2013. If carsharing
locations are properly distributed, the number could
increase to 20.1 % as of 2030. From these results, CO2
emission reductions from carsharing were estimated at
62,070 tCO2eq. as of 2013. CO2 emissions are predicted
to decrease further to 172,923 tCO2eq by 2020 (Table 2).
These reductions represent 5.31 and 13.37 % over the
predicted CO2 emissions from personal car users in
Daejeon for 2013 (10,775,622 tCO2eq) and 2020
(11,884,063 tCO2eq), respectively. In other words, car-
sharing could reduce 5.31 % of CO2 emissions in 2013
and 13.37 % by 2020. Consequently, determining optimal
carsharing locations is very significant in maximizing the
carsharing operation rate and, in turn, reducing CO2
emissions. Thus, carsharing is an innovative strategy for
traffic demand management that could alleviate air
pollution.
Conclusion
Increasing car ownership is believed to worsen traffic
congestion, air pollution, and parking problems. Many
countries worldwide, including those in North America and
Europe, have begun encouraging carsharing as an alterna-
tive to car ownership as it helps to alleviate air pollution
and traffic congestion. Carsharing offers two benefits: the
convenience of a personal car and a low price compared
with traditional car rental. Thus, it can serve as a new,
easily accessible transportation system.
In the early stage, most carsharing companies deter-
mined their service locations through trial and error.
However, this practice has not led to the desired outcomes,
especially in small cities, or in some Asian countries that
are unfamiliar with carsharing systems. In other words, the
chosen locations may not be sustainable or profitable for
the companies. Thus, the investigation of key indicators is
very important, and several such indicators must be con-
sidered to establish a successful carsharing service in most
small cities, or in Asian countries.
In this study, the urban Korean city of Daejeon was
selected for a case study. Cities such as Daejeon have a
Fig. 8 Potentially sustainable and profitable locations for carsharing
companies
Table 2 CO2 emission reductions (2013 vs. 2020)
Year 2013 2020
Carsharing participation rate (%) 7.75 20.0
Avg. CO2 reduction from carsharing
(tCO2eq)
82,348 225,253
CO2 emission from personal cars in
Daejeon (tCO2eq)
10,775,622 11,884,063
CO2 emission reductions from carsharing
over that from personal car (%)
5.31 13.37
2326 Int. J. Environ. Sci. Technol. (2014) 11:2319–2328
123
low-quality public transportation system, and commercial
areas are dispersed throughout the city. A GIS tool was
used to determine optimal carsharing locations in Daejeon.
As key indicators, eight spatial elements were considered.
These indicators were weighted using the AHP technique.
Notably, their ranking was highly sensitive to the weights
assigned to various criteria. Then, by using the location-
allocation model in the network analysis module, 30 suit-
able locations were determined as being potentially sus-
tainable and profitable for carsharing companies. CO2
emission reduction from carsharing was calculated to
investigate its correlation with optimal carsharing loca-
tions. In this study, CO2 emission reduction from car-
sharing was estimated at 62,070 tCO2eq for 2013 and
172,923 tCO2eq for 2020. These amounts were, respec-
tively, 5.31 and 13.37 % over the predicted CO2 emissions
from personal car users in Daejeon for the same years.
Car ownership is not expected to decrease in the short
term despite its negative effects such as traffic congestion,
air pollution, and parking problems. Carsharing is not the
ultimate solution to reducing car ownership in many Asian
countries, particularly Korea. In addition, the selected
indicators in this study may have nothing that differentiates
them from those in the pioneering cities. This is because
carsharing in Korea has just started and is yet to become
popular in small Korean cities. Even though carsharing
data have now been accumulated, the data obtained are not
sufficient to validate our study. However, according to
Celsor and Millard-Ball (2007), each city has different
indicators—one-person households, commute mode shares,
and neighborhood characteristics, for example. Hence, a
more systematic approach was applied to determine opti-
mal service locations. Despite the limited availability of
carsharing data, this study demonstrated that adequately
addressing location determination issues is very important
for the sustainability of carsharing services and that air
pollution can also be alleviated by changing people’s
lifestyle choices. Further studies need to focus on the
relationship between optimal carsharing locations and CO2
emission reduction by lower-emission carsharing vehicles,
such as electric vehicles and gasoline–electric hybrid cars.
In addition, a validation study with sufficient carsharing
data needs to be performed as a future work.
Acknowledgments This research was supported by a grant from the
Daejeon Development Institute.
References
Atabi F, Moattar F, Mansouri N, Alesheikh AA, Mirzahosseini SAH
(2013) Assessment of variations in benzene concentration
produced from vehicles and gas stations in Tehran using GIS.
Int J Environ Sci Technol 10:283–294
Catalano M, Casto BL, Migliore M (2008) Car sharing demand
estimation and urban transport demand modeling using stated
preference techniques. Eur Transp 40:33–50
Celsor C, Millard-Ball A (2007) Where does carsharing work? Using
geographic information systems to assess market potential.
Transp Res Rec J Transp Res Board 1992:61–69
Cervero R, Tsai Y (2004) City carshare in San Francisco, California:
second-year travel demand and car ownership impacts. Transp
Res Rec J Transp Res Board 1887:117–127
Chan Y (2004) Location, transport and land-use. Springer, New York.
ISBN 3-540-21087-3
Cooper G, Howes D, Mye P (2000) The missing link: an evaluation of
carsharing Portland Inc. Workshop Report Prepared for Public
Policy Research, Oregon Department of Environmental Quality,
and CarSharing Portland Inc
Correia G, Antunes A (2012) Optimization approach to depot location
and trip selection in one-way carsharing systems. Transp Res
Part E 48:233–247
Costain C, Ardron C, Habib KN (2012) Synopsis of users’ behaviour
of a carsharing program: a case study in Toronto. Transp Res
Part A 46:421–434
Ion L, Cucu T, Boussier JM, Teng F, Breuil D (2009) Site selection
for electric cars of a car-sharing service. World Electr Veh J 3,
ISSN: 2032-6653
Jorge D, Correia G (2013) Carsharing systems demand estimation and
defined operations: a literature review. Eur J Transp Infrastruct
Res 13(3):201–220
Kim K (2012) Zipping around NYC: Carsharing in New York City
Lee SH, Lee JB (2013) Analyzing the environmental effect of
carsharing. J Korean Soc Environ Technol 14(5):369–375
Leveque F, Moosa MM (2013) Voice of future car sharing customer:
it’s all about wholly sharing and partly pairing. Frost and
Sullivan
Liao CH, Chang CL, Su CY, Chiueh PT (2013) Correlation between
land-use change and greenhouse gas emissions in urban areas.
Int J Environ Sci Technol 10:1275–1286
Litman T (2000) Evaluating carsharing benefits. Transp Res Rec J
Transp Res Board 1702:31–35
Martin EW, Shaheen SA (2011) Greenhouse gas emission impacts of
carsharing in North America. IEEE trans Intell Transp Syst
12(4):1074–1086
Nouri J, Maghsoudlou B, Aboushahab Z (2013) Utilization multi
attribute decision making models for spatial prioritization and
environmental decision making in new towns. Int J Environ Sci
Technol 10:443–454
Rodier C, Shaheen SA (2003) Carsharing and carfree housing:
predicted travel, emission, and economic benefits. Presented at
82nd Annual Meeting of the Transportation Research Board,
Washington, DC
Shaheen SA, Cohen AP (2007) Growth in worldwide carsharing.
Transp Res Rec J Transp Res Board 1992:81–89
Shaheen SA, Martin E (2010) Demand for carsharing systems in
Beijing, China: an exploratory study. Int J Sustain Transp
4(1):41–55
Shaheen SA, Wright J, Sperling D (2002) California’s zero-emission
vehicle mandate. Transp Res Rec J Transp Res Board
1791:113–120
Shaheen SA, Cohen AP, Roberts JD (2006) Carsharing in North
America: market growth, current developments, and future
potential. Transp Res Rec J Transp Res Board 1986:116–124
Shaheen SA, Cohen AP, Chung MS (2009) North American
carsharing: 10-year retrospective. Transp Res Rec J Transp
Res Board 2110:35–44
Sheng N, Tang UW (2013) Risk assessment of traffic-related air
pollution in a world heritage city. Int J Environ Sci Technol
10:11–18
Int. J. Environ. Sci. Technol. (2014) 11:2319–2328 2327
123

Tuzkaya UR (2009) Evaluating the environmental effects of trans-
portation modes using an integrated methodology and an
application. Int J Environ Sci Technol 6(2):277–290
Vlachopoulou M, Silleos G, Manthou V (2001) Geographic infor-
mation systems in warehouse site selection decisions. Int J Prod
Econ 71:205–212
Zhao D (2010) Carsharing: a sustainable and innovative personal
transport solution with great potential and huge opportunities.
Frost and Sullivan
2328 Int. J. Environ. Sci. Technol. (2014) 11:2319–2328
123