Correlation Between Network KPIs and User Experience of ...
10
Innovative Systems Design and Engineering www.iiste.org ISSN 2222-1727 (Paper) ISSN 2222-2871 (Online) Vol.8, No.3, 2017 1 Correlation Between Network KPIs and User Experience of GSM Networks in Pakistan Javed Akhtar Khan, Dr. Irfan Zafar Institute of Communication Technologies, Islamabad, UET Peshawar Abstract Pakistan’s Cellular communication industry is now shaping up and companies are now focusing on user experience to retain customers and monetize on products and services offered. Changes in cellular communication landscape and tough competition due to price war and heavy taxation, profit margin is decreasing and hence reducing tariffs for products and services. Operators are now opting for solid network performance and developing new models while keeping quality of services intact. User Experience and Network Key Performance Indications (KPIs) reflects the gap which needs to be filled by offering smart solutions and adapting to customer centric approach. This study attempted to analyze the impact on user experience due to network KPIs considering the variables (1) Understanding of Network and Performance (2) Understanding User Experience (3) Lack of use of reporting tools and best practices (4) Coordination between different teams (5) Customer experience feedback. In this research work, a comprehensive model is developed using which User experience can be enhanced with existing and new tools together. Keywords: Telecommunications, KPIs, Network performance, User experience 1. INTRODUCTION Cellular communication revolutionized the way people communicate by providing mobility and seamless connectivity. In short time, momentous progress has been achieved in the history of wireless communication. Cellular communication is now leaping beyond Fourth generation (4G)as shown in table 1.Aimed at performance and efficiency in mobile environment wireless technology has followed different evolutionary paths. First Generation has fulfilled the demand of mobile voice and later Second generation has built capacity and coverage [1]. 2G followed by 3G which brought the facility of data at higher speed which opened new avenues in mobile broadband which is now realized by Fourth generation (4G). Current advancement in 4G has now enabled users with near 150 Mbps of broadband speed with virtue of new technologies available across industry. This research and further advancements enabled users with bandwidth hungry application like video conference and streaming while being mobile. [3] Pakistan has built up a focused and dynamic business sector which allowed a cell operator to investigate increasingly and conveyance to end user. In 2004, about 5 million subscribers hopped to 100 million in 2010. Voice quality has been the principle center of cell organizations however now center is likewise towards information and worth included administrations. Pakistan cell administrators give minimal effort portable association however exceptionally intense rivalry among various organizations [1]. First generation cellular communication used analog transmission for voice. In 1979, Nippon telephone and telegraph (NTT) first started cellular system in Tokyo, Japan. After 2 years, the cellular era started in Europe. The two popular analog systems at that time used for mobile communication were Nordic mobile telephone & total access communication system. After that, many other analog systems had been introduced. These systems offered handover and roaming capabilities but were unable to provide roaming services across different countries. This accounted as more prominent disadvantage of first generation mobile communication system. This system was allocated with bandwidth of 40 MHZ within the frequency range of 800-900 MHZ by federal communication commission (FCC) [2].
Transcript of Correlation Between Network KPIs and User Experience of ...

Innovative Systems Design and Engineering www.iiste.org
ISSN 2222-1727 (Paper) ISSN 2222-2871 (Online)
Vol.8, No.3, 2017
1
Correlation Between Network KPIs and User Experience of GSM
Networks in Pakistan
Javed Akhtar Khan, Dr. Irfan Zafar
Institute of Communication Technologies, Islamabad, UET Peshawar
Abstract
Pakistan’s Cellular communication industry is now shaping up and companies are now focusing on user
experience to retain customers and monetize on products and services offered. Changes in cellular
communication landscape and tough competition due to price war and heavy taxation, profit margin is
decreasing and hence reducing tariffs for products and services. Operators are now opting for solid network
performance and developing new models while keeping quality of services intact. User Experience and Network
Key Performance Indications (KPIs) reflects the gap which needs to be filled by offering smart solutions and
adapting to customer centric approach. This study attempted to analyze the impact on user experience due to
network KPIs considering the variables (1) Understanding of Network and Performance (2) Understanding User
Experience (3) Lack of use of reporting tools and best practices (4) Coordination between different teams (5)
Customer experience feedback. In this research work, a comprehensive model is developed using which User
experience can be enhanced with existing and new tools together.
Keywords: Telecommunications, KPIs, Network performance, User experience
1. INTRODUCTION
Cellular communication revolutionized the way people communicate by providing mobility and seamless
connectivity. In short time, momentous progress has been achieved in the history of wireless communication.
Cellular communication is now leaping beyond Fourth generation (4G)as shown in table 1.Aimed at
performance and efficiency in mobile environment wireless technology has followed different evolutionary paths.
First Generation has fulfilled the demand of mobile voice and later Second generation has built capacity and
coverage [1]. 2G followed by 3G which brought the facility of data at higher speed which opened new avenues
in mobile broadband which is now realized by Fourth generation (4G). Current advancement in 4G has now
enabled users with near 150 Mbps of broadband speed with virtue of new technologies available across industry.
This research and further advancements enabled users with bandwidth hungry application like video conference
and streaming while being mobile. [3]
Pakistan has built up a focused and dynamic business sector which allowed a cell operator to investigate
increasingly and conveyance to end user. In 2004, about 5 million subscribers hopped to 100 million in 2010.
Voice quality has been the principle center of cell organizations however now center is likewise towards
information and worth included administrations. Pakistan cell administrators give minimal effort portable
association however exceptionally intense rivalry among various organizations [1].
First generation cellular communication used analog transmission for voice. In 1979, Nippon telephone
and telegraph (NTT) first started cellular system in Tokyo, Japan. After 2 years, the cellular era started in Europe.
The two popular analog systems at that time used for mobile communication were Nordic mobile telephone &
total access communication system. After that, many other analog systems had been introduced. These systems
offered handover and roaming capabilities but were unable to provide roaming services across different countries.
This accounted as more prominent disadvantage of first generation mobile communication system. This system
was allocated with bandwidth of 40 MHZ within the frequency range of 800-900 MHZ by federal
communication commission (FCC) [2].

Innovative Systems Design and Engineering www.iiste.org
ISSN 2222-1727 (Paper) ISSN 2222-2871 (Online)
Vol.8, No.3, 2017
2
Table 1 Summary of generations (1G to 4G)
Comparing first generation systems with second generation cellular communication, time division
multiple access (TDMA) and code division multiple access (CDMA) were introduced. It also used wider
spectrum band, packet data services and roaming facilities. This led to more advancement in 2G and often called
2.5G systems which are capable of handling packet data.
In second generation there are three line of development in US. In 1991, the first digital system was
introduced which was named as IS-54 (NA TDMA digital mobile system) and new additional version was
named as IS-136 introduced in 1996 and meanwhile now IS-95(CDMA one) was introduced in 1993.The FCC
auctioned a spectrum of GSM 1900MHZ to enter market. [4]
Along with Value added services, intelligent service also played important role in cellular networks,
which gave advantage to operators to create new services. General Packet Radio service technology for GSM
which adds packet-switching data protocols creates possibility to charge the user according to amount of payload
sent and received. GPRS is the necessary step toward third generation systems and provide basis for future
communication. The need of GSM and enhance services like EDGE is to provide higher data rates. This was
done by using most specialized coding schemes. In 2G for SMS communication it supports lower data rate
wireless application and 2G system also support CS (voice) services similar to dial-up connection and later it
also evolved to packet switch data services [3,5]
International telecommunication union (ITU) played important role in setting standards for Third
Generation networks with IMT-2000. 3G standardization work was further define and documented by
organization called 3rd
generation partnership project (3GPP) that used and supported IMT-2000 standards. In
Europe it was called as Universal Mobile Telecommunication System (UMTS) which is headed and driven by
ETSI. ITU-T called it IMT-2000 and US 3G variant named it CDMA 2000. UMTS uses WCDMA as air
interface for UMTS and its architecture is split into Node B, RNC, Serving and Gateway GPRS support nodes
(SGSN, GGSN). 3G offers high speed data services by efficient utilization of spectrum. This also provided
higher systems capacity in terms of network infrastructure deployment. Further technological improvements
resulted in HSPA data transmission capabilities and added features. HSPA & HSPA+ support up to 21 Mbps on
downlink and 5.8mbps on uplink. [5].
ETSI developed 3G system for IMT-2000 as shown in figure 1 which is based on GSM. In 1998, as it
went globally the 3GPP was formed with the collaboration of six telecommunication standards from around the
world to continue the development of UMTS and other standards of GSM[7].

Innovative Systems Design and Engineering www.iiste.org
ISSN 2222-1727 (Paper) ISSN 2222-2871 (Online)
Vol.8, No.3, 2017
3
Figure 1 IMT-2000 Umbrella
Important objective of Third Generation (3G) communication system was to provide protocols and
platforms those can further enhance the cellular networks users’ experience. On the other side 4G structure is
established and polish to new level of user experience and also adding capacity in systems in terms of user
handling and services.
As in 4G different access technologies and their variants are available, they also differ in user
experience and throughput across different regions. Further is being done to improve 4G services. The main
objectives of fourth generation network can be stated as:
• Ubiquitous (Universal)
• Multi-service platform
• Low per MB cost
The Ubiquity supplement important factors that services offered by 4G will be available to everyone so
that they can achieve their mobility and broadband objectives followed by wide coverage. It also means that 4G
standards to be adopted globally to be universal access technology shown in figure 2. Services implemented
should be according that needs to be communicate. [9]
The new essential property is to provide multi service to new mobile generation to give
telecommunication operators access to new levels of traffic. low bit cost is also an essentials where high volume
of data are being transmitted .To achieve the nominated goals a vast network must be created to distribute
various radio access technologies and it must provide a high bandwidth 50-100 Mbps for high mobility and 1
Gbps for low mobility.
Figure 2 Fourth generation required framework [11]
LTE-advance IMT standard will advance to new era of cellular and mobile communication as per ITU-
R. It offers a platform on basis of which next generations of mobile services to be built so that it can give higher
data rates, enhance roaming services/capabilities and broadband multimedia[11][12].
Pakistan Cellular industry grown exponentially and added approx. 11 million subscriber by end of
December 2015. Subscriber growth is still a basic indicator of economic measures towards awareness and
cellular facilities being daily need of people of Pakistan.
Table 2 shows total number of cellular subscribers in Pakistan. Cellular subscriber’s growth is evident
below and exponential. Number correction was done by PTA to block SIM which were not verified via
biometric verification.

Innovative Systems Design and Engineering www.iiste.org
ISSN 2222-1727 (Paper) ISSN 2222-2871 (Online)
Vol.8, No.3, 2017
4
Table 2 cellular subscribers in Pakistan
Cellular networks KPI are benchmarked by PTA on regular basis to ensure that services provided by
operators are up to the mark. User experience is being gauged by PTA from such testing and also checked
against cellar operator’s license agreements.
Looking at the exponential growth of Pakistan’s Cellular industry and tough competition it carries in the
result there is strong need for addressing user experience challenges. Operators need to work and build more
efficient ways to know how well their services being perceived by end user.
This paper looks at the research problem along with discussing the aims and objectives of the research
in the light of the selected parameters of Cost Reduction, Organizational Performance, Flexibility, Employee
Performance, Access to Specialized Skills & Technology and the Outsourcing Risks.
1.1 Research Problem
Traditional network KPIs are not reflecting user experience in era of competition. Telecom market which is
nearly saturated is facing competition due to ongoing price war for their products and services. Cellular networks
need to gauge user experience with more diverse KPI model and hence transform KPIs to KQIs. KPIs are
measured in following fashion with leads to less customer centric approach
1. Most of the KPIs reflect network performance in terms of capacity and service availability.
2. Users may be suffering and may not be getting perfect services and products
3. KPI does not offer user level performance of the network
1.2 Research Objective
• To develop correlation Network KPIs and User Experience
• Transforming KPIs to KQI for better network performance analysis
• Developing understanding and model network KPI
1.3 Research Methodology
The study involves work on importance of user experience in comparison to existing KPI models followed by
staff of cellular networks of Pakistan. A questionnaire will be distributed among relevant teams. Further to
enhance study in this area few interviews will be conducted from these teams in field of Telecommunication.
Secondary data sources will include book, published paper in journals & telecommunication standards
bodies like 3GPP, TM Forum [6][7][8].
The study involves work on both primary and secondary data resources in which questionnaire will be
distributed to the related project teams working in multinational organizations. It findings will further be
strengthened by conducting few interviews targeting audience in the field of Telecomm. Secondary data
resources will include books, periodicals, published papers in journals and internet. Non-probability sampling
design technique will be used in this research which will be followed by 250 samples from locals and virtual
team members from Pakistani and international employees of multinational organizations. The collected data
will be run through the available tool of statistical package for the social sciences (known widely as SPSS)
software to evaluate the results and compare them with initial hypothesis that were built on the theatrical
framework.
This research will be based upon the architecture and terminology developed over the last years by
Tele-Management Forum. It is distinguished between service/product-oriented Key Quality Indicators (KQIs)
and technically oriented Key Performance Indicators (KPIs). The KQIs are dedicated to describing quality of an
end-to-end service in parameters that may be directly experienced by an end user, while the KPIs are
characterizing purely technical properties in the various parts of the network. This double definition enables
precise descriptions/quantifications of both aspects independent of each other. However, defining the
relationship between the two for a set of real-world KPIs and KQIs is a very challenging task.A frequently
referred figure showing the relationship between KPIs and KQIs is shown in figure 3.
It depicts that from physical network elements (bottom), technical service properties will exist that may
be defined and structured into a set of KPIs. These will strongly influence the customer service experience,
Year Mobilink Ufone CMPak Telenor Warid Total
2009 32,202,548 19,549,100 6,704,288 23,798,221 16,931,687 99,185,844
2010-11 33,378,161 20,533,787 10,927,693 26,667,079 17,387,798 108,894,518
2011-12 35,953,434 23,897,261 16,836,983 29,963,722 13,499,835 120,151,235
2012-13 37,121,871 24,547,986 21,177,156 32,183,920 12,706,353 127,737,286
2013-14 38,768,346 24,352,717 27,197,048 36,571,820 13,084,823 139,974,754
2014-15 33,424,268 17,809,315 22,102,968 31,491,263 9,830,620 114,658,434
Dec-15 36,211,426 19,931,821 24,133,283 34,928,330 10,694,778 125,899,638
Annual Cellular Subscribers

Innovative Systems Design and Engineering www.iiste.org
ISSN 2222-1727 (Paper) ISSN 2222-2871 (Online)
Vol.8, No.3, 2017
5
characterized by a set of KQIs. But due to the difference in nature between technology and human perception, it
is very unlikely that this will be a one-to-one mapping, but rather a many-to-many transition as indicated from
the green to the blue boxes in the figure 3. Finally, a native service is not necessarily what is needed for a
relevant series of products to the market. So, a similar transition from the blue boxes to the orange boxes must be
taken into account.
Figure 3 : KQI – KPI – network element relationship [13]
For this report, the “green-blue transition” is surely essential. Product packaging, however, is outside
the scope of this report, so the “blue-orange transition” will not be treated further here.
1.4 Requirements on end-to-end service KQIs
The set of KQIs that describe the quality of service delivery as perceived by end users must be thoroughly
defined and easily understood also for high level managers and non-engineers. Below we list some important
properties we believe the end-to-end service KQIs should have:
• The KQIs must reflect aspects that are important for end-users perception of quality during service
usage
• The KQIs must be technical and measure objective performance parameters, i.e. they should not be
such that users must take part in the measurement loop.
• The KQIs should cover service quality over the network parts we can control, i.e. the KQIs should not
depend on measurements or/and performance of third party or transiting networks.
• KQIs should be network-agnostic, i.e. KQI names and objectives (what we want them to reflect) should
be the same for all type of network technologies. However, measurement procedures and target values
of the KQIs may be different for different technologies and BUs.
• The set of KQIs should be limited and easy to understand, and non-engineers should be able to
understand what the KQIs shows.
• KQI definitions must be stable over time in order to follow up service quality over time, meaning
o the KQI names and objectives should remain the same
The KQI definitions should if possible not depend on technology details, i.e. any variations in network
service implementation should to the least possible extent affect the KQI definitions. However, at a certain level
of detail such variations will probably affect how the KQIs are produced from KPIs, measurements and counters
[9] [10].
Innovative Systems Design and Engineering www.iiste.org
ISSN 2222-1727 (Paper) ISSN 2222-2871 (Online)
Vol.8, No.3, 2017
6
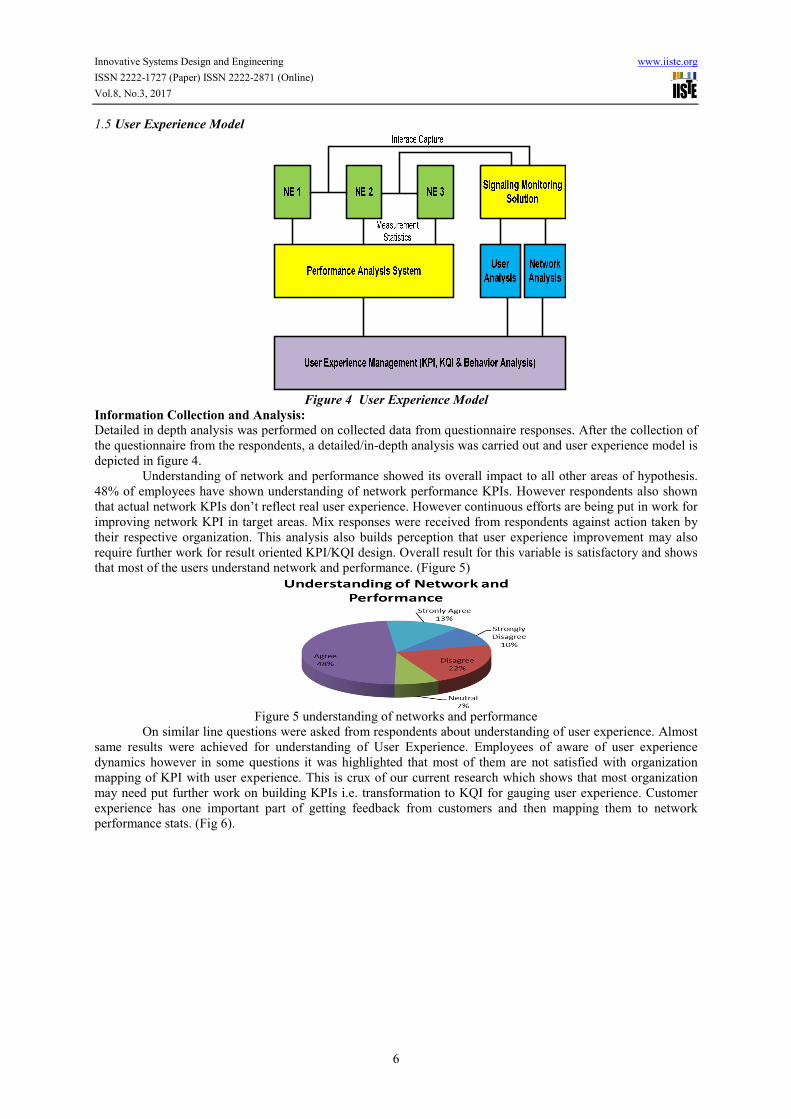
1.5 User Experience Model
Figure 4 User Experience Model
Information Collection and Analysis: Detailed in depth analysis was performed on collected data from questionnaire responses. After the collection of
the questionnaire from the respondents, a detailed/in-depth analysis was carried out and user experience model is
depicted in figure 4.
Understanding of network and performance showed its overall impact to all other areas of hypothesis.
48% of employees have shown understanding of network performance KPIs. However respondents also shown
that actual network KPIs don’t reflect real user experience. However continuous efforts are being put in work for
improving network KPI in target areas. Mix responses were received from respondents against action taken by
their respective organization. This analysis also builds perception that user experience improvement may also
require further work for result oriented KPI/KQI design. Overall result for this variable is satisfactory and shows
that most of the users understand network and performance. (Figure 5)
Figure 5 understanding of networks and performance
On similar line questions were asked from respondents about understanding of user experience. Almost
same results were achieved for understanding of User Experience. Employees of aware of user experience
dynamics however in some questions it was highlighted that most of them are not satisfied with organization
mapping of KPI with user experience. This is crux of our current research which shows that most organization
may need put further work on building KPIs i.e. transformation to KQI for gauging user experience. Customer
experience has one important part of getting feedback from customers and then mapping them to network
performance stats. (Fig 6).

Innovative Systems Design and Engineering www.iiste.org
ISSN 2222-1727 (Paper) ISSN 2222-2871 (Online)
Vol.8, No.3, 2017
7
Figure 6 understanding of user experience
In another question regarding lack of use of reporting tools and best practices responded negatively.
That shows that much better performance & user experience tools are available in global market and can be
adopted to improve user experience. 61% respondents didn’t agreed that use of right reporting tools and adopting
best practices and studies available in the market can significantly improve user experience.
Only 33% of respondents agreed that right tools and best practices are being used which somehow
shows that they still rely on existing infrastructure and tools. This percentage is easily overshadowed by
disagreeing respondents for more diverse method of gauging and improving user experience.(Figure7).
Figure 7 lack of use of reporting tools
Lack of coordination between different team is one of the important factors which are primary
consideration for knowing how certain problem is tackled in within teams. User experience management requires
strong coordination between different cross functional teams. Mostly user experience is gauged on every level of
the network. For cellular network in consideration we need to put focus on end to end network layers i.e. Radio
Network/Access network, Core network and moving further towards underlying IP backbone. 59% respondents
disagreed to face that strong coordination exist between different cross functional domains. These statistics
shows that more focus is required in building standard operating procedures (SOPs) to improve coordination
followed by strong service level agreements (SLAs)(Fig 8).
Figure 8 Lack of coordination between different team
Customer experience feedback, which is basis of net promoter scores in modern organizations. There is
strong belief among telcos that positive promoters are future of organization. User experience among different
users is word of mouth and hence can be an effective tool of marketing and attracting new users. One of the main
question that is asked customer experience surveys is that how likely a customer is going to recommend your
network to their friends and family? Customers are asked respond from 0-10; 0 for least likely and 10 for most
likely.

Innovative Systems Design and Engineering www.iiste.org
ISSN 2222-1727 (Paper) ISSN 2222-2871 (Online)
Vol.8, No.3, 2017
8
62% user agree to customer experience feedback which shows that market is moving towards passively
gauging user experience. This helps telcos in improving their services in target areas where high revenue users
exist. Further resolving customer queries also help in making users more loyal to the network.
Figure 9 Customer experience feedback
Overall analysis of the questionnaire responses show that 37% respondents agree that user experience
and network KPI completely correlate along with 12% strongly agreeing. This however does not depict that
overall user experience improves while improving the KPIs. More room is available for operators to bring their
user experience up-to the mark. Also with 9% strongly disagreeing we can safely build assumption that networks
needs to be more dynamic in approach towards user experience to get benefits. (Fig 10)
Figure 10 overall analysis
1.6 Conclusion
- Collected data and relevant study shows that Cellular networks in Pakistan need to put more effort in
achieving excellent user experience. This implies that organizations should invest in the development of
their employees where they have excellent knowledge of Network and performance KPI. Key
performance indicator and key quality indicators are first steps towards improving user experience.
However as stated earlier in Chapter 3 KPIs alone cannot serve the purpose and hence we need more
diversity in achieving our goals. Organizations need to setup dedicated teams for reporting of KPIs and
KQIs of the network and also gauge user experience by using newly available tools and method.
- We can see in our collected data that some of organizations may have reporting and diagnostic tools but
still missing on User experience front. That’s mostly because of the reason that action is not taken
against the problems identified in right direction. So we need to work on following to important items
o Service Level Agreements
Identification of problem is to be logged and assigned to certain cross functional team. This
enables employees to better coordinate and time bound problem resolution activities. Strict
SLAs also ensure that problem is quickly resolved by front desk teams who need strong
coordination with each other specially in translating the problem user is actually face.
o Standard Operating Procedures
SOPs in any organizations are very important factor and requires swift implementations. Work
processes needs to be improved and any change must be carried out in document way i.e.
defined Standard Operating Procedures. In cellular networks SOPs are defined in handling any
problem or new change which involves multiple teams/ departments.
- Measurement tools and methods are categorized into active and passive methods. Active methods are

Innovative Systems Design and Engineering www.iiste.org
ISSN 2222-1727 (Paper) ISSN 2222-2871 (Online)
Vol.8, No.3, 2017
9
executed by injecting certain traffic into test systems placed in specialized environment. Following are
passive monitoring systems
o Interface monitoring (signaling messages and data packets)
o Network Element measurements (counters, timers, alarms, etc)
o End Terminal Measurements (e.g. Mobile Service Intelligence - MSI)
Our focus is on using passive monitoring systems and below are few techniques/tools that can be used
o Signaling Monitoring Systems
Signaling monitoring systems are required to monitor interface traffic. However interfaces
traffic consists of both user and control plane traffic. For analysis we devise two different
channels for measuring user experience. Signaling monitoring systems produce very valuable
data sources for mobile operators, enabling a wide range of different applications. They
operate by having signaling monitoring probes placed throughout the network at access and
core network interfaces. The probes data can be further processed and stored in Big Data
environment for Business intelligence and analytics.
Signaling monitoring systems are able to provide a complete picture of what is going on inside
the mobile network, correlating information about users, time, services, network elements,
quality etc. They are well-suited for measuring service quality at a granularity ranging from all
subscribers down to the individual users, calls, or base stations. Other advantages are
troubleshooting and drill-down capabilities on network elements and subscribers. However,
unless signaling monitoring probes are placed in phones, they cannot fully capture the
coverage part.
• User Analytics – This type of traffic is to be used for user plane traffic. For example
we can gauge user experience based on application/services being used by subscriber.
This will also help cellular companies to monetize their network resources based on
user interest along with the experience they get for certain service/application. TCP
success rate, response time, delay and other similar data traffic indicators can be
extracted to understand user behavior. These systems are now called as User Behavior
Analysis tools.
• Network Analytics–Network analytics are important in knowing user experience in
terms of network. Such analytics will become very helpful in troubleshooting problem
faced by users. These network analytics tools must have Signaling trace, data record
queries and multi-dimensional queries. Multidimensional queries can be Access point
being used, location, handset/device, Make, Operating system and model of the
device etc.
o Performance Management Systems
Performance Management systems are specially designed for accumulating statistical data
from different network elements. This data can be utilized in building end to end network KPIs
and KQIs. When gathering measurement data as a basis for computing related KPIs/KQIs, we
frequently need input from several measurement techniques. Signaling Monitoring System
o Drive test systems
The drive testing has been most relevant methods of measuring user experience. Drive test
systems will help identify areas of high mobile penetration as well as any areas that may be
lacking coverage or capacity. Also any problems related to the radio network or handover may
be detected. This system will also enable us to view our own and our competitors' mobile voice
and data services from the perspective of the subscriber by providing critical quality-of-service
(QoS) measurements and true dual-mode operation.
Types of drive tests:
• Indicative sample tests using (high-end) ordinary consumer handsets
• More comprehensive tests complementing handsets with proper instrumentation like
network scanners, which are able to fully characterize the mobile wireless interface
o Mobile Service Intelligence (MSI)
MSI is a new method and thus has not been extendedly put in use by most cellular operators.
However, with regards to future broadband utilization and its related user experience we
include MSI as a potential method for broadband user experience tool.
This is a process of analyzing data received from the handsets and devices providing insight
into mobile service quality and thus measuring user experience and behavior. MSI equipment
normally consists of a server for handling the measured data, and a SW client (or a piece of
HW e.g. dongles) implemented in the handsets. The server contains a smart database which
receives raw data from mobile devices and converts them into reliable and repeatable measures

Innovative Systems Design and Engineering www.iiste.org
ISSN 2222-1727 (Paper) ISSN 2222-2871 (Online)
Vol.8, No.3, 2017
10
which feed into analytic applications. This equipment is capable to process data submitted by
millions of handsets with outstanding integrity and security.
- Key Quality Indicators are transformed version of Key performance indicators and hence are important
element of this research. Below are the suggested KQIs
o Accessibility is measure of network resource availability to end customer through which
he/she can setup a connection to the network. For example in case of data services a
device/handset must be able to establish network connection though means of Packet Data
Protocol (PDP) session
o Retainability is measure of network’s retention of active user session. In case of Mobile
broadband Data services a session should be retained by network until the user himself
teardown a session or user related cause generated by network terminate the session.
o Setup Time is measure of time taken by network to establish a network connection. Service or
session setup time counter end when session is successfully established before transmitting or
receiving any data.
o Service Throughput is measure of amount of data transmitted or received to/from user.
Throughput is important factor in terms of user requirement and hence minimum possible
value should be achieved. That also reflect the bandwidth available to user for using certain
standard applications
o Service Responsiveness is to measure how quickly network serves user request. For example
a user requesting resource from internet and the time it takes to furnish that data to user.
References
[1] Daryl Scholar, Principal Analyst, Ovum Study of “Quality Mobile Broadband Network” (2015).
[2] J.D. Power Ratings, “Strong Network Quality Performance Is Key to Higher Customer Retention for
Wireless Carriers”, 2015.
[3] Amit Kumar; Dr. Yunfei Liu, Dr. Jyotsna Sengupta, Divya,” Evolution of Mobile Wireless Communication
Networks: 1G to 4G”, Vol. 1, Issue 1, IJECT 2014.
[4] Chen, Yuen “Soft Handover Issues in Radio Resource Management for 3G WCDMA Networks”, Queen
Mary, University of London www.elec.qmul.ac.uk/research/thesis/YueChen2013.pdf ,2013
[5] Tom, C. K. “Ad Hoc Mobile Wireless Networks: Protocols and Systems”, Prentice Hall, New Jersey, USA,
PP 20-25,5th
edition, 2015.
[6] Mishra, Ajay K. “Fundamentals of Cellular Network Planning and Optimization, 2G/2.5G/3G…Evolution
of 4G”, John Wiley and Sons, 2014.
[7] UMTS World (2009). “UMTS / 3G History and Future Milestones”, [Online] Available:
http://www.umtsworld.com/umts/history.html , 2013.
[8] 3G Americas. List of 3G deployments worldwide. www.3gamericas.org
[9] Schiller, J., “Mobile Communications”, slides http://www.jochenschiller.de/
[10] Tachikawa, Keiji, “A perspective on the Evolution of Mobile Communications”, IEEE Communications
ssMagazine, pp. 66-73, October 2015.
[11] Pereira, Vasco & Sousa, Tiago. “Evolution of Mobile Communications: from 1G to 4G”, Department of
Informatics Engineering of the University of Coimbra, Portugal, Nov 2014.
[12] Kamarularifin Abd Jalil, Mohd Hanafi Abd. Latif, Mohamad Noorman Masrek, “Looking Into The 4G
Features”, MASAUM Journal of Basic and Applied Sciences Vol.1, No. 2 September 2013.
[13] ITU (2015). “ITU Paves the Way for Next-Generation 4G Mobile Broadband
Technologies”.[Online]http://www.itu.int/net/pressoffice/press_releases/2015/40


![Mainstreaming of IPoA Bhutan Experience 1[2] - Copy Documents/Workshop/Bhutan...Mainstreaming of IPoA with ... Key Performance Indicators (KPIs) –16 NKRAs and 2-3 KPIs for each result](https://static.fdocuments.in/doc/165x107/5aa0e5077f8b9a71178ed52f/mainstreaming-of-ipoa-bhutan-experience-12-documentsworkshopbhutanmainstreaming.jpg)