CORRADO BONI - Cipomo · CORRADO BONI . Colon Cancer: setting the scene . P=0.0001 OS improves with...
73
La valorizzazione dei benefici per il paziente con l’introduzione dei nuovi farmaci: Carcinoma del Colon CORRADO BONI
Transcript of CORRADO BONI - Cipomo · CORRADO BONI . Colon Cancer: setting the scene . P=0.0001 OS improves with...

La valorizzazione dei benefici per il paziente con
l’introduzione dei nuovi farmaci: Carcinoma del Colon
CORRADO BONI

Colon Cancer: setting the scene

P=0.0001
OS improves with the exposure to 3 cytotoxics
Grothey et al. JCO ‘05

1st line
2nd line
3rd line
The proportion of patients
receiving therapy diminishes
with subsequent lines

Biologici nel MCRC
Anti Angiogenici
1° Linea
Mantenimento
Beyond progression
2° Linea e oltre
Anti EGFR
1° Linea
2° Linea e oltre

Anti Angiogenici
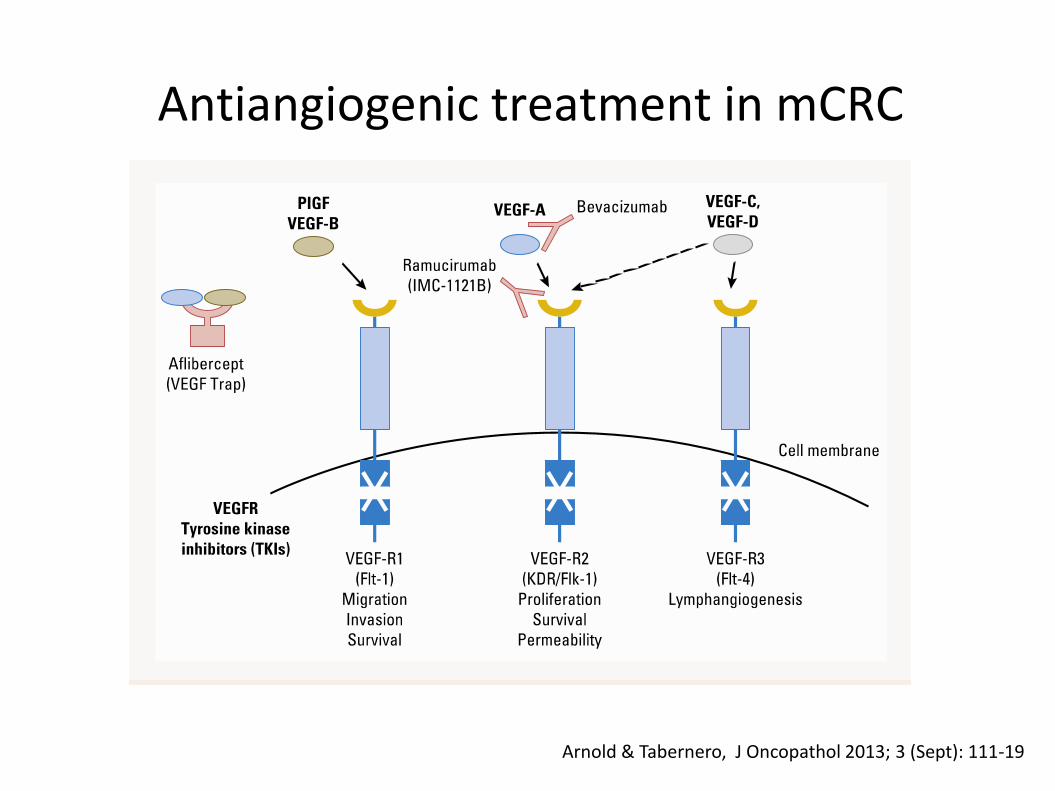
Antiangiogenic treatment in mCRC
Arnold & Tabernero, J Oncopathol 2013; 3 (Sept): 111-19

Prima Linea


Treatment duration and PFS in AVF2107 vs NO16966
Treatment duration
PFS
Placebo
Bevacizumab
Placebo Bevacizumab
Placebo
Bevacizumab
Placebo
Bevacizumab
AV
F2
10
71
N
O1
69
66
2
Treatment duration
PFS
Months
+ 2.8
+ 4.4
+/- 0
+ 1.4
Months
0 2 4 6 8 10 12
0 2 4 6 8 10 12
NO16966 median treatment duration:
• Bevacizumab + XELOX
• Placebo + XELOX
• Bevacizumab + FOLFOX-4
• Placebo + FOLFOX-4
6.1 m
5.4 m
6.3 m
6.0 m

NO16966: Fluoropirimidina + Oxa + Beva FOLFOX/XELOX vs FOLFOX/XELOX+Beva in first line:
NO16966
Saltz et al, ASCO GI ‘07
ITT: HR: 0.83, p=0.0023
On-treatment HR: 0.63, p<0.0001
On-treatment PFS: 10.4 vs 7.9 months
∆ +2.5

Efficacy of FOLFIRI + Bevacizumab in the treatment of 1st line mCRC
FOLFIRI + bevacizumab
Hellenic COG
Pectasides
20121
FNCLCC/
ACCORD
Ducreux
20132
TRIBE
Falcone 20133
FIRE-3*
20134
n 142 73 256 295
ORR (ITT), % 40.1 59 53.0 58
PFS, mo 10.8 9 9.7 10.3
OS, mo 25.3 23 25.8 25.0
1. Pectasides D, et al BMC Cancer 2012;12:271–281; 2. Ducreux M, et al. EJC 201;49:1236–1245;
3. Falcone A, et al. ASCO 2013 (Abstract No. 3505);
4. Heinemann V, et al. ASCO 2013 (Abstract No. LBA3506
* Pts with KRAS wt tumors

FOLFIRI
122 pts
FOLFOXIRI
122 pts P value
Confirmed RR 34% 60% <0.0001
R0 surgery (all) 6% 15% 0.033
R0 surgery (liver) 12% 36% 0.017
mPFS (mos) 6.9 9.9 0.0009
mOS (mos) 16.7 23.6 0.042
Falcone A et al. JCO 2007 and ASCO 2007
FOLFOXIRI vs FOLFIRI: Activity and Efficacy

TRIBE trial
R 1:1
508 pts1st line
unresectable
mCRC pts
stratified by
ü center
ü PS 0/1-2
ü adjuvant CT
FOLFIRI + bev*
FOLFOXIRI + bev*
• Bev 5 mg/kg ev g1
• Irinotecan 180 mg/sqm ev g1
• L-LED 200 mg/sqm ev g1
• 5-FU 400 mg/sqm ev g1 bolus
• 5-FU 2400 mg/sqm ev gg1 3
• Bev 5 mg/kg ev g1
• Irinotecan 165 mg/sqm ev g1
• Oxaliplatin 85 mg/sqm ev g1
• L-LED 200 mg/sqm ev g1
• 5-FU 3200 mg/sqm ev gg1 3
*both repeated every 2 wks for a max of 12 cycles followed by maintenance with 5FU/bev until PD
Primary endpoint: PFS
Loupakis et al. ASCO-GI 2013

Median follow up: 26.6 mos
FOLFIRI + bev: N = 256 / Progressed = 225 FOLFOXIRI + bev: N = 252 / Progressed = 199
FOLFIRI + bev, median PFS : 9.7 mos FOLFOXIRI + bev, median PFS : 12.2 mos
Unstratified HR: 0.73 [0.60-0.88]
p = 0.0012
Stratified HR: 0.71 [0.59-0.86] p=0.0006
Primary endpoint: PFS – ITT population P
rog
ressio
n-f
ree s
urv
ival pro
babili
ty
F-up time (months)
FOLFIRI + bev
FOLFOXIRI + bev
PD-free rate at 2 years:
11.4% vs 20.3%
Loupakis et al. ASCO-GI 2013

Secondary endpoint: Response Rate (ITT population)
Best Response, %
FOLFIRI + bev
N = 256
FOLFOXIRI + bev
N = 252 p
Complete Response 3% 4%
Partial Response 50% 61%
Response Rate 53% 65% 0.006
Stable Disease 32% 24%
Progressive
Disease 5% 2%
Not Assessed 10% 9%
Loupakis et al. ASCO-GI 2013

Secondary endpoint: OS (preliminary) – ITT population
FOLFIRI/bev 256 233 216 172 109 69 36 15 5 0
FOLFOXIRI/bev 252 234 205 175 119 70 35 15 4 0
Ove
rall
su
rviv
al
pro
bab
ilit
y
F-up time (months)
FOLFIRI + bev
FOLFOXIRI + bev
Median follow up: 32.3 mos
FOLFIRI + bev: N = 256 / Died = 155
FOLFOXIRI + bev: N = 252 / Died = 131
FOLFIRI + bev, median OS : 25.8 mos
FOLFOXIRI + bev, median OS : 31.0 mos
Unstratified HR: 0.83 [0.66-1.05]
p=0.125
Stratified HR: 0.79 [0.63-1.00]
p=0.054

AVEX - Study design
Previously untreated mCRC, age >70 years N=280
Capecitabine 1000 mg/m2 b.i.d. days 1–14, q21d
Capecitabine 1000 mg/m2 b.i.d. days 1–14, q21d
+ Bevacizumab 7.5 mg/kg day 1, q21d
Randomize 1:1
Stratification factors:
– ECOG PS (0–1 vs 2)
– Geographic region
• Key inclusion criteria
– ECOG PS 0–2
– Prior adjuvant chemotherapy allowed if completed >6 month before inclusion
– Not optimal candidates for a combination chemotherapy with irinotecan or oxaliplatin
• Key exclusion criteria
– Prior chemotherapy for mCRC or prior adjuvant anti-VEGF treatment
– Clinically significant cardiovascular disease
– Current or recent use of aspirin (>325 mg/day) or other NSAID
– Use of full-dose anticoagulants or thrombolytic agents Cunningham ASCO-GI 2013

Progression-free survival P
FS
estim
ate
1.0
0.8
0.6
0.4
0.2
0.0
0 2 4 6 8 10 12 14 16 18 20 22 24 26 28 30 32 34 36 38 40
Number at risk
Cape + BEV
Cape
140 121 99 80 68 55 41 28 23 16 13 9 8 3 2 2 2 2 1 0 0
140 109 82 56 38 25 13 9 6 4 4 2 1 1 1 1 1 1 1 1 0
Time (months)
Cape + BEV (n=140)
Cape (n=140)
5.1 mo 9.1 mo
HR=0.53 (95% CI: 0.41–0.69)
p < 0.001
ITT population. 113 PFS events in the Cape + BEV arm; 127 PFS events in the Cape arm. CI = confidence interval; PFS = progression-free survival
Cunningham ASCO-GI 2013

Overall survival
1.0
0.8
0.6
0.4
0.2
0.0
0 2 4 6 8 10 12 14 16 18 20 22 24 26 28 30 32 34 36 38 40 42 44 46
Number at risk Cape + BEV
Cape
140 126 120 106 95 89 81 67 60 51 44 40 34 24 16 15 12 10 8 6 5 4
140 120 108 94 85 73 62 57 49 37 33 23 19 13 11 10 9 7 6 5 5 3
OS
estim
ate
Time (months)
2
1
0
0
16.8 mo 20.7 mo
HR=0.79 (95% CI: 0.57–1.09)
p = 0.182
Cape + BEV (n=140)
Cape (n=140)
ITT population. 75 OS events in each treatment arm. Cunningham ASCO-GI 2013

Mantenimento

Bevacizumab-based trials focussing on maintenance or bev-based sequence
Study Regimen PFS
(months)
OS
(months)
MACRO1 CAPOX + Bev 10.4 23.4
CAIRO-32 Chemo + Bev 11.8 19.8 + 4.5 ?
SAKK 41/063 Chemo + Bev 9.5 25.1
TML4 Chemo + Bev 23.9 1. Tabernero, et al. ASCO 2010 (Abstract No. 3501); 2. Koopmann M, et al. ASCO 2013 (Abstract No. 3502);
3. Koeberle D, et al. ASCO 2013 (Abstract No. 3503); 4. Bennouna J, et al. Lancet Oncol 2013;14:29–37
Randomized studies: results from most efficacious treatment arms

Xelox+ Bev
N=239 Xelox+ Bev
x 6 cycles Bev
N=241

OS PFS

MACRO conclusions
Although the MACRO study did not meet its primary
endpoint of noninferiority, the results suggest that single-
agent bevacizumab after six cycles of XELOX plus
bevacizumab may be a potential alternative to continued
XELOX plus bevacizumab for patients with mCRC.

Phase III CAIRO-3 Trial: Maintenance Capecitabine + Bev vs Obs in mCRC
Primary endpoint: PFS2
Time from randomization to progression upon reintroduction of CAPOX-B
PFS2 considered equal to PFS1 in patients who do not receive CAPOX-B again
Median follow-up: 40 mos
Patients with
mCRC and SD or
better after 6
cycles CAPOX-B,
WHO PS 0-1
(N = 558)
Observation
(n = 279)
Capecitabine +
Bevacizumab
(n = 279)
PD
Reintroduce
CAPOX-B PD
PFS1 PFS2
OR
Any treatment,
including
CAPOX-B
PD
TT2PD
Koopman M, et al. ASCO 2013. Abstract 3502.

CAIRO-3 Trial of Maint Capecitabine + Bev vs Obs in mCRC: TT2PD and OS Results
Koopman M, et al. ASCO 2013. Abstract 3502. Used with permission.
OS
Pro
ba
bil
ity
Maintenance treatment with capecitabine + bev after 6 cycles CAPOX-B significantly prolongs TT2PD and OS
(95% CI: 13.6-16.4) (95% CI: 18.0-21.9) (95% CI: 0.55-0.81)
TT
2P
D P
rob
ab
ilit
y
Mos
1.0
0.8
0.6
0.4
0.2
0
0 6 12 18 24 30 36
Observation Maintenance Stratified HR P value
15.0 19.8 0.67 < .00001
Adjusted HR: 0.63; p < .001
Median TT2PD, Mos
Maintenance
Observation
Mos
1.0
0.8
0.6
0.4
0.2
0
0 6 12 18 24 30 36
Observation Maintenance Stratified HR P value
18.2 21.7 0.87
.156
Adjusted HR: 0.80; p = .035 (preliminary survival analysis)
Median OS, Mos
Maintenance
Observation
(95% CI: 16.3-20.8) (95% CI: 19.4-24.0) (95% CI: 0.71-1.06)

Phase III SAKK 41/06 Study: Bev vs No Bev After First-line Chemo-Bev in mCRC
Primary endpoint: TTP (measured by CT q6w until PD)
Secondary endpoints: PFS, TTNT, OS, bev-related toxicity,
treatment costs
Patients with mCRC who
received first-line chemo
+ bev for 4-6 mos, have
≥ SD, WHO PS 0-1
(N = 262)
Bev 7.5 mg/kg q3w
(n = 131)
No antitumor treatment
(n = 131)
PD
Koeberle D, et al. ASCO 2013. Abstract 3503. Used with permission.

SAKK 41/06 Study of Bev vs No Bev After First-line Chemo-Bev in mCRC: PFS
Koeberle D, et al. ASCO 2013. Abstract 3503. Used with permission.
Pro
po
rtio
n W
ith
ou
t P
rog
res
sio
n/D
ea
th
1.0
0.8
0.6
0.4
0.2
0
0 6 12 18 24 30 36 42 48
Mos
Bev No bev
No. of events
Median, mos (95% CI)
HR 95% CI
Difference
Bev
125
9.5 (8.6-10.2)
No Bev
124
8.5 (8.0-8.9)
0.75 (0.58-0.96)
p = .021
Pts at Risk, n Bev No bev
131 131
40 18
13 8
6 7
6 4
5 1
3 1
2 0
1 0
54
122 116

SAKK 41/06 Study of Bev vs No Bev After First-line Chemo-Bev in mCRC: OS
Koeberle D, et al. ASCO 2013. Abstract 3503. Used with permission.
Pro
po
rtio
n S
urv
ivin
g
1.0
0.8
0.6
0.4
0.2
0
0 6 12 18 24 30 36 42 48
Mos
Bev No bev
Events, n
Median, mos (95% CI)
HR (95% CI)
Difference
Bev
84
25.1 (22-28.9)
No Bev
84
22.8 (20.3-26.1)
0.83 (0.61-1.12)
p = .218
Pts at Risk, n Bev No bev
131 131
115 107
86 76
52 44
33 25
22 13
10 6
3 1
1 1
54
130 131
60
0 1

Summary
Non-inferiority could not be demonstrated
The difference in median TTP between BEV continuation
versus no treatment after randomization is 5 weeks
Overall survival in both arms is not significantly different
Utility of BEV continuation needs to be balanced
with significantly higher treatment costs

Awaited data from randomized fase III trials

Beyond Progression

Background: Beva Beyond 1st PD “BRiTE trial “
Survival after 1st PD
Grothey et al. ASCO 2007 and JCO 2008
CT+Beva
CT No Treat.
RETROSPECTIVE!!

BEV + standard first-line CT (either oxaliplatin or irinotecan-based) (n=820)
Randomise 1:1
Standard second-line CT (oxaliplatin or irinotecan-based)
until PD
BEV (2.5 mg/kg/wk) + standard second-line CT (oxaliplatin or irinotecan-based)
until PD
PD
ML18147 study design (phase III)
CT switch:
Oxaliplatin → Irinotecan
Irinotecan → Oxaliplatin
Study conducted in 220 centres in Europe and Saudi Arabia
Primary endpoint • Overall survival (OS) from randomisation
Secondary endpoints • Progression-free survival (PFS)
• Best overall response rate
• Safety
Stratification factors • First-line CT (oxaliplatin-based, irinotecan-based)
• First-line PFS (≤9 months, >9 months)
• Time from last BEV dose (≤42 days, >42 days)
• ECOG PS at baseline (0/1, 2)
Arnold et al, ASCO 2012

PFS: ITT population P
FS
estim
ate
Time (months)
1.0
0.8
0.6
0.4
0.2
0
0 6 12 18 24 30 36 42
CT (n=410) BEV + CT (n=409)
4.1 mo 5.7 mo
Unstratifieda HR: 0.68 (95% CI: (0.59–0.78) p<0.0001 (log-rank test)
Stratifiedb HR: 0.67 (95% CI: 0.58–0.78)
p<0.0001 (log-rank test)
Arnold et al, ASCO 2012

OS: ITT population O
S e
stim
ate
Time (months)
1.0
0.8
0.6
0.4
0.2
0
0 6 12 18 24 30 36 42 48
CT (n=410) BEV + CT (n=409)
9.8 mo 11.2 mo
Unstratifieda HR: 0.81 (95% CI: 0.69–0.94)
p=0.0062 (log-rank test)
Stratifiedb HR: 0.83 (95% CI: 0.71–0.97)
p=0.0211 (log-rank test)
Median follow-up: CT, 9.6 months (range 0–45.5); BEV + CT, 11.1 months (range 0.3–44.0)
Arnold et al, ASCO 2012
∆ +1.4

BEBYP: Study Design
B. Second-line CT§+ BV
I-line CT * + BV Stratification
‐ Center
‐ PS 0/1-2
‐ CT-free interval
(> vs ≤ 3 mos)
‐ II-line CT
R A N D O M
• FOLFIRI • FOLFOX • FOLFOXIRI • Fluoropyrimidine mono-tx
* • FOLFIRI
• mFOLFOX-6
§
A. Second-line CT§
• Primary end-point: PFS • Accrual stopped prematurely: 184 pts for ITT
Masi et al. ESMO 2012 Salvatore et al. AIOM 2012

CT (85 events) median PFS = 4.97 mos
CT+ B (87 events) median PFS = 6.77 mos
HR=0.65 (95%CI 0.48-0.89)
p=0.0062
Median follow up 18.0 mos
Primary Objective - PFS
Masi et al. ESMO 2012 Salvatore et al. AIOM 2012

Seconda Linea

Giantonio, et al. JCO 2007
Bevacizumab: 2nd line superior PFS + OS with FOLFOX
PF
S e
sti
ma
te
1.0
0.8
0.6
0.4
0.2
0
Months
0 2 4 6 8 10 12 14 16 18 20 22 24 26
FOLFOX4 + Avastin
FOLFOX4
Ove
rall
su
rviv
al
es
tim
ate
1.0
0.8
0.6
0.4
0.2
0
Months
FOLFOX4 + Avastin
FOLFOX4
0 3 6 9 12 15 18 21 24 27 30 33 36
7.3 4.7 12.9 10.8
OS
10.8 vs 12.9 months
HR=0.75 (p=0.0011)
PFS
4.7 vs 7.3 months
HR=0.61 (p<0.0001)

Van Cutsem et al, JCO 2012
VELOUR: Study Design

Van Cutsem et al, JCO 2012
FOLFIRI vs FOLFIRI+Aflibercept VELOUR study: OS
∆ +1.4

Van Cutsem et al, JCO 2012
Secondary Objectives – PFS and RR

C. J. Allegra et al. J Clin Oncol 30, 2012 (suppl; abstr 3505)
VELOUR-Trial: Results by prior Bev
FOLFIRI
(n=614)
Aflibercept/FOLFIRI
(n=612)
HR
OS
no BEV
(n=853) 12.4 13.9
0.788
prior BEV
(n=373) 11.7 12.5
0.862
PFS
no BEV 5.4 6.9
0.797
Prior BEV 3.9 6.7 0.661
RR
no BEV
Prior BEV
12.4%
8.4 %
23.3%
11.7 %

Regorafenib *
Placebo
• mCRC pts
• Progressed
after standard
therapies
R 2:1
* 160 mg per os once daily,
3 weeks on, one week off.
Primary end-point: OS
N= 690
CORRECT trial – Study design
Stratification by
ü Prior anti-VEGF tx
ü Time to mts disease
ü Geographical region
Van Cutsem et al. ASCO 2012

CORRECT trial - PFS
Van Cutsem et al. ASCO 2012

Correct trial: Primary endpoint OS
Van Cutsem et al. ASCO 2012
∆ +1.4

Anti EGFR


OS nello Studio CRYSTAL in paz. non selezionati per KRAS
Popolazione dello studio CRYSTAL
Time (months)
54 42 48
Cetuximab + FOLFIRI (n=599)
FOLFIRI (n=599)
0.0
0.2
0.4
0.6
0.8
1.0
18 0 6 12 24 30 36
OS
esti
ma
te
HR=0.878
p=0.0419
19.9
18.6
Van Cutsem E, et al. J Clin Oncol 2011;29:2011–2019

CRYSTAL Popolazione KRAS wt
Time (months)
54 42 48
23.5
20.0
0.0
0.2
0.4
0.6
0.8
1.0
18 0 6 12 24 30 36
OS
es
tim
ate
Cetuximab + FOLFIRI (n=316)
FOLFIRI (n=350)
HR=0.796
p=0.0093
Van Cutsem E, et al. J Clin Oncol 2011;29:2011–2019
OS nello Studio CRYSTAL in pazienti KRAS WT

Douillard JY et al, JCO 2010
Enrolled pts: 1183
Randomization stratification:
• ECOG performance status: 0 - 1 vs 2
• Geographic region: Western Europe, Canada, and Australia vs rest of the world
Primary endpoint: PFS
Disease assessment every 8 weeks
The PRIME Study

Douillard JY et al, JCO 2010
The PRIME Study: PFS in WT KRAS pts

Oliner KS et al , ASCO 2013 #3511
KRAS wt exon 2 (60%) KRAS mut exon 2 (40%)
KRAS or NRAS mut
(17%) BRAFmut (8%)
The PRIME Study: KRAS, NRAS and BRAF mutations

Summary of RAS subgroup analyses
RAS wt
~50%
RAS mt
~50%
Stintzing S, et al. ECC 2013 (Abstract No. LBA17);
Tejpar S, et al. ASCO GI 2014 (Abstract No. LBA444); Douillard J-Y, et al. N Engl J Med 2013;369:1023–1034

RAS mutations in mCRC
Phase III Study PRIME (FOLFOX + Panitumumab vs FOLFOX); patients evaluated 90%
Oliner et al, Abstract 3511, ASCO 2013
FOLFOX + Pan
(No. 320)
FOLFOX
(No. 321)
HR p
Douillard, JCO 2010
KRAS wt 23.9
(100%)
19.7 (100%)
0.83 0.72
RAS wt OS (months) 26.0 (81%)
20.2 (79%)
0.78 0.04
RAS m OS (months) 15.6 (85%)
19.2 (86%)
1.25 0.04
RAS/BRAF wt (months) 28.3 (71%)
20.9 (68%)
0.74 0.02
BRAF m (months) 10.5
(8%)
9.2
(9%)
0.90 0.76

PICCOLO (Panitumumab+CPT vs CPT II line): OS according to KRAS/BRAF status
Seymour et al. ASCO ‘11

Schwartzberg, JCO 2014
PEAK: Overall Survival in KRAS Wild Type

Schwartzberg, JCO 2014
PEAK: Overall Survival in all RAS Wild Type

FIRE-3: Head-to-head cetuximab + FOLFIRI vs bevacizumab + FOLFIRI in 1st line mCRC
Heinemann V, et al. ASCO 2013 (Abstract No. LBA3506); Modest D, et al. WCGC 2013 (Abstract No. O-0029);
Stintzing S, et al. ECC 2013 (Abstract No. LBA17); Stintzing S, et al. Ann Oncol 2012;23:1693–1699
Patients with untreated
KRAS (exon 2) wt mCRC
N=592
Open-label, randomized, multicenter Phase III IST
R
Cetuximab + FOLFIRI
Bevacizumab + FOLFIRI
n=297
n=295
● Primary endpoint: ORR
● Secondary endpoints: PFS, OS, TFS, DpR, secondary resection rate, safety
● Amendment in October 2008 to include only patients with KRAS (exon 2)
wt mCRC
● 113 patients with KRAS (exon 2) mt mCRC were enrolled before the amendment
DpR: depth of response; TFS: time to failure of strategy;
IST: investigator-sponsored trial

Primary analysis: Evaluation of ORR (ITT)
ORR
FOLFIRI +
cetuximab
FOLFIRI +
bevacizumab Odds ratio p
% 95% CI % 95% CI
ITT population
(N=592) 62.0 56.2–67.5 58.0 52.1–63.7
1.18
0.85–1.64 0.183
p=one-sided Fisher‘s exact test Heinemann V, et al. ASCO 2013 (Abstract No. LBA3506)

[TITLE]
Presented By Sebastian Stintzing, MD at 2013 ASCO Annual Meeting

[TITLE]
Presented By Sebastian Stintzing, MD at 2013 ASCO Annual Meeting

Subsequent anticancer therapy
FOLFIRI + cetuximab
n=297
FOLFIRI + bevacizumab
n=295 p
Any 2nd line therapy, % 65.7 61.7 0.347
2nd line bevacizumab, % 48.2 17.6
2nd line anti-EGFR, % 14.4 42.9
p=two-sided Fisher‘s exact test Heinemann V, et al. ASCO 2013 (Abstract No. LBA3506)


Head-to-head trials of targeted agents in 1st line mCRC
1. Heinemann V, et al. ASCO 2013 (Abstract No. LBA3506); 2. Naughton MJ, et al. ASCO 2013 (Abstract No. 3611); 3. NCT00265850; 4. Schwartzberg LS, et al. ASCO GI 2013 (Abstract No. 446); 5. Schwartzberg LS, et al. ASCO 2013 (Abstract No. 3631)
FIRE-31
CALGB 804052,3
PEAK4,5
Patients with untreated KRAS wt mCRC
N=592 R
Cetuximab + FOLFIRI
Bev + FOLFIRI
Patients with untreated KRAS wt mCRC
N~1200 (after trial modification)
Cetuximab + FOLFOX/FOLFIRI
Bev + FOLFOX/FOLFIRI
Bev + cetuximab + FOLFOX/FOLFIRI*
*Arm closed to accrual as of 09/10/2009
Patients with untreated KRAS wt mCRC
N=285 R
Pani + mFOLFOX6
Bev + mFOLFOX6
R

Pro
po
rtio
n P
rog
ressio
n F
ree
6 12 21 15 33 39
4.0 mos
16.4% RR
2.6 mos
4.2% RR
Mos
HR: 0.692 (95% CI: 0.617-0.776;
stratified log-rank P ≤ .0001)
Irinotecan + cetuximab (n = 648)
Irinotecan alone (n = 650)
Phase III EPIC Trial: Irinotecan ± Cetuximab in 2nd-line mCRC After Ox-Fp CT Failure
NO DIFFERENCE OS But crossover allowed
Sobrero AF, et al. J Clin Oncol. 2008;26:2311-2319.
1.0
0.8
0.6
0.4
0 0
0.2
3 9 18 30 24 27 36
∆ +1.4

● July 2009–June 2013: 340 patients enrolled for 1st line therapy
● As of January 31 2014, 180 patients had progressed and were randomized to receive ongoing 2nd line therapy
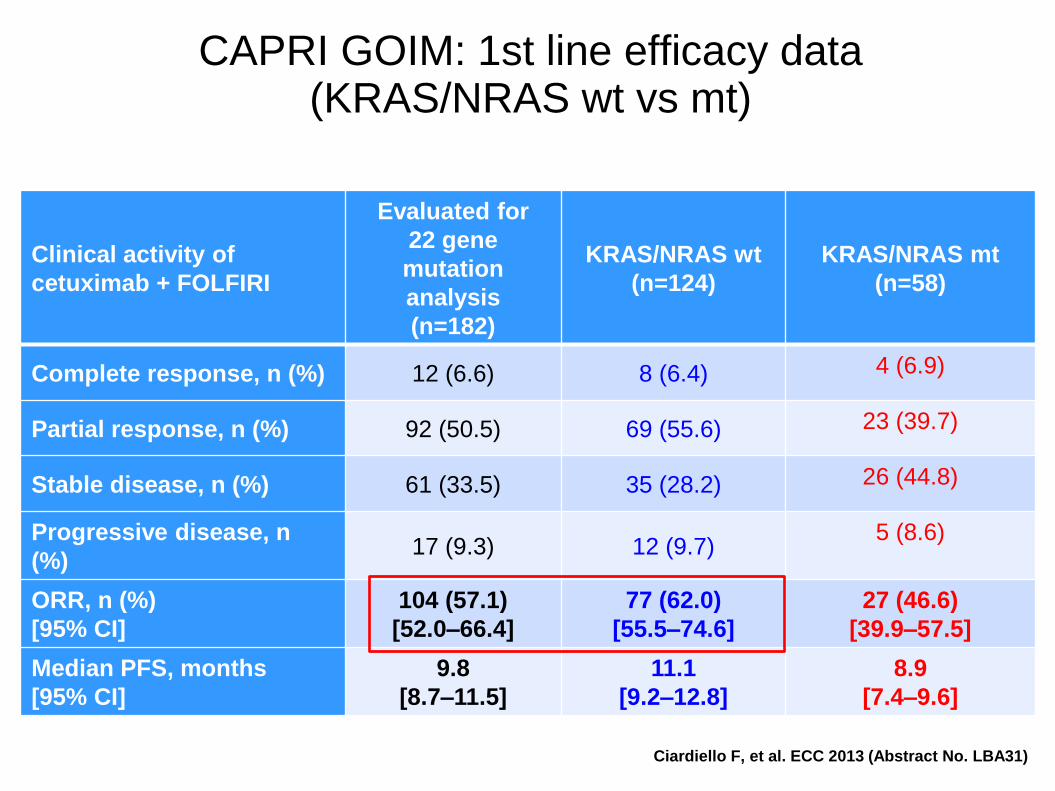
CAPRI GOIM trial: Investigating the use of anti-EGFR therapy in multiple lines
Ciardiello F, et al. ECC 2013 (Abstract No. LBA31)
Primary endpoints
1st line treatment: PFS1 2nd line treatment: PFS2
2nd line
1st line
KRAS wt (exon 2) mCRC
(local pathology laboratory
assessment for KRAS codons 12 and
13) PFS2 PFS1
Cetuximab +
FOLFIRI
Treat
until
PD or
toxicity
Treat
until
PD or
toxicity
R
Cetuximab +
mFOLFOX4
mFOLFOX4
Retrospective analysis of biomarkers at diagnosis
Clinical activity of
cetuximab + FOLFIRI
Evaluated for
22 gene
mutation
analysis
(n=182)
KRAS/NRAS wt
(n=124)
KRAS/NRAS mt
(n=58)
Complete response, n (%) 12 (6.6) 8 (6.4) 4 (6.9)
Partial response, n (%) 92 (50.5) 69 (55.6) 23 (39.7)
Stable disease, n (%) 61 (33.5) 35 (28.2) 26 (44.8)
Progressive disease, n
(%) 17 (9.3) 12 (9.7)
5 (8.6)
ORR, n (%)
[95% CI]
104 (57.1)
[52.0–66.4]
77 (62.0)
[55.5–74.6]
27 (46.6)
[39.9–57.5]
Median PFS, months
[95% CI]
9.8
[8.7–11.5]
11.1
[9.2–12.8]
8.9
[7.4–9.6]
CAPRI GOIM: 1st line efficacy data (KRAS/NRAS wt vs mt)
Ciardiello F, et al. ECC 2013 (Abstract No. LBA31)

Un rilevante progresso derivante da: - disponibilità di nuovi agenti biologici - continuo miglioramento delle conoscenze della biologia del tumore - miglioramento della strategia terapeutica Una grande distanza percorsa con piccoli passi

Ribero D et al. Cancer ‘07
Retrospective analysis 105 pts 5FU/OX +/- Beva
<25% residual viable cells
FU/OX: 23% FU/OX+Beva 45% P=0.02