CORPORATE PRESENTATION OC OOCTOBER
25
Zircon & Titanium mining and processing Zircon & Titanium mining and processing CORPORATE PRESENTATION OC O 20 CORPORATE PRESENTATION OCTOBER 2011 1 July 2011
Transcript of CORPORATE PRESENTATION OC OOCTOBER

Zircon & Titaniummining and processingZircon & Titanium mining and processing
CORPORATE PRESENTATION OC O 20CORPORATE PRESENTATION OCTOBER 2011
1
July 2011

Mineral Deposits – corporate snapshot
Capitalisation 10 years in Senegal
Li ti ASX (MDL) / TSX (MDM) 2002 St t d l ti G d CôtListings ASX (MDL) / TSX (MDM)
6 mth price range A$7.35 – $3.85
Shares 83.5M
Market cap A$433M / US$440M
2002 Started evaluating Grande Côte
2004 Awarded Sabodala gold project
2007 ‐ 2009 Constructed Sabodala mine
Mar 2009 First gold poured at Sabodalap $ / $
Cash (30/9/2011) US$130M
Investments US$80 (40M Teranga Gold (TGZ) shares)
Debt Nil
g p
2011 ‐ 2013 Construction of Grande Côte
Shareholder Structure (July 2011)
Dec 2010 Sabodala gold assets “demerged” into Teranga Gold
Corporate Transactions
Other Institutions Canada Dec 2010 Corporation (TSX/ASX: TGZ)
Oct 2011 Commencement of JV with Eramet (TiZir) –combining Grande Côte and ilmenite upgrading plant
Australian Institutions
38%
Retail10%
Institutions10%
Canada1%
UK/Europe23%
USA18%
2
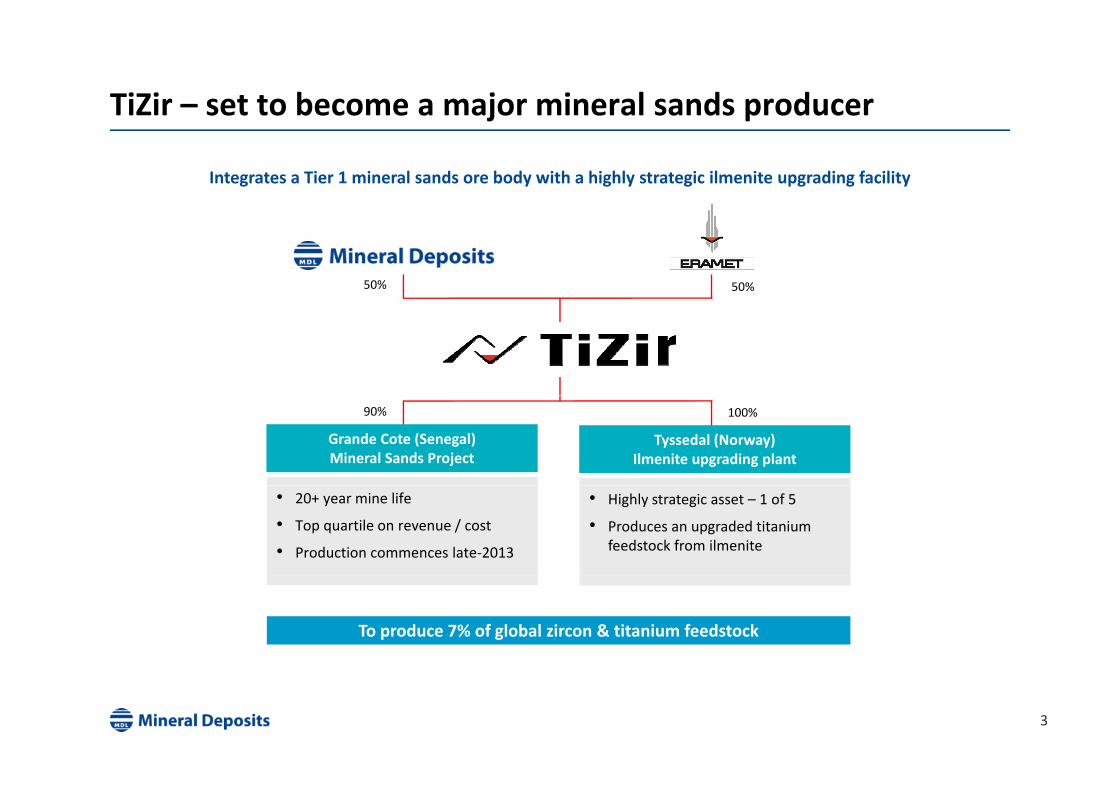
TiZir – set to become a major mineral sands producer
Integrates a Tier 1 mineral sands ore body with a highly strategic ilmenite upgrading facility
50%50%
Grande Cote (Senegal)Mineral Sands Project
Tyssedal (Norway)Ilmenite upgrading plant
100%90%
• Highly strategic asset – 1 of 5
• Produces an upgraded titanium feedstock from ilmenite
• 20+ year mine life
• Top quartile on revenue / cost
• Production commences late‐2013
To produce 7% of global zircon & titanium feedstock
3

Mineral Sands – two distinct product streams
Titanium FeedstockZircon
Market SizeVolume = 6.3m TiO2 units
Value = US$4.5bnVolume = 1.4 MtValue = US$3.5bn
MajorProducers
RIO Tinto 27%Iluka 13%Exxaro 9%
Iluka 31%RIO Tinto 17%Exxaro 15%
Kronos 6%China 9%
SupplyAustralia 21%
South Africa 19%Australia 41%
South Africa 29%pp yby Region China 12%
Canada 11%China 9%USA 7%
China 42% Europe 28%Demandby Region
Europe 24%Asia‐Pac ex China 17%
Americas 13%
Americas 26%China 21%
Asia‐Pac ex China 18%
4

Urbanisation is a key driver of product demand …
Titanium Feedstock consumptionZircon end‐use
Ceramics55%Refractories
14%
Foundrycasting
10%Other3%
Titanium sponge (1)
4%Other (2)
6%
Source: TZMI
Specialty Chemicals & Materials
18% Pigments90%
• Used in ceramics (mainly tiles) as an opacifier (because it is highly refractive) and for its hardness & whiteness
• Used in many applications for its high temperature
• Dominant use is for titanium dioxide (TiO2) pigment –the white pigment of choice – which is used in paints (56%), plastics (25%) and paper (9%)
90%
• Used in many applications for its high temperature resistance and chemical inertness
( ), p ( ) p p ( )
• “Lifestyle” products
• Consumption increases as wealth increases
• Developing nations (mainly China) are the growth engine
• 4% average growth in demand projected to 2020 (TZMI)
51. First stage in the titanium metal sector.2. Includes the manufacture of welding electrode fluxes and other
minor end‐uses – which mainly consume rutile and leucoxene
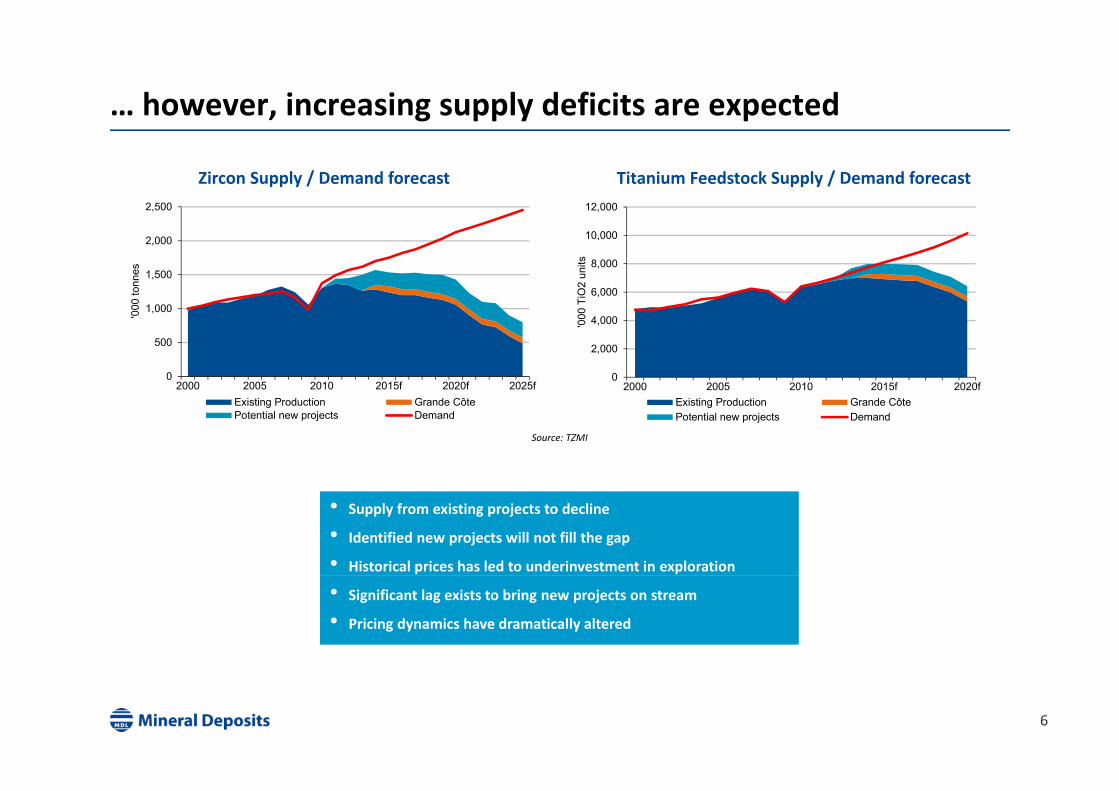
… however, increasing supply deficits are expected
Titanium Feedstock Supply / Demand forecastZircon Supply / Demand forecast12,0002,500
6,000
8,000
10,000
TiO
2 un
its
1 000
1,500
2,000
00 to
nnes
0
2,000
4,000
2000 2005 2010 2015f 2020f
'000
0
500
1,000
2000 2005 2010 2015f 2020f 2025f
'00
Source: TZMI
Existing Production Grande CôtePotential new projects Demand
Existing Production Grande CôtePotential new projects Demand
• Supply from existing projects to decline
• Identified new projects will not fill the gap
• Historical prices has led to underinvestment in exploration
• Significant lag exists to bring new projects on stream
• Pricing dynamics have dramatically altered
6

Grande Côte – a Tier 1 asset in the making
Location Senegal, West Africa
Grande Côt
Ownership 90% (Senegal govt. 10% free carried)
Concession 25 years extendable
Fiscal 5% royalty
e
Fiscal Arrangements
5% royalty10% government production share15 year tax free period
Mine Life 20+ years – potential for significantly y p g ylonger at lower cut‐off grades
Production(projected average p a )
85 ktpa Zircon575 ktpa Ilmenite
average p.a.) 16 ktpa Rutile & Leucoxene
Capex estimate US$516M (revised June 2011)
i $Opex estimate US$84M pa
Timing Construction underwayProduction commencement late‐2013
7

A very large ore body
Resource Estimate (Measured + Indicated)Covering ̴50% of Concession
Grande Côt
Cut‐off (%HM) Tonnes (Bt) HM (%)
0.50 4.14 1.1
0.75 2.90 1.2
1 00 1 72 1 5
e
1.00 1.72 1.5
1.25 1.03 1.7
From a depth 6m below the water table
Mining level Tonnes (mt) HM (%) Years
At water table 1 047 1 5 19
Reserve (Proved + Probable)Covering ̴40% of Concession
At water table 1,047 1.5 19
3m above 863 1.7 16
3‐6m above 751 1.8 14
6m above 684 1.9 13
20+ year mine life
8

A simple ore body
• No overburden
• Minor vegetation
Grande Côtg
• Free flowing sands – no hard lenses
• Minimal (<1.0%) slimes
• Shallow water table
e
• Deep aquifer
9

Conventional dredging and processing
• Dredge sucks sand from front of pond and pumps slurry to
Dredge & Floating Concentrator
Grande Côt• Dredge sucks sand from front of pond and pumps slurry to
floating concentrator
• Sand washed through spirals which using gravity separate heavy mineral concentrate (HMC) from lighter quartz
• Q t d (98%) d t b k f d
e
• Quartz sand (98%) pumped to back of pond
• HMC (2%) transferred to mineral separation plant (MSP)
• Magnetic, electrostatic and gravity processes separate
Mineral Separation Plant
HMC into various minerals – zircon, ilmenite, rutile & leucoxene
• No chemicals
10

Straight forward logisticsGrande Côt
+New 22km rail spur from MSP
Concession for use of existing line
e
Logistics self‐sufficiency
Lease over land at port+
=
11

Uncomplicated marketing
Average annual production Production description / target markets
Grande Côtp
Zircon 85 Kt
• Premium quality – low in key impurities
• Suitable for full spectrum of zircon consumers
• Premium price expected due to:
e
Zircon 85 Kt Premium price expected due to:
– high quality
– container shipments
400 Kt
Ilmenite
400 Kt54% TiO2
• Feedstock for Tyssedal plant
175 Kt59% TiO2
• Feedstock for chloride pigment manufacture
Rutile 6 Kt • Premium grade and fine grain size – ideal for welding sector
Leucoxene 10 Kt • Suitable for welding sector
12

Top quartile revenue / cost
Industry Revenue / Cost curve forecast for 2015(based on individual projects)
Grande Côt
• Valuable zircon stream
• Simple ore body3.50
4.00
Ratio
1st Quartile 2nd Quartile 3rd Quartile 4th Quartile
Why is Grande Côte top quartile?
e
• Large‐scale, low‐cost dredging
2.00
2.50
3.00
Industry Wtd Average 2015fCôt
e
0.50
1.00
1.50Industry Wtd Average 2015f
Gra
nde
C
0.000% 25% 50% 75% 100%
Cumulative TiO2 units produced
Source: TZMI
Note: R/C curve for 2015 based on TZMI’s forecast:1. production volumes for individual operations in 20152. long term real view of product prices
13
2. long term real view of product prices3. operating costs of the individual operations using real 2010 cost rates

Production to commence late‐2013Grande Côte
14

Senegal, West Africa
• Independent from France since 1960
Senegal
Grande CôtIndependent from France since 1960
• French is official language
• Successful, stable democracy
• Location of many foreign embassies and
e
international banks for West African region
• Small population (13M)
• World standard mining laws
• 10 years on the ground
• S b d l fi t j j t f 40
MDL in Senegal
• Sabodala – first major resource project for 40 years
• Strong engagement with local communities
• Excellent government relations
Grande Côte Mineral Sands Project
15

Tyssedal titanium & iron plantTyssedal
16

The drive for high TiO2 feedstocks
Tyssedal Plant Process Why upgrade the TiO2 content of feedstocks?
Tyssedal
• Pigment producers need reduced wasteIlmenite1
44% TiO2(~345 ktpa)
Input
• Pigment producers need reduced waste
• Smelting separates out iron (Fe)
– a valuable co‐product for us
– waste for pigment producers
FurnaceSmelting
p g p
Titanium slag80% TiO2
(~200 ktpa)Outputs
High PurityPig Iron
(~110 ktpa)
PigmentProducers 2
Customers Foundries 3
Notes:1. Mostly sourced from Tellnes mine in Norway2. Mainly European‐based using sulphate process
d f f l d d b
17
3. Used for a variety of purposes, including wind turbine parts

Tyssedal, a highly strategic asset
• Titanium slag accounts for 39% of all titanium feedstock
• Supply is highly concentrated – 3 owners across 5 plants
Split of feedstock supply(2011f = 6.6 m TiO2 units)
Tyssedalpp y g y p
Owner Location ktpa Slag Type
Rio Tinto QIT – Sorel, Canada 1,300 Sulph & Chlor
Rio / BHP RBM – South Africa 1,000 Chloride
Ilmenite41%
Syn Rutile8%
Rutile12%
Exxaro KZN – South Africa 140 Chloride
Exxaro Namakwa – South Africa 140 Chloride
TiZir ETI – Tyssedal, Norway 200 Sulphate
2 780
TitaniumSlag39%
Feedstock demand by pigment process
2,780
• Security of additional Grande Côte feed provides:
Tyssedal growth opportunities
4 0TiO2y p
– Opportunity to build 2nd furnace and double capacity to 400+ ktpa of titanium slag
– Flexibility to produce feedstock for both sulphate and chloride pigment process routes 2.0
3.0
4.0TiO2units(m)
Rutile
Syn Rutile
chloride pigment process routes
• Feasibility study for 2nd furnace underway
0.0
1.0
ChlorideP
SulphateP
TitaniumSlag
Ilmenite
18Sources: TZMI
Process Process

Strategic positioning relative to pigment customersTyssedal
●606
Tyssedal
●1628●17
●606●997
●27●1154
●63●142
●160●170
●55
●151●61
60●170Grande Côte
55
●260●22
●Chloride Pigment capacity (kt)●Sulphate Pigment capacity (kt)TiZir Locations
19Source: TZMI

Indicative financials – based on illustrative pricing
Tyssedal (100%)Grande Côte (100%)
Zircon revenue Zircon: 85Kt x US$2,000/t Slag revenue US$1,000/t
Opex & other
Titaniumfeedstockrevenue
Ilmenite: 575Kt x US$200/t
Costs
Pig ironrevenue €480/t
EBITDA
costs
EBITDA
Costs
MDL participates in earnings from October 2011Production commencement late‐2013
0 20 40 60 80 100 120 140 160 180 200
US$M
0 20 40 60 80 100 120 140 160 180
US$M
p p g
20

Additi l i f tiAdditional information
21

Our titanium feedstocks customers – TiO2 pigment producers Tita
Sulphate Process Chloride Process
Pigment producer market share(2010 capacity = 6.0 mt)
anium feedst
Two distinct processes produce TiO2 pigment
Sulphate Process Chloride Process
48% of capacity 52% of capacity
Sulphuric acid used to dissolve titanium
Chlorine gas used to liberate titanium
tocksDuPont19%
Cristal13%
China22%
Other14%
Ilmenite (low‐TiO2) main feedstock
High‐TiO2 feedstocks (titanium slag, rutile) used
Waste / TiO2 ≈ 4:1 Waste / TiO2 ≈ 1:1
Dominant in China Dominant in the AmericasHuntsman
10%Kronos9%
Tronox6%
Sachtleben4%
ISK3%
22%
37% of capacity in Europenear‐zero in Americas
63% of capacity in Europenear‐zero in China
TiO2 pigment capacity by region(2010 capacity = 6.0 mt)
9%6%
EMEA
Americas
0.0 0.5 1.0 1.5 2.0
Asia-Pacificex China
China
Chloride ProcessSulfate Process
22Sources: TZMI
mt

Grande Côte Financial Estimates
Capital Cost (US$516M)
$
Operating Costs (US$84M pa)
$US$M
Dredge & Services 53.6
Wet Concentrator Plant 95.9
Mineral Separation Plant 63.0
US$M
Power and Fuel 34.2
Employee Costs 9.4
Maintenance 14.4Mineral Separation Plant 63.0
Power Station 49.4
Rail and Rolling Stock 43.6
Port Facilities 21.7
Maintenance 14.4
Transportation / Shipping (FOB) 13.6
Other 12.3
Temporary Construction Facilities 22.4
Indirects – EPCM/ Commissioning /Project Fee 56.7
Owner Costs 61.1
Estimation/Design Allowance/Contingency 49.0
Total 516.4
Total 83.9
23
Statements
Forward Looking Statements• Certain information contained in this presentation including any information on MDL’s plans or future financial or operating performance and other statementsCertain information contained in this presentation, including any information on MDL s plans or future financial or operating performance and other statements
that express management’s expectations or estimates of future performance, constitute forward‐looking statements. Such statements are based on a number of estimates and assumptions that, while considered reasonable by management at the time, are subject to significant business, economic and competitive uncertainties. MDL cautions that such statements involve known and unknown risks, uncertainties and other factors that may cause the actual financial results, performance or achievements of MDL to be materially different from the company’s estimated future results, performance or achievements expressed or implied by those forward‐looking statements. These factors include the inherent risks involved in exploration and development of mineral properties, changes in
d h h ld d f l d h k h l d h f heconomic conditions, changes in the worldwide price of zircon, ilmenite and other key inputs, changes in mine plans and other factors, such as project execution delays, many of which are beyond the control of MDL.
• Nothing in this presentation should be construed as either an offer to sell or a solicitation to buy or sell MDL securities.
24

mineraldeposits.com.au
25