Corporate & Institutional Banking Dr Bob Edgar Managing Director Australia and New Zealand Banking...
15
Corporate & Institutional Banking Dr Bob Edgar Managing Director Australia and New Zealand Banking Group Limited 20 July 2001
-
Upload
nathaniel-park -
Category
Documents
-
view
217 -
download
3
Transcript of Corporate & Institutional Banking Dr Bob Edgar Managing Director Australia and New Zealand Banking...

Corporate & Institutional Banking
Dr Bob EdgarManaging Director
Australia and New Zealand Banking Group Limited 20 July 2001

Page 2
The relationship gateway to our corporate customer base
• Financial performance
• Strong customer focus
• Conservative risk management
• Growth focused on fee-based investment banking style products
• Goals for Corporate & Institutional Banking

Page 3
Corporate & Institutional Banking
Institutional Banking
• Middle market companies with $10 - $100m turnover
• 5500 customers & targets• Geographic relationship
management model with 21 regions across Australia & New Zealand
• Regional Credit Executives located with relationship
• Management of overall customer relationship & profitability
• Balance sheet management
• Navigation, co-ordination & solutions development between product areas for our customers
Corporate Banking
Key Responsibilities
• Top end corporates in with $100m plus turnover
• Has ~1000 customers & targets, in Australia and New Zealand
• 9 Specialised Industry Segments
• Supported by Credit Products Group

Page 4
Institutional Banking continues to perform strongly
Mar-01
422
435430
350
375
400
425
450
475
500
Mar-00 Sep-00
FTE
6770
88
40
50
60
70
80
90
100
Profit After Tax
Mar-00 Sep-00 Mar-01
31% Growth176
209
171
100
120
140
160
180
200
220
Mar-00 Sep-00 Mar-01
Operating Income
22% Growth
$m $m
Mar-01
21.123.922.2
0
10
20
30
40
50
Mar-00 Sep-00
Cost Income%

Page 5
Corporate Banking performance has been more subdued
34.638.0
35.0
20
30
40
50
60
70
Mar-00 Sep-00 Mar-01
Cost Income%
Mar-01
756769762
650670690710730750770790810830850
Mar-00 Sep-00 Mar-01
FTE
183187 188
160
165
170
175
180
185
190
195
200
Mar-00 Sep-00
Operating Income
3% Growth
$m
6160
65
50
55
60
65
70
Profit After Tax
Mar-00 Sep-00 Mar-01
7% Growth
$m

Page 6
CIB relationship management is the gateway to our corporate customers
0%
10%
20%
30%
40%
50%
60%
70%
CIB GSF GFX GTS GCM PFS
• The value of the CIB customer franchise is much larger than the reported ‘balance sheet’ driven numbers
• Over 40% of revenue from CIB customer base is booked in other business units
• Over 60% of NIACC (Net Income After Capital Charge*) is booked in other business units
• Taking a complete customer view ensures cross-selling opportunities are optimised
* NIACC is an EVA based profitability measure used within ANZ at the customer level
Revenue NIACC
Source of Customer Revenue & NIACC
CIB Australia & NZ
Page 7
CIB drives for continuous change to be a high performing customer business
•Distribution StrategyRole clarityProcess improvement
• Customer Profitability tool• Product specialists in regions
• e-Transformation • Outsourcing / centralisation - CTSC - Securities
• Industry specialisation in IB
NIACC $130mCTI 36%ELP 53bp
NIACC $460mCTI 28%ELP 37bp
1998 1999 2000 2001
• Corporate Banking portal CARBe Impact
Page 8
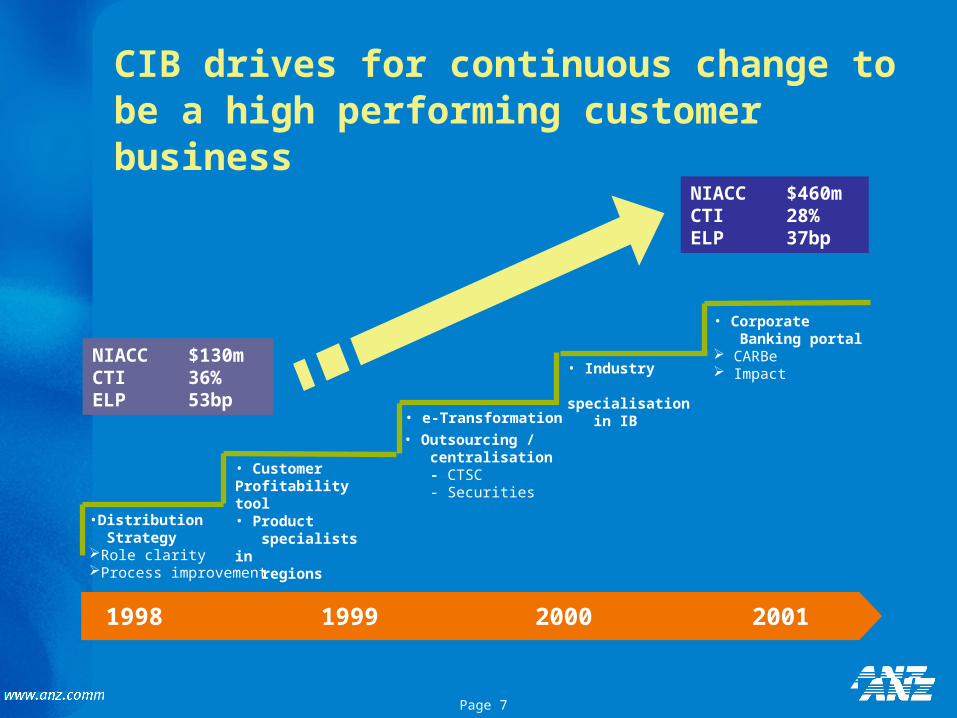
We are a leader in customer relationship management
0% 20% 40% 60%
#2
=1
=1
=1
=1
Overall Satisfaction with Bank(Corporate Bank)
7.67.5
7.67.4
6.97.0
7.1
6.46.0
6.5
7.0
7.5
8.0
1997 1998 1999 2000
ANZ NAB CBA WBC
Source: Roberts Research Group
8.1 8.1 8.1 8.38.0
7.47.5
6.8
7.4 7.4
6
6.5
7
7.5
8
8.5
1995 1996 1997 1998 1999
Satisfaction with Relationship Manager(Corporate Bank)
2000
8.4
7.0
0% 20% 40% 60% 80%
#2
#1
#1 Total customers
Significant Bank R’ships
Lead bank customers
Market Position(Institutional Bank)
Relationship Management(Institutional Bank)
Overall satisfaction
Quality of account management
Level of ideas & initiatives
Understanding and knowledge of business
Prompt follow-up
Source: Greenwich Associates

Page 9
Risk profile and management stance remain conservative
• Risk grades 7D-10 [ie B to D external credit ratings agency equivalents] are less than 4% of total book
• This reflects a substantial improvement in book quality
• Risk grades 5-7C [ie BB+ to well secured B] improved from 54.3% to 43% of book.
Risk Profile
0
5
10
15
20
25
30
35
1 2 3 4 5 6 7 8 9 10
CCR
Ass
ets
(%)

Page 10
For key asset quality indicators, CIB has a solid record - no systemic credit issues
Risks actively managed
• Enhanced credit management processes reducing expected loss rates in the business, (eg ‘one-up’ reviews)
• Whilst net specific provisions have increased during the first half year, the loss rate is still well below ELP rate
• At this stage of the credit cycle, we expect specific provisions to increase towards ELP
0.00
0.05
0.10
0.15
0.20
0.25
0.30
0.35
0.40
0.45
0.50
Mar-98 Mar-99 Mar-00 Mar-01
ELP Rate
SP Rate
% o
f Len
din
g A
ssets
ELP is a key measure of
portfolio quality

Page 11
Growth is increasingly being driven by investment banking style products…
Traditional Income – lending, transaction, deposit & trade products
Other - principally products from the Personal portfolio
34
100
1671
32
80
90
100
110
120
130
140
150
160
170
180
11
4
100
117
2
80
85
90
95
100
105
110
115
120
Institutional Corporate
Traditional Income
Inv. Bank products
Other
Mar-00 Mar-01
Traditional Income
Wall St to Main St
Other
Mar-00 Mar-01
Index Index
Page 12
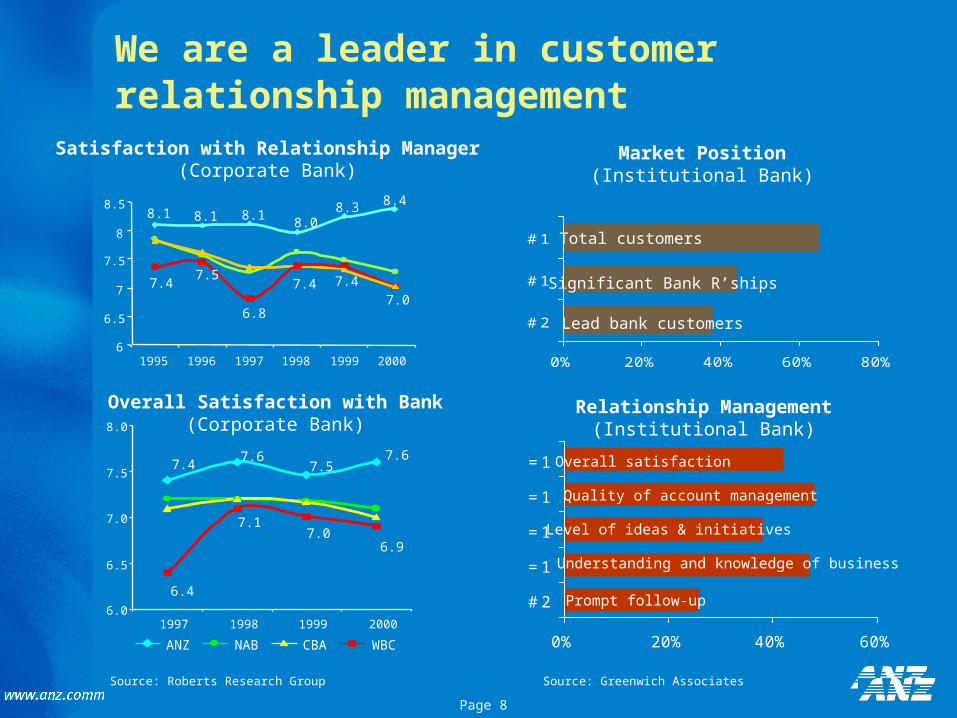
What do our customers want? - their top 3 needs are
CB to focus on:
• Wall St to Main St
• Cross sell products from the Personal businesses into our customer base:
• Corporate portal to lower cost to serve
Corporate Banking
• ‘Balance Sheet’ on reasonable terms
• Partner & trusted advisor• Smart products / customised
solutions
Institutional Banking
• Industry Knowledge• Creative ideas and solutions• High quality service proposition
IB’s focus will be:• Leverage the success of
Industry Specialisation to our institutional customers
• Client servicing• Corporate Portal – helps
customers streamline operations

Page 13
…supported by world class customer value management systems like MARS
Management Analysis Reporting System
Relationship expense
Transaction details
Product & pricing details
Risk profile
Key Inputs Key Outputs
Customer profitability
“What if” scenarios
Product profitability
Risk based pricing
Share of overheads

Page 14
Summary
• The pre-eminent domestic corporate banking franchise
• Our cross sell focus is embedded in the sales network, driven to growing non-balance sheet product solutions for customers
• Optimising overall customer value is driving new revenue opportunities
• The business will continue to build industry specialisation
Goals• Double digit earnings
growth
• Continue growth and
diversification of
customer revenue
mix
• Maintain customer
satisfaction ratings
• Performing loans
remain at 99% of
total book

Page 15
Copy of presentation available on
www.anz.com