corporate governance and firm performance in africa
33
CORPORATE GOVERNANCE AND FIRM PERFORMANCE IN AFRICA: A DYNAMIC PANEL DATA ANALYSIS ϒ by: Anthony Kyereboah-Coleman University of Ghana Business School, Legon. Contact details: Box LG 78, Legon, Ghana. Tel: +233 21 501594; +233 21 Cell: +233 244 234886 Email: [email protected] or [email protected] A Paper Prepared for the “International Conference on Corporate Governance in Emerging Markets” Organized by the Global Corporate Governance Forum (GCGF) and Asian Institute of Corporate Governance (AICG) 15 th -17 th November, 2007, Sabanci University, Istanbul, Turkey ϒ This paper has benefited immensely from constructive and valuable comments from the Scientific Committee that reviewed and selected various papers for presentation. We are grateful to them. All omissions, errors and commissions are entirely the responsibility of the author.
-
Upload
phungthien -
Category
Documents
-
view
220 -
download
0
Transcript of corporate governance and firm performance in africa

CORPORATE GOVERNANCE AND FIRM PERFORMANCE IN
AFRICA: A DYNAMIC PANEL DATA ANALYSISϒ
by:
Anthony Kyereboah-Coleman
University of Ghana Business School, Legon. Contact details: Box LG 78, Legon, Ghana.
Tel: +233 21 501594; +233 21 Cell: +233 244 234886 Email: [email protected] or [email protected]
A Paper Prepared for the “International Conference on Corporate Governance in Emerging
Markets”
Organized by the Global Corporate Governance Forum (GCGF) and Asian Institute of
Corporate Governance (AICG)
15th -17th November, 2007, Sabanci University, Istanbul, Turkey
ϒ This paper has benefited immensely from constructive and valuable comments from the Scientific Committee that reviewed and selected various papers for presentation. We are grateful to them. All
omissions, errors and commissions are entirely the responsibility of the author.

Abstract The study examined the effect of corporate governance on the performance of firms in
Africa by using both market and accounting based performance measures. Unique data
from 103 listed firms drawn from Ghana, South Africa, Nigeria and Kenya covering the
five year period 1997-2001 was used and analysis done within the dynamic panel data
framework. Results indicate that the direction and the extent of impact of governance is
dependent on the performance measure being examined. Specifically, our findings show
that large and independent boards enhance firm value and that combining the positions
of CEO and board chair has a negative impact on corporate performance. We also find
that CEO’s tenure in office enhances a firm’s profitability whiles board activity intensity
affects profitability negatively. The size of audit committees and the frequency of their
meetings have positive influence on market based performance measures and that
institutional shareholding enhances market valuation of firms. Finally, results point out
that both country and sector characteristics influence the impact of governance on
corporate performance. For enhanced performance of corporate entities, we recommend
a clear separation of the positions of CEO and board chair and also to maintain relatively
independent audit committees.
1

1. Introduction
Effective corporate governance has been identified to be critical to all economic transactions especially in emerging and transition economies (Dharwardkar et al., 2000). However, at varying levels of agency interactions, market institutional conditions that reduce informational imperfections and facilitate effective monitoring of agents impinge on the efficiency of investment. Likewise, corporate governance has assumed the centre stage for enhanced corporate performance. What then is corporate governance? Corporate governance could be defined as “ways of bringing the interests of investors and managers into line and ensuring that firms are run for the benefit of investors (Mayer, 1997). Corporate governance is concerned with the relationship between the internal governance mechanisms of corporations and society’s conception of the scope of corporate accountability (Deakin and Hughes, 1997). It has also been defined by Keasey et al. (1997) to include ‘the structures, processes, cultures and systems that engender the successful operation of organizations’. From the foregoing analysis, we argue that corporate governance is represented by the structures and processes laid down by a corporate entity to minimize the extent of agency problems as a result of separation between ownership and control. It must also be indicated that different systems of corporate governance will embody what are considered to be legitimate lines of accountability by defining the nature of the relationship between the company and key corporate constituencies. The East Asian crisis and the recent corporate scandals around the world coupled with the seemingly poor performance of corporate Africa have given prominence and impetus to corporate governance on the continent. The extant literature on corporate governance, which is generally about large and listed firms in the US and UK, considers the relationship between corporate ownership structure, boards of directors composition and corporate performance. One of the few comprehensive studies done on the continent with regards to corporate governance was by Ayogu (2001). That study concentrated on regulations, legalities and governance practices across selected African countries. Again, Akinboade and Okeahalam (2003) followed up on the study by Ayogu (2001) by doing a cross-country study on selected African countries. The study by Akinboade and Okeahalam was essentially a review of corporate governance in Africa and highlighted issues and challenges. In addition to these, there are isolated country case studies. Sanda et al. (2005) looked at corporate governance and financial performance of firms in Nigeria. Furthermore, Kyereboah-Coleman et al. (2006) conducted a study on corporate governance and performance of listed firms in Ghana whiles Kyereboah-Coleman and Biekpe (2006) did a comparative study by looking at corporate governance and performance of listed and non-listed banks in Ghana. Thus, the point must be made that linking corporate governance and firm performance in a cross-country dimension for the African continent has never been attempted and this is our primary motivation for carrying out this study. On the African continent, corporate governance matters are driven by countries’ Companies Codes, Securities and Exchange Commissions, the stock exchange listing requirements, regulations and rules and other country-specific regulatory agencies. However, though corporate governance in Africa is off on a good start, insufficient empirical research limit the basis for comparison of the continent’s corporate governance experiences and outcomes with other continents. Therefore, in this paper we look at how selected corporate governance indicators influence corporate performance in a cross-country of many corporations. The rest of
2

the paper is organized as follows: section two discusses relevant literature; section three looks at data and methodological issues; section four is devoted to discussion of empirical findings; and section five concludes and highlights policy implications.
2. Literature review
The existence of divergent and sometimes conflicting objectives between managers and shareholders has given rise to the design of many concepts and mechanisms to ensure that the cost associated with such divergent interest is minimal. One of the proposed arrangements is corporate governance and it is not surprising that agency theory has been the dominant paradigm in the corporate governance literature. However, several other theories have emerged in an attempt to highlight the objective of the firm and how it should respond to its different obligations. In the following, these theories are discussed briefly.
2.1 Agency theory
It is an acknowledged fact that the principal-agent theory is generally considered the starting point for any debate on the issue of corporate governance emanating from the classical thesis on The Modern Corporation and Private Property by Berle and Means (1932). According to this thesis, the fundamental agency problem in modern firms is primarily due to the separation between finance and management. Modern firms are seen to suffer from separation of ownership and control and therefore are run by professional managers (agents) who cannot be held accountable by dispersed shareholders. In this regard, the fundamental question is how to ensure that managers follow the interests of shareholders in order to reduce cost associated with principal-agent theory? The principals are confronted with two main problems. Apart from facing an adverse selection problem in that they are faced with selecting the most capable managers, they are also confronted with a moral hazard problem: they must give agents (managers) the right incentives to make decisions aligned with shareholder interests. In further discussion of agency relationships and cost (Jensen and Meckling, 1976) describe agency relationship as a contract under which “one or more persons (principal) engage another person (agent) to perform some service on their behalf, which involves delegating some decision-making authority to the agent”. In this scenario, there exists a conflict of interests between managers or controlling shareholders, and outside or minority shareholders leading to the tendency that the former may extract “perquisites” (or perks) out of a firm’s resources and be less interested to pursue new profitable ventures. Agency costs include monitoring expenditures by the principal such as auditing, budgeting, control and compensation systems, bonding expenditures by the agent and residual loss due to divergence of interests between the principal and the agent. The share price that shareholders (principal) pay reflects such agency costs. To increase firm value, one must therefore reduce agency costs. The following represent the key issues towards addressing opportunistic behaviour from managers within the agency theory:
• Composition of board of directors: The board of directors is expected to be made up of more non-executive directors (NEDs) for effective control. It is argued that this reduces conflict of interest and ensures a board’s independence in monitoring and passing fair and unbiased judgement on management.
3
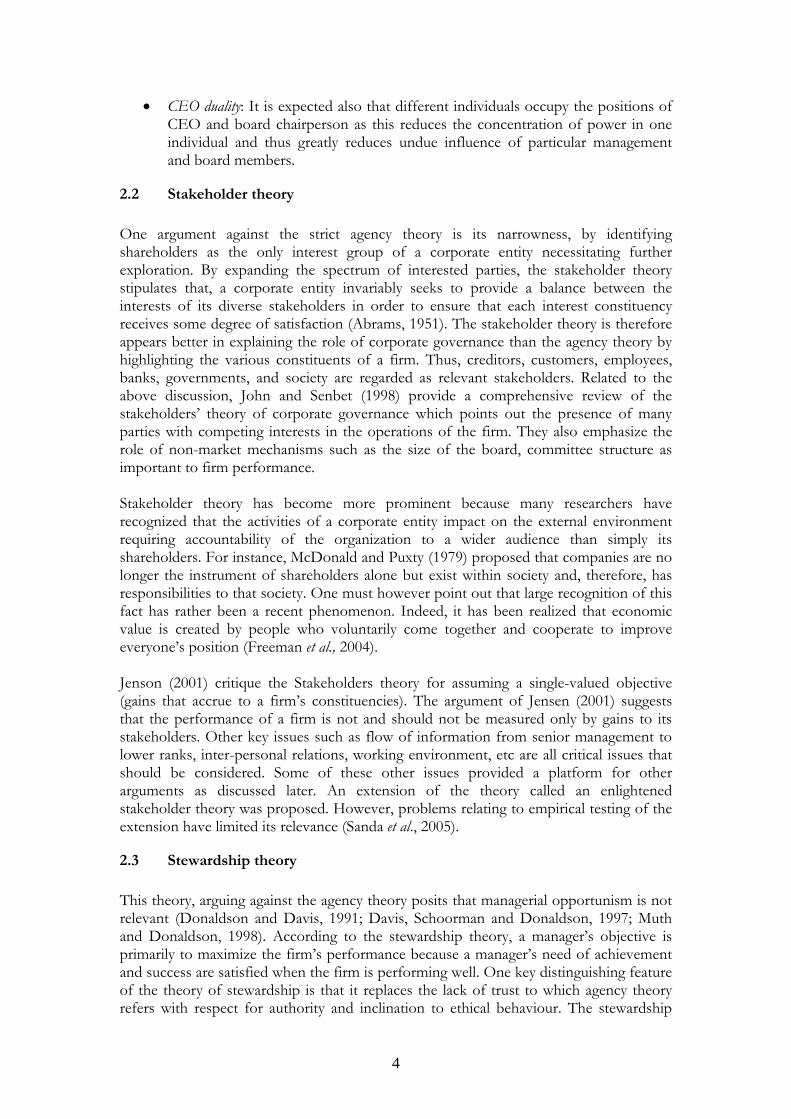
• CEO duality: It is expected also that different individuals occupy the positions of CEO and board chairperson as this reduces the concentration of power in one individual and thus greatly reduces undue influence of particular management and board members.
2.2 Stakeholder theory
One argument against the strict agency theory is its narrowness, by identifying shareholders as the only interest group of a corporate entity necessitating further exploration. By expanding the spectrum of interested parties, the stakeholder theory stipulates that, a corporate entity invariably seeks to provide a balance between the interests of its diverse stakeholders in order to ensure that each interest constituency receives some degree of satisfaction (Abrams, 1951). The stakeholder theory is therefore appears better in explaining the role of corporate governance than the agency theory by highlighting the various constituents of a firm. Thus, creditors, customers, employees, banks, governments, and society are regarded as relevant stakeholders. Related to the above discussion, John and Senbet (1998) provide a comprehensive review of the stakeholders’ theory of corporate governance which points out the presence of many parties with competing interests in the operations of the firm. They also emphasize the role of non-market mechanisms such as the size of the board, committee structure as important to firm performance. Stakeholder theory has become more prominent because many researchers have recognized that the activities of a corporate entity impact on the external environment requiring accountability of the organization to a wider audience than simply its shareholders. For instance, McDonald and Puxty (1979) proposed that companies are no longer the instrument of shareholders alone but exist within society and, therefore, has responsibilities to that society. One must however point out that large recognition of this fact has rather been a recent phenomenon. Indeed, it has been realized that economic value is created by people who voluntarily come together and cooperate to improve everyone’s position (Freeman et al., 2004). Jenson (2001) critique the Stakeholders theory for assuming a single-valued objective (gains that accrue to a firm’s constituencies). The argument of Jensen (2001) suggests that the performance of a firm is not and should not be measured only by gains to its stakeholders. Other key issues such as flow of information from senior management to lower ranks, inter-personal relations, working environment, etc are all critical issues that should be considered. Some of these other issues provided a platform for other arguments as discussed later. An extension of the theory called an enlightened stakeholder theory was proposed. However, problems relating to empirical testing of the extension have limited its relevance (Sanda et al., 2005).
2.3 Stewardship theory
This theory, arguing against the agency theory posits that managerial opportunism is not relevant (Donaldson and Davis, 1991; Davis, Schoorman and Donaldson, 1997; Muth and Donaldson, 1998). According to the stewardship theory, a manager’s objective is primarily to maximize the firm’s performance because a manager’s need of achievement and success are satisfied when the firm is performing well. One key distinguishing feature of the theory of stewardship is that it replaces the lack of trust to which agency theory refers with respect for authority and inclination to ethical behaviour. The stewardship
4

theory considers the following summary as essential for ensuring effective corporate governance in any entity:
• Board of directors: The involvement of non-executive directors (NEDs) is viewed as critical to enhance the effectiveness of the board’s activities because executive directors have full knowledge of the firm’s operations. Thus, it is believed that the appointment of NEDs will enhance decision-making and ensure the sustainability of the business.
• Leadership: Contrary to the agency theory, the stewardship theory stipulates that
the positions of CEO and board chair should be concentrated in the same individual. The reason being that it affords the CEO the opportunity to carry through decision quickly without the hindrance of undue bureaucracy. We must rather point out that this position has been found to create higher agency costs. The argument is that when governance structures are effectively working, there should not be undue bureaucratic delays in any decision-making.
• Finally, it is argued that small board sizes should be encouraged to promote
effective communication and decision-making. However, the theory does not stipulate a rule for determining the optimal board size and for that matter what constitutes small?
2.4 Resource dependency theory
This theory introduces accessibility to resources, in addition to the separation of ownership and control, as a critical dimension to the debate on corporate governance. Again, the theory points out that organizations usually tend to reduce the uncertainty of external influences by ensuring that resources are available for their survival and development. By implication, this theory seems to suggest that the issue of dichotomy between executive and non-executive directors is actually irrelevant. How then does a firm operate efficiently? To resolve this problem, the theory indicates that what is relevant is the firm’s presence on the boards of directors of other organizations to establish relationships in order to have access to resources in the form of information which could then be utilized to the firm’s advantage. Hence, this theory shows that the strength of a corporate organization lies in the amount of relevant information it has at its disposal. 2.5 In the light of the foregoing analysis, it is clear that governance mechanism seeks to protect the interest of all stakeholders of a firm. In recent times, the structure of laws and accountability issues regarding corporate governance is changing worldwide and directors are being held responsible everyday for the success and failures of the companies they govern. Corporate boards are responsible for major decisions like changing corporation bylaws, issuing of shares, declaring of dividends, etc. This explains to some extent, the reason why discussions of corporate governance usually focus on boards. The board of directors is the “apex” of the controlling system in an organization and is there to monitor the activities of top management to ensure that the interests of shareholders are protected (Jensen, 1993; Short et al, 1998). It acts as the fulcrum between the owners and controllers of the corporation (Monks and Minow, 2001) and regarded as the single most important corporate governance mechanism (Blair, 1995). The board of directors is the institution to which managers of a company are accountable before the law for the company’s activities (Oxford Analytica Ltd, 1992:7).
5

Studies have shown that boards of directors are effective mechanism for effective monitoring of managers (Byrd and Hickman, 1992; Fama and Jensen, 1983). Again, Fama and Jensen (1983) extend the argument that boards will be able to effectively monitor management when there are more non-executive directors (NEDs). According to Tricker (1984) the reasons for the need for regulation of companies is to prevent the abuse of corporate power and make the board of directors effective. Apart from the duty of loyalty to the company’s shareholders, the board is also responsible for exercising due diligence in decision making. Specifically, it selects, evaluates and if necessary, replaces the CEO based on performance. Is there a link between corporate governance and corporate performance? 2.6 Corporate governance and firm performance It is widely acclaimed that good corporate governance enhances a firm’s performance (Brickley et al, 1994; Brickley and James, 1987; Byrd and Hickman, 1992; Chung et al, 2003; Hossain et al, 2000; Lee et al, 1992; Rosenstein and Wyatt, 1990; Weisbach, 1988). In spite of the generally accepted notion that effective corporate governance enhances firm performance, other studies have reported negative relationship between corporate governance and firm performance (Bathala and Rao, 1995; Hutchinson, 2002) or have not found any relationship (Park and Shin, 2003; Prevost et al. 2002; Singh and Davidson, 2003; Young, 2003). Several explanations have been given to account for these apparent inconsistencies. Some have argued that the problem lies in the use of either publicly available data or survey data as these sources are generally restricted in scope. It has also been pointed out that the nature of performance measures (i.e. restrictive use of accounting based measures such as return on assets (ROA), return on equity (ROE), return on capital employed (ROCE) or restrictive use of market based measures (such as market value of equities) could also contribute to this inconsistency (Gani and Jermias, 2006). Furthermore, it has been argued that the “theoretical and empirical literature in corporate governance considers the relationship between corporate performance and ownership or structure of boards of directors mostly using only two of these variables at a time” (Krivogorsky, 2006). For instance, Hermalin and Weisbach (1991) and McAvoy et al. (1983) studied the correlation between board composition and performance, whiles Hermalin and Weisbach (1991), Himmelberg et al. (1999), and Demsetz and Villalonga (2001) studied the relationship between managerial ownership and firm performance. To address some of the aforementioned problems, it is recommended that a look at corporate governance and its correlation with firm performance should take a multivariate approach. The present study adds to the literature by employing both market based and accounting based performance measures such as return on assets and Tobin’s q and test the relationship between them and selected governance variables. In addition to board characteristics, we also include board activity intensity as well as audit committee practices and characteristics and institutional shareholding as an extended arm of governance. We combine survey and publicly available governance data to broaden the scope of governance variables. More appealing is the highlight of both country and sector specific dimensions of governance and performance in the study.
3. Data and Methodology
3.1 Sample selection and variable description We employ unique data on a sample of 103 listed companies on Ghana, Nigeria, Kenya and Johannesburg stock exchanges. In addition, we also depended on INET-Bridge for
6

their electronic data. We must indicate that our selection of the 103 firms was primarily based on convenience and also their submission of completed questionnaire eliciting data on some of the governance variables (such as board activity intensity, CEO tenure, and audit committee characteristics). Thus, whiles the performance variables were largely computed based on the firms financials, most of the governance variables were obtained through the administration of a questionnaire. Firms sampled covered industrial, manufacturing, mining, agriculture and services sectors. Table I is a summary of firm distribution by country and sector. Table I: Firm Distribution by Sector and Country Country Sector Industrial Manufacturing Mining Agricultural Services Total South Africa
15 5 15 3 4 42
Ghana 4 10 1 2 5 22 Nigeria 4 3 5 2 2 16 Kenya 8 7 3 3 2 23 Total 31 25 24 10 13 103 In arriving at the definition of what constitute these sectors, we largely depended on the classifications given by the various stock exchanges. We recognize the possibility of non-uniform classification which could pose a problem with regards to the analysis and results. However, we are of the opinion that such differences are marginal and thus, have little impact on compromising the validity of our results. The banking and finance sector is omitted in tandem with studies on corporate governance (Faccio and Lasfer, 2000). The sector has peculiar governance issues which make it different from all other sectors. The data covers the period 1997 to 2001. The period was chosen because of data availability and completeness for all the firms. We use return on assets (ROA) and Tobin’s q as our performance measures. This is in tandem with arguments that suggest that the use of only accounting or market based performance measures are responsible for the inconsistencies in establishing a clear relationship between corporate governance and corporate performance. We measure ROA as the ratio of Earnings before Interest and Taxes to Total Assets (EBIT/TA) and Tobin’s q1 (as explained in the footnote). The governance variables are discussed below: Board size Jensen (1993) has indicated that a value-relevant attribute of corporate boards is its size. Organizational theory presupposes that larger groups take relatively longer time to make decisions and, therefore, more input time (Steiner, 1972). What should a board size be? This has been a difficult question to answer because it seems to sit in the realms of relativity and subjectivity against the backdrop of unbiased objective measure. However, Lipton and Lorsch (1992) suggest an optimal board size between seven and nine directors. In this respect, empirical studies have shown that the market values firms with
1 Tobin’s Q is probably the most frequently used valuation measure in empirical corporate finance. Named after the Nobel Prize laureate James Tobin from Yale University, it is defined as the ratio of market value to replacement value of a firm’s assets. As an approximation, the market value of assets is normally computed as market value of equity plus book value of assets, minus book value of equity. This is then divided by the book value of assets to obtain Tobin’s Q. This ratio is expected to be greater than unity as an indication that management has done well in its investment decisions.
7

relatively small board sizes (Lipton and Lorsch, 1992; Yermack, 1996; Sanda et al, 2005; Eisenberg et al, 1998). Hence, as board size increases board activity is expected to increase to compensate for increasing process losses (Vafeas, 1999). The argument is that large boards are less effective and are easier for a CEO to control. The cost of coordination and processing problems is also high in large boards and this makes decision-taking difficult. On the other hand, smaller boards reduce the possibility of free-riding and therefore have the tendency of enhancing firm performance. We measure the size of the board by the number of directors serving on such boards and expect this to have a negative relationship with firm performance. We test the following hypothesis: H1: The size of the board is negatively related to firm performance. Board independence John and Senbet (1998) argue that a board is more independent if it has more non-executive directors (NEDs). As to how this relates to firm performance, empirical results have been inconclusive. In one breadth, it is asserted that executive (inside) directors are more familiar with a firm’s activities and, therefore, are in a better position to monitor top management. On the other hand, it is contended that NEDs may act as “professional referees” to ensure that competition among insiders stimulates actions consistent with shareholder value maximization (Fama, 1980). Weisbach (1988) and Cotter et al. (1997) support this view underscoring the important role of outside directors in protecting shareholders’ interest through effective decision control. Some authors have also found that there is no significant relationship between proportion of NEDs and firm performance (Hermalin and Weisbach, 1991; Bhagat and Black, 2002). It has been shown that the effectiveness of a board depends on the optimal mix of inside and outside directors (Fama and Jensen, 1983; Baysinger and Butler, 1985; Baysinger and Hoskinsson, 1990; Baums, 1994). However, available theory is scanty on the determinants of optimal board composition (Weisbach, 2002). We measure the independence of the board by finding the ratio of NEDs to board size and we expect this to have a positive relationship with firm performance. Subsequently we test the following hypothesis: H2: Non-executive directors have a positive relationship with firm performance. Board activity intensity In this study, we introduce another variable namely the intensity of board activity as an important value-relevant board attribute in tandem with Vafeas (1999). A priori, the nature of the association between board activity intensity and firm performance is not clear. Some contend that board meetings are beneficial to shareholders. For instance Lipton and Lorsch (1992) suggest that “the most widely shared problem directors face is lack of time to carry out their duties”. In a similar argument, Conger et al (1998) suggest that board meeting time is an important resource for improving the effectiveness of a corporate board. The implication is that when boards of directors meet frequently, they are likely to enhance firm performance and thus perform their duties in accordance with shareholders’ interests. On the contrary, some have argued that board meetings are not necessarily useful in that the limited time NEDs spend together is not used for meaningful exchange of ideas among themselves or with management (Vafeas, 1999). This position has been recognized as a natural consequence of the fact that agenda
8

setting for such meetings is done by chief executive officers (Jensen, 1993). In addition, it is believed that routine tasks absorb much of the meetings and this limits opportunities for NEDs to exercise meaningful control over management and therefore boards should be relatively inactive, and rather being more active when there are corporate crises (Jensen, 1993). In view of the debate surrounding board meetings and its relationship with firm performance, the significance of board activity intensity is an open question. We measure the intensity of board activity by the frequency of meetings annually. Though, this is an open situation we test the following hypothesis: H3: The number of board meetings is negatively related to firm performance. CEO duality Considerable degree of attention has been devoted to the critical role of boards’ ability in monitoring managers and removing non-performing CEOs. Jensen (1993) shows a deep concern that a lack of independent leadership creates a difficulty for boards to respond to failure in top management. In this regard, Fama and Jensen (1983) also argue that concentration of decision management and decision control in one individual hinders boards’ effectiveness in monitoring top management. It is argued that there is conflict of interest and higher agency costs when a CEO doubles as board chair (Berg and Smith, 1978; Brickley et al., 1997) and this leads to the suggestion that the two positions should be occupied by two persons. Nonetheless, there is also the argument that when a CEO doubles as board chair, it affords the CEO the opportunity to carry out decisions and projects without undue influence of bureaucratic structures and in this regard it is expected that CEO duality should have a positive relationship with performance (Rechner and Dalton, 1991). However, empirical evidence is not conclusive. Sanda et al., (2005) show a positive relationship between firm performance and separating the functions of the CEO and board chair, while Daily and Dalton (1992) find no relationship between CEO duality and firm performance. We measure CEO duality as a dummy (equals unity when a CEO doubles as board chair and 0 otherwise) and expect a negative coefficient. H4: The separation of CEO and Board chair positions has a positive relationship with performance. CEO tenure It has been advanced that the tenure of the CEO constitutes another governance mechanism. How long should a CEO serve? In this study, we argue that when a CEO serves longer in a firm, it serves as an added incentive to promote the interest of shareholders due essentially to the fact that apart from job security, the CEO is afforded the opportunity to witness results of decisions taken. In this regard, longer tenure is expected to have a positive influence on performance, though some have indicated that a longer tenure enables CEOs to resort to empire-building with less focus on productive activities. We measure the tenure of the CEO by using the number of years a CEO serves in that capacity and subsequently test the following hypothesis: H5: Longer serving CEOs enhance firm performance. Audit committee and its characteristics In September 1998 in the US, the Wall Street Journal reported that in the previous year, some accounting irregularities were discovered that necessitated the restatement of
9

earnings of companies concerned2. This event stimulated interest in the effectiveness of audit committees as part of scheme of structures of corporate governance. The argument has been advanced that perhaps the audit committee is the most reliable entity to safeguard public interest. In addition to the recommendation by the Cadbury Commission that audit committees should be established, it is also recommended that audit committees should have minimum size of three members and should consist of solely NEDs. This feeds into the independence of such committees. Thus, it is posited that in an ideal case a strictly independent audit committee should consist of solely NEDs and non-affiliates of the company (directors who have previously worked in the company). Audit committees thus, represent another internal governance mechanism whose impact is to improve the quality of financial management of a company and hence its performance. However, very little empirical work has been done on the impact of audit committees on firm performance. Wild (1994) shows that markets react favourably to earning reports after the establishment of audit committees. In this study, we consider the size of audit committee (measured by number of members), its independence (measured by the ratio of non-executives directors/affiliates to size of audit committee), and also audit committee activity intensity (measured by the number of meetings per year). While we expect the size of audit committee to have a negative relationship with firm performance, we expect that both audit committee independence and number of meetings per year should have a positive correlation with firm performance. The following hypotheses will be tested: H6: The size of audit committee has a positive relationship with firm performance; H7: More NEDs on audit committees have positive relationship with firm performance; and, H8: Intensity of audit committee activities has a positive relationship with performance. Institutional ownership It has been argued that the nature of ownership of a firm also constitutes a dimension of its governance structure and should, therefore, influence performance. It is known that for places such as Australia, Belgium, Germany, and Italy, more than half of listed industrial companies have large blockholders who own at least 50% of such companies (Krivogorsky, 2006). While this is not common in the US, in Europe, it is contended that ownership is less dispersed and control rights are not fully separated from ownership. When there are large blockholders, mechanism are put in place to ensure equitable treatment of all shareholders. In this study, we consider institutional shareholding measured by the percentage volume of shares held by institutions. Institutions under such circumstances serve as extra monitoring device on the operations of the firm. It is therefore expected that institutional ownership should have a positive relationship with firm performance. Subsequently we test the following hypothesis: H9: Institutional shareholding is positively related to performance. We recognize the difficulty of adequately modelling firm performance and thus control for firm size (measured by the number employees), leverage (measured by the ratio of
2 “Accounting Firms Facing More Pressure From S.E.C.” Wall Street Journal, September 1, 1998, p. C5.
10

total debt to assets) and assets tangibility (measured by the ratio of fixed assets to total assets). 3.2 Analytical framework and empirical model specification We employ panel data framework for our analysis due basically to its advantage of allowing for more data points. The basic panel data model is of the form
ititit xy εαφ ++= / (1) Where φ is a constant, is a itx K -dimensional vector of explanatory variables and itε is the error term which is further decomposed into the following disturbance terms;
ititit u νε += (2) Estimation of the basic model could be done via several methodologies depending on the behaviour of the component of the error term and whether there exist serial correlation between the dependent variable and the disturbance term. Thus, one could employ the Ordinary Least Squares (OLS) estimation, the Random Effects (RE), the Fixed Effects (FE), or employ the Dynamic panel estimation methods. Indeed, we recognize the fact that there are other estimation methods in using panel data, however, invariably they all represent variants of the basic estimation methods. Hsiao (2003) and Klevmarken (1989) highlight some merits in the use of panel data as follows:
i. The use of Panel data controls for individual heterogeneity. The underlying principle of panel data is the assumption that firms, states or countries are heterogeneous. In time series and cross section analysis, this heterogeneity is not taken care of and this poses a threat because of the risk of obtaining biased results (Moulton, 1986, 1987).
ii. Unlike time series studies which is plagued with multi-collinearity issues, panel
data gives more informative data, more variability, less collinearity among the variables, more degrees of freedom and more efficiency.
iii. Panel data has the ability to study the dynamics of adjustment because cross-
sectional distribution that looks relatively stable conceals a lot of changes. It is again able to measure effects that are difficult to detect in pure cross-sectional or time-series data.
We employ panel data analysis because it is more suited for this study. 3.3 Empirical model For the purpose of our empirical analysis, we estimate the following dynamic panel model
titititi uZyy ,,1,, +′++= − ψλδ , (3) where, and ,................;............. 511031 == ti
11

tiy , is performance measures of ROA and Tobin’s q for firm i at time t, is a vector of explanatory variables of corporate governance indicators, control variables; and the error term shown by:
tiZ ,′
tiitiu ,, νµ += (4)
In equation (3), an autocorrelation problem occurs due to the presence of the lagged dependent variable among the regressors and individual effects characterizing the heterogeneity among the individuals. Thus, in carrying out our estimation we employ Arellano and Bond estimator which uses additional instruments and utilizes the othogonality conditions that exist between lagged values of and the disturbances
)(y 1-ti,
tiy , ti ,ν (Arellano and Bond, 1991). In this regard, the study adopts the Arellano and Bond (1991) Generalized Method of Moments (GMM) dynamic instrumental variable modelling approach, where the lagged values of the dependent variable (performance) and differences of the independent variables are used as valid instruments to control for this bias. The use of instruments is important because in the dynamic panel the lagged dependent variable [ ] will be correlated with the lagged error terms [ ] by construct and induces the possibility of endogeneity of some explanatory variables. Based on the following assumptions; no serial correlation in the error terms and weak exogeneity of explanatory variables, the following moments condition applies
1−− itit yy 1−− itit ee
( )[ ] 011 =− −− ititit eeyE 2≥y
011
(5)
( )[ ] =− −− ititit eezE 2≥y (6) where is a set of explanatory variables. itz Arellano and Bond’s (1991) GMM estimation is based on these moment conditions and is consistent if lagged values of explanatory variables are valid instruments. The validity of the use of instruments is checked using a Sargan test for over-identified restrictions which tests for correlation between the instruments and the model residuals.
12
4. Empirical findings
4.1 Descriptive statistics3
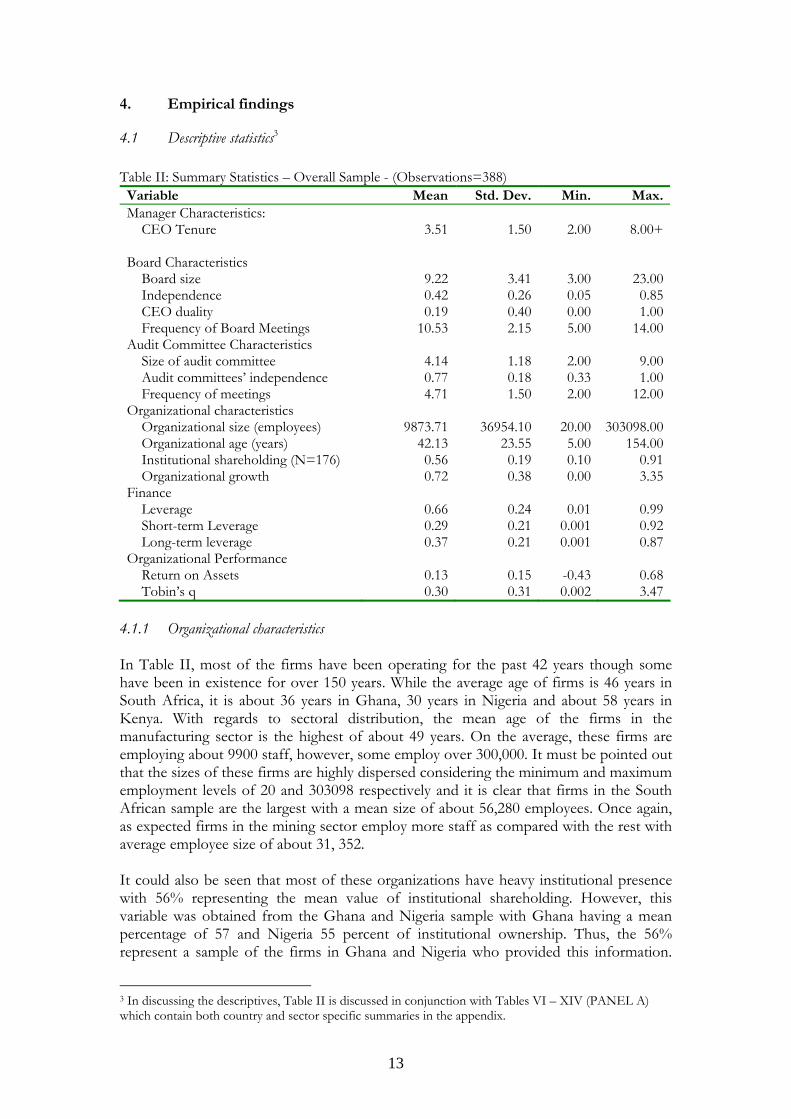
Table II: Summary Statistics – Overall Sample - (Observations=388) Variable Mean Std. Dev. Min. Max.Manager Characteristics: CEO Tenure
3.51
1.50
2.00
8.00+
Board Characteristics Board size Independence CEO duality Frequency of Board Meetings
9.22 0.42 0.19
10.53
3.41 0.26 0.40 2.15
3.00 0.05 0.00 5.00
23.00 0.85 1.00
14.00Audit Committee Characteristics Size of audit committee Audit committees’ independence Frequency of meetings
4.14 0.77 4.71
1.18 0.18 1.50
2.00 0.33 2.00
9.00 1.00
12.00Organizational characteristics Organizational size (employees) Organizational age (years) Institutional shareholding (N=176) Organizational growth
9873.71
42.13 0.56 0.72
36954.10
23.55 0.19 0.38
20.00 5.00 0.10 0.00
303098.00
154.00 0.91 3.35
Finance Leverage Short-term Leverage Long-term leverage
0.66 0.29 0.37
0.24 0.21 0.21
0.01
0.001 0.001
0.99 0.92 0.87
Organizational Performance Return on Assets Tobin’s q
0.13 0.30
0.15 0.31
-0.43 0.002
0.68 3.47
4.1.1 Organizational characteristics In Table II, most of the firms have been operating for the past 42 years though some have been in existence for over 150 years. While the average age of firms is 46 years in South Africa, it is about 36 years in Ghana, 30 years in Nigeria and about 58 years in Kenya. With regards to sectoral distribution, the mean age of the firms in the manufacturing sector is the highest of about 49 years. On the average, these firms are employing about 9900 staff, however, some employ over 300,000. It must be pointed out that the sizes of these firms are highly dispersed considering the minimum and maximum employment levels of 20 and 303098 respectively and it is clear that firms in the South African sample are the largest with a mean size of about 56,280 employees. Once again, as expected firms in the mining sector employ more staff as compared with the rest with average employee size of about 31, 352. It could also be seen that most of these organizations have heavy institutional presence with 56% representing the mean value of institutional shareholding. However, this variable was obtained from the Ghana and Nigeria sample with Ghana having a mean percentage of 57 and Nigeria 55 percent of institutional ownership. Thus, the 56% represent a sample of the firms in Ghana and Nigeria who provided this information.
3 In discussing the descriptives, Table II is discussed in conjunction with Tables VI – XIV (PANEL A) which contain both country and sector specific summaries in the appendix.
13
Once again, the agriculture sector is dominant with regards to institutional shareholding with a mean percent of 72. Given the fact that institutional shareholding was obtained in the Ghana and Nigeria sample, it is understandable that the agriculture sector is dominant. This may be due to the agrarian nature of these economies. The mean growth value of these organizations is 72% though some experienced no growth at certain points during the period under study. Firms in South Africa appear to be growing faster (58%) than the rest of the firms in the other countries. On sectoral basis, the mining sector is the pace setter in terms of growth (60%) as compared to 19%, 23%, 22% and 24% representing the Industrial, Manufacturing, Agriculture and Services sectors respectively. 4.1.2 Financing issues While, most of the organizations depend on debt as against equity for financing, long-term debt relatively represents the major component of total debt in the overall sample. Furthermore, while firms in Nigeria and Kenya rely heavily on long-term debt as a financing scheme, firms in Ghana and South Africa on the other hand use more of short-term debt to finance their operations. This is more surprising because South Africa with a more developed financial market is expected to have more long tem debts as compared to the other countries. Expectedly, the agriculture sector has the lowest ratio with regards to long term financing. While all the sectors depend more on long term debts, the mining sector has equal ratio of short and long term debts for their operations. 4.1.3 Organizational performance By comparing accounting and market based performance measures, it seems the firms are relatively doing better on the market based measure. While the mean value of ROA is 0.13, that of Tobin’s q is 0.30 indicating an average return on assets of 13%. Expectedly, firms in South Africa with a relatively developed corporate governance structure are ahead of the others in terms of performance. Using ROA, Nigeria appears to match the performance of South Africa. Whiles, all the countries are relatively matched using Tobin’s q, Kenya recorded the lowest mean value of 6% on ROA. The mining sector appears to outperform the other sectors with regards to Tobin’s q (a market based performance measure). This suggests that there is a growing interest in the mining sector revealed by people’s preference for such shares and stocks thereby increasing share price. Again, the sector jointly dominates performance using ROA with the agricultural sector. 4.1.4 Governance characteristics The mean board size is 9 with a maximum of 23 directors. The standard deviation of 3.41 suggests that there is rather a wide dispersion. South Africa appears to have the largest mean board size of about 14. Ghana has a mean board size of 8, Nigeria, about 9 and Kenya, about 8. While, the maximum Board size is 23 in South Africa, it is 14 in Nigeria and 13 each in Ghana and Kenya. The results also show that most of the mining firms in the sample have the largest mean board size of about 14 with the services sector having the lowest mean board size of about 7. In the overall sample these boards are relatively less independent as they are mostly dominated by executive directors according to John and Senbet (1998). The mean value of 0.42 for board independence suggests that on the average about 58% of these boards are made up of executive directors. This situation is driven mostly by the Ghana and Kenya samples with a mean board independence of 24% and 20% for Ghana and Kenya
14

respectively. However, some of these boards could be said to be highly independent with 85% of their membership being constituted of non-executive directors. The study shows however that corporate boards in South Africa and Nigeria are largely dependent constituted mostly by NEDs. Again, apart from the mining and the agriculture sectors which have relatively independent boards, the rest of the sectors generally have less independent boards. Most of these boards in the overall sample largely have their positions of CEO and board chair separated with only about 19% of the firms whose boards have the CEO and board chair positions entrusted in the same personality. However small it may be, recent thinking has shown that the appointment of one person into these two key positions has serious repercussions for agency costs and firm performance. Situations like that generate enormous conflict of interest because decision control and decision management functions are all embedded in the same person. The King Reports clearly indicate how these two positions should be separated likewise other regulatory frameworks of corporate governance in these countries. Further analysis shows that in South Africa, there is a clear separation of the positions of the board chair and CEO. None of the firms in the South African sample have the positions of the board chair and CEO occupied by the same person. Thus, the 19% reported above is mostly driven by the firms in the Ghana, Nigeria and Kenya samples. Hence, 39% of firms in the Ghanaian sample have the same person as both the CEO and board chair; 16% of firms in the Nigerian sample and 17% in the Kenyan sample. It could be pointed out that there are greater conflicts of interest with regards to firms Ghana where as much as 39% of sampled firms have decision control and decision management embedded in the same personality. With an annual mean frequency of meetings of about 11, one could say that these boards are relatively busy meeting almost on monthly basis throughout the year. The sub-sample analysis shows that boards in the South African sample have rather been meeting more frequently with a mean frequency meeting of 12 times. Boards in Ghana have a meeting frequency of about 10, those of Nigeria about 10 and Kenya about 11. It is also obvious that firms in the mining industry have a higher meeting frequency of 12 in a year. The rest of the sectors appear evenly matched. The question is, does this improve performance or they are meetings that were necessitated by corporate crisis? More light could be shed on this in the regression analysis. The audit committees of these firms have sizes ranging between 2 and 9 with a mean size of about 4 members. Indeed, the mean size of 4 is representative of all firms in the sampled countries except South Africa where the mean size of audit committees is about 6. This is once again reflected in the sectors where apart from the services and mining sectors the mean size of audit committees for the industrial, manufacturing and the agriculture sectors is about 4. Whiles, the size of audit committees in the mining sectors is about 6, that of the services sector is about 3. Most of these audit committees both at country and sector levels are dominated by non-executive directors and non-affiliates of these organizations. Thus, one could say that to a large extent these firms have independent audit committees. Unlike the boards, the audit committees have a mean annual meeting frequency of about 5 suggesting that the audit committees may be meeting on quarterly basis to attend to business of interest. There is not much deviation from this mean value at both country and sector levels. Not explained by anything, some of these audit committees meet virtually on monthly basis for the entire year. The high meeting frequency of some of the audit committees coupled with some boards meeting
15

14 times in the year suggest that these meetings are for problem solving and could essentially be due to corporate crisis.
4.2 Discussion of regression results4 Board characteristics and activity intensity Table III (overall sample) shows the model results of the interaction between performance variables and board characteristics including board activity intensity. Contrary to expectations, the board size has a positive effect on both performance variables. Whiles it is statistically insignificant in the case of return on assets, it is significant for Tobin’s q. The results corroborates other studies that suggest that having a larger board size enhances the performance of a firm because they have a range of expertise to help make better decisions, and are harder for a powerful CEO to dominate. In this context, we could presume that in the wake of privatization, political appointments to corporate boards (in some countries) making them large may be waning and that board members are largely appointed on the basis of merit and therefore bring their expertise on board to enhance firm performance. With respect to the country estimations, all the countries except Ghana showed a positive relationship between the size of the board and both performance measures. Whiles, most of the estimations except South Africa for ROA were insignificant at 5 percent; results for Ghana showed a significant negative relationship between board size and Tobin’s q. This suggests that, the largely positive relationship seen the overall sample between performance and board size was largely driven by South Africa, Nigeria and Kenya. The case of the Ghanaian sample also confirms earlier studies that large boards generally have negative effect on firm value due primarily to issues of free-ridership and relative difficulty in consensus building; hence suggesting that these problems could be more inherent in the Ghanaian system. In tandem with other studies (Fama, 1980: John and Senbet, 1998) the appointment of NEDs make such boards more independent and enable them act as “professional referees” to ensure that competition among executive directors stimulates actions consistent with firm value maximization. While, most of the country specific estimates showed insignificant results, the Ghanaian sample showed once again, a significant negative relationship between the appointment of more NEDs and Tobin’s q. This could probably be due to the fact that perhaps a lot of NEDs in Ghana are political appointees (because of state ownership of shares in a lot of firms) whose appointment therefore sends no positive signal to the relatively small investment community to stimulate the expected reaction. In the overall sample, though, the CEO duality is not significant in explaining the variation in Tobin’s q, it has a negative relationship with ROA consistent with other studies (Berg and Smith, 1978; Brickley et al, 1997; Sanda et al 2005). However, the country specific estimates shows a significant negative relationship between CEO duality and ROA in the Nigerian sample while showing a significant negative relationship between CEO duality and Tobin’s q in the Kenyan sample. This is because when the same person holds the positions of board chair and CEO, it results in conflict of interest and increases agency cost which has the potential to stifle performance. This is also
4 In discussing the regression results, Table III is discussed in conjunction with Tables XV – XVII (PANEL B) which contain country specific estimates in the appendix.
16

consistent with recommendations made in King Report that there should be a clear separation of these two key positions in any organization to ensure accountability and effective monitoring so as to improve performance. Indeed, the Securities and Exchange Commission of Ghana also highlights this situation likewise the Institute of Directors (IoD). This is in direct contradiction with the suggestion that the combination of the two positions by the same individual rather enhances performance due to the seemingly absence of undue bureaucracy regarding decision-making and implementation. The organizational tenure of the CEO has a positive relationship with ROA but is insignificant in explaining Tobin’s q in the overall sample. The tenure of the CEO indeed influences firm’s investment decisions. The country specific estimates largely showed insignificant results. Results of the study contradicts studies that have shown that a long tenure does not augur well for firm performance as the CEO spends energy and time building empire to control. However, we could argue that a longer tenure not only gives job security, but influences a CEO’s performance with the realization that the likelihood of the outcome of the CEO’s decisions in terms on investment in projects could be witnessed by the CEO. Hence, CEOs under such circumstances are likely to be proactive and magnanimous in their decisions because of the psychological influence. The frequency of board meetings as a measure of board activity intensity, though insignificant, has a negative relationship with ROA but very weak positive relationship with Tobin’s q in the overall sample. The negative relationship between frequency of board meetings and ROA in the overall sample was largely influenced by the Nigerian and Kenyan samples. Against the backdrop of high board meetings seen from the descriptive statistics; we could presume that such meetings were mainly due to corporate crisis. The results also confirms studies by Jensen (1993) who argues that board meetings do not necessarily enhance firm performance and that board meeting frequency increases when there are problems. Though, largely insignificant in the overall sample, results show a significant positive relationship between board activity intensity and Tobin’s q in the Ghanaian sample. Apart from the size of the firm which shows the expected sign having a positive impact on performance, asset tangibility and leverage rather show unexpected signs. The findings of the relationship between leverage and performance (ROA) is inconsistent with Bos and Fetherston (1993) who argue that the level of total debt to total assets of a firm has a positive influence on profitability of the firm. The case of the assets tangibility could however be explained because assets in themselves do not promote efficiency if they are not managed and turned in a profitable manner. For instance, one of the leading banks in Ghana with a huge assets base has been performing relatively poorer than other banks with relatively smaller asset tangibility. The results also show that while firms that have been profitable are likely to continue to be profitable, market valuation of a firm today does not necessarily depend on its past market valuation but could be as a result of other factors. This is shown by the negative influence of a firm’s previous Tobin’s q on current performance.
17

Table III: The Effect of Board Characteristics Overall Sample - (N=333)5
Independent variables Dependent Variables Return on Assets (ROA) Tobin’s q (Tob q) ROA lagged (-2) 0.1453
(2.70)**
ROA lagged (-1) -0.0301 (-0.57)
Tob q lagged (-2) -0.0417 (-0.81)
Tob q lagged (-1) -0.1437 (-2.71)**
Log of board size 0.0212 (0.82)
0.0535 (2.70)**
Board independence 0.1404 (3.60)**
0.0770 (0.75)
CEO duality -0.0474 (-2.06)**
0.0370 (0.80)
Tenure of CEO 0.0.0230 (3.81)**
-0.0047 (-0.38)
Frequency of board meetings -0.0049 (-1.30)
0.0029 (0.37)
Log of firm size 0.0176 (2.68)**
0.0182 (1.35)
Assets tangibility -0.1107 (-4.14)**
-0.0745 (-1.39)
Leverage -0.1637 (-4.26)**
-0.0014 (-0-02)
Constant 0.0013 (2.22)**
0.0023 (1.91)**
Wald Chi2(10) 197.37 31.44 Note: All regressions include a constant and ** indicates significance at 5% level. Audit committee characteristics The regression results reported in Table IV show that the size of audit committee has a positive influence on both accounting based measure of performance (ROA) and market based performance measure (Tobin’s q) in the overall sample. Indeed, the size of the audit committee could be an indication of the seriousness attached to issues of transparency by the organization and this sends the right signal to the public who then develop confidence in the organization. Again, Watts and Zimmerman (1986) indicates that there is the tendency for large firms to make accounting choices which reduces the probability of regulatory scrutiny and also cite other literature documenting the penchant for firms to make accounting choices aimed at smoothing out reported income. In this circumstance, the presence and to some extent the size of the audit committee is an assurance mechanism to promote fairness. It is however, interesting to note that in the Ghanaian sample the size of the audit committee showed a negative effect on ROA and significantly on Tobin’s q. The reason could be free-ridership and difficulty in consensus building in large groups.
5 All models pass the diagnostic testing of validity of instruments via Sargan Test and second order serially correlated errors via AR tests. Results are not shown for brevity.
18

The independence of the audit committee however does not show any significant relationship with the performance measures in the overall sample. Significantly however, the sub-sample results show that the independence of audit committee have negative effect on Tobin’s q in the Ghanaian and Nigerian samples. This suggests that it is probably critical to appoint people with the technical expertise and those who have had something to do with an organization and know the terrain to ensure that there is value creation. The frequency of audit committee meetings (activity intensity) has a positive and significant relationship with market based performance measure of Tobin’s q but seems to have no relationship with ROA (an accounting based performance measure) in the overall sample. The positive effect on Tobin’s q is apparently driven by the South African and Nigerian samples. What is the reason? It could be due primarily to the fact that audit committees are generally perceived to serve the interest of shareholders and the public at large. Thus, when they meet frequently it further re-affirms the position of the organization in dealing with transparency and working to promote shareholder value. Also, it has been argued by Menon and Williams (1994) that for audit committees to be effective monitors, it is not enough just to be independent and that they must be active (measured by the frequency of their meetings). Interestingly, the frequency of audit committee meetings has a significant negative effect on ROA in the Ghanaian sample. This, coupled with the high board meetings reaffirms the fact that probably most of these meetings were for crisis fixing. The control variables as well as lagged values of the dependent variables show similar signs and significance like the previous discussion. Table IV: The Effect of Audit Committee Characteristics – Overall Sample - (N=333)6
Independent Variables Dependent Variables Return on Assets (ROA) Tobin’s q (Tob q) ROA lagged (-2) 0.2354
(4.57)**
ROA lagged (-1) 0.0481 (0.96)
Tob q lagged (-2) -0.0582 (-1.17)
Tob q lagged (-1) -0.1590 (-3.10)**
Audit committee size 0.0309 (2.20**
0.0401 (1.42)
Independence of audit committee
0.0977 (1.16)
-0.2157 (-1.26)
Freq. of audit c’mtte meetings -0.0006 (-0.10)
0.0166 (1.56)**
Log of size 0.0193 (2.96)**
0.0046 (0.35)
Asset tangibility -0.1005 (-3.78)**
-0.0442 (-0.85)
Leverage -0.2129 (-5.75)**
-0.0134 (-0.18)
Constant 0.0011 (2.32)**
0.0022 (2.31)**
Wald Chi2(8) 169.95 50.01 Note: All regressions include a constant and ** indicates significance at 5% level 6 All models pass the diagnostic testing of validity of instruments via Sargan Test and second order serially correlated errors via AR tests. Results are not shown for brevity.
19

Effect on institutional shareholding Institutional shareholding surprisingly has different influence on performance depending on whether it is an accounting based or market based measure. In both Ghanaian and Nigerian samples, institutional shareholding has a significant negative relationship on ROA but positive effect on Tobin’s q. What is the missing link? When institutions have more shares in a company it tends to stifle performance as the results show in Table V. This however could be explained by the fact that institutions having shares in a firm does not necessarily help the firm to be efficient. What could be relevant is the level of involvement and influence such institutions have on the firms in which they own shares. However, institutional shareholding is a key signal to other investors of the potential profitability of the firm. This leads to demand for such shares and thus improves market valuation of such firms. Hence, though surprising, the results points to an intuitive event that occurs in everyday life. Table V: The Effect of Institutional Shareholding – Overall Sample - (N=156)7
Independent Variables Dependent Variables Return on Assets (ROA) Tobin’s q (Tob q) ROA lagged (-1) -0.1811
(-2.69)**
Tob q lagged (-1) -0.0367 (-0.67)
Institutional shareholding -0.1962 (-3.49)**
0.3233 (3.04)**
Log of size 0.0220 (2.89)**
0.0531 (3.65)**
Asset tangibility 0.0036 (0.07)
-0.0330 (-0.35)
Leverage -0.1131 (-3.02)**
-0.1314 (-1.83)**
Constant -0.0033 (-1.52)**
-0.0026 (-0.62)
Wald Chi2(5) 28.22 31.29 Note: All regressions include a constant and ** indicates significance at 5% level 5.0 Conclusion The relevance of corporate governance cannot be over-emphasized since it constitutes the organizational climate for the internal activities of a company. Corporate governance brings new outlook and enhances a firm’s corporate competitiveness. The study examined the effect of corporate governance on the performance of firms in selected African countries by using both market and accounting based performance measures. Results show that the mean board size of the sample was 9 members but there are wide variations in this variable. These boards are also deemed to be relatively less independent with about 58% of their composition being made of executive directors in the overall sample and there is also a clear separation of the functions of the CEO and board chair. The boards of the sampled firms furthermore appear very busy with a mean annual meeting frequency of 11. In addition, the firms also have relatively independent audit committees who appear to meet on quarterly basis.
7 All models pass the diagnostic testing of validity of instruments via Sargan Test and second order serially correlated errors via AR tests. Results are not shown for brevity.
20

The regression results show further that the direction and the extent of impact of governance is dependent on the performance measure being examined. Results show that large boards enhance corporate performance and that when such boards are dominated by non-executive directors, it enhances firm value. Whiles, the CEO duality does not significantly impact on market based performance measure of Tobin’s q, it has a negative relationship with firm profitability in tandem with other studies. We also find that CEO’s tenure in office enhances a firm’s profitability and also board activity intensity has a negative effect on profitability consistent with other studies. Furthermore, the size of audit committees and the frequency of their meetings have positive influence on Tobin’s q (a market based performance measure) but seem to have no significant relationship with firm’s profitability. Likewise, it is seen that institutional shareholding essentially sends a positive signal to potential investors and that enhances market valuation of firms. The study also showed that both country and sector specific effects have impact on the direction and the extent of impact of governance on performance. From the foregoing analysis, it is evident that corporate governance has an influence on a firm’s performance. Indeed, while some of our findings are revealing, clear policy implications should not be lost. For enhanced performance of corporate entities, it is important to separate positions of CEO and board chair and also firms should be encouraged to maintain relatively independent audit committees. We would however like to indicate that, in trying to examine the link between corporate governance and firm performance, it would have been appropriate to use a broader spectrum of variables. The data which dates back to 2001 also constitute another limitation of our study. We would however wish to state that, these limitations do not compromise on the validity of conclusion drawn based on the results. References
Abrams, F W (1951): “Management’s Responsibilities in a Complex World”, Harvard Business Review, 29, 54-64 Akinboade, A. O and Okeahalam, C. C (2003): “A Review of Corporate Governance in Africa: Literature, Issues and Challenges”, A Paper Presented at the Global Corporate Governance Forum, June 15 Arellano, M. and Bond, S (1991): “Some Tests of Specification for Panel Data: Monte Carlo Evidence and an Application to Employment Equations”, Review of Economic Studies, 58, 277-297 Ayogu, M (2001): “Corporate Governance in Africa: The Record and Policies for good Governance”. African Development Bank, Economic Research Paper, No.66. Bathala, C T and Rao, R P (1995): “The Determinants of Board Composition: An Agency Theory Perspective”, Managerial and Decision Economics, 16, 59-69 Baums, T (1994): Corporate Governance in Harmony-system & Recent Developments, in M. Issakson & R. Skog (Eds.) Aspects of corporate Governance, Stockholm: Jurist
21

Baysinger, B D and Butler, H N (1985): “Corporate Governance and the Board of Directors: Performance Effects of Changes in Board Composition”, Journal of Law, Economics and Organization, 1, 101-124. Baysinger, B and Hoskinsson, R E (1990): “The Composition of the Board of Directors & Strategic Control: Effects of Corporate Strategy”, Academy of Management Review, 15, 72-87. Berg, S V and Smith, S R (1978): “CEO & Board Chairman: A Quantitative Study of Dual versus Unitary Board Leadership”, Directors & Boards, Spring, 34-39. Berle, A A and Means, G C (1932): The Modern Corporation and Private Property, Macmillan, New York. Bhagat, S and Black, B (2002): “The Non-Correlation between Board Independence and Long-Term Firm Performance”, Journal of Corporation Law, 27(2), 231-273. Blair, M M (1995): Ownership and Control: Re-thinking Corporate Governance for the Twenty-first Century. Brookings Institutions Press, USA Bos, T and Fetherston, T A (1993): “Capital Structure Practices on the Specific Firm”, Research in International Business and Finance, 10, 53-66 Brickley, J A, Coles, J L and Jarrell, G (1997): “Leadership Structure: Separating the CEO and Chairman of the Board”, Journal of Corporate Finance, 3(3), 189-220. Brickley, J A, Coles, J L and Terry, R L (1994): “Outside Directors and the Adoption of Poison Pills”, Journal of Financial Economics, 35, 371-390. Brickley, J A and James, C M (1987): “The Takeover Market, Corporate Board composition, and Ownership Structure: The Case of Banking”, Journal of Law and Economics, 30, 161-181. Byrd, J W and Hickman, K A (1992): “Do outside Directors Monitor Managers: Evidence form Tender Offer Birds”, Journal of Financial Economics, 32(2), 195-221. Byrne, J (1996): “Listen Up: The National Association of Corporate Directors’ New Guidelines Won’t Tolerate Inattentive, Passive, Uninformed Board Members. Business Week, November 25 Cadbury, S A (1992): Report of the Committee on the Financial Aspects of Corporate Governance. Gee Ltd. (Professional Publishing Ltd.), London Chung, K H, Wright, P and Kedia, B B (2003): “Corporate Governance and Market Valuation of Capital and R&D Investment”, Review of Financial Economics, 12, 161-172 Conger, J, Finegold, D and Lawler III, E (1998): “Appraising Boardroom Performance”, Harvard Business Review, 76, 136-148
22

Cotter, J, Shivdasani, A and Zenner, M (1997): “Do Independent Directors Enhance Target Shareholder Wealth during Tender Offers?”, Journal of Financial Economics, 43, 195-218 Daily, C M and Dalton, D R (1992): “The Relationship Between Governance Structure and Corporate Performance in Entrepreneurial Firms”, Journal of Business Venturing, 7(5), 375-386. Davis, J H, Schoorman, F D and Donaldson, L (1997): “Toward a Stewardship Theory of Management”, Academy of Management Review, 22(1), 20-47 Deakin, S and Hughes, A (1997): “Comparative Corporate Governance: An Interdisciplinary Agenda”, in Enterprise and Community: New Directions in Corporate Governance, Deakin, S. and Hughes, A. (Eds.), Blackwell Publishers, Oxford, UK. Demsetz, H. and Villalonga, B (2001): “Ownership Structure and Corporate Performance”, Working Paper, UCLA Dharwardkar, R, George, G and Brandes, P (2000): “Privatization in Emerging Economies: An Agency Perspective”, Academy of Management Review, 25(3), 650-669 Donaldson, L and Davis, J H (1991): “Stewardship Theory or Agency Theory: CEO Governance and Shareholder Returns”, Australian Journal of Management, 16(1), 50-65 Eisenberg, T, Sundgren, S and Wells, M (1998): “Larger Board Size and Decreasing Firm Value in Small Firms”, Journal of Financial Economics, 48, 35-54 Faccio, M and Lasfer, M A (2000): “Managerial Ownership and Firm Value: U.K. Evidence”, Working Paper, City University Business School Fama, E F (1980): “Agency Problems and the Theory of the Firm”, Journal of Political Economy, 88, 134-145 Fama, E F and. Jensen, M C (1983): “Agency Problems and Residual Claims”, Journal of Law and Economics, 26, 327-349. Freeman, R E, Wicks, C A and Parmar, B (2004): “Stakeholder Theory and The Corporate Objective Revisited”, Organization Science, 15(3), 364-369 Gani, L and Jermias, J (2006): “Investigating the Effect of Board Independence on Performance Across Different Strategies”, The International Journal of Accounting, 41, 295-314 Hermalin, B and Weisbach, M (1991): “The Effects of Board Composition and Direct Incentives on Firm Performance”, Financial Management, 20(4), 101-112 Himmelberg, C P, Hubbard, R G and Palia, D (1999): “Understanding the Determination of Managerial Ownership and the Link between Ownership”, Journal of Financial Economics, 53, 353-384
23

Hossain, M, Cahan, S F and Adams, M B (2000): “The Investment Opportunity Set and the Voluntary Use of Outside Directors: New Zealand Evidence”, Accounting and Business Research, 30(4), 263-273 Hsiao, C (2003): Analysis of Panel Data. Cambridge University Press, Cambridge. Hutchinson, M (2002): “An Analysis of the Association between Firms’ Investment Opportunities, Board Composition, and Firm Performance”, Asia Pacific Journal of Accounting and Economics, 9, 17-39 Jensen, M (2001): “Value maximization, Stakeholders Theory and the Corporate Objective Function”, Journal of Applied Corporate Finance, Fall 2001 Jensen, M C (1993): “The Modern Industrial Revolution, Exit, and the Failure of Internal Control Systems”. Journal of Finance, 48(3), 832-880 Jensen, M C and Meckling, W H (1976): “Theory of the Firm: Managerial Behaviour, Agency Costs, and Ownership Structure”, Journal of Financial Economics, 3, 305-350. John, K and Senbet, L W (1998): “Corporate Governance and Board Effectiveness” Journal of Banking and Finance, 22, 371-403 Judge, Q W, Naoumova, I and Koutzevol, N (2003): “Corporate Governance and Firm Performance in Russia: An Empirical Study”, Journal of World Business, 38, 385-396 Keasey, K, Thompson, S and Wright, M (1997): “Introduction: The Corporate Governance Problem-Competing Diagnoses and Solutions” In Keasey, K., Thompson, S. and Wright, M. (Eds.), Corporate Governance: Economics, Management, and Financial Issues. Oxford University Press, Oxford, UK. King Report, 1994, 2002. Corporate Governance for South Africa Klevmarken, N A (1989): “Panel Studies: What can we learn from them? Introduction” European Economic Review, 33, 523-529 Krivogorsky, V (2006): “Ownership, Board Structure, and Performance in Continental Europe”, The International Journal of Accounting, 41, 176-197 Kyereboah-Coleman, A and Biekpe, N (2006a): “Do Boards and CEOs Matter for Bank Performance? A Comparative Analysis of Banks in Ghana”, Journal of Corporate Ownership and Control, 4(1): 119-126 Kyereboah-Coleman, A and Biekpe, N (2006b): “The Link between Corporate Governance and Performance of the Non-Traditional Export Sector: Evidence from Ghana”, Corporate Governance, 6 (5): 609-623 Kyereboah-Coleman, A and Biekpe, N (2006c): “Corporate Governance and Financing Choices of Firms: A Panel Data Analysis”, South African Journal of Economics, 74(4): 670-681
24

Kyereboah-Coleman, A, Adjasi, K D C and Abor J (2006): Corporate Governance and Firm Performance: Evidence from Ghanaian Listed Firms”, Journal of Corporate Ownership and Control, 4(1): 123-132 Lang, L and Stulz, R (1994): “Tobin’s Q, Corporate Diversification, and Firm Performance”, Journal of Political Economy, 102, 1248-1280 Lee, C, Rosenstein, S, Rangan, N and Davidson III, W N (1992): “Board Composition and Shareholder Wealth: The Case of Management Buyouts”, Financial Management, 21, 58-72 Lipton, M and Lorsch, J W (1992): “A Modest Proposal for Improved Corporate Governance”, Business Lawyer, 48, 59-77 Mayer, F (1997): “Corporate Governance, Competition, and Performance”, in Enterprise and Community: New Directions in Corporate Governance, Deakin, S. and Hughes, A. (Eds.), Blackwell Publishers, Oxford, UK. McAvoy, P W, Cantor, S, Dana, J and Peck, S (1983): “Statement of the Business Roundtable on the American Law Institute’s Proposed” Principles of Corporate Governance and Structure: Restatement and Recommendations. New Haven, CT: ALI McDonald, D and Puxty, A G (1979): “An Inducement – Contribution Approach to Corporate Financial Reporting”, Accounting, Organization and Society, 4(1/2), 53-65 Menon, K and Williams, J D (1994): “The Use of Audit Committees for Monitoring”, Journal of Accounting and Public Policy, 13, 121-139 Monks, A G and Minow, N (2001): Corporate Governance, 2nd Edition. Blackwell Publishers Monks, R A G and Minow, N (1995): “Corporate Governance on Equity Ownership and Corporate Value”, Journal of Financial Economics, 20, 293 Moulton, B R (1987): “Diagnostics for Group Effects in Regression Analysis”, Journal of Business and Economic Statistics, 5, 275-282 Moulton, B R (1986): “Random Group Effects and the Precision of Regression Estimates”, Journal of Econometrics, 32, 385-397 Muth, M and Donaldson, L (1998): “Stewardship Theory and Board Structure: A Contingency Approach”, Corporate Governance, 6(1), 5 Park, Y W and Shin, H H (2003): “Board Composition and Earning Management in Canada”, Journal of Corporate Finance, 185, 1-27 Prevost, A K, Rao, R P and Hossain, M (2002): “Determinants of Board Composition in New Zealand: A Simultaneous Equation Approach”, Journal of Empirical Finance, 9, 373-397 Rechner, P L and Dalton, D R (1991): “CEO Duality and Organizational Performance: A Longitudinal Analysis”, Strategic Management Journal, 12(2), 155-160
25
Rosenstein, S and Wyatt, J C (1990): “Outside Directors, Board Effectiveness and Shareholders Wealth”, Journal of Financial Economics, 26, 175-191 Sanda, A U, Mukaila, A S and Garba, T (2005): “Corporate Governance Mechanisms and Firm Financial Performance in Nigeria”, AERC Research Paper, No. 149 Short, H, Keasey, K, Hull, A and Wright, M (1999): “Corporate Governance: From Accountability to Enterprise”, Accounting and Business Research, 29, 337-352 Singh, M and Davidson III, W N (2003): “Agency Costs, Ownership Structure and Corporate Governance Mechanisms”, Journal of Banking and Finance, 27, 793-816 Steiner, I D (1972): Group Process and Productivity. Academic Press, New York Tricker, R. (1984): Corporate Governance. Gower Publishing Company Vafeas, N (1999): “Board Meeting Frequency and Firm Performance”, Journal of Financial Economics, 53, 113-142 Watts, R L and Zimmerman, J L (1990): “Positive Accounting Theory: A Ten Year Perspective”, The Accounting Review, 65, 131-156 Weisbach, M S (1988): “Outside Directors and CEO Turnover”, Journal of Financial Economics, 20, 431-460. Wild, J J (1994): “Managerial Accountability to Shareholders: Audit Committees and the Explanatory Power of Earnings for Returns”, British Accounting Review, 26, 353-374 Yermack, D (1996): “Higher Market Valuation of Companies with Small Board of Directors”, Journal of Financial Economics, 40, 185-213 Young, B (2003): “Corporate Governance and Firm Performance: Is there a Relationship?”, Ivey Business Journal Online, 1-4
26

APPENDIX: PANEL A - Country Specific Summary Table VI: South Africa Variable Mean Std. dev. Min. Max. Manager Characteristic CEO tenure
5.50
1.66
4
8+
Board Characteristics Board size Independence CEO duality Frequency of board meetings
14.32 0.59 0 12
4.31 0.22 0 0.33
6 0.05 0 10
23 0.85 0 13
Audit Committee Characteristics Size of audit committees Audit committees’ independence Frequency of meetings
5.89 0.55 4.18
1.57 0.17 0.39
3 0.33 4
9 1 5
Organizational characteristics Organizational size (employees) Organizational age Institutional shareholding Organizational growth
56,279.59 46.11 0.58
83,498.25 27.32 0.72
800 15 0.01
303,098 113 3.35
Finance Leverage Short-term leverage Long-term leverage
0.62 0.32 0.30
0.26 0.17 0.23
0.05 0.003 0.001
0.99 0.71 0.80
Organizational performance Return on Assets Tobin’s q
0.18 0.37
0.14 0.51
-0.015 0.002
0.68 3.47
Table VII: Ghana Variable Mean Std. dev. Min. Max. Manager Characteristic CEO tenure
4.22
1.48
2.00
8.00
Board Characteristics Board size Independence CEO duality Frequency of board meetings
8.39 0.24 0.39 10.34
1.81 0.11 0.49 2.24
5.00 0.09 0 5.00
13.00 0.40 1.00 14.00
Audit Committee Characteristics Size of audit committees Audit committees’ independence Frequency of meetings
4.06 0.78 5.39
0.85 0.17 1.88
3.00 0.60 4.00
5.00 1.00 10.00
Organizational characteristics Organizational size (employees) Organizational age Institutional shareholding Organizational growth
918.33 35.72 0.57 0.32
725.78 15.76 0.19 0.29
180.00 6.00 0.25 0.01
2,500.00 71.00 0.90 1.36
Finance Leverage Short-term leverage Long-term leverage
0.72 0.42 0.31
0.13 0.14 0.12
0.33 0.14 0.02
0.96 0.83 0.65
Organizational performance Return on Assets Tobin’s q
0.13 0.30
0.12 0.27
-0.14 0.002
0.54 0.99
27

Table VIII: Nigeria Variable Mean Std. dev. Min. Max. Manager Characteristic CEO tenure
2.64
0.80
2.00
4.00
Board Characteristics Board size Independence CEO duality Frequency of board meetings
8.88 0.68 0.16 9.83
2.30 0.09 0.37 2.12
5.00 0.44 0.00 6.00
14.00 0.78 1.00 14.00
Audit Committee Characteristics Size of audit committees Audit committees’ independence Frequency of meetings
3.77 0.80 5.13
0.66 0.13 1.82
3.00 0.50 2.00
5.00 1.00 12.00
Organizational characteristics Organizational size (employees) Organizational age Institutional shareholding Organizational growth
1,861.84 30.24 0.55 0.23
3,365.66 12.29 0.20 0.29
20.00 5.00 0.10 0.002
16,008.00 55.00 0.91 1.87
Finance Leverage Short-term leverage Long-term leverage
0.48 0.11 0.37
0.24 0.06 0.18
0.01 0.001 0.005
0.89 0.36 0.69
Organizational performance Return on Assets Tobin’s q
0.17 0.25
0.16 0.23
-0.43 0.002
0.56 0.98
Table IX: Kenya Variable Mean Std. dev. Min. Max. Manager Characteristic CEO tenure
2.94
1.12
2.00
5.00
Board Characteristics Board size Independence CEO duality Frequency of board meetings
7.79 0.20 0.17 10.72
2.56 0.16 0.38 2.25
3.00 0.08 0.00 6.00
13.00 0.71 1.00 13.00
Audit Committee Characteristics Size of audit committees Audit committees’ independence Frequency of meetings
3.79 0.83 4.00
0.87 0.17 0.00
2.00 0.60 4.00
5.00 1.00 4.00
Organizational characteristics Organizational size (employees) Organizational age Institutional shareholding Organizational growth
3,110.77 57.89 0.00 0.13
4,539.89 26.50 0.13
390.00 8.00 0.00
24,300.00 154.00 0.67
Finance Leverage Short-term leverage Long-term leverage
0.84 0.38 0.46
0.13 0.25 0.24
0.11 0.02 0.019
0.99 0.92 0.87
Organizational performance Return on Assets Tobin’s q
0.06 0.33
0.12 0.26
-0.28 0.0024
0.65 0.98
28

Sector Specific Summary Table X: Industrial Variable Mean Std. dev. Min. Max. Manager Characteristic CEO tenure
3.03
1.23
2.00
6.00
Board Characteristics Board size Independence CEO duality Frequency of board meetings
8.69 0.34 0.19 9.68
2.77 0.27 0.39 2.41
5.00 0.08 0.00 5.00
15.00 0.78 1.00 13.00
Audit Committee Characteristics Size of audit committees Audit committees’ independence Frequency of meetings
3.85 0.79 4.24
0.79 0.16 0.68
3.00 0.50 3.00
5.00 1.00 6.00
Organizational characteristics Organizational size (employees) Organizational age Institutional shareholding Organizational growth
10,586.07 39.66 0.53 0.19
47,099.97 18.42 0.22 0.24
122.00 8.00 0.11 0.00
303,098 87.00 0.90 1.75
Finance Leverage Short-term leverage Long-term leverage
0.67 0.31 0.36
0.25 0.25 0.21
0.02 0.001 0.01
0.97 0.92 0.81
Organizational performance Return on Assets Tobin’s q
0.12 0.34
0.16 0.27
-0.43 0.0024
0.65 0.98
Table XI: Mining Variable Mean Std. dev. Min. Max. Manager Characteristic CEO tenure
5.60
1.60
4.00
8.00+
Board Characteristics Board size Independence CEO duality Frequency of board meetings
14.14 0.55 0.00 12.00
4.32 0.24 0.00 0.00
6.00 0.05 0.00 12.00
23.00 0.85 0.00 12.00
Audit Committee Characteristics Size of audit committees Audit committees’ independence Frequency of meetings
5.89 0.55 4.63
1.57 0.17 1.51
3.00 0.33 4.00
9.00 1.00 10.00
Organizational characteristics Organizational size (employees) Organizational age Institutional shareholding Organizational growth
35,351.80 44.43 0.47 0.60
58,575.37 27.98 0.00 0.72
800.00 15.00 0.47 0.01
209,000 113.00 0.47 3.35
Finance Leverage Short-term leverage Long-term leverage
0.62 0.31 0.31
0.26 0.16 0.23
0.05 0.003 0.001
0.99 0.60 0.80
Organizational performance Return on Assets Tobin’s q
0.15 0.36
0.13 0.52
-0.015 0.002
0.68 3.47
29

Table XII: Manufacturing Variable Mean Std. dev. Min. Max. Manager Characteristic CEO tenure
3.41
1.45
2.00
8.00
Board Characteristics Board size Independence CEO duality Frequency of board meetings
8.29 0.30 0.31 10.67
1.86 0.20 0.47 2.08
3.00 0.09 0.00 6.00
11.00 0.70 1.00 14.00
Audit Committee Characteristics Size of audit committees Audit committees’ independence Frequency of meetings
3.99 0.76 5.19
0.83 0.14 1.80
2.00 0.60 4.00
5.00 1.00 12.00
Organizational characteristics Organizational size (employees) Organizational age Institutional shareholding Organizational growth
3,373.92 49.11 0.56 0.23
5,347.24 27.32 0.14 0.22
170.00 6.00 0.25 0.01
24,300.00 154.00 0.85 1.20
Finance Leverage Short-term leverage Long-term leverage
0.73 0.33 0.40
0.16 0.20 0.19
0.33 0.02 0.02
0.99 0.90 0.80
Organizational performance Return on Assets Tobin’s q
0.12 0.28
0.13 0.21
-0.17 0.002
0.54 0.97
Table XIII: Agriculture Variable Mean Std. dev. Min. Max. Manager Characteristic CEO tenure
2.60
0.87
2.00
4.00
Board Characteristics Board size Independence CEO duality Frequency of board meetings
8.92 0.55 0.25 10.46
1.99 0.24 0.44 1.60
5.00 0.09 0.00 8.00
12.00 0.75 1.00 13.00
Audit Committee Characteristics Size of audit committees Audit committees’ independence Frequency of meetings
4.17 0.82 4.17
0.78 0.16 1.23
3.00 0.60 2.00
5.00 1.00 6.00
Organizational characteristics Organizational size (employees) Organizational age Institutional shareholding Organizational growth
2,138.23 38.81 0.72 0.22
3,185.98 25.13 0.13 0.24
107.00 5.00 0.61 0.00
11,200 111.00 0.91 1.26
Finance Leverage Short-term leverage Long-term leverage
0.56 0.20 0.36
0.30 0.22 0.23
0.01 0.001 0.005
0.93 0.90 0.81
Organizational performance Return on Assets Tobin’s q
0.15 0.28
0.19 0.25
-0.09 0.002
0.55 0.91
30

Table XIV: Services Variable Mean Std. dev. Min. Max. Manager Characteristic CEO tenure
3.51
1.26
2.00
6.00
Board Characteristics Board size Independence CEO duality Frequency of board meetings
7.44 0.46 0.14 10.88
2.31 0.25 0.35 2.24
4.00 0.10 0.00 6.00
12.00 0.78 1.00 14.00
Audit Committee Characteristics Size of audit committees Audit committees’ independence Frequency of meetings
3.37 0.91 5.53
0.56 0.13 1.91
3.00 0.60 4.00
5.00 1.00 12.00
Organizational characteristics Organizational size (employees) Organizational age Institutional shareholding Organizational growth
666.53 36.65 0.54 0.24
533.98 18.35 0.25 0.30
20.00 19.00 0.10 0.001
2,200 84.00 0.79 1.87
Finance Leverage Short-term leverage Long-term leverage
0.66 0.24 0.42
0.23 0.17 0.19
0.10 0.02 0.02
0.96 0.60 0.87
Organizational performance Return on Assets Tobin’s q
0.11 0.24
0.10 0.25
-0.16 0.002
0.40 0.99
PANEL B - Country Specific Regression Estimates Table XV: Prais-Winsten Regression, Correlated Panels Corrected Standard Errors (PCSES) - Effect of Board Characteristics Dependent Variable Return on Assets Tobin’s q Regressors S. Africa Ghana Nigeria Kenya S. Africa Ghana Nigeria Kenya Log of board size
0.1383 (1.73)**
-0.0452 (-0.62)
0.0096 (0.09)
0.0316 (1.16)
0.4339 (2.33)**
-0.5406 (-3.84)**
0.0321 (0.43)
0.2855 (4.10)**
Board Independence
-0.0176 (-0.24)
0.0432 (0.45)
-0.0427 (-0.26)
0.0063 (0.18)
0.3462 (0.53)
-0.4998 (-2.76)**
0.3051 (0.99)
0.0956 (0.37)
CEO duality -0.0088 (-0.42)
-0.1589 (-2.87)**
0.0446 (1.39)
0.0205 (0.28)
0.0027 (0.04)
-0.0429 (-1.63)**
Freq. of board meetings
0.0133 (0.41)
0.0062 (0.84)
-0.1000 (-1.80)**
-0.0154 (-4.54)**
0.0577 (0.27)
0.0330 (2.59)**
-0.0042 (-0.49)
-0.0052 (-0.40)
Log of size -0.0006 (-0.03)
0.032 (1.23)
0.0341 (5.58)**
-0.0032 (-0.27)
0.0267 (0.32)
0.0521 (1.65)**
0.0230 (1.79)**
-0.0282 (-1.10)
Assets tangibility
-0.0888 (-0.83)
-0.1886 (-2.43)**
-0.0202 (-0.36)
-0.0493 (-1.52)**
-0.3592 (-1.56)**
-0.0375 (-0.22)
-0.1368 (-1.61)**
-0.0682 (-2.06)**
Leverage 0.0576 (0.58)
0.0083 (0.10)
-0.0688 (-1.08)
-0.0165 (-0.42)
0.7451 (1.93)**
-0.3006 (-1.34)
-0.0750 (-0.81)
0.1933 (1.74)**
Constant -0.3338 (-0.82)
0.0249 (0.22)
0.1926 (0.86)
0.2071 (2.39)**
-2.2412 (-0.78)
1.1040 (4.35)**
-0.0352 (-0.14)
-0.1188 (-0.83)
rho 0.5631 0.2585 0.5133 0.4074 0.6359 0.0611 0.2259 0.2319 R-squared 0.0746 0.1272 0.2097 0.0939 0.1107 0.0939 0.0100 0.1332 Test of probability
Wald Chi2 (6)=446.48 [ 00000. ]
Wald Chi2(7)= 51.72 [ ]00000.
Wald Chi2(7) =356.41 [ ]00000.
Wald Chi2(6)= 112.05 [ ]00000.
Wald Chi2(6)= 92.39 [ ]00000.
Wald Chi2(7)= 253.37 [ ]00000.
Wald Chi2(7)= 43.24 [ ]00000.
Wald Chi2(7)= 1557.11 [ ]00000.
31

Note: All regressions include a constant. T-statistics are in parenthesis and probability values are in square brackets. ** indicates significance at 5 percent level.
Table XVI: Prais-Winsten Regression, Correlated Panels Corrected Standard Errors (PCSES) - Effect of Audit Committee Characteristics Dependent regressors Return on Assets Tobin’s q S. Africa Ghana Nigeria Kenya S. Africa Ghana Nigeria Kenya Audit committee size
0.0242 (0.56)
-0.0746 (-0.81)
0.0042 (0.18)
0.0258 (0.87)
0.1228 (1.10)
-0.5039 (-2.41)**
-0.0098 (-0.42)
0.0770 (1.01)
Independence of audit committee
-0.1371 (-0.67)
-0.2647 (-0.66)
0.0551 (0.40)
0.0873 (0.73)
-0.3478 (-0.59)
-2.7045 (-2.45)**
-0.4101 (-3.38)**
-0.1945 (-0.47)
Freq of audit committee meetings
-0.0673 (-1.29)
-0.0145 (-2.68)**
0.0077 (1.07)
-0.0285 (-0.60)
0.1864 (2.92)**
0.0159 (1.17)
0.0176 (1.63)**
0.0473 (0.26)
Log of size -0.0083 (-0.43)
0.0596 (2.98)**
0.0342 (4.29)**
0.0019 (0.14)
0.0110 (0.22)
-0.0266 (-1.02)
0.0133 (1.09)
-0.0138 (-0.52)
Asset tangibility
-0.0775 (-0.80)
-0.1996 (-2.68)**
-0.0295 (-0.52)
-0.0269 (-0.61)
-0.2433 (-1.08)
-0.2487 (-1.67)**
-0.1167 (-1.48)
-0.0212 (-0.50)
Leverage 0.0892 (1.46)
-0.0183 (-0.20)
-0.0936 (-1.37)
-0.0049 (-0.13)
0.7901 (2.01)**
-0.2843 (-1.19)
-0.1311 (-1.70)**
0.1435 (1.81)**
Constant 0.4409 (1.05)
0.4344 (0.64)
-0.0857 (-0.43)
-1.1448 (-0.96)
4.8435 (2.90)**
0.5594 (2.88)**
rho 0.5930 0.1988 0.5416 0.5588 0.3558 -0.0263 0.1395 0.1309 R-squared 0.1217 0.1738 0.1420 0.0239 0.1676 0.1067 0.0905 0.1460 Test of probability
Wald Chi2(6)= 280.81 [ ]00000.
Wald Chi2(6)= 37.14 [ ]00000.
Wald Chi2(6)= 22.72 [ ]00000.
Wald Chi2(6)= 1.08e+07 [ ]00000.
Wald Chi2 (6)=1557.11 [ ]00000.
Wald Chi2(6)= 80.83 [ ]00000.
Wald Chi2(6)= 19.13 [ ]00000.
Wald Chi2(6)= 428078.88 [ ]00000.
Note: Not all regressions include a constant. T-statistics are in parenthesis and probability values are in square brackets. ** indicates significance at 5 percent level.
Table XVII: Prais-Winsten Regression, Correlated Panels Corrected Standard Errors (PCSES) - Effect of Institutional Shareholding Dependent regressors Return on Assets Tobin’s q S. Africa Ghana Nigeria Kenya S. Africa Ghana Nigeria Kenya Institutional shareholding
-0.1597 (-7.17)**
-0.2325 (-3.00)**
0.0291 (0.55)
0.0960 (1.28)
Log of size 0.0173 (0.68)
0.0395 (6.01)**
-0.0062 (-0.18)
0.0147 (0.81)
Asset tangibility
-0.2260 (-3.68)**
0.0010 (0.16)
-0.1437 (-2.79)**
-0.0679 (-0.64)
Leverage 0.0040 (0.04)
-0.0769 (-1.05)
-0.3373 (-2.27)**
-0.0694 (-0.67)
Constant 0.2095 (1.76)**
0.0741 (1.20)
0.6345 (2.46)**
0.1930 (1.71)**
rho 0.2563 0.5242 0.0864 0.2305 R-squared 0.1515 0.1652 0.0081 Test of probability
Wald Chi2(4)= 1031.40 [ ]00000.
Wald Chi2(4)= 111.87 [ ]00000.
Wald Chi2(4)= 161.17 [ ]00000.
Wald Chi2(4)= 9.17 [ ]05700.
Note: All regressions include a constant. T-statistics are in parenthesis and probability values are in square brackets. ** indicates significance at 5 percent level.
32