core.ac.uk · Figure 2: Preparation of "fufu", cassava flour mixed with hot water and weighing the...
91
___________________________________________________________________________ Assessment of dietary intake and body mass index in a nutritionally deprived population in rural Democratic Republic of Congo __________________________________________________ Mengs Gebremeskel Tewelde Centre for International Health Department of Global Public Health and Primary Care Faculty of Medicine and Dentistry University of Bergen, Norway 2015
-
Upload
nguyenhanh -
Category
Documents
-
view
216 -
download
0
Transcript of core.ac.uk · Figure 2: Preparation of "fufu", cassava flour mixed with hot water and weighing the...

___________________________________________________________________________
Assessment of dietary intake and body mass index in a nutritionally deprived
population in rural Democratic Republic of Congo
__________________________________________________
Mengs Gebremeskel Tewelde
Centre for International Health
Department of Global Public Health and Primary Care
Faculty of Medicine and Dentistry
University of Bergen, Norway
2015


_________________________________________________________________________
Assessment of dietary intake and body mass index in a nutritionally deprived
population in rural Democratic Republic of Congo
__________________________________________________
Mengs Gebremeskel Tewelde
This thesis is submitted in partial fulfilment of the requirements for the degree
of
Master of Philosophy in International Health at the University of Bergen
Centre for International Health
Department of Global Public Health and Primary Care
Faculty of Medicine and Dentistry
University of Bergen, Norway 2015


i
Abstract
Introduction: In the Democratic Republic of Congo (DR Congo), about 70% of the total
population and more than 40% of children under the age of 5 are undernourished. In such an
area, assessment of nutritional adequacy is vital as it can provide valuable data for
policymakers that can be used for advocacy to focus on particular problems that need to act on.
Thus, this cross-sectional study aimed to assess nutritional adequacy of diet and body mass
index (BMI) in a nutritionally deprived population in rural Bandundu Province in the DR
Congo and compare our findings to other African studies by doing a literature review.
Methods: Dietary intakes of 76 subjects from 12 systematically selected households were
collected using 3 days weighed food records. The weights of food consumed by individuals
were converted in energy and macronutrients using relevant food composition tables. The
individual intakes and energy percent from macronutrients (E%) were assessed for adequacy
by comparing with the recommended intakes and acceptable macronutrients distribution ranges
(AMDRs), respectively. Weight and height data were also collected from 440 adults using
calibrated equipment and standardized techniques. The WHO BMI cut-off points were used
for assessment. To investigate the socio-demographic factors associated with being
underweight, logistic regression was used. A semi-systematic review was adopted to search for
relevant published articles. We searched 3 online electronic databases, 4 online journals, 5
authors and the reference lists of the identified key articles. Then the findings of the selected
articles were compared with our study findings.
Results: Protein and fat intakes were below the recommended intakes in all age groups, in spite
of energy intake being adequate. The E% from protein and fat were both far below the lower
limits of the AMDRs. The diet was highly monotonous, dominated by cassava, approximately
80% of the participants energy was derived from cassava. Comparing this finding with other
African studies, our participants had the most monotonous diet of all the free-living African
populations. Based on the BMI assessments, 47% of the overall adults were underweight, 52%
were in the normal weight range and 1% were overweight. Using logistic regression model, we
found significant association with underweight status and participant’s age, but not in sex or
residence village. Comparing these figures with other studies in Africa, our study reported one
of the thinnest free-living adult populations in Africa.

ii
Conclusion: This study revealed an extremely monotonous diet and a high prevalence of
underweight. Therefore, immediate nutritional interventions are warranted to alleviate the
current problems. In long term perspective, efforts to enhance agriculture diversity, empower
the economic development and enrich the diet with animal products should be considered.

iii
Table of contents Abstract ...................................................................................................................................... i
I. List of tables ...................................................................................................................... v
II. List of figures ................................................................................................................... vi
III. List of abbreviations ........................................................................................................ vi
Acknowledgements ............................................................................................................... viii
1. Introduction ...................................................................................................................... 1
1.1. General overview ............................................................................................................ 1
1.2. Global and regional burden of undernourishment........................................................... 1
1.2.2. Democratic Republic of Congo (DR Congo) ........................................................... 1
1.3. Methods of nutritional assessment .................................................................................. 2
1.3.1. Dietary method ......................................................................................................... 2
1.3.1.1. Assessment of dietary intake from food consumption data ................................... 3
1.3.1.2. Energy and macronutrients .................................................................................... 3
1.3.2. Anthropometric methods .......................................................................................... 7
2. Rationale and objectives .................................................................................................. 9
2.1 Rationale of the study .................................................................................................. 9
2.2 General objectives ....................................................................................................... 9
3. Specific objectives ............................................................................................................. 9
4. Subjects and methods ..................................................................................................... 10
4.1 Study setting ................................................................................................................... 10
4.2 General study design ...................................................................................................... 11
4.3 Study population ....................................................................................................... 11
4.4 Data collection, quality and control .......................................................................... 11
4.4.1 Dietary intake .......................................................................................................... 11
4.4.2 Anthropometric measurements ................................................................................ 12
4.5 Data processing and analysis..................................................................................... 13
4.6 Ethical considerations .................................................................................................... 15
5. Semi-systematic review of literature ............................................................................. 16
5.1. Objective and rationale of the literature review ............................................................ 16
5.2. Search strategy and selection criteria ............................................................................ 16
5.3. Methods of searching the literature ............................................................................... 16
5.3.1 Electronic searching of databases ............................................................................ 17
5.3.2 Hand searching relevant online journals ................................................................. 18
5.3.3 Author searching...................................................................................................... 19
iv
5.3.4 Reference lists searching ......................................................................................... 20
5.4 Quality appraisal of the selected studies ........................................................................ 20
6. Results .............................................................................................................................. 24
7. Discussion............................................................................................................................ 43
7.1 Methodological discussion ........................................................................................... 43
8. Conclusion .......................................................................................................................... 48
9. Recommendations .............................................................................................................. 48
References ............................................................................................................................... 50
Appendixes.............................................................................................................................. 55
I. Critically appraisal using STROBE checklist for articles selected in the review regarding
assessment of dietary intake ................................................................................................. 59
II. Critically appraisal using STROBE checklist for articles selected in the review regarding
BMI assessments .................................................................................................................. 71

v
I. List of tables
Table 1: The International classification of adult underweight, overweight and obesity using
BMI ............................................................................................................................................ 8
Table 2: Searching records from electronic databases ............................................................. 17
Table 3: Searching strategy using authors ............................................................................... 20
Table 4: Characteristics of studies reviewed for dietary intake ............................................... 21
Table 5: Characteristics of studies reviewed for BMI ............................................................. 22
Table 6: Socio-demographic and anthropometric characteristics of study participants in Nkay-
Kalengi and completeness of data............................................................................................ 24
Table 7: Macronutrient intakes per day of study participants (N=70) in Nkay-Kalengi ......... 25
Table 8: Energy intakes, energy from cassava, and the percentage contribution of energy
from cassava to mean energy intakes (E%) of study participants (N=70) in Nkay-Kalengi ... 26
Table 9: Mean EI from macronutrients in relation to the AMDRs of study participants (N=70)
in Nkay-Kalengi ....................................................................................................................... 27
Table 10: Mean BMR factors per day of study participants in Nkay-Kalengi (N=68) ........... 27
Table 11: Mean energy and macronutrients intake per day in comparison to EER and RDA of
study participants (N=70) in Nkay-Kalengi ............................................................................. 29
Table 12: Energy expenditures for PA in relation to energy consumed of women (n=11) ..... 29
Table 13: Socio-demographic characteristics of the study participants ................................... 30
Table 14: Distribution of body mass index by age, sex and sex combined ............................. 31
Table 15: Factors associated with being underweight* (total 440) ......................................... 33
Table 16: Energy and macronutrient intakes and percentage contribution of energy from
macronutrients for selected free-living populations in Africa and our participants ................ 38
Table 17: Proportion of BMI categories for men in our study and in studies included in our
review ....................................................................................................................................... 39
Table 18: Proportion of BMI categories for women in our study and in the studies included in
our review ................................................................................................................................ 41
Table 19: Different aspects of energy consumed in relation to age and weight for child and
adolescent study participants in Nkay-Kalengi (n=33). ........................................................... 55
Table 20: Different aspects of energy consumed in relation to age and weight for adult study
participants in Nkay-Kalengi (n=37). ...................................................................................... 56
Table 21: Dietary content in relation to age and weight for child and adolescent study
participants in Nkay-Kalengi (n=33). ...................................................................................... 57

vi
Table 22: Dietary content in relation to age and weight for adult study participants in Nkay-
Kalengi (n=37). ........................................................................................................................ 58
II. List of figures
Figure 1: Map of DR Congo, with inset map of Bandundu Province and Popo-Kabaka
District...................................................................................................................................... 10
Figure 2: Preparation of "fufu", cassava flour mixed with hot water and weighing the
prepared food on a digital scale ............................................................................................... 12
Figure 3: Weight and height measurements from the field work ............................................ 13
Figure 4: Flow chart of the overall semi-systematic review .................................................... 19
Figure 5: Prevalence of underweight, normal weight and overweight by age groups ............. 32
Figure 6: Cumulative distribution of BMI for men by age group ............................................ 34
Figure 7: Cumulative distribution of BMI for women by age group ....................................... 35
Figure 8: Prevalence of underweight, normal weight and overweight by sex and overall ...... 35
Figure 9: Prevalence of underweight, normal weight and overweight by village ................... 36
Figure 10: Cumulative distribution of BMI for our study in comparison to the selected studies
for men ..................................................................................................................................... 40
Figure 11: Cumulative distribution of BMI for our study in relation to the selected studies for
women ...................................................................................................................................... 41
Figure 12: Traditional eating habit in the study area ............................................................... 44
III. List of abbreviations
AMDRs Acceptable Macronutrient Distribution Ranges
AOR Adjusted Odds Ratio
BMI Body Mass Index
BMR Basal Metabolic Rate
CHO Carbohydrates
CI Confidence Interval
COR Crude Odds Ratio
DR Congo Democratic Republic of the Congo
DRIs Dietary Reference Intakes
EER Estimated Energy Requirement

vii
EI Energy Intake
E% Energy percent
FAO Food and Agriculture Organization
IFAD International Fund for Agricultural Development
IOM Institute of Medicine
Kcal Kilocalorie
MDG Millennium Development Goal
PA Physical Activity
PAL Physical Activity Level
RDA Recommended Dietary Allowance
SD Standard Deviation
SPSS Statistical Package for Social Sciences
SSA Sub-Saharan Africa
STROBE STrengthening the Reporting of Observational Studies in Epidemiology
TEE Total Energy Expenditure
TEI Total Energy Intake
UN United Nations
UNDP United Nations Development Programme
WFP World Food Programme
WFR Weighed food records
WHO World Health Organization

viii
Acknowledgements
Above all, I wholeheartedly thank my mighty God for giving me the strength and ability to
pursue this study programme. Without His showers of blessings, I would not have been where
I am today.
It is with great gratitude that I acknowledge the help and support of my supervisor Professor
Thorkild Tylleskär. His scientific guidance, encouragements and suggestions were outstanding.
Without him this thesis would not have been possible.
I am indebted to Regina Küfner Lein, an academic librarian at the Medical and Dental Library,
University of Bergen for her technical support and guidance in doing the semi-systematic
review. My sincere thanks also goes to Master student, Carrie Anderson and PhD candidate,
Jovita Amurwon for their friendly collaboration and support.
I would like to acknowledge the academic and administrative staff, teachers, colleagues and
friends at the Centre for International Health, University of Bergen for their great support and
kindness during the study time. Special thanks to Professor Bente Elisabeth Moen, Director at
the Centre, for her great help in sorting out the problem that I had when my first supervisor left
the Centre. I am also thankful to the Government of Norway for the financial support through
the Lånekassen programme and the Norwegian Research Counsel for the research funding.
My deepest gratitude to my father Gebremeskel, mother Akberet, sisters (Selamawit and
Semhar), and brothers (Daniel and Yonas). I would like also to express my thanks to W/ro
Abrhet, W/ro Etay, Zeray, Gergish, Adhanom, Teklesenbet, Tekleberhan and Tmnit. Their
prayer, love and encouragement were remarkable. God bless you all abundantly.
Lastly, heartfelt thanks goes to my friends Misghna, Misgahna, Maekele, Teklit, Hagos,
Misghna Z, Michael, Russom, Nejmedin, Tesfay and many more for their consistent
encouragement and cooperation. Their current help and friendship shall always be recalled.

1
1. Introduction
1.1. General overview
Nutritional adequacy, i.e. a nutritionally adequate diet, is the cornerstone of an individual’s well-
being, it promotes health, may help extend one’s life span, and can help prevent the occurrence of
chronic diseases (1). Individuals are classified as having adequate nutrition when they have
sufficient intake of essential nutrients, needed to fulfill their nutritional requirements for optimal
health (2). Nutritional inadequacy is a serious public health concern in low-income countries. It is
a leading cause of undernourishment, which is experienced when food intake is continuously
insufficient to meet the dietary requirements. In contrast, undernutrition is defined as the outcome
of undernourishment and repeated infectious diseases (3). Undernutrition has detrimental effects on
a person’s health as it impairs physical, mental and cognitive development as well as it compromises
the immune system (4). Women and children are more vulnerable to nutritional deficiencies than
other members of the community. It has been estimated that nearly half (45%) of all childhood
deaths can be linked to undernutrition (5-7).
1.2. Global and regional burden of undernourishment
The target of the first UN millennium development goal (MDG 1) is to halve the proportion of
people suffering from hunger by the year of 2015 (3). Significant progress has been made towards
reducing the number of undernourished people. Between 1990 and 2014 it has decreased from
around 1015 million (18.7% of the world population) to 805 million (11.3% of the world population)
(3, 8). Despite the overall progress, significant regional variations still persist (3). Almost all of the
undernourished people (98 %) live in low-income countries, with Africa and Southern Asia regions
being the most affected (3, 8). Around 24% (214 million) of the Sub-Saharan Africa’s (SSA)
population were unable to meet their dietary requirements in 2012-14. Thus, around one in four
persons is likely to have suffered from chronic hunger; unable to get sufficient amount of food to
maintain an active life (3).
1.2.2. Democratic Republic of Congo (DR Congo)
The DR Congo is one of the SSA countries, where malnutrition is highly prevalent. Approximately
70% of the total population and more than 40% of children under the age of five are undernourished
(9, 10). According to the Global Hunger Index, the country has the highest number of
undernourished people in Africa and the highest prevalence of undernutrition in the world (11).
Poverty, inadequate food production and poor quality of food are some of the main contributors
towards this huge burden (9). Despite the fact that the country is endowed with large arable land,
and abundant natural resources, the economy remains stagnant due to political unrest, lack of proper

2
management and heavy corruption (9). Subsistence agriculture provides the main source of food for
many Congolese households, however, majority of them cultivate small pieces of land using
traditional methods of farming, which make them unable to secure their daily food production (9).
Cassava (manioc) is the main crop in many parts of DR Congo, both as a staple food and a cash
crop (12, 13). Generally, the crop is as popular in many other parts of Africa as rice in Asia, or as
potatoes and wheat in Europe (13). It is one of the most drought-resistant perennial tropical crops
which can grow up to 1 to 3 meters in height. Both leaves and roots are edible and are considered
as the most nutritionally valuable parts of the crop (12, 13). However, nutrient composition in these
parts varies widely; the roots (accounting for 50% of the mature cassava crop) are rich in
carbohydrate but poor in protein, while the leaves (accounting for 6% of the mature cassava crop)
are rich sources of protein and fat (13, 14, p.58). The root carbohydrate content is twice as high as
in the leaves, and the leaf protein content is 5 to 10 times higher than in the roots (which is
comparable to the protein content of an egg). The fat content in the cassava plant is about 10 times
higher in the leaves than in the roots (13).
1.3. Methods of nutritional assessment
Nutritional assessment is defined as the interpretation of information collected from ABCD studies
(Anthropometric, Biochemical/biophysical, Clinical and Dietary) to determine whether an
individual or population are well or malnourished (15, p.2). Assessment of nutritional adequacy is
vital as it can assist in documenting the type, magnitude, location and causes of undernutrition and
nutritional deprivation among different populations (16). Thus, the information obtained can
provide valuable data for policy making, planning, program design and evaluation (15, p.2). In the
system of nutritional assessment, dietary and anthropometric methods are used as indicators in
assessing the progress towards reaching the MDG 1 (3).
1.3.1. Dietary method
As noted above, dietary assessment is one particular type of nutritional assessment. There are
different methods used for dietary assessment, including retrospective methods (24-hour recall,
dietary history and food frequency questionnaire) and prospective methods (estimated food records
and weighed food records) (15, p.41-47, 17, 18). Selecting the most suitable assessment method
depends on several factors consisting of detailed information required, level of accuracy and
precision needed, time period of interest, budget and characteristics of staff members and subjects
(15, p.41, 17). Generally, dietary intake cannot be estimated without error and none of these
methods are able to provide a fully accurate measurement (19). The weighed food records (WFR)
is currently considered to be the most accurate method, and it has been referred to as the “imperfect

3
golden standard” in dietary assessment (15, p.45, 17). In this method, subjects, parents or proximal
caregivers are instructed to weigh all foods and beverages served during a specific period of time,
and the potential leftovers. Conventionally, this method is recommended to be used for a seven day
period to obtain good quality data, but three to four days are most commonly used due to time and
budgetary constraints. In order to have good quality data from this method, subjects need to be
familiar with the name of consumed foods, preparation methods, and measurement methods.
Besides this, complete follow-up during eating is vital to completeness (15, p.45). WFR has the
potential advantage of providing quantitatively accurate information on food consumed during the
specific recording time, by direct weighing and by reducing loss of information due to recall
problems (15, p.45). However, this method also has some drawbacks. First, it needs motivated and
literate participants, which can potentially limit the method’s use in some population groups
(children, illiterate, immigrants, and elderly). These requirements can lead to a selection bias, which
can reduce the generalizability of the findings. In such conditions, collection of dietary data can be
done by a researcher or research assistant which may render the method expensive (17). Second,
recording individuals’ intakes consecutively while they are eating may affect eating habits during
data collection and may reduce accuracy of usual intake estimates, due to a high participation burden
(17, 20).
1.3.1.1. Assessment of dietary intake from food consumption data
When food consumption of an individual is quantified or measured using dietary methods, it is
possible to estimate the nutrient intakes using food composition tables. These tables provide
information regarding the energy and nutrient content of the most commonly consumed foods in
specific areas (15, p.65, 21). Nutrients are components in foods which are necessary for the growth
and survival of an individual. They are categorized into two main groups: macronutrients and
micronutrients (14, p.64). Macronutrients are required in large amounts for growth, metabolic
reactions, energy, and for other basic body functions. Common macronutrients include protein, fat
and carbohydrates (22, p.9). On the other hand, micronutrients are required in micro-quantities
(small amounts) and provide the necessary cofactors for many enzymes in an individual’s
metabolism (i.e. energy turnover, synthesis of DNA, RNA and protein, etc.), and include vitamins
and minerals also called trace elements (22, p.93-95).
1.3.1.2. Energy and macronutrients
Human beings need energy to maintain different basic body functions, including metabolism,
respiration, circulation, physical work, and protein synthesis (14, p.65; 23, p.83, 23). Energy is
derived from the oxidation of macronutrients, in which fat generates 9 kcal/g, protein and

4
carbohydrate each release 4 kcal/g. Alcohol also provides 7 kcal/g of energy, but it is not commonly
considered part of the food system (macronutrient) as it is not required by the human body for
survival and growth (22, 23, p.94; 23, p.83-85). Acceptable Macronutrient Distribution Ranges
(AMDRs) is the range of intake for particular energy source (macronutrient) that is related with
reducing risk of chronic diseases while furnishing the body with adequate essential nutrients (23,
p.72). The AMDR of each macronutrient is expressed as a percent of energy from each
macronutrient to the total energy intake (TEI) (23, p.71-72). Each of the AMDR has both an upper
and lower boundary, and intakes that fall outside of the boundary are considered as potential risk
factors for chronic diseases and deficiency of essential nutrients (23, p.72).
A. Components of energy requirements: Human beings require energy for the maintenance of
various bodily functions. Energy required to keep basal metabolism and energy needed for physical
activity are two main components of such energy requirements (14, p.69).
I. Basal metabolism: Basal metabolism encompasses a numbers of functions that are vital for life
existence, such as body temperature, brain, heart and lung function maintenance as well as taking
part in the chemical process that keep us alive (liver and kidney) (14, 23 p.69; 23 p.86, 24). Basal
metabolic rate (BMR) is the minimum energy required for operating the basal metabolism. The
BMR is measured commonly in the morning when the body is at complete physical rest, while
awake and in a state of mental relaxation at normal temperature (14, p.69, 24). Unlike energy
requirements, variation in the body composition has no effect on BMR, it is stable from day to day
and can be estimated using the equations proposed by FAO/WHO/UNU (14, 25, p.70). The
equations incorporate three variables: age, sex and body weight of an individual and are expressed
as mega joule (MJ) or kilocalories (Kcal) per 24 hours (14, p.70). Depending on the age and lifestyle
of an individual, BMR accounts for 45-75 % of the daily total energy expenditure (TEE), the largest
component of daily TEE (24). In the assessment of dietary intake, bias in reporting energy intake
(EI) is a common problem either by underreporting or overreporting of intake (26). In such case,
the ratio of reported EI to estimated BMR (EI: BMR) can be used to determine the degree of the
bias. The ratio is called BMR factor and a cut-off point of BMR factor <1.35 is considered to
represent underreporting of EI, BMR factors of 1.35-2.39 as normal ranges and BMR factor ≥ 2.4
as overreporting of EI (26, 27), unless high physical activity is known or documented.
II. Physical activity: Following the BMR, physical activity (PA) is the second largest component
of daily TEE (24). The energy expended for PA is the most variable component and it accounts for
at least 20-30% of the daily TEE (24, 28). In sedentary individuals, only one-third of the TEE used

5
for PA over 24 hours, and the remaining two-thirds goes to BMR. On the other hand highly active
individuals can expend twice as much energy as with BMR (23, p.95). Measuring the physical
activity level (PAL) of an individual can be used in calculating Estimated Energy Requirement
(EER), which is the average daily energy intake that is expected to maintain energy balance in
healthy, normal weight individuals of a defined age, gender, weight, height, and level of PA
consistent with good health (14, p.71). It is expressed as multiples of BMR and PAL (EER=BMR
x PAL). Besides this, EER of an individual can also be calculated using the equations developed by
the Institute of Medicine (IOM). The equation incorporates the following variables: age, sex,
weight, height and PAL of an individual. PAL are categorized into four levels: sedentary (PAL 1.0-
1.39), low active (PAL 1.4-1.59), active (PAL 1.6-1.89), and very active (PAL 1.9-2.5) (23, p.83,
28).
B. Macronutrients: Such nutrients are required by our body in large amounts and include the
following:
I. Protein: Proteins are essential building blocks of body tissues and are found virtually throughout
the body. Proteins are the second most plentiful substance in human body, water is the first (29).
Proteins may function as enzymes, energy sources, hormones, antibodies, nutrient transporters,
chemical reaction regulators, and may have other functions in the body (23, p.145, 29). During
digestion, protein is broken down in to 20 small molecules called amino acids. Of these, 9 cannot
be synthesized in human body, thus they must be obtained from the diet and are called essential
amino acids (29). Proteins which contain all the 9 essential amino acids are called complete proteins
and animal products like meat, fish, egg, poultry, milk, cheese and yogurt are among the main
sources of complete proteins. On the contrary, proteins lacking one or more of the 9 essential amino
acids are called incomplete proteins. Plants sources such as legumes, grains, nuts, seeds, cassava
leaves and vegetables are some of the incomplete proteins (23, p.145). Adequacy of protein intake
is assessed using different Dietary Intake Reference (DIRs). Recommended Dietary Allowance
(RDA) is one of the DIRs and is defined as the average daily dietary intake level sufficient to meet
the requirement of almost all (97-98%) of healthy individuals (30, 31). RDAs for different age
groups of both sexes were estimated by IOM (31). In addition to this, proteins have also AMDRs
which varies with age groups, i.e. 5-20%, 10-30%, and 10-35% of the TEI for 1-3 years, 4-18 years
and older than 18 years, respectively (23, 30, p.71, 31), thus using RDA or AMDR as reference
protein intake of an individual can be assessed for it adequacy. Inadequate intake of protein may
have detrimental effects to human health, it causes protein-energy malnutrition, impaired immune
system function, can affect brain development (particularly in children), increases risk of acquired
6
infections, elevates susceptibility to systematic disease, and can have other consequences (23,
p.151). The overconsumption of protein can lead to side effects including gastrointestinal problems,
nitrogen imbalance and kidney disease (23, p.152).
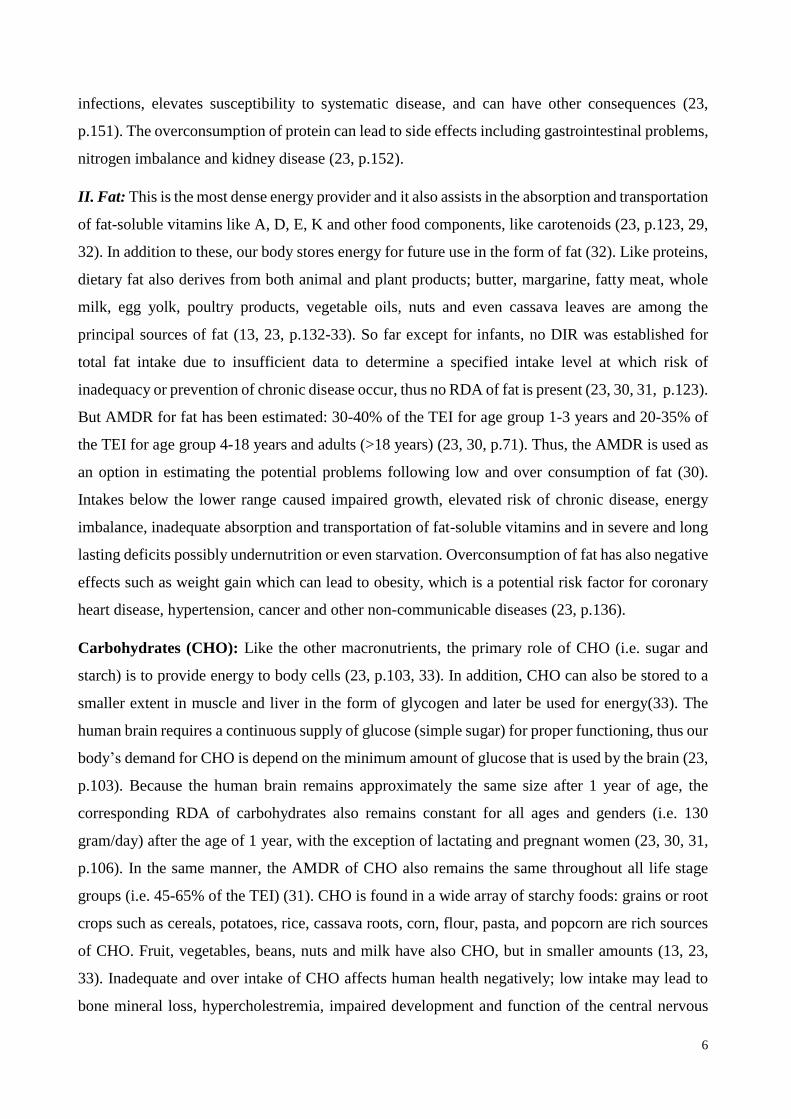
II. Fat: This is the most dense energy provider and it also assists in the absorption and transportation
of fat-soluble vitamins like A, D, E, K and other food components, like carotenoids (23, p.123, 29,
32). In addition to these, our body stores energy for future use in the form of fat (32). Like proteins,
dietary fat also derives from both animal and plant products; butter, margarine, fatty meat, whole
milk, egg yolk, poultry products, vegetable oils, nuts and even cassava leaves are among the
principal sources of fat (13, 23, p.132-33). So far except for infants, no DIR was established for
total fat intake due to insufficient data to determine a specified intake level at which risk of
inadequacy or prevention of chronic disease occur, thus no RDA of fat is present (23, 30, 31, p.123).
But AMDR for fat has been estimated: 30-40% of the TEI for age group 1-3 years and 20-35% of
the TEI for age group 4-18 years and adults (>18 years) (23, 30, p.71). Thus, the AMDR is used as
an option in estimating the potential problems following low and over consumption of fat (30).
Intakes below the lower range caused impaired growth, elevated risk of chronic disease, energy
imbalance, inadequate absorption and transportation of fat-soluble vitamins and in severe and long
lasting deficits possibly undernutrition or even starvation. Overconsumption of fat has also negative
effects such as weight gain which can lead to obesity, which is a potential risk factor for coronary
heart disease, hypertension, cancer and other non-communicable diseases (23, p.136).
Carbohydrates (CHO): Like the other macronutrients, the primary role of CHO (i.e. sugar and
starch) is to provide energy to body cells (23, p.103, 33). In addition, CHO can also be stored to a
smaller extent in muscle and liver in the form of glycogen and later be used for energy(33). The
human brain requires a continuous supply of glucose (simple sugar) for proper functioning, thus our
body’s demand for CHO is depend on the minimum amount of glucose that is used by the brain (23,
p.103). Because the human brain remains approximately the same size after 1 year of age, the
corresponding RDA of carbohydrates also remains constant for all ages and genders (i.e. 130
gram/day) after the age of 1 year, with the exception of lactating and pregnant women (23, 30, 31,
p.106). In the same manner, the AMDR of CHO also remains the same throughout all life stage
groups (i.e. 45-65% of the TEI) (31). CHO is found in a wide array of starchy foods: grains or root
crops such as cereals, potatoes, rice, cassava roots, corn, flour, pasta, and popcorn are rich sources
of CHO. Fruit, vegetables, beans, nuts and milk have also CHO, but in smaller amounts (13, 23,
33). Inadequate and over intake of CHO affects human health negatively; low intake may lead to
bone mineral loss, hypercholestremia, impaired development and function of the central nervous
7
system, and can lead to inadequate glycogen stores. Excess intake of CHO may lead to dental caries,
cancer, obesity, hyperlipidemia and behavioral changes (23, p.107-8, 33).
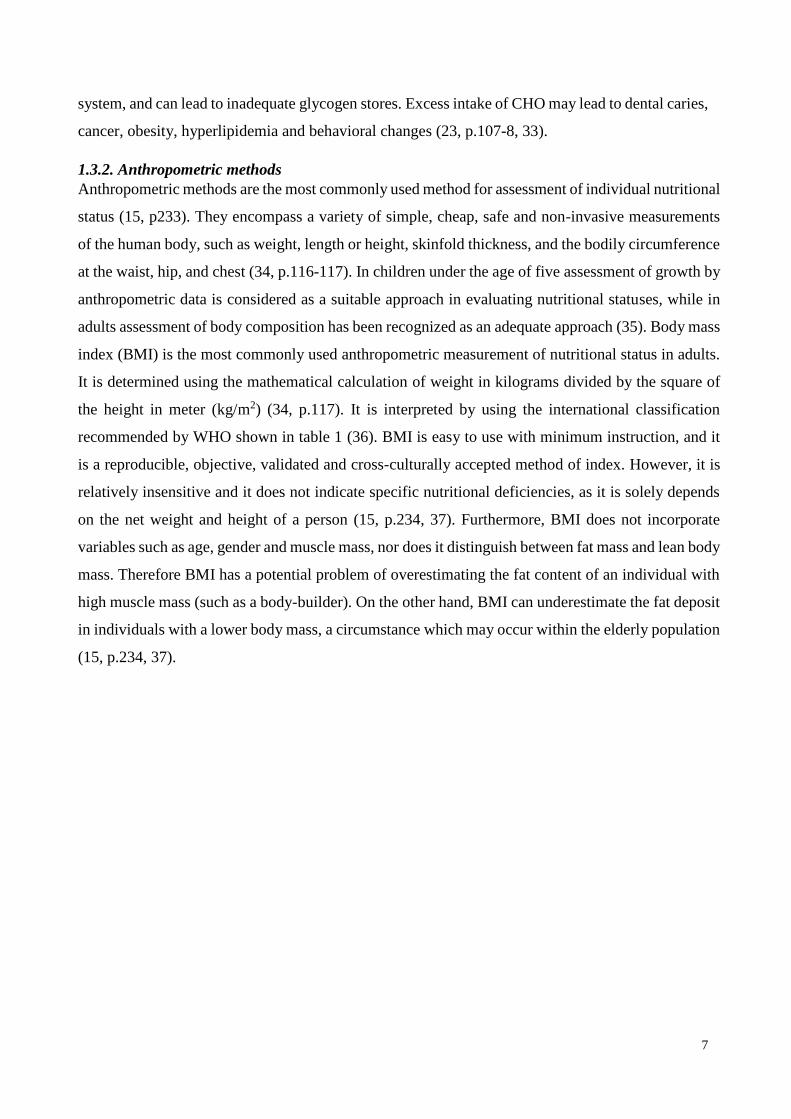
1.3.2. Anthropometric methods
Anthropometric methods are the most commonly used method for assessment of individual nutritional
status (15, p233). They encompass a variety of simple, cheap, safe and non-invasive measurements
of the human body, such as weight, length or height, skinfold thickness, and the bodily circumference
at the waist, hip, and chest (34, p.116-117). In children under the age of five assessment of growth by
anthropometric data is considered as a suitable approach in evaluating nutritional statuses, while in
adults assessment of body composition has been recognized as an adequate approach (35). Body mass
index (BMI) is the most commonly used anthropometric measurement of nutritional status in adults.
It is determined using the mathematical calculation of weight in kilograms divided by the square of
the height in meter (kg/m2) (34, p.117). It is interpreted by using the international classification
recommended by WHO shown in table 1 (36). BMI is easy to use with minimum instruction, and it
is a reproducible, objective, validated and cross-culturally accepted method of index. However, it is
relatively insensitive and it does not indicate specific nutritional deficiencies, as it is solely depends
on the net weight and height of a person (15, p.234, 37). Furthermore, BMI does not incorporate
variables such as age, gender and muscle mass, nor does it distinguish between fat mass and lean body
mass. Therefore BMI has a potential problem of overestimating the fat content of an individual with
high muscle mass (such as a body-builder). On the other hand, BMI can underestimate the fat deposit
in individuals with a lower body mass, a circumstance which may occur within the elderly population
(15, p.234, 37).

8
Table 1: The International classification of adult underweight, overweight and obesity using BMI
Classification BMI(kg/m2)
Principal cut-off points Additional cut-off points
Underweight <18. 50 <18. 50
Severe thinness <16. 00 <16. 00
Moderate thinness 16. 00 - 16. 99 16. 00 - 16. 99
Mild thinness 17. 00 - 18. 49 17. 00 - 18. 49
Normal range 18. 50 - 24. 99 18. 50 - 22. 99
23. 00 - 24. 99
Overweight ≥25. 00 ≥25. 00
Pre-obese 25. 00 - 29. 99 25. 00 - 27. 49
27. 50 - 29. 99
Obese ≥30. 00 ≥30. 00
Obese class I 30. 00 - 34. 99 30. 00 - 32. 49
32. 50 - 34. 99
Obese class II 35. 00 - 39. 99 35. 00 - 37. 49
37. 50 - 39. 99
Obese class III ≥40. 00 ≥40. 00
Reference: Global database on BMI, WHO (36)

9
2. Rationale and objectives
2.1 Rationale of the study
The southern part of Bandundu Province raises red flags on a number of nutritional indicators, hence
our study interested to document the situation. A large proportion of the population live on
subsistence farming and dietary patterns are likely to be monotonous, as dietary choices are made
based on local food availability (38). In addition to this, healthcare, educational facilities and other
services were less developed in these areas (38). Dietary intake data can be used for advocacy to
focus on particular problems that policymakers need to act on. This research aimed to unearth the
magnitude of nutritional inadequacy in the Popo-Kabaka District. It has also been reported that most
of the people in this district are very poor and thin, as approximately 70% of the total population
have been reported to be undernourished (10, 38). Therefore measuring anthropometric
measurements in such population are very helpful in documenting the magnitude of underweight
individuals in the population.
2.2 General objectives
The general objective of this thesis was to assess the nutritional adequacy of diet and body mass
index (BMI) in a nutritionally deprived population in rural Bandundu Province in the Democratic
Republic of Congo (DR Congo). The assessment was done by analyzing data obtained from two
rural villages in Popo-Kabaka District, Bandundu Province in DR Congo and by conducting a
literature review of population-based studies in Africa.
3. Specific objectives
1. To assess the nutritional adequacy of the diet of selected households in the remote rural
village of Nkay-Kalengi.
2. To document and assess the BMI distribution in the adult part of the population in the two
remote rural villages of Nkay-Kalengi and Indaba.
3. To compare our findings to other population-based studies from Africa by doing a literature
review of population-based studies in Africa regarding dietary intake and BMI, in particular
studies which had used WFR for estimating food consumption of individuals or studies
reporting BMI in adult populations.

10
4. Subjects and methods
4.1 Study setting
The study was carried out in August 1996 in two villages of Popo-Kabaka District (Nkay-Kalengi
and Indaba), located at (5°38–5°43 latitude South, 16°34–16°37 longitude East), district of Popo-
Kabaka, province of Bandundu (38). The Bandundu Province covers 300,000 km2 (almost the size
of Norway) with approximately 8.06 million inhabitants in 2010 (39). The Popo-Kabaka District is
located in South-Western part of this province, and consists of a savanna tableland with poor sandy
soils intersected by forests and relatively more fertile river valleys (Wamba river) running in
roughly south-north direction (40). The climate is tropical with an annual rainfall varying around
1200 mm (plenty of rainfall 9 months per year). Subsistence economy prevails, and cassava is the
dominant crop in this area, both as a main staple food and as a cash crop. This area has been
identified to have many problems hampering its development; for example access is difficult to this
area especially during the rainy season. As a result it has limited communication with the capital
Kinshasa, where manufactured goods and other products can be purchased. Infectious diseases
(malaria, tuberculosis, etc.), poverty, food insecurity and unsafe water supply are highly prevalent
in the Popo-Kabaka District (38).
Figure 1: Map of DR Congo, with inset map of Bandundu Province and Popo-Kabaka District
With virtually unchanged living standards in this district, these old data are deemed to be
contemporary and relevant to the current nutritional situation of these two villages.

11
4.2 General study design
The study was a cross-sectional study. It was designed to assess the nutritional adequacy of these
nutritionally deprived populations in the District of Popo-Kabaka. Twelve households (out of total
162) in Nkay-Kalengi were selected by using systematic sampling method after the census was
made. Information regarding dietary intakes of each study subject was collected using three days
WFR. Besides this, anthropometric data were also collected from these two remote rural villages
and all households in those villages were included, 162 in Nkay-Kalengi and 51 in Indaba.
4.3 Study population
The study subjects were selected from all age groups. Dietary intakes of 76 subjects living in twelve
households were recorded for three consecutive days in Nkay-Kalengi. For the assessment of BMI,
data were collected from two villages. All adults in these villages were included, excluding those
not present on the day of data collection; altogether 325 adult subjects from Nkay-Kalengi and 115
from Indaba of both sexes were included.
4.4 Data collection, quality and control
4.4.1 Dietary intake
Data was collected using the WFR method. Two trained nutritionists were deployed in a total of 12
households for three consecutive days per household. They arrived at the subject’s home at dawn
and followed the food preparations and food intake in the whole family until bedtime. Each step of
the cooking process was supervised and each raw ingredient of all dishes before cooking was
weighed on digital scales and the results rounded to the nearest gram. The total weight of the final
dish was also recorded. At the time of food consumption, the individual portions of each constituent
of the meal were weighed before eating. Any leftovers were also recorded and the proportion of
each constituent was estimated. Over the three food record days, subjects were well informed not
to change their normal dietary pattern. Besides weighing dietary intakes, the nutritionists also
measured the physical activity (PA) of 11 women by direct observation method during the same
three consecutive days. Each type of mother’s activity (including sleeping) was measured for its
duration and intensity. The main reason that hampered the researchers from measuring the activities
for majority of the participants was the nature of living in this area, the study area is very rural with
agriculture as backbone for economy. Therefore, people were spread out during day time and the
researchers were unable to follow each person individually. Hence, it was decided to follow only
the women in all their activities be it agriculture and other activities.

12
Figure 2: Preparation of "fufu", cassava flour mixed with hot water and weighing the prepared food on
a digital scale
4.4.2 Anthropometric measurements
Information was collected regarding subject’s sex, age, weight, and height. A total of 440 adults
were included from the two rural villages. Weight of each subject was measured to the nearest 0.1
kg on a battery powered digital scale (SECA) and height were measured to the nearest 0.1 cm using
a height-measuring board with a sliding head bar following standard anthropometric techniques.
For both measurements, subjects removed their jackets, shoes and dressed in light clothing as shown
in figure 3. Both weight and height data were collected at the same day from each subject using the
calibrated equipment and standardized techniques. Every measurement was taken by the researchers
in order to reduce variability among data collectors.

13
Figure 3: Weight and height measurements from the field work
4.5 Data processing and analysis
For dietary intake: The weights of food consumed by each individual were converted in energy,
protein, fat and CHO using the food composition table developed by the FAO for use in Africa and
a local food composition table for use in Bandundu province, DR Congo (41, 42). Dietary data were
available for 70 subjects (of the 76 subjects), because data from 5 children under 2 years of age
were excluded due to missing intake from breastfeeding. In addition, one adult female was also
excluded because only part of her daily intake was weighed (incomplete weighing of her intake).
Statistical analysis was carried out using the Statistical Package for Social Sciences (SPSS), version
21.0 and subjects were categorized in to three age groups for each sex (3-9 years, 10-17 years and
18-61 years). Using the descriptive statistics mean and standard deviations of energy and
macronutrients intakes were obtained by averaging individual intakes over the number of days with
WFR complete. To assess adequacy of protein and fat, the percentage of energy from each
macronutrient (E %) was calculated by dividing the 3-day average energy provided from each
macronutrient by the average 3-day TEI and then multiplying the fraction by 100. The mean energy
provided from each macronutrient was obtained by multiplying each mean macronutrient intake (in
grams) with the amount of energy released by oxidation of 1 gram of macronutrient (i.e. protein and
CHO each release 4 kcal/g and fat 9 kcal/g). The mean E % from protein and fat was assessed for
its adequacy by comparing with the AMDRs. In the same way, the mean energy obtained
specifically from cassava and its percentage contribution to the mean TEI for each individual was
calculated. We subsequently assessed the dominance of cassava in the dietary patterns of this
population.

14
Estimation of BMR for each subject was calculated using the standard equations based on weight,
age, and sex (14, p.70) and was used for estimating BMR factors, which is the ratio of reported EI
to estimated BMR (EI: BMR). Using the ratio, we assessed the quality of our study in recording
individual EI by comparing the calculated BMR factor with cut-off values of BMR factor <1.35
(potentially under recorded), 1.35-2.39 (normal range), and ≥ 2.4 (possible over recorded). Besides
those, energy and macronutrients intakes of each individual were also assessed for adequacy by
comparing with each individual’s EER for energy and RDA for protein and fat. The EER was
calculated using the equations developed by IOM based on age, sex, weight, height and PAL of an
individual (23, p.83). For those with measured PA, the activities levels were categorized as
sedentary (PAL 1.0-1.39), low active (PAL 1.4-1.59), active (PAL 1.6-1.89), and very active
(PAL1.9-2.5 (23, p.83, 28). For those without measured PA, we made an assumption that all
individual intakes of energy was expended (assumption was done by referring other studies and
considering individual weight as stable) (43), thus BMR factor was used to estimate individual’s
PAL. Then using the equations developed by IOM, EER of each individual was calculated.
Regarding the RDA, those proposed by IOM for each macronutrient were used. Thereafter
comparisons (EI vs EER and macronutrient intake vs it’s RDA) were done using Wilcoxon’s
signed-rank test and a p-value of < 0.05 was used for the level of significance. Besides these
percentages of EER (% EER) was also calculated as proportion of EI per day to EER, then % EER
used to see the % coverage of EI in relation to EER.
For BMI: As with the dietary intake analysis, BMI data were analyzed using SPSS, version 21.0.
BMI of each subject was calculated using the mathematical calculation weight in kilograms divided
by the square of the height in meter (kg/m2). The calculated BMI was categorized in to different
BMI-categories using the WHO classification table used for adults BMI (36). Thereafter, BMI-
categories were stratified by age, sex and residence village and proportion of each BMI-category
was calculated and tabulated. To investigate the socio-demographic factors associated with being
underweight, logistic regression was used. We also calculated cumulative proportion of the BMI-
categories in different age groups for each sex. Based on this information an ogive graph
(cumulative frequency graph) was constructed to illustrate the proportion distribution of BMI-
categories in the stratified age groups.

15
4.6 Ethical considerations
Ethical approval for the study was obtained from Uppsala Academic Hospital Research Ethics
Committee. At the time of data collection, no ethics committee existed in DR Congo. Thus, only
verbal consent was required and it was obtained from both the community leaders and participants.
No further ethical approval was deemed necessary for this current analysis. The research funding
was granted by the Swedish Sida/Sarec and Uppsala University.

16
5. Semi-systematic review of literature
5.1. Objective and rationale of the literature review
The objective of our literature search was to put our own observations from DR Congo of
monotonous diets and low BMI in an African perspective. Thus, our literature search aimed to
explore if similar diets or BMI distributions had been documented in other free-living African
populations and to compare our own findings to other studies. To make our research question
focused and manageable within our time frame and resources, we scaled down the review to include
only African studies which had used weighed food records for estimating food consumption of
individuals or studies reporting BMI in adult populations.
5.2. Search strategy and selection criteria
To address this objective a semi-systematic approach was adopted, with a non-strict protocol to
identify and locate a broad range of published material. The following inclusion and exclusion
criteria were used:
Inclusion criteria
Primary research directly related to the research topic
Studies conducted on free-living humans in Africa
Published literature in English language
Only studies which had used WFR for dietary intake assessment or reporting BMI in adults
Any type of study design
Including all age groups
Exclusion criteria
Studies conducted on pregnant or lactating women or adolescents for BMI assessment
Studies carried out on subjects with any health problem
Studies assessed dietary intakes of subjects during special time (e.g. religious fasting)
Studies with no online abstract
5.3. Methods of searching the literature
The four main approaches mentioned by Helen Aveyard, have been used in finding the relevant
literature, with the intention of achieving the highest possible retrieval rate (44). These are a)
electronic searching of databases, b) reference list searching, c) relevant online journal searching,
and d) author searching.

17
5.3.1 Electronic searching of databases
In this searching approach, three databases have been searched: PubMed, Embase, and Cinahl. We
conducted two separate searches in each database, one for dietary intake assessment and other for
BMI assessment. Limitations were English language and human species studies in Africa, with no
time or age restriction. The strategy that has been used in searching the electronic database is shown
in table 2 below.
Table 2: Searching records from electronic databases
Electronic database
Keywords and searching terms (query text)
Limitations
Total number of hits
PubMed (August 2014)
("Diet Records"[Mesh] AND "Africa"[Mesh]) OR ("Diet Records"[Mesh] OR (diet OR diets OR dietary) AND record*[Title/Abstract]) AND ("Africa"[Mesh])
English language Human species studies
284
("Body Mass Index"[Majr]) AND ("Africa"[Mesh])
English language Human species studies
156
Embase (OVID) (August 2014)
1. ((diet or diets or dietary) adj4 record*).tw. (3766)
2. exp Africa/ or Afric*.tw. (319210) 3. 1 and 2 (88)
English language Human species studies
80
1. (Body mass index or BMI).tw. (216800) 2. exp *body mass/ (15011) 3. 1 and 2 (13229) 4. exp Africa/ (215528) 5. 3 and 4 (179)
English language Human species studies
174
Cinahl (EBSCO) (August 2014)
S7 S3 AND S6 128 S6 S4 OR S5 45,606 S5 TI Africa* OR AB africa* 25,619 S4 (MH "Africa+") 28,843 S3 S1 OR S2 4,584 S2 TI ( (diet OR diets OR dietary) N4 record* ) OR AB ( (diet OR diets OR dietary) N4 record* ) 565 S1 (MH "Diet Records") 4,347
English language Human species studies
128
S3 S1 AND S2 33 S2 MH "Africa+" 28,843 S1 (MM "Body Mass Index") 3,590
English language Human species studies
33

18
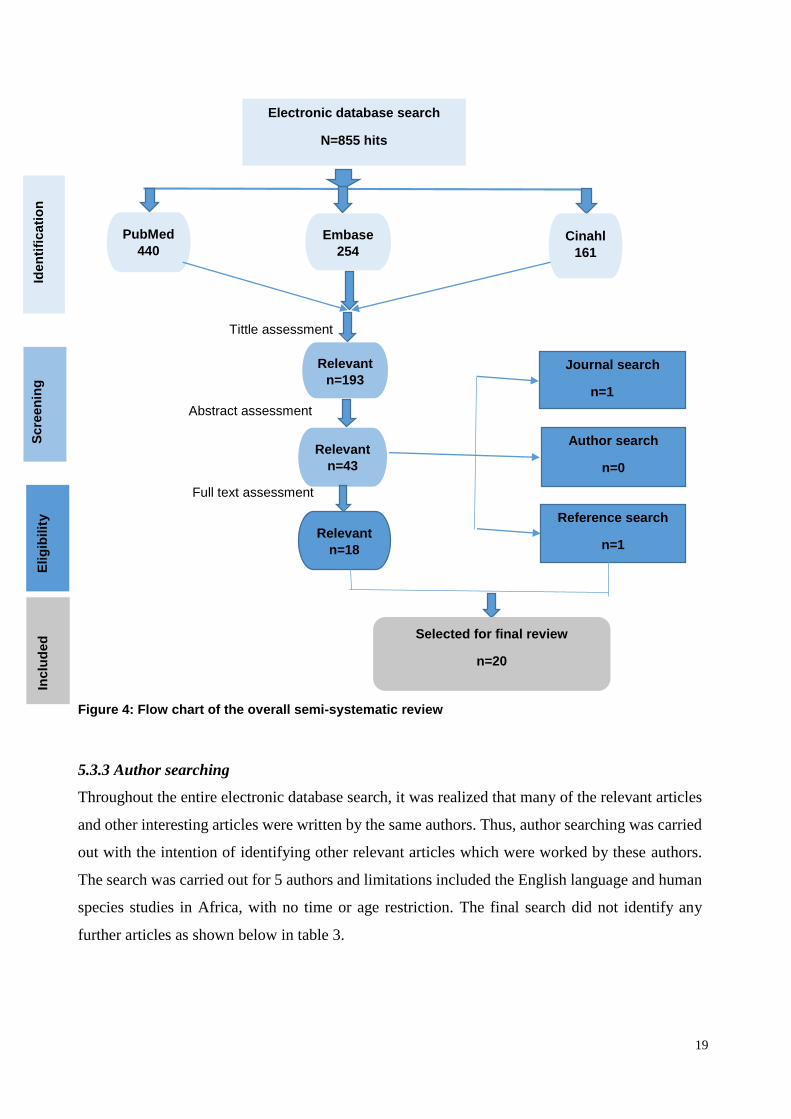
Summary of the electronic databases searching
By searching the three electronic databases, a total of 855 articles were identified, 492 for the
dietary intake assessment and 363 for BMI assessment. All the retrieved articles were exported to
EndNote. Initially the titles of the 855 articles were screened and 193 articles (92 for dietary intake
and 101 for BMI) were found potentially relevant from this assessment. Thereafter, the online
available abstracts for these 193 articles were searched and those with unavailable online abstract
were ruled out from the review. Then, abstract assessment were carried out for these with available
abstract and only 43 key articles (21 for dietary intake and 22 for BMI) were identified relevant to
our research topic. Finally, full text assessment was done for those key articles, and 18 articles (9
for dietary intake and 9 for BMI) were identified as relevant for the final review. More than half
of the key articles were found irrelevant after full text assessment either due to poor quality or they
were not directly relevant to our research topic. Some studies assessed dietary intake of young
children without measuring intake from breastfeeding, such studies were considered not to fully
examine the nutrient intake level of the young children and were therefore excluded. We also
excluded studies which reported BMI of adolescents, because of the discrepancies in the timing of
puberty and changes in anthropometric indices in these communities. Figure 4 shows the flow chart
of the entire search.
5.3.2 Hand searching relevant online journals
The key articles identified after abstract assessment were identified to be published in different
journals. Of the 43 key articles, 9 were published in the journal of Public Health Nutrition, 5 in the
American Journal of Clinical Nutrition, 3 in the Maternal and Child Nutrition. In addition to this,
we realized that in the entire search a number of interesting articles were found to be published in
these journals. We also put in consideration to our review’s inclusion criteria (i.e. only studies
conducted in Africa), hence one African journal was included in the search. Thus, the content pages
of these four journals were searched for other relevant articles that were not identified through
other searching approaches.
1. Public Health Nutrition (1998-2014)
2. American Journal of Clinical Nutrition (2000-2014)
3. Maternal and Child Nutrition (2005-2014)
4. The East African Medical Journal (2000-2014)
After we searched all the published articles in those journals within the above mentioned range of
time, we identified only one additional relevant article and this one was included in the review.
19
Tittle assessment
Abstract assessment
Full text assessment
Figure 4: Flow chart of the overall semi-systematic review
5.3.3 Author searching
Throughout the entire electronic database search, it was realized that many of the relevant articles
and other interesting articles were written by the same authors. Thus, author searching was carried
out with the intention of identifying other relevant articles which were worked by these authors.
The search was carried out for 5 authors and limitations included the English language and human
species studies in Africa, with no time or age restriction. The final search did not identify any
further articles as shown below in table 3.
Relevant
n=193
n
Electronic database search
N=855 hits
PubMed
440
Embase
254 Cinahl
161
Relevant
n=43
Author search
n=0
Reference search
n=1 Relevant
n=18
Selected for final review
n=20
I
den
tifi
cati
on
Elig
ibilit
y
In
clu
ded
Journal search
n=1
S
cre
en
ing

20
Table 3: Searching strategy using authors
Author name
Total number of hits
Potentially relevant articles
Number of articles included
Reasons for exclusion of the potentially relevant articles
Gibson RS
231
8
0
2 identified by electronic database(duplicate) 6 irrelevant
Ferguson EL
58
4
0
1 duplicate, 3 irrelevant
MacIntyre UE
22
2
0
1 duplicate 1 not relevant
Abebe Y
33
3
0
1 duplicate 1 unavailable online abstract 1 not relevant
Shetty PS
140
7
0
1 duplicate 5 irrelevant 1 unavailable online abstract
5.3.4 Reference lists searching
Reference lists of the 43 key articles were scrutinized for further references that might be relevant
to the research topic. In this search it was noticed that most of the key articles had been used as
references for each other. After we went throughout the 43 key article’s references we identified
only one additional article for further review.
5.4 Quality appraisal of the selected studies
The quality of each selected article was critically appraised using the STROBE statement
(STrengthening the Reporting of Observational Studies in Epidemiology). The STROBE statement
is a reporting guideline consisting of a checklist of 22 items, including developed recommendations
on what should be covered in an accurate and complete report of observational studies. Tables 4
and 5 show summary characteristics of studies included in the review.

21
Table 4: Characteristics of studies reviewed for dietary intake
Study.no References (Year)
Country
Aim of the study
Study design
subjects
WFR Duration
Main WFR findings/conclusion
Study 1 Haileslassie K, et al.(5) (2013)
Ethiopia
To assess feeding habits, nutritional status and related factors of women
Cross-sectional survey
60 women aged 15-49 y
One-day
Nutrients intake were below recommended intakes, except iron far higher
Main study limitations
Efforts to address potential bias were inadequate. Only one day WFR, which opens for social desirability bias.
Study 2 McAfee AJ, et al.(45) (2012)
Seychelles
To assess the nutritional adequacy of children
Cohort
229 children aged 5 years
4-day WF diaries
Nutrients were adequate for most children, except Zn, niacin and vitamin A
Main study limitations
Eligibility criteria, methods of selection were not described at all. Efforts to address bias were insufficient. No specific Dietary Reference Value (DRV) for study area was used (Instead, UK DRV was used). No discussion about generalizability of the study
Study 3 Ponka R, et al.(46) (2011)
Came-roon
To investigate dietary intake, zincemia, and cupremia of schoolchildren
Cross-sectional
Children aged 7-18 years,(211 in rainy, & 200 in dry season)
7-day measured food diaries
Energy and nutrient were below reference values, except Zn, Fe, Mg and vitamin E
Main study limitations
Study’s design was not described and was unclear. Eligibility criteria, methods of selection, sample size arrival were not described. Statistical methods were not described adequately. Limitations and generalizability of the study were not discussed.
Study 4 Mitchikpe CE, et al.(47) (2009)
Benin
To analyse the food pattern and resulting energy and nutrient intake of school children
Longitudinal
80 Children aged 6-8 years in 2 seasons
3-day
Energy and nutrient intakes were adequate for most children
Main study limitations
Study design was not mentioned in the title and abstract. Eligibility criteria, missing data, follow up and sample size calculation were not described. No information on potential confounders, limitations and generalizability of the study.
Study 5 Gibson RS, et al.(48) (2009)
Ethiopia
To see if children feeding practices and behaviours conform to the WHO guidelines
Cross-sectional
97 Children Aged 0.5-2 years
1-day
Energy and nutrient intakes were below the estimated need, except protein.
Main study limitations
Study design was not mentioned either on the tittle or abstract. Efforts to minimize bias were not adequate and only one day WFR was done. No information on potential confounders and sample size calculation.
Study 6 Gewa CA, et al.(49) (2009)
Kenya
To compare the relative validity of WFR with 24 h recall.
Cross-sectional
42 Children aged 6-8 years and their mothers
1- day
Dietary intake were inadequate compared with recommended intake
Main study limitations
Background information was insufficient. Eligibility criteria, sample size calculation and generalizability of the study were not discussed. Efforts to tackle bias were not enough and only 1-day WFR.
Study 7 Blaney S, et al.(19) (2009)
Gabon
To assess dietary adequacy and nutritional status in rural communities
Com-munity-based survey
500 subjects in all age groups
7-day
Energy, iron and vitamin A intakes were low but protein was fairly adequate.
Main study limitations
Efforts to avoid potential bias were insufficient. Study results were not interpreted cautiously in relation to other studies results.

22
Study 8 MacIntyre UE, et al. (50)(2001)
South African
To determine relative validity of the FFQ,WFR and biomarkers
Cross-sectional
74 adults aged 15-65 years
7-day
Nutrient intakes were not far from recommended intakes except calcium.
Main study limitations
No information on setting, dates, eligibility criteria and methods of selection. Effort to address potential bias and confounders were not enough. Sample size calculation, limitations and generalizability of the study were not discussed.
Study 9 & 10 Kigutha HN, et a.(49) (1997)
Kenya
To compare the validity of repeated 24-h with WFR
Cross-sectional
41 Children ( no. 9) & 41 elderly ( no.10)
3-day
Energy and nutrient intakes of both groups were not far from recommended intakes.
Main study limitations
Study design was unclear. No information about eligibility criteria, sample size calculation and demographic characteristics. Efforts to address bias were inadequate. No discussion about results, limitations, external validity and funding
Table 5: Characteristics of studies reviewed for BMI
Study No. References (Year)
Study nation/s
Study aim
Study design
Subjects for BMI used
Confounders controlled
Main findings BMI (%)
Study 11 Gomes A, et al.(51) (2010)
Mozambique
To quantify the prevalence of obesity and overweight
Cross-sectional
2913 adults aged 25-64 years
age, sex, residence place, education, family income
Women: <18.5 (11), 18.5-24.99 (64.7), 25-29.99 (14.9), ≥30 (9.4) Men: <18.5 (13.2), 18.5-24.99 (72.5), 25-29.99 (11.2), ≥30 (3)
Main study limitations
Study design was not described in the abstract. Limitations, generalizability and sources of funding of the study were not discussed.
Study 12 Tesfaye F, et al.(52) (2007)
Ethiopia and two Asian nations
To examine the relations between BMI and blood pressure
Cross-sectional
7675 aged 25-64 years (Ethiopian=3793)
age, sex, residence , education, BMI categories & occupation
Ethiopian men :< 18.5 (36.7), 18.5-24.99 (60.8%), ≥25 (2.5), women : <18.5 (42.7), 18.5-24.99 (55.1) ≥25 (2.2)
Main study limitations
No discussion about limitations, and external validity of the study.
Study 13 Cilliers J, et al.(53) (2006)
South-Africa
To explore relationship between BMI and weight control acts
Cross-sectional
360 female university students aged 18±0.4 years
year of birth, weather, medication, accommodation, illness and smoking
Female students <18.5 (7.2), 18.5-24.9 (81.9) 25.0-29.9 (10) ≥30 (0.8)
Main study limitations
No information on relevant dates of the study. Efforts to address bias were not adequate. No information on sample size calculation. Limitations and generalizability of the study were not discussed.
Study.14 James WPT, et al.(54) (1999)
Ethiopia (north region), Zimbabwe and India
To evaluate relationship between children’s malnutrition & maternal BMI
community -based survey
3046 Ethiopians aged 32.7 ±9 & 801 Zimbabwe-ans aged 38.4±16
No methods were taken to control confounding
Ethiopia: <18.5 (28), 18.5-24.9 (71), 25-29.9 (1) Zimbabwe: <18.5 (12), 18.5-24.9 (70), 25-29.9 (18)
Main study limitations
Study design was not descried in the abstract. Eligibility criteria was mentioned only for Ethiopian subjects, No information on potential confounders and no discussion about limitations and generalizability of the study

23
N.B. The detailed critical appraisal for each included study using the STROBE checklist is presented in the
appendix.
Study 15 Nube M, et al.(55) (1998)
Ghana
To assess the suitability of BMI as an indicator of living standards
Com-munity -based survey
9214 adults (4961 males and 4243 females) aged 20-64 years
Income and expenditure, educations, access to services, age, housing, & nutritional status of children
Males: <18.5 (16.2), 18.5-24.9 (78.5) 25-29.9 (4.7) ≥30 (0.6) Females: <18.5 (16.6), 18.5-24.9 (65.3), 25-29.9 (12), ≥30 (6.1)
Main study limitations
Study design was descried neither in the tittle nor in the abstract. Limitations, generalizability and sources of funding were not discussed.
Study number Study 16.1 Shetty PS, et al. (56)(1994)
Country Congo (1986-87)
Subjects 2295 adults women
BMI categories (distribution in %) <18.5 (11.1), 18.5-24.9 (73.7), 25-29.9 (11.8), ≥30 (3.4)
Study 16.2 (56)
Ghana (1987-88)
6323 adults of both sex
<18.5 (20), 18.5-24.9 (62.0), 25-29.9 (17.1), ≥30 (0.9)
Study 16.3 (56)
Mali (1991)
4868 adults of both sex
<18.5 (16.3), 18.5-24.9 (76.5), 25-29.9 (6.4), ≥30 (0.8)
Study 16.4 (56)
Morocco (1984-85)
41,921 adults of both sex
<18.5 (7), 18.5-24.9 (69.1), 25-29.9 (18.7), ≥30 (5.2)
Study 16.5 (56)
Tunisia (1990)
10,023 adults of both sex
<18.5 (3.9),18.5-24.9 (58.9), 25-29.9 (28.6), ≥30 (8.6)
Study 17.1 WHO global database on BMI 2007 (36) Study 17.2 (36) Study 17.3 (36)
DR Congo Nationwide (2007)
4097 females aged 15-49 years
<18.5 (18.5), 18.5-24.99 (70.3), 25-29.9 (8.9),
≥30 (2.4%)
DR Congo Subnational (2005)
755 males aged 15-100
< 18.5 (27.8), 18.5-24.99 (61.1), 25-29.9 (8.5),
≥30 (2.6)
Bandundu province (2007)
688 females aged 15-49 years
<18.5 (30.8), 18.5-24.99 (68 %), 25-29.9 (1.2%), ≥30
(2.4%)

24
6. Results
I. Dietary intake
Socio-demographic and anthropometric characteristics of study participants
Of the 76 individuals included from twelve households in Nkay-Kalengi, 70 (92%) had usable WFR
data. The sample comprised 34 (49%) males and 36 (51%) females in all age groups with the mean
age of 23 ± 16 years. Children aged 3-9 years, adolescents aged 10-17 years, and adults aged 18-61
years represented 25%, 21% and 54 % of the study participants, respectively. The mean ± SD
household size in the households was 8 ± 3 persons. Measurements of weight and height were
available for 68 and 47 individuals, respectively. For male adults, mean weight and height were
49 ± 6 kg and 161 ± 9 cm, respectively; for female adults, these values were 43 ± 6 kg and 151 ± 7
cm, respectively.
Table 6: Socio-demographic and anthropometric characteristics of study participants in Nkay-Kalengi and completeness of data
Number N=70
n
%
x̅ ± SDa
Households 12 Household size 8 ± 3 2-6 persons 5 42 7-10 persons 5 42 >10 persons 2 16 Individuals 70 Male 34 49
Female 36 51 Age group 23± 16 3-9 years 18 25 10-17 years 15 21 18-61 years 37 54 Weight 68 34 ± 15 <20 kg 18 27 20-40 kg 20 29 41-60 kg 30 44 Height 47 134 ± 25 <100 cm 7 15 100-145 cm 22 47 > 145 cm 18 38 WFRb 70 With PAc Without PA 3 days complete 59 84 9 50 2 days complete 8 12 1 7 1 day complete 3 4 1 2
a mean and standard deviation, b Weighed food records, cPhysical activity.
Completeness of the data
Dietary intake for the majority (84%) of participants was complete for 3 days WFR, whereas the
remaining 16% of individuals had complete measurements for either one or two days (12% with
two days complete WFR and 4 % with one day complete WFR). During data collection, the

25
researchers also observed the PA of 11 women for three consecutive and complete days. Data
regarding dietary intakes were incomplete for two of these women (one woman had one day
incomplete WFR and the other woman had two days incomplete WFR (table 6).
Macronutrient intakes
Mean and SD of macronutrient intakes of study participant categorized by their age and sex, table
7. Intakes of macronutrient in all age groups were higher in males than in females, except CHO
intake in adolescents was higher in females than observed in males. Assesment of macronutirenst
intakes in comparision to AMDR and RDA are presented in tables 9 and 11.
Table 7: Macronutrient intakes per day of study participants (N=70) in Nkay-Kalengi
Average intake per day of Weighed Food Records Male Female
Age group n x̅ ± SD n x̅ ± SD
3-9 years 9 9 Protein (g) 15 ± 3 14 ± 7 Fat (g) 19 ± 11 14 ± 11 CHO (g) 247 ± 69 192 ± 97 10-17 years 9 6 Protein (g) 27 ± 12 18 ± 7 Fat (g) 31 ± 12 18 ± 10 CHO (g) 317 ±116 392 ± 143 18-61 years 16 21 Protein (g) 29 ± 16 25 ± 11 Fat (g) 40 ± 32 31 ± 18 CHO (g) 519 ± 204 438 ± 116
CHO is carbohydrate.
EI and percentage contribution of energy from cassava to EI
Mean EI, mean energy from cassava, along with the mean % contribution of energy from cassava
to the mean EI for each sex and for combined sexes are presented in table 8. The mean EI increased
with increasing age in combined sexes and was higher in males than in females. Cassava was the
principal energy source and its contribution was more than three-fourths of the mean EI in all age
groups. In children of both sexes, the mean energy from cassava contributed 77 % of the mean EI,
in which the proportion of contribution was higher in males than in females. Similarly, the role of
cassava in adolescents EI was also great. Of the 2043 Kcal mean intake for both sexes, 81% was
derived from cassava, of all age groups the highest % contribution was seen in females’ adolescents,
i.e. 86 % of the EI provided from cassava. As seen in the other age group, adults’ energy intake was
also dominated by cassava consumption. Of the 2757 Kcal mean intake in males, 83 % was provided
from cassava, in females of the 2256 Kcal mean intake 79 % was contributed by cassava and in
combined sexes the % contribution was 81 %. These findings suggest that the dietary patterns in

26
those participants were very monotonous as the majority of their energy generated from one source
(i.e. cassava).
Table 8: Energy intakes, energy from cassava, and the percentage contribution of energy from
cassava to mean energy intakes (E%) of study participants (N=70) in Nkay-Kalengi
Average for 3 day Weighed Food Records
Male Female Combined sexes
Age group n x̅ ± SD n x̅ ± SD x̅ ± SD
3-9 years 9 9 Energy (kcal) 1295 ± 247 1148 ± 346 1222 ± 301 Cassava (kcal)a 1031 ± 289 874 ± 353 952 ± 323 Cassava (E%)b 79± 10 76 ± 18 77 ± 14 10-17 years 9 6 Energy (kcal) 2079 ± 711 1987 ± 638 2043 ± 660 Cassava (kcal) 1617 ± 541 1715 ± 567 1656 ± 534 Cassava (E%) 78 ± 10 86 ± 6 81 ± 9 18-61 years 16 Energy (kcal) 2757 ± 748 21 2256 ± 658 2472 ± 733 Cassava (kcal) 2279 ± 609 1779 ± 567 1995 ± 629 Cassava (E%) 83 ± 8 79 ± 11 81 ± 10
Cassava (Kcal)a is the amount of energy provided by cassava, Cassava (E%)b is the percentage
contribution of cassava to the EI. Mean and SD were tabulated based on individually calculated values.
Energy derived from macronutrients
The mean percentage of energy derived from macronutrients in comparision with the AMDRs in
three age groups are shown in table 9. In children, mean E% from protein and fat were almost half
of the lower limits of the AMDRs. In adolescents, mean E% contributed from each macronutrient
also fell outside the AMDRs. The mean E% from protein and fat were substantially below the
lower limit of the AMDR. Similar to the results determined for the other age groups, adults’ energy
derived from macronutrients was also fell ouside the AMDRs. The mean pecentage of the energy
from protein (4.3 %) and fat (12.1 %) were lower than the current recommendations (for a mimimum
intakes of 10 % of protein energy and 20 % of fat energy). To summarize, the percentage of protein
and fat were both far below the lower limits of AMDRs. Thus, it could be noted that the consumption
of protein and fat yielding foods was too low. The values in this table correlate with values seen in
table 7, as dietary patterns were highely dominated with casssva (mainly cassva roots). This may
explain why the % protein and % fat were below the lower limit of AMDRs.

27
Table 9: Mean EI from macronutrients in relation to the AMDRs of study participants (N=70) in Nkay-Kalengi
Age groups n
Macronutrients
Mean energy (Kcal) from macronutrients
% of mean energy (E%)
AMDR* (E%)
3-9 years 18 Protein 57 4.9 10-30 Fat 148 12.7 25-35 CHO 878 69.9 45-65
10-17 years 15 Protein 92 4.5 10-30 Fat 229 11.4 25-35 CHO 1388 71.5 45-65
18-61 years 37 Protein 106 4.3 10-35 Fat 315 12.1 20-35 CHO 1892 77.3 45-65
AMDRs* are the range of intake for a particular energy source and expresses as percentage of mean energy
(E%). Mean energy from macronutrients and E% were tabulated based on individually calculated values.
BMR factors related to sex and age
The BMR factor was used to assess if reported energy intakes were reasonable in terms of
individuals’ energy requirements, table 10. The highest mean value was reported in male
adolescents, followed by almost similar values in adults of both sexes. The lowest mean value was
reported in female children. When we look at the individually calculated values (see Appendix table
19 and 20), it can be seen that 13 participants had a BMR factor < 1.35 (indicating underreporting
or biologically implausible energy intakes). Of those 13 participants, 7 were children, 2 were
adolescents and 3 were adults. Ten additional participants (8 adults and 2 adolescents) had a BMR
factor ≥ 2.4 (indicating high EI or potential overreporting). To sum up, 19 % of the participants had
less than the lower limit of BMR factor, and most of them were children. Fourteen percent had
higher EI than the reasonable energy requirmet (where the majority were adults).
Table 10: Mean BMR factors per day of study participants in Nkay-Kalengi (N=68)
Average for 3 day Weighed Food Records
Male Female
Age group n x̅ ± SD n x̅ ± SD
3-9 years 8 8
BMR factor 1.56 ± 0.27 1.38 ± 0.39
10-17 years 9 6
BMR factor 1.98 ± 0.64 1.82 ± 0.56
18-61 years 16 21
BMR factor 1.94 ± 0.52 1.94 ± 0.56
BMR factor (EI/BMR)

28
Nutrient adequacy
Table 11 presents the mean energy and macronutrient intakes in comparison with the EER and RDA
for each sex separately. In children, energy and protein intakes were below the recommended intake
values. However, the mean EI was only slightly below the EER (98 % in males and 94 % in females
of the EER was covered), thus the differences were not significant (p > 0.05 in both sexes). The
magnitude of protein inadequacy was statistically significant (p <0.05 in both sexes). In adolescents,
mean intake of energy was above the recommended intake. The mean EI of males and females were
above the EER by 350 Kcal (26 %) and 92 Kcal (3 %), respectively. Protein intake was far below
the recommended intake limit and inadequacy was higher in females (22 g below RDA) than in
males (13 g lower than RDA). Like in adolescents, mean energy intake of adults was also above the
recommended intakes. The mean EI covered almost 100 % of the EER for both sexes (110 % for
males and 101 % for females). Similar to other age groups, the protein intake in adults was far below
the RDA and only around half parts of the RDA was fulfilled (29 g of the 56 g in males and 25 g of
the 46 g in females) and the differences were statistically significant. Regarding fat intake, no
comparison was done as RDA for fat have not yet determined by the IOM. However when we look
the % of energy from fat (% fat) in relation to AMDR, the % fat was below the lower limit of AMDR
in all groups (table 9), thus it could be concluded that the fat intake was inadequate. In summary,
energy intake of the participants were adequate (except for energy intake of children which was
slightly lower than the EER) in comparison to the recommended intake. Protein and fat intakes were
far below the RDA.
Energy expended for physical activity and energy consumed
Energy expended and energy consumed for women with measured PAL are presented in table 12.
Of the 11 women, 5 expended greater amounts of energy for PA than what they had consumed.
Thus energy was considered negatively balanced, as their output (energy expenditure) exceeded
their input (energy consumed). Energy expenditure was almost equal to energy consumed for 4
mothers. Therefore energy was considered balance in these mothers, as the difference between input
and output was very small. In the remaining mothers, energy was positively balanced for one mother
(input was higher than output), but energy was measured incomplete in mother 3. To sum up, total
energy was negatively balanced for 5 mothers, maintain balanced for 4 mothers, positively balanced
for one mother and was incomplete for one mother.

29
Table 11: Mean energy and macronutrients intake per day in comparison to EER and RDA of study
participants (N=70) in Nkay-Kalengi
Per day EERa/RDA b % EER consumed Male Female Male Female Male Female Age group Mean Mean Mean Mean Mean Mean p-value1 p-value2
3-9 years Energy (kcal)a 1295 1148 1361 1064 98 94 0.48 0.345 Protein (g)b 15 14 19 19 0.011 0.046
Fat (g) b 19 14 ND ND CHO (g) b 247 192 130 130 0.008 0.086 10-17 years Energy (kcal) 2079 1987 1729 1895 126 103 0.018 0.465
Protein (g) 27 18 40 40 0.66 0.028 Fat (g) 31 18 ND ND CHO (g) 317 392 130 130 0.008 0.028 18-61 years
Energy (kcal) 2757 2256 2417 2190 110 101 0.401 0.554 Protein (g) 29 25 56 46 0.001 0.00 Fat (g) 40 31 ND ND CHO (g) 519 438 130 130 0.000 0.000
EERa is the average daily energy intake level predicted to maintain the needs of half of the healthy individuals in a group .RDAb is the average daily dietary intake level sufficient to meet the requirement of almost all (97-98 %) of healthy individuals in a group. ND (not determined). %EER consumed was calculated as proportion of EI per day to EER. P-value1 and p-value2 are significances levels between intakes per day and the references (EER and RDA) for male and female respectively. Means were tabulated based on individually
calculated values shown in appendix.
Table 12: Energy expenditures for PA in relation to energy consumed of women (n=11)
Mother number
Day 1 PAL
Day 2 PAL
Day 3 PAL
Average PAL
Energy consumed (BMR factor)
Difference (EI – PAL)
Energy Balance
Mother 1 1.48 1.39 1.36 1.41 1.39 0.02 balanced
Mother 2 1.71 1.66 1.67 1.68 1.69 -0.01 balanced
Mother 3 1.95 1.41 1.68 1.19 0.49 incomplete
Mother 4 1.67 1.63 1.88 1.73 1.71 0.02 balanced
Mother 5 1.81 2.07 1.75 1.88 1.87 0.01 balanced
Mother 6 1.93 2.23 1.68 1.95 1.45 0.50 negative
Mother 7 1.97 2 1.9 1.96 1.55 0.41 negative
Mother 8 2.22 1.47 2.19 1.96 1.8 0.16 negative
Mother 9 2.04 2.09 1.82 1.98 1.61 0.37 negative
Mother 10 1.7 2.22 2.24 2.05 2.3 -0.25 positive
Mother 11 2.25 1.88 2.1 2.08 1.6 0.48 negative
Average 1.85 1.65
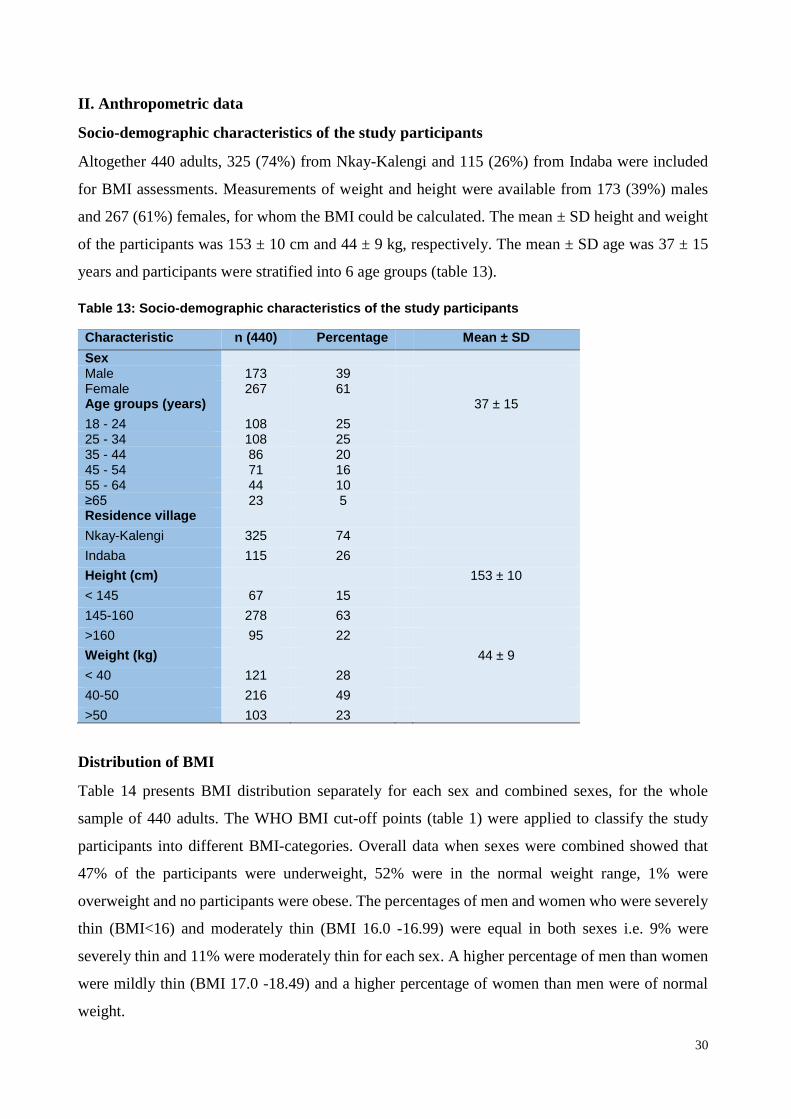
30
II. Anthropometric data
Socio-demographic characteristics of the study participants
Altogether 440 adults, 325 (74%) from Nkay-Kalengi and 115 (26%) from Indaba were included
for BMI assessments. Measurements of weight and height were available from 173 (39%) males
and 267 (61%) females, for whom the BMI could be calculated. The mean ± SD height and weight
of the participants was 153 ± 10 cm and 44 ± 9 kg, respectively. The mean ± SD age was 37 ± 15
years and participants were stratified into 6 age groups (table 13).
Table 13: Socio-demographic characteristics of the study participants
Characteristic n (440) Percentage Mean ± SD
Sex Male 173 39 Female 267 61 Age groups (years) 37 ± 15
18 - 24 108 25 25 - 34 108 25 35 - 44 86 20 45 - 54 71 16 55 - 64 44 10 ≥65 23 5 Residence village
Nkay-Kalengi 325 74
Indaba 115 26
Height (cm) 153 ± 10
< 145 67 15
145-160 278 63
>160 95 22
Weight (kg) 44 ± 9
< 40 121 28
40-50 216 49
>50 103 23
Distribution of BMI
Table 14 presents BMI distribution separately for each sex and combined sexes, for the whole
sample of 440 adults. The WHO BMI cut-off points (table 1) were applied to classify the study
participants into different BMI-categories. Overall data when sexes were combined showed that
47% of the participants were underweight, 52% were in the normal weight range, 1% were
overweight and no participants were obese. The percentages of men and women who were severely
thin (BMI<16) and moderately thin (BMI 16.0 -16.99) were equal in both sexes i.e. 9% were
severely thin and 11% were moderately thin for each sex. A higher percentage of men than women
were mildly thin (BMI 17.0 -18.49) and a higher percentage of women than men were of normal
weight.
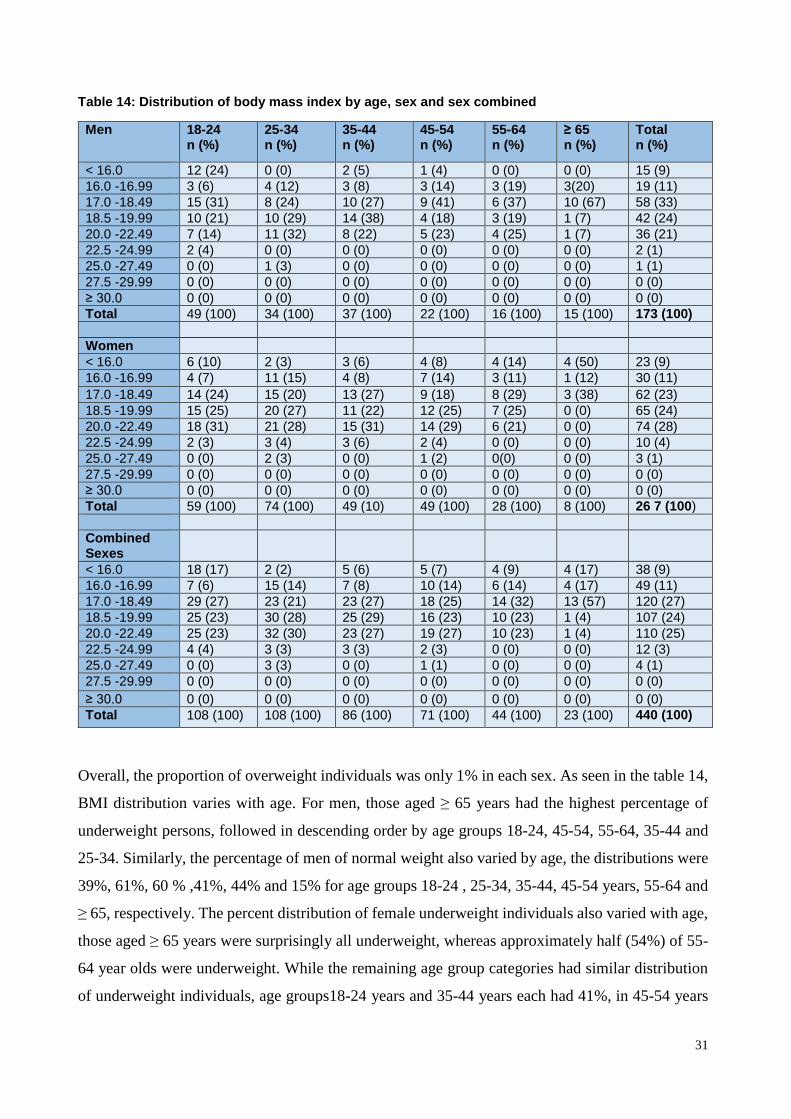
31
Table 14: Distribution of body mass index by age, sex and sex combined
Men 18-24 n (%)
25-34 n (%)
35-44 n (%)
45-54 n (%)
55-64 n (%)
≥ 65 n (%)
Total n (%)
< 16.0 12 (24) 0 (0) 2 (5) 1 (4) 0 (0) 0 (0) 15 (9)
16.0 -16.99 3 (6) 4 (12) 3 (8) 3 (14) 3 (19) 3(20) 19 (11)
17.0 -18.49 15 (31) 8 (24) 10 (27) 9 (41) 6 (37) 10 (67) 58 (33)
18.5 -19.99 10 (21) 10 (29) 14 (38) 4 (18) 3 (19) 1 (7) 42 (24)
20.0 -22.49 7 (14) 11 (32) 8 (22) 5 (23) 4 (25) 1 (7) 36 (21)
22.5 -24.99 2 (4) 0 (0) 0 (0) 0 (0) 0 (0) 0 (0) 2 (1)
25.0 -27.49 0 (0) 1 (3) 0 (0) 0 (0) 0 (0) 0 (0) 1 (1)
27.5 -29.99 0 (0) 0 (0) 0 (0) 0 (0) 0 (0) 0 (0) 0 (0)
≥ 30.0 0 (0) 0 (0) 0 (0) 0 (0) 0 (0) 0 (0) 0 (0)
Total 49 (100) 34 (100) 37 (100) 22 (100) 16 (100) 15 (100) 173 (100)
Women
< 16.0 6 (10) 2 (3) 3 (6) 4 (8) 4 (14) 4 (50) 23 (9)
16.0 -16.99 4 (7) 11 (15) 4 (8) 7 (14) 3 (11) 1 (12) 30 (11)
17.0 -18.49 14 (24) 15 (20) 13 (27) 9 (18) 8 (29) 3 (38) 62 (23)
18.5 -19.99 15 (25) 20 (27) 11 (22) 12 (25) 7 (25) 0 (0) 65 (24)
20.0 -22.49 18 (31) 21 (28) 15 (31) 14 (29) 6 (21) 0 (0) 74 (28)
22.5 -24.99 2 (3) 3 (4) 3 (6) 2 (4) 0 (0) 0 (0) 10 (4)
25.0 -27.49 0 (0) 2 (3) 0 (0) 1 (2) 0(0) 0 (0) 3 (1)
27.5 -29.99 0 (0) 0 (0) 0 (0) 0 (0) 0 (0) 0 (0) 0 (0)
≥ 30.0 0 (0) 0 (0) 0 (0) 0 (0) 0 (0) 0 (0) 0 (0)
Total 59 (100) 74 (100) 49 (10) 49 (100) 28 (100) 8 (100) 26 7 (100)
Combined Sexes
< 16.0 18 (17) 2 (2) 5 (6) 5 (7) 4 (9) 4 (17) 38 (9)
16.0 -16.99 7 (6) 15 (14) 7 (8) 10 (14) 6 (14) 4 (17) 49 (11)
17.0 -18.49 29 (27) 23 (21) 23 (27) 18 (25) 14 (32) 13 (57) 120 (27)
18.5 -19.99 25 (23) 30 (28) 25 (29) 16 (23) 10 (23) 1 (4) 107 (24)
20.0 -22.49 25 (23) 32 (30) 23 (27) 19 (27) 10 (23) 1 (4) 110 (25)
22.5 -24.99 4 (4) 3 (3) 3 (3) 2 (3) 0 (0) 0 (0) 12 (3)
25.0 -27.49 0 (0) 3 (3) 0 (0) 1 (1) 0 (0) 0 (0) 4 (1)
27.5 -29.99 0 (0) 0 (0) 0 (0) 0 (0) 0 (0) 0 (0) 0 (0)
≥ 30.0 0 (0) 0 (0) 0 (0) 0 (0) 0 (0) 0 (0) 0 (0)
Total 108 (100) 108 (100) 86 (100) 71 (100) 44 (100) 23 (100) 440 (100)
Overall, the proportion of overweight individuals was only 1% in each sex. As seen in the table 14,
BMI distribution varies with age. For men, those aged ≥ 65 years had the highest percentage of
underweight persons, followed in descending order by age groups 18-24, 45-54, 55-64, 35-44 and
25-34. Similarly, the percentage of men of normal weight also varied by age, the distributions were
39%, 61%, 60 % ,41%, 44% and 15% for age groups 18-24 , 25-34, 35-44, 45-54 years, 55-64 and
≥ 65, respectively. The percent distribution of female underweight individuals also varied with age,
those aged ≥ 65 years were surprisingly all underweight, whereas approximately half (54%) of 55-
64 year olds were underweight. While the remaining age group categories had similar distribution
of underweight individuals, age groups18-24 years and 35-44 years each had 41%, in 45-54 years

32
40% and in 25-34 years 38% of the women were underweight. The percentage of women which had
normal weight were similar in most age groups (59%), except in age groups 55-56 years (46%) and
≥ 65 years (0 %). It is worth noting that only 1 % of the participants were overweight, but when we
look the percentage distribution specifically by age group, 3% of the males and 3% of the females
aged 25-34 years, and 2% of women aged 45-54 years were overweight. Besides table 16, figure 2
also illustrates the proportion of different BMI categories for different age groups in the combined
sexes.
Figure 5: Prevalence of underweight, normal weight and overweight by age groups
Factors associated to underweight
Table 15 shows the results of the logistic regression with crude and adjusted odds ratios (ORs),
where the dependent variable was “underweight”. In the adjusted analysis, women were 24% less
likely to be underweight than men, however the association was not statistically significant. Unlike
sex, age had significant association with being underweight. Compared with age group 18-24 years
(younger adults), age group ≥ 65 years were 10.1 times more likely to be underweight than the
younger adults. Even though the age group 55-64 years was 1.3 times more likely to be underweight
than the younger adults, but the association was not statistically significant. While in other age
groups, the likelihood of being underweight was higher in the younger adults, i.e. age groups: 25-
34, 35-44 and 45-54 years were respectively 39 %, 28 % and 10% less likely to be underweight than
the younger adults and but the association was not statistically significant. Like sex, residence area
had no significant association with underweight status; though residences of Nkay-Kalengi were
1.3 times more likely to be underweight than those from Indaba.
50
3741
4655
91
50
60 5953
45
90 3 0 1 0 0
0
10
20
30
40
50
60
70
80
90
100
18-24 25-34 35-44 45-54 55-64 ≥ 65
Pre
vale
nce %
Age groups
Underweight
Normalweight
Overweight

33
Table 15: Factors associated with being underweight* (total 440)
Characteristics n (%) Underweight % COR [95% CI] AOR [95% CI] p-value
Sex
Male 173 (39) 92 (53) 1 1 Female 267 (61) 115 (43) 0.67 [0.45, 0.98] 0.76 [0.51, 1.1] 0.03 Age groups
18 – 24 107 (24) 53 (49) 1 1 25 – 34 109 (25) 40 (37) 0.59 [0.34, 1.0] 0.61 (0.35, 1.0) 0.05 35 – 44 85 (19) 35 (41) 0.71 [0.40, 1.3] 0.72 (0.40, 1.3) 0.2 45 – 54 71 (16) 33 (46) 0.88 [0.48, 1.6] 0.90 (0.50.1.6) 0.6 55 – 64 45 (10) 25 (56) 1.3 [0.63, 2.5] 1.3 (0.64, 2.4) 0.4 ≥65 23 (5) 21 (91) 10.7 [2.4, 47.9] 10.1 (2.2, 45.2) 0.002 Residence Indaba 115 (26) 50 (43) 1 1 Nkay-Kalengi 325 (74) 157 (48) 1.1 (0.8, 2.1) 1.3 (0.8, 2.5) 0.9
*Cut-off point for underweight is BMI < 18.5 kg/m2
Cumulative distribution of BMI for men
Figure 6 shows an ogive graph (cumulative frequency curve) for men, in which cumulative
percentage of BMI distribution displays along the vertical-axis, and BMI categories along the
horizontal-axis for different age groups. In young male adults (18-24 years old), 24% were severely
thin (BMI<16), 30% had a BMI of ≤16.99, 61% were underweight (BMI<18.49), 82% had a BMI ≤
19.99, 96% ranged within BMI ≤ 22.49 and all (100%) fell within the normal range of BMI ≤ 24.99.
In older men (aged ≥65 years), the percentage distributions were as follows: no participant was
severely thin, 20% were within the range of moderate thinness (BMI 16.0 -16.99), 87% of them
were underweight, 93% were in the range of BMI ≤ 19.99 and all (100%) of the participants had a
BMI ≤ 22.49. In the remaining age groups, 5% in the age group 35-34 years, 4% in 45-54 years,
0% in other two groups (24-35 and 55-64 years) were severely thin. The percentage of participants
who were moderately thin or below (BMI ≤ 16.99) in those groups (excluding the age groups 18-
24 and ≥65 years) increased with increasing age and the cumulative distribution was 12%, 13%,
18% and 19% in age groups 25-34, 35-44, 45-54 and 55-64 years, respectively. In the same way the
percentage of participants who were underweight also increased with increasing age for majority of
them, i.e. 36% in 25-34 years, 40% in 35-44 years, 59% in 45-54 years and 56% in 55-64 years. In
four age groups (excluding younger and older adults), the cumulative distribution reached 100%
within the range of BMI ≤ 22.49, with the exemption of age group 25-34 years where only one man
fell within the BMI range of 25-27.49.

34
Figure 6: Cumulative distribution of BMI for men by age group
Cumulative distribution of BMI for women
Figure 7 presents an ogive graph for women, in which the cumulative percentage of BMI
distribution was plotted on the y-axis against different BMI-categories on the x-axis for different
age groups. The cumulative distribution of BMI was almost similar in all age groups (as seen by the
overlapping lines), except in those aged 55-64 and ≥65 years. In all other age groups, the percentage
of participants who were severely thin was ≤ 10% (range 3-10%). Approximately 18% (range 14-
22%) had a BMI ≤ 16.99, closely 40% (range 38-41%) were underweight, and almost all (100%)
fell within or lower than the normal range (BMI ≤ 24.99), with the exception of 3 women: 2 of age
group 25-34 years and 1 of age group 45-54 were overweight ( BMI 25-27.49). In age group 55-64
years, 14% of individuals were severely thin, 25% had BMI≤ 16.99, over half (54%) were
underweight, and more than three-fourths (79%) had a BMI ≤ 19.99. The cumulative distribution
reached 100% in BMI ≤ 22.49. In older women, the cumulative distribution of BMI was different
from that of the other groups; all women were underweight (50 % were severely thin, 63% had BMI
≤ 16.99 and 100% had BMI ≤ 18.49).
0
10
20
30
40
50
60
70
80
90
100
< 16.0 16.0 - 16.99 17.0 - 18.49 18.5 - 19.99 20.0 - 22.49 22.5 - 24.99 25.0 - 27.49
Cu
mu
lati
ve %
BMI categories
18-24
25-34
35-44
45-54
55-64
≥65

35
Figure 7: Cumulative distribution of BMI for women by age group
Prevalence of underweight, normal weight and overweight
Figure 8 presents the prevalence of underweight, normal weight and overweight individuals for each
sex and for the combined sexes. 47% of the adults were underweight; which equates to 53% of
males and 43% of females. Females were slightly more likely than men to be ranged in the normal
weight category. The prevalence of overweight individuals within those participants was almost
non-existent and it was only 1% in each sex
Figure 8: Prevalence of underweight, normal weight and overweight by sex and overall
0
10
20
30
40
50
60
70
80
90
100
< 16.0 16.0 - 16.99 17.0 - 18.49 18.5 - 19.99 20.0 - 22.49 22.5 - 24.99 25.0 - 27.49
Cu
mu
lati
ve %
BMI categories
18-24
25-34
35-44
45-54
55-64
≥ 65
53
46
1
43
56
1
47
52
1
0
10
20
30
40
50
60
Underweight Normal weight Overweight
Pre
vale
nce %
BMI categories
Male
Female
Box sex

36
Distribution of BMI-categories by villages
Figure 9 presents the distribution of BMI separately for residences of Nkay-Kalengi and Indaba.
Residences of those villages were similarly affected by underweight status, as 48% of Nkay-Kalengi
and 44% of Indaba’s residents were underweight. Similarly, the percentage of the residents who
were of normal weight was almost the same, i.e. 51% in Nkay-Kalengi and 56% in Indaba. In both
villages, the number of overweight residents was not a problem, as only 1% of Nkay-Kalengi
residents were overweight and none of the Indaba residents were overweight
Figure 9: Prevalence of underweight, normal weight and overweight by village
48
51
1
44
56
0
0 10 20 30 40 50 60
Underweight
Normal weight
Overweight
Prevalence
BM
I cate
go
ries
Indaba
Nkay-Kalengi

37
III. Comparison of our study with other population-based studies in Africa
Dietary intake
Our third specific objective was to compare our participants’ diet with the diets of other free-living
African populations. As shown in table 16, participants in the selected studies belonged to different
age groups, thus to make the comparison convenient, we tabulated the selected studies in three age
groups similar to our study age categories. The E% from macronutrients was used for comparison.
In children included in our study, the E% from protein in both sexes was almost half of the lower
limit of the AMDR, whereas in children of the selected studies this value fell within or slightly
higher than the lower limit of the AMDR. Therefore our finding was not comparable with any of
the selected studies i.e. protein (E%) was more than two folds lower in our study. Not all of the
selected studies reported fat intakes. For those including fat intakes, the E% from fat was below the
AMDRs except for in Seychellois children, whose E% from fat was almost equal to the upper limit
(45). The fat (E%) in children of our study was half of the lower limit of the AMDR, thus the value
reflects the result found in other selected studies but the lowest fat level (E%) was observed solely
in our study. Throughout the review we identified only one additional study conducted on
adolescents which also only reported the protein intake of its participants. The E% from protein (9%
in each sex) was almost within the acceptable contribution range, but in our study the protein (E%)
was much lower than this selected study’s findings; i.e. it was only half in males and only a third
in females. Similarly to other age groups, this study revealed that the protein (E%) of adults was
much lower than the AMDR and none of the selected study’s findings were in agreement with our
findings. The adults’ protein (E%) in our study was only half of the study which reported lowest
protein (E%) (19), and only a third of the study which reported the highest protein (E%) (50). As
with other age groups, fat intakes of adults were not reported by all studies (reported intakes
available in 3 of 5 studies) and the E% of fat in all of the selected studies including our study was
lower than the lower limit of the AMDR except in South-African study (50), but like we observed
in children the lowest fat (E%) intake was from our study. To summarize, the current review
revealed that the E% from protein and fat were within the lower or below the lower ranges. Thus, it
could be concluded that dietary patterns of those African populations were monotonous as E% was
not generated in accordance to the AMDRs i.e. low from protein and fat yielding foods and high
from starchy foods. Therefore similar to our study particpants, the diets of these populations were
also monotonous. However, when the diet of those populations were directly compared with the
diet of our study particpants, it was shown that our study participants had the most monotonous diet

38
of all the free-living African populations. Thus, due to such dietary patterns our particpants’ health
was more in danger than any of the other free-living African populations.
Table 16: Energy and macronutrient intakes and percentage contribution of energy from macronutrients for selected free-living populations in Africa and our participants
Study country (reference)
Sex
Age group (years)
Energy (kcal
Protein (g)
Protein (E %)
Fat (g)
Fat (E %)
CHO (g)
CHO (E %)
Ethiopia(48)a Both 1-2 292 7.3 10
Kenya(16) Both 3-5 1195 35 12 23 17
Seychelles(45) Male 5 1140 39.6 14 42 33 149 53
Seychelles(45) Female 5 1137 39.5 14 42.7 34 147 52
Benin(47) Male 6-8 1242 31 10 24 17 237 72
Benin(47) Female 6-8 1123 27 10 19 15 221 75
Kenya(49) Both 6-8 966 28 11 16 15
Cameroon(46) Male 7-9 892 22.8 10
Cameroon(46) Female 7-9 967 24.4 10
Our study Male 3-9 1295 15 4.7 19 13.4 247 76
Our study Female 3-9 1148 14 5 14 12 192 67
AMDR Both 3-9 10-30 25-35 45-65
Cameroon(46) Male 10-18 1161 27.5 9
Cameroon(46) Female 10-18 1165 29.3 9
Our study Male 10-17 2079 27 5 31 13.8 317 67
Our study Female 10-17 1987 18 3.5 18 7.7 392 78
AMDR Both 10-17 10-30 25-35 45-65
Ethiopia(5) Male 15-49 2031 61 12
South-Africa(50) Both 15-65 2174 77.2 14 73 30 299 55
Kenya(49) Female ≥20 1101 31 11 17 13
Gabon(19) Both All age 1583 31.8 8
Kenya(16) Both ≥50 2198 64 12 44 18
Our study Male 18-61 2757 29 4.1 40 12.2 519 75
Our study female 18-61 2256 25 4.4 31 12 438 78
AMDR Both 18-61 10-35 20-35 45-65 a AMDR for children aged 0-3 is 5-10%.
BMI distribution of our study in comparison to other population-based studies in Africa
As part of our third specific objective, we compared the BMI distribution of our participants with
that of other free-living African adults. The comparison was done separately for each sex as shown
below.
A. For males: As shown in table 17, some of the selected studies did not report the prevalence of
severe, moderate and mild thinness separately; instead they reported only underweight as a whole
prevalence. Overall when all age groups were combined, the prevalence of severe thinness among
our study men was 9 %. This prevalence was much higher than any other prevalence reported in the
selected studies and it was more than three times higher than the Ghanaian study (49) i.e. the study
which reported the highest prevalence of severe thinness from the selected studies. Similar to severe
thinness, the proportion of participants which were moderately thin (11%) was also much greater
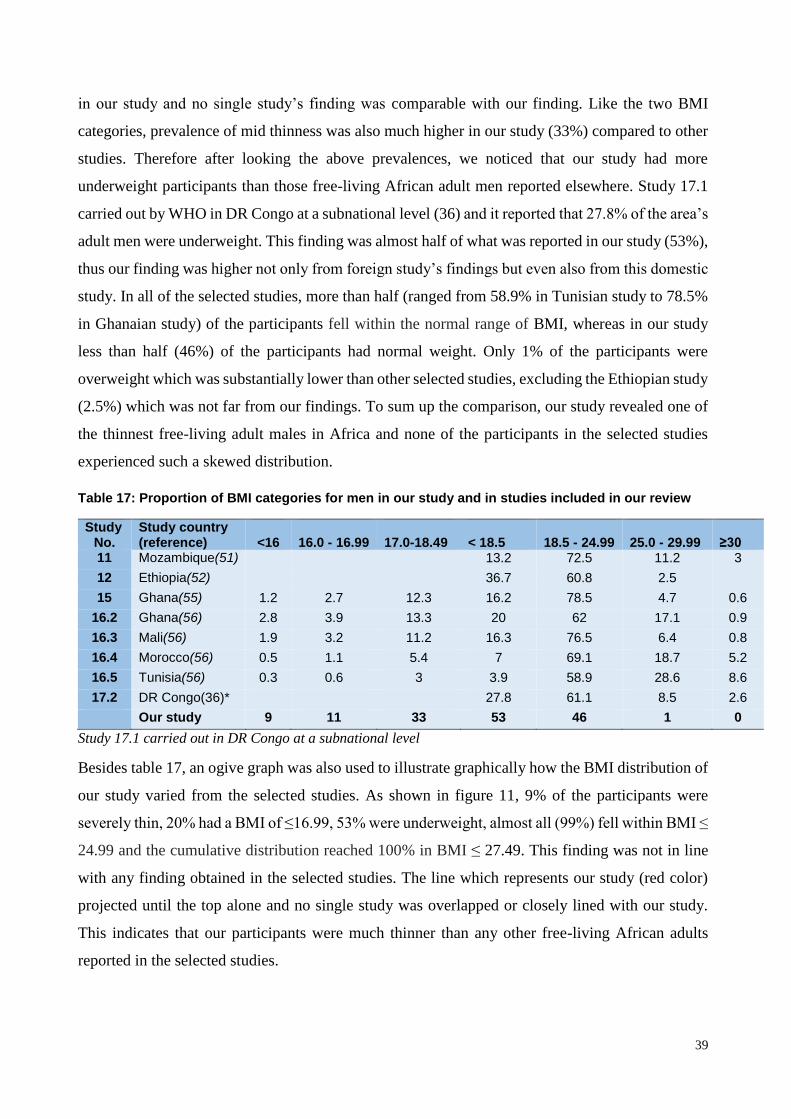
39
in our study and no single study’s finding was comparable with our finding. Like the two BMI
categories, prevalence of mid thinness was also much higher in our study (33%) compared to other
studies. Therefore after looking the above prevalences, we noticed that our study had more
underweight participants than those free-living African adult men reported elsewhere. Study 17.1
carried out by WHO in DR Congo at a subnational level (36) and it reported that 27.8% of the area’s
adult men were underweight. This finding was almost half of what was reported in our study (53%),
thus our finding was higher not only from foreign study’s findings but even also from this domestic
study. In all of the selected studies, more than half (ranged from 58.9% in Tunisian study to 78.5%
in Ghanaian study) of the participants fell within the normal range of BMI, whereas in our study
less than half (46%) of the participants had normal weight. Only 1% of the participants were
overweight which was substantially lower than other selected studies, excluding the Ethiopian study
(2.5%) which was not far from our findings. To sum up the comparison, our study revealed one of
the thinnest free-living adult males in Africa and none of the participants in the selected studies
experienced such a skewed distribution.
Table 17: Proportion of BMI categories for men in our study and in studies included in our review
Study No.
Study country (reference)
<16
16.0 - 16.99
17.0-18.49
< 18.5
18.5 - 24.99
25.0 - 29.99
≥30
11 Mozambique(51) 13.2 72.5 11.2 3
12 Ethiopia(52) 36.7 60.8 2.5
15 Ghana(55) 1.2 2.7 12.3 16.2 78.5 4.7 0.6
16.2 Ghana(56) 2.8 3.9 13.3 20 62 17.1 0.9
16.3 Mali(56) 1.9 3.2 11.2 16.3 76.5 6.4 0.8
16.4 Morocco(56) 0.5 1.1 5.4 7 69.1 18.7 5.2
16.5 Tunisia(56) 0.3 0.6 3 3.9 58.9 28.6 8.6
17.2 DR Congo(36)* 27.8 61.1 8.5 2.6
Our study 9 11 33 53 46 1 0
Study 17.1 carried out in DR Congo at a subnational level
Besides table 17, an ogive graph was also used to illustrate graphically how the BMI distribution of
our study varied from the selected studies. As shown in figure 11, 9% of the participants were
severely thin, 20% had a BMI of ≤16.99, 53% were underweight, almost all (99%) fell within BMI ≤
24.99 and the cumulative distribution reached 100% in BMI ≤ 27.49. This finding was not in line
with any finding obtained in the selected studies. The line which represents our study (red color)
projected until the top alone and no single study was overlapped or closely lined with our study.
This indicates that our participants were much thinner than any other free-living African adults
reported in the selected studies.

40
Figure 10: Cumulative distribution of BMI for our study in comparison to the selected studies for men
B. For females: As with men, the proportions of severe, moderate and mild thinness were also
remained unreported by some of the selected studies (table 18). The overall proportion of severe
thinness in our study women was 9%. Comparing this proportion with those reported in the selected
studies, it was much higher than all of the other studies, and three times higher than the Ethiopian
study (45) which had the highest percentage of severely thin participants. 20 % of our participants
were moderately thin or below a BMI of 16.99, and this figure was higher than all findings reported
in the selected studies. The percentage of our study women who were underweight was 43% and
this finding was in line with the finding of the Ethiopian study (52) which was 42.7%. Following
the Ethiopian study, the next highest underweight proportion of participants was reported in a study
carried out in our Province Bandundu (42). This provincial proportion of underweight individuals
was 12.3% lower than our finding. Thus, it could be estimated that our particpants were among the
thinnest residences of the Bandundu Province. Besides this, study 17.1 was also obtained from the
DR Congo and conducted nationwide, and data was retrived from the WHO global database on BMI
(42). The resulting proportion of underweight individuals (18.5%) was lower than both our own
and provincial findings. This supporting information shows that the province itself had a higher
proportion of underweight individuals compared with that of the nationalwide finding.
0
10
20
30
40
50
60
70
80
90
100
< 1 6 1 6 . 0 - 1 6 . 9 9 1 7 . 0 - 1 8 . 4 9 < 1 8 . 5 1 8 . 5 - 2 4 . 9 9 2 5 . 0 - 2 9 . 9 9 ≥ 3 0
Cu
mu
lati
ve %
BMI categories
Study 11
Study 12
study 15
Study 16.2
Study 16.3
Study 16.4
Study 16.5
Study 17.2
Our study

41
Table 18: Proportion of BMI categories for women in our study and in the studies included in our review
Study No.
Study country (reference)
<16
16.0 - 16.99
17.0-18.49
< 18.5
18.5 - 24.99
25.0 - 29.99
≥30
11 Mozambique(51) 11 64.7 14.9 9.4 12 Ethiopia(52) 42.7 55.1 2.2 13 South-Africa(46 7.2 81.9 10 0.8
14.1 Ethiopia(45) 3 5 20 28 71 1 14.2 Zimbabwe(45) 1 2 9 12 70 18 15 Ghana(55) 1.6 3.2 11.8 16.6 65.3 12 6.1
16.1 Congo(49) 0.6 1.8 8.7 11.1 73.7 11.8 3.4 16.2 Ghana(49) 2.8 3.9 13.3 20 62 17.1 0.9 16.3 Mali(49) 1.9 3.2 11.2 16.3 76.5 6.4 0.8 16.4 Morocco(49) 0.5 1.1 5.4 7 69.1 18.7 5.2 16.5 Tunisia(49) 0.3 0.6 3 3.9 58.9 28.6 8.6 17.1 DR Congo(42) 18.5 70.3 8.9 2.4 17.3 DR Congo(42) 30.7 67 1.2 1.2
Our Study 9 11 23 43 56 1 0
Study 17.1 was carried out in nationwide in DR Congo and study 17.3 was from our province Bandundu.
Figure 11: Cumulative distribution of BMI for our study in relation to the selected studies for women
In relation to our study high degree of underweight individuals was almost absent in Tunisia (49)
and Morocco (49), with respective proportions of 3.9% and 7%. The possible reason for such huge
variation could be due to the better standard of living present in that region compared to the SSA
region. As displayed in figure 12, almost all (99%) of our study participants fell within or below the
normal BMI range (BMI ≤ 24.99). This finding overlapped with the result of the two Ethiopian
studies as well as with the study from Bandundu, whereas the finding from the Tunisian study was
0
10
20
30
40
50
60
70
80
90
100
< 1 6 1 6 . 0 - 1 6 . 9 9 1 7 . 0 - 1 8 . 4 9 < 1 8 . 5 1 8 . 5 - 2 4 . 9 9 2 5 . 0 - 2 9 . 9 9 ≥ 3 0
Cu
mu
lati
ve %
BMI Categories
Study 11Study 12study 13Study 14.1Study 14.2Study 15Study 16.1Study 16.2Study 16.3study 16.4Study 16.5Study 17.1Study 17.3Our study

42
far from our study (62.8% of Tunsian women had BMI ≤ 24.99). The cumulative distribution of our
study reached 100% within the range of BMI ≤ 27.49. Similar to our study, many other studies
showed a cumulative distribution of close to or precisely 100% within the range of BMI ≤ 29.99
(ranged from 90.6 to 100%). To summarize the comparison, as seen in men our study also found
one of the thinnest free-living adult women in Africa and none of the selected studies (excluding
the Ethiopian study) have been documented such low BMI.

43
7. Discussion
7.1 Methodological discussion
Dietary intake:
This part of the study assessed the nutritional adequacy of the diet of selected households in the
remote rural village of Nkay-Kalengi. During the period of data collection, a number of efforts were
undertaken to ensure the data was of good quality. First, since the majority of participants were
semi-literate and underage, retrospective methods of dietary assessment were unsuitable due to the
potential for recall bias. Thus, in order to obtain reliable dietary data of the household a data
collector taking direct measurements of food preparation and consumption during the time of the
study. Therefore the WFR method, which is currently considered the most accurate method in
dietary assessment (imperfect golden standard), was used to collect good quality data. Secondly,
prior to study commencement, a census was made in the study area and the resulting information
was used to prepare a sample frame which contained a list of all eligible households. In order to
minimize selection bias, systematic sampling was subsequently used to select the study households.
Thirdly, it is known that people from rural areas are more likely to be affected in their eating patterns
if a foreign person stays in their home continuously recording their dietary consumption (49). This
may reduce accuracy of usual intake estimates. Thus, to minimize such a bias in our study, data
were collected by two trained nutritionists who had adequate knowledge about the study area’s
language, rules of food service, local courtesies and taboos, as well as local eating mannerisms and
patterns. In addition, before data collection the purpose and methods of the study were clearly
explained to all participants and they were also well informed not to alter their usual dietary patterns
over the recording period of three days. Data collection time included any day of the week, with the
exception of Sunday. This day was excluded because Sundays stands out as a particular day in terms
of activities and food. Finally, traditionally in this area all family members eat from a common pot,
with the exception of the household’s father who eats alone as shown in figure 10 (57). This culture
made it relatively difficult for the nutritionists to measure an individual’s portion intake. Therefore,
the nutritionist asked the family to separate individual’s portion from the common pot. Such
individual portions of each constituent of the meal were weighed using calibrated scales before
consumption. Thereafter family members were served from the common pot but each individual
was informed to eat only from his or her own portion i.e. from the separated portion. During the
time of consumption, each individual (particularly children) was under continuous supervision not
to eat from others portion. At last any leftovers from individual portion was also weighed and
recorded and it value was reduced from the weight of the original individual portion to get the
amount of consumed. Thus, after looking at all of the aforementioned efforts, it is more likely that

44
the obtained data more accurately reflected that of participant consumption. Though WFR is the
most accurate method and efforts were done to increase the accuracy of usual intake estimates, there
are also drawbacks to the method. For example, the presence of the data collector in the participants’
households during the time of food consumption might alter the feeding habit of the participants. In
addition to this, the uncommon eating habit introduced (on common pot while also separating
individual portions) could also affect the amount of food consumed by the children.
Figure 12: Traditional eating habit in the study area
BMI assessment
For BMI assessment part, neither sampling nor sample size calculations were conducted. All adult
residents of Nkay-Kalengi and Indaba were included, excluding those not present on the day of data
collection (n=121), hence minimizing the selection bias. Weight and height were measured using
calibrated instruments and following standard anthropometric techniques to minimize measurement
bias. Both weight and height data were collected consecutively and every measurement was taken
by the researchers in order to minimize variability among data collectors. In short, the researchers
did all their measures in accordance to internationally acceptable and standardized procedures to
obtain reliable anthropometric data. Thus, we viewed this data as it documented the real height and
weight of the study population. But, due to the missed data of those 121 adults (most of them males),

45
results obtained from this data might not be directly representative of the whole adult population
and therefore cannot be generalized as such.
7.2 Discussion of the main findings
I. Dietary intake
The dietary assessment from three days WFR of this study showed that protein and fat intakes were
below the recommended intakes in all age groups, whereas energy (excluding EI in children which
was slightly below the EER) intake was adequate in relation to the recommended intake (table 11).
Similarly, the E% from protein and fat were both far below the lower limits of AMDRs (table 9).
The study also assesed the E% derived specifically from cassava and its contribution was 77% of
the EI in children and the contribution was equal in adolescences and adults i.e. was 81% of the EI
(table 8). Thus, dietary patterns of those participants were extremely monotonous as cassava (E%)
dominated the TEI of the individuals. One possible reason for this extremely monotonous diet could
be due to the quality of soils present in this area. As noted before agriculture provides the main
source of food in this area, however vast parts of the area are occupied by sandy soils called Ferralic
Arenosols (58). These are poor soils characterized by a low clay content (<10%), a very small
content of organic matter and a low PH value (acidic). Therefore the soil is deemed unsuitable for
modern agriculture (56). Due to its resistance to adverse environments, cassava is the most highly
harvested crop from such types of soil. Therefore it is likely that the diet of these participants was
highly restricted to cassava. Ferralic Arenosols are suitable for extensive livestock farming (farming
in area with low agriculture productivity), but the feeding value of savannas and steppes on these
soils have mineral deficiencies or imbalances, therefore this type of farming requires feed
supplements. But, residents of this area are very poor, deeming extensive livestock farming
unaffordable. So, poverty could also be another reason that hampered those participants from
consuming animal products. Besides the poor quality of soils and poverty, accessing to this area is
also difficult especially during the rainy season due to poor transportation possibilities. As a result,
this area has limited communication with the capital Kinshasa, where foods and other products can
be purchased. So the poor transportation system may have also played a role in participant dietary
restriction. Consequently, cassava consumption provided the principal source of macronutrients. As
mentioned before, the two parts of cassava (i.e. the leaves and roots) varied in nutritional
composition and constitution. The roots, which constitute 50% of mature cassava crop are rich in
CHO but poor in protein, while the leaves which constitute 6% of the mature cassava crop are rich
sources of protein and fat. Thus, in areas where dietary patterns are monopolized by cassava, roots
are more likely to be consumed in larger amounts than the leaves due to their larger constitution of

46
the crop. Hence, this could be the reason why intakes of protein and fat were far lower than the
recommended intakes. Besides this, the cassava crops grown in this area have very tiny leaves,
which might reduce the availability of the leaves in the diet. This is also another possible reason
that could be related with the low protein and fat intakes.
In this study it has been reported that intakes of energy and macronutrient in all age groups were
higher in males than in females, except CHO intake in adolescents was higher in females than
observed in males. The probable reason for the higher intakes in adult males could be linked to the
tradition of eating habits in this area i.e. where adult males (particularly fathers) eat alone, whereas
other family members share food from a common pot (57). Thus, intakes could have been higher
in adult men than women. On the other hand the higher CHO intake in female adolescents might
be explained by the fact that household food preparation in this area was dominated by females
(57). Therefore, due to this closer accessiblity to food and the ability to eat while cooking, female
adolescents might have had better dietary intakes than in males.
Using the BMR factor (EI/BMR) our study also assessed whether the reported EIs were plausible
in terms of individuals’ energy requirements. From the individually calculated values (table 19 and
20), 19% of the participants had less than the lower limit of BMR factors i.e. < 1.35, and most of
them were children. On the other side, EI of the 14% of the participants were also reported above
the maximum energy required i.e. BMR factors ≥ 2.4, and majority of them were adults. The high
rate of underreporting in children might be due to missing food intake data due to child feeding in
neighboring houses; potentially contributing to a low BMR factor. Additionally, those children
might have also been sick during the data collection time, which could have adversely affected their
usual intakes, contributing to a lower BMR factor. On the other hand, the high BMR factor seen
in adults might be due to the fact that majority of the adults in this area engaged in high energy
demanding agricultural work. Thus, such reported energies may have been really consumed as high
physical activity required high EI. So such high physical activities resulted in high EI, subsequently
leading to high BMR factors (as high EI was divided by BMR). Therefore we assumed the reported
EIs were less likely to be overestimated.
II. BMI assessment
In this part of the study, we assessed the BMI distribution of adults in the two remote rural villages.
The study revealed that 9% of the overall adults were severely thin, 11% were moderately thin, 27%
were mildly thin, 52% were in the normal weight range, 1% were overweight and no participants
were obese (table 14). The probable reasons for this high prevalence of underweight individuals

47
(nearly half) could be due to monotonous dietary patterns in the area (as seen in the 12 households).
As noted before the residents of this area partake in high energy demanding work as their daily
income largely banks on the subsistence agriculture. However as the area is occupied by Ferralic
Arenosols soils, the subsistence agricultural are likely restricted to only a few crops such as cassava,
consequently leading to monotonous dietary patterns. In such cases energy imbalances could
happen (where energy expenditure exceeds energy consumed), resulting in low body weight
corresponding with low BMI. Additionally, low economic development and poor access to health
services are highly prevalent in this area. These problems have been exist in this area for a long
period of time and are commonly experienced by the residents of this area throughout their entire
lifespan (including childhood, adolescence and adulthood). Therefore, cumulative exposure to the
outcomes of problems such as: poverty, infectious diseases, nutritional deprivation, and unsafe
drinking water might also contribute to such low adult BMIs.
This study also investigated the socio-demographic characteristics associated with underweight
status. We found a significant association with underweight status and participant age, but not in
sex or residence village (table 15). Compared with age group 18-24 years, the age group ≥ 65 years
was tenfold more likely to be underweight. The strong association between age and being
underweight might be explained by the fact that older people are more likely to have a numbers of
chronic conditions and functional impairments that could adversely affect their nutritional status. In
the other age groups, although the BMI distribution varied for the younger adults, the associations
with underweight status were not statistically significant. In this investigation, sex was not
significantly associated with underweight status. But it was determined that women were 24% less
likely to be underweight than men. The probable reason for this finding could be due to the higher
absence of men during the data collection time (the majority of the 121 absentees were men).
Considering the highly active lifestyle in this area, we predicted that those absent during data
collection were more likely those engaging most of their time in field work. This assumption
suggests their health status and corresponding body weight might be heavier compared with those
who spent most of their time at home. At the end, this study revealed that underweight status was
not significantly associated with residence village, which indicates that the magnitude of
underweight individuals was distributed almost similarly in both villages.

48
8. Conclusion Nutritional inadequacy was found a serious public health concern in this study area. Based on the
dietary assessment, cassava was the main staple food constituting almost the entire diet of the
population (ranged 70-95%). Consequently, nearly 80% of the particpants’ energy was derived
single-handedly from cassava, this implies the diet was extremely monotonous. This study revealed
that the protein and fat intakes were short of the international recommended intakes in all age
groups. As a result the E% generated from those macronutrients were also far lower than the lower
limit of the AMDRs. However, the energy (excluding EI in children) intake was above the
recommended intake. When the diet of our particpants was compared with the diet of other free-
living African populations, it was shown that our study participants had the most monotonous diet.
In the anthropometric assesment, the BMI distribution was extremely skewed towards thinness
(nearly half of the adult population was underweight). Compared this figure with other studies, our
study reported one of the slimmest free-living populations in Africa under non-war and non-famine
conditions.
9. Recommendations Operational
The low dietary diversity and high prevalence of underweight reported in the study area
indicates that immediate nutritional interventions are warranted. The government and other
agencies like UN and non-governmental organization (NGO) should consider actions to
alleviate the current nutritional problems. Which action that is most suitable is outside the scope
of this study.
In long term perspective, efforts to enhance agriculture diversity should be considered.
Empowering the economic development of the population should be motivated (example by
creating opportunities that could reduce poverty and improve transport).
Efforts to use the Wamba river that flows through this area (40), for nutritional improvements
should be considered.
Efforts to enrich the diet with animal products should be considered.
For policy
It is important that the country’s line ministries (Health, Agriculture, Education and Water and
Sanitation) to work hand in hand to improve the nutritional situation.
49
For research
Though the living standards in the study area remain unchanged, there is need for further
research to update the information on the nutritional status of the study population, because
the current data was collected many years ago. The research should look into whether the
nutritional situation has remained unchanged, improved or deteriorated.
Further research should also investigate local coping strategies by the community for
improving their own nutritional status.

50
References 1. Heaney RP. Dairy intake, dietary adequacy, and lactose intolerance. Advances in nutrition.
2013;4(2):151-6.
2. Castro-Quezada I, Roman-Vinas B, Serra-Majem L. The Mediterranean diet and nutritional
adequacy: a review. Nutrients. 2014;6(1):231-48.
3. FAO, IFAD, WFP. The State of Food Insecurity in the World 2014. Strengthening the enabling
environment for food security and nutrition. Rome: FAO; 2014 [12.02.2015].
Available from: http://www.fao.org/3/a-i4030e.pdf.
4. Martins VJ, Toledo Florencio TM, Grillo LP, do Carmo PFM, Martins PA, Clemente AP, et
al. Long-lasting effects of undernutrition. International journal of environmental research and
public health. 2011;8(6):1817-46.
5. Haileslassie K, Mulugeta A, Girma M. Feeding practices, nutritional status and associated
factors of lactating women in Samre Woreda, South Eastern Zone of Tigray, Ethiopia. Nutrition
journal. 2013;12:28.
6. Forrester TE, Badaloo AV, Boyne MS, Osmond C, Thompson D, Green C, et al. Prenatal
factors contribute to the emergence of kwashiorkor or marasmus in severe undernutrition:
evidence for the predictive adaptation model. PloS one. 2012;7(4):e35907.
7. World Health Organization. Children: reducing mortality 2013 [20.05.2014].
Available from: http://www.who.int/mediacentre/factsheets/fs178/en/.
8. Van Royen K, Lachat C, Holdsworth M, Smit K, Kinabo J, Roberfroid D, et al. How can the
operating environment for nutrition research be improved in sub-Saharan Africa? The views of
African researchers. PloS one. 2013;8(6):e66355.
9. Kandala NB, Madungu TP, Emina JB, Nzita KP, Cappuccio FP. Malnutrition among children
under the age of five in the Democratic Republic of Congo (DRC): does geographic location
matter? BMC public health. 2011;11:261.
10. FAO, IFAD, WFP. The state of Food Insecurity in the World 2010. Addressing food insecurity
in protected crises. Rome: FAO; 2010 [12.02.2015].
Available from: http://www.fao.org/docrep/013/i1683e/i1683e.pdf.
11. International Food Policy Research Institute. Global Hunger Index 2011 [02.02.2015].
Available from: http://www.ifpri.org/sites/default/files/publications/ghi11.pdf.
12. Nzwalo H, Cliff J. Konzo: from poverty, cassava, and cyanogen intake to toxico-nutritional
neurological disease. PLoS neglected tropical diseases. 2011;5(6):e1051.
51
13. Montagnac JA, Davis CR, Tanumihardjo SA. Nutritional Value of Cassava for Use as a Staple
Food and Recent Advances for Improvement. Comprehensive Reviews in Food Science and
Food Safety. 2009;8(3):181-94.
14. Antonsson-Ogle B GO, Hambrærus L, Holmgren G, Tylleskär T. Nutrition, Adriculture and
Health: when resources are scarce. second revised ed: Uppsala University, Sweden; 2000.
15. Gibson RS. Principles of nutritional assessment: Oxford university press; 2005.
16. Kigutha HN. Assessment of dietary intake in rural communities in Africa: experiences in
Kenya. The American journal of clinical nutrition. 1997;65(4 Suppl):1168s-72s.
17. Tucker KL. Assessment of usual dietary intake in population studies of gene-diet interaction.
Nutrition, metabolism, and cardiovascular diseases : NMCD. 2007;17(2):74-81.
18. Vucic V, Glibetic M, Novakovic R, Ngo J, Ristic-Medic D, Tepsic J, et al. Dietary assessment
methods used for low-income populations in food consumption surveys: a literature review.
The British journal of nutrition. 2009;101 Suppl 2:S95-101.
19. Blaney S, Beaudry M, Latham M, Thibault M. Nutritional status and dietary adequacy in rural
communities of a protected area in Gabon. Public Health Nutr. 2009;12(10):1946-59.
20. Rebro SM, Patterson RE, Kristal AR, Cheney CL. The effect of keeping food records on eating
patterns. Journal of the American Dietetic Association. 1998;98(10):1163-5.
21. Lennernas M. Dietary assessment and validity: To measure what is meant to measure. Food &
Nutrition Research. 1998;42:63-5.
22. SAY J. Eating and drinking: nutrient and fluid requirements for health. Compendium of
Clinical Skills for Student Nurses. 2006:92. Compendium of Clinical Skills for Student Nurses.
2006:92.
23. Dietary Reference Intakes: The Essential Guide to Nutrient Requirements. Otten JJ, Hellwig
JP, Meyers LD, editors: The National Academies Press; 2006.
24. FAO, WHO, UNU. Human enegry requirements. Report of a joint FAO/WHO/UNU Expert
Consultation Rome2001 [13.02.2015].
Available from: ftp://ftp.fao.org/docrep/fao/007/y5686e/y5686e00.pdf.
25. Schofield WN. Predicting basal metabolic rate, new standards and review of previous work.
Human nutrition Clinical nutrition. 1985;39 Suppl 1:5-41.
26. Johansson L, Solvoll K, Bjorneboe GE, Drevon CA. Under- and overreporting of energy intake
related to weight status and lifestyle in a nationwide sample. The American journal of clinical
nutrition. 1998;68(2):266-74.

52
27. Mendez MA, Wynter S, Wilks R, Forrester T. Under- and overreporting of energy is related to
obesity, lifestyle factors and food group intakes in Jamaican adults. Public Health Nutr.
2004;7(1):9-19.
28. Gerrior S, Juan W, Peter B. An easy approach to calculating estimated energy requirements.
Preventing chronic disease. 2006;3(4).
29. Contributors W. Protein: Wikipedia, The Free Encyclopedia; [13.02.2015]. Available from:
http://en.wikipedia.org/w/index.php?title=Protein_(nutrient)&oldid=646939293.
30. Trumbo P, Schlicker S, Yates AA, Poos M. Dietary reference intakes for energy, carbohydrate,
fiber, fat, fatty acids, cholesterol, protein and amino acids. Journal of the American Dietetic
Association. 2002;102(11):1621-30.
31. Dietary Reference Intakes (DRIs): Estimated Average Requirements [14.02.2015]. Available
from: http://www.nal.usda.gov/fnic/DRI/DRI_Tables/recommended_intakes_individuals.pdf.
32. Contributors W. Fat: Wikipedia, The Free Encyclopedia; [14.02.2015]. Available from:
http://en.wikipedia.org/w/index.php?title=Fat&oldid=646495828.
33. Contributors W. Carbohydrate: Wikipedia, The Free Encyclopedia; [14.02.2015]. Available
from: http://en.wikipedia.org/w/index.php?title=Carbohydrate&oldid=645468610.
34. Lindstrand A, Rosling H. Global Health: An Introductory Textbook: Studentlitteratur; 2006.
35. McDowell MA, Statistics NCfH. Anthropometric reference data for children and adults: US
population, 1999-2002: US Department of Health and Human Services, Centers for Disease
Control and Prevention, National Center for Health Statistics; 2005.
36. WHO. Global Database on Body Mass Index: BMI classification and an interactive
surveillance tool for monitoring nutrition transition [03.03.2015].
Available from: http://apps.who.int/bmi/index.jsp?introPage=intro_3.html.
37. Daniels SR. The use of BMI in the clinical setting. Pediatrics. 2009;124(Supplement 1):S35-
S41.
38. Diasolua Ngudi D, Banea-Mayambu JP, Lambein F, Kolsteren P. Konzo and dietary pattern in
cassava-consuming populations of Popokabaka, Democratic Republic of Congo. Food and
chemical toxicology : an international journal published for the British Industrial Biological
Research Association. 2011;49(3):613-9.
39. Contributors W. Bandundu province: Wikipedia, The Free Encyclopedia; [24.05.2014].
Available from:
http://en.wikipedia.org/w/index.php?title=Bandundu_Province&oldid=609242808.
40. Tshala-Katumbay D, Banea-Mayambu J, Kazadi-Kayembe T, Nunga-Matadi R, Bikangi-
Nkiabungu F, Edebol Eeg-Olofsson K, et al. Neuroepidemiology of konzo – a spastic

53
para/tetraparesis of acute onset in a new area of the Democratic Republic of Congo. African
Journal of Neurological Sciences. 2001;20:pp.8-12.
41. L'Harmattan. Aliments et denrées alimentaires traditionnels du Bandundu en R.D. Congo:
répertoire et composition en nutriments [15.03.2015]. Available from: http://www.editions-
harmattan.fr/index.asp?navig=catalogue&obj=livre&no=41210.
42. FAO. Food composition table for use in Africa. Rome: FOA; 1968 [03.05.2015]. Available
from: http://www.fao.org/docrep/003/x6877e/x6877e00.htm.
43. Black AE. Critical evaluation of energy intake using the Goldberg cut-off for energy intake:
basal metabolic rate. A practical guide to its calculation, use and limitations. International
journal of obesity and related metabolic disorders: journal of the International Association for
the Study of Obesity. 2000;24(9):1119-30.
44. Aveyard H. Doing a literature review in health: McGraw-Hill Education; 2007.
45. McAfee AJ, Mulhern MS, McSorley EM, Wallace JM, Bonham MP, Faure J, et al. Intakes and
adequacy of potentially important nutrients for cognitive development among 5-year-old
children in the Seychelles Child Development and Nutrition Study. Public health nutrition.
2012;15(9):1670-7.
46. Ponka R, Fokou E. Dietary intake, zincemia and cupremia of Cameroonian schoolchildren of
Ngali II. International journal of food sciences and nutrition. 2011;62(4):377-84.
47. Mitchikpe CE, Dossa RA, Ategbo EA, Van Raaij JM, Kok FJ. Seasonal variation in food
pattern but not in energy and nutrient intakes of rural Beninese school-aged children. Public
health nutrition. 2009;12(3):414-22.
48. Gibson RS, Abebe Y, Hambidge KM, Arbide I, Teshome A, Stoecker BJ. Inadequate feeding
practices and impaired growth among children from subsistence farming households in
Sidama, Southern Ethiopia. Maternal & child nutrition. 2009;5(3):260-75.
49. Gewa CA, Murphy SP, Neumann CG. A comparison of weighed and recalled intakes for
schoolchildren and mothers in rural Kenya. Public health nutrition. 2009;12(8):1197-204.
50. MacIntyre UE, Venter CS, Vorster HH. A culture-sensitive quantiative food frequency
questionnaire used in an African population: 2. Relative validation by 7-day weighed records
and biomarkers. Public health nutrition. 2001;4(1):63-71.
51. Gomes A, Damasceno A, Azevedo A, Prista A, Silva-Matos C, Saranga S, et al. Body mass
index and waist circumference in Mozambique: urban/rural gap during epidemiological
transition. Obesity reviews : an official journal of the International Association for the Study
of Obesity. 2010;11(9):627-34.

54
52. Tesfaye F, Nawi NG, Van Minh H, Byass P, Berhane Y, Bonita R, et al. Association between
body mass index and blood pressure across three populations in Africa and Asia. Journal of
human hypertension. 2007;21(1):28-37.
53. Cilliers J, Senekal M, Kunneke E. The association between the body mass index of first-year
female university students and their weight-related perceptions and practices, psychological
health, physical activity and other physical health indicators. Public Health Nutr.
2006;9(2):234-43.
54. James WPT, Ferro-Luzzi A, Sette S, Mascie-Taylor CGN. The potential use of maternal size
in priority setting when combating childhood malnutrition. European Journal of Clinical
Nutrition. 1999;53(2):112-9.
55. Nube M, Asenso-Okyere WK, Van Den Boom GJM. Body mass index as indicator of standard
of living in developing countries. European Journal of Clinical Nutrition. 1998;52(2):136-44.
56. Bailey KV, Ferro-Luzzi A. Use of body mass index of adults in assessing individual and
community nutritional status. Bulletin of the World Health Organization. 1995;73(5):673-80.
57. Bentley GR, Aunger R, Harrigan AM, Jenike M, Bailey RC, Ellison PT. Women's strategies
to alleviate nutritional stress in a rural African society. Social Science & Medicine.
1999;48(2):149-62.
58. FAO U. Soil map of the world 1997 [9.04.2015].
Available from: http://www.fao.org/docrep/019/as357e/as357e.pdf.

55
Appendixes
Table 19: Different aspects of energy consumed in relation to age and weight for child and adolescent study participants in Nkay-Kalengi (n=33).
Age (years)
Weight (kg)
BMRa (Kcal)
Average daily energy consumed (Kcal)
BMR-factor
PALb
EERc
Proportion of EER consumed (%)
Male 3-9 years
4 13.8 808 1070 1.32 1216 88
4 15.5 833 1766 2.12 1757 101
5 994
6 15.0 840 1012 1.20 1031 98
7 19.3 933 1455 1.56 1400 104
7 16.9 879 1409 1.60 1491 95
7 16.2 865 1369 1.58 1472 93
8 17.6 895 1312 1.47 1277 103
8 13.3 798 1272 1.59 1244 102
Female 3-9 years
4 13.5 802 866 1.08
4 11.3 753 870 1.16 960 91
4 12.1 771 932 1.21 995 94
5 13.4 801 1536 1.92
5 13.5 803 819 1.02 977 84
6 13.8 810 1599 1.98 1498 107
7 11.2 747 821 1.10 892 92
7 1498
8 16.8 876 1393 1.59
Male 10-17 years
10 22.0 1045 1642 1.57 1589 103
10 20.8 967 2302 2.38 1886 122
11 13.5 886 1196 1.35
11 19.8 1106 2569 2.32 1695 152
11 21.8 990 2282 2.31
13 23.6 1064 3435 3.23 2488 138
15 24.5 1080 1394 1.29 1220 114
16 21.3 1024 1502 1.47 1087 138
16 31.6 1246 2391 1.92 2136 112
Female 10-17 years
10 19.3 929 2153 2.32 1927 112
11 24.8 1049 1288 1.23
13 29.3 1105 1576 1.43 1627 97
15 35.8 1257 2677 2.13 2386 112
15 36.5 1134 1468 1.29 1639 90
16 29.6 1107 2765 2.50 a Basic metabolic rate, b Physical activity level, c Estimated Energy Requirement,

56
Table 20: Different aspects of energy consumed in relation to age and weight for adult study participants in Nkay-Kalengi (n=37).
Age (years)
Weight (kg)
BMRa (Kcal)
Average daily
energy consumed
(Kcal)
BMR factor
PALb
EERc
Proportion of EER
consumed (%)
Male
18-61 years
22 49.1 1430 2284 1.6 2506 91
27 46.9 1472 3683 2.5
27 48.4 1420 2308 1.63
28 54.6 1514 2954 1.95 3063 96
28 53.2 1493 2348 1.57
34 54.8 1517 4285 2.82
35 44.8 1399 2082 1.49
37 59.9 1574 2135 1.36 2364 90
39 47.6 1431 3098 2.16 2672 116
39 45.2 1403 2277 1.62 2315 98
39 54.7 1514 2646 1.75
42 51.9 1481 3443 2.32
51 45.7 1409 1936 1.37 1750 111
54 47.0 1424 2089 1.47
56 49.5 1453 4060 2.79 2613 155
61 34.7 956 2479 2.60 2056 121
Female
18-61 years
19 35.9 1024 1592 1.55 1.96 2006 79
19 41.6 1108 2576 2.33 2440 106
21 34.0 996 1751 1.76 1893 92
21 46.5 1234 3598 2.92 2392 150
22 59.9 1377 2353 1.71 1.73 2405 98
23 45.6 1166 2982 2.56
24 39.8 1081 2483 2.30 2.05 2216 112
26 35.2 1013 1466 1.45 1.95 1975 74
28 38.9 1068 1802 1.69 1.68 1962 92
29 42.6 1122 3588 3.20
29 41.7 1042 1747 1.68 1.98 2052 85
31 51.6 1278 1524 1.19 1.68 2147 71
34 47.3 1240 1983 1.60 1.41 2148 92
37 40.5 1181 2665 2.26 2210 121
38 53.8 1297 2337 1.80 1.96 2542 92
39 45.9 1228 1639 1.33 1910 86
45 40.0 1177 1885 1.60 2.08 2448 77
50 45.7 1227 1600 1.30
53 53.3 1293 2803 2.17 1.88 2393 117
58 43.9 1211 2023 1.67
60 44.9 1068 2971 2.78 2090 142 a Basic metabolic rate, b Physical activity level, c Estimated Energy Requirement,

57
Table 21: Dietary content in relation to age and weight for child and adolescent study participants in Nkay-Kalengi (n=33).
Age (years)
Weight (kg)
Average protein
consumed (g)
Average protein
consumed (E %)
RDAa
protein (g)
Average fat
consumed (g)
Average fat
consumed (E %)
Average CHOb
consumed (g)
Average CHO
consumed (E %)
Male 3-9 years
4 13.8 14.9 6 19 15.1 13 210 78
4 15.5 16.3 4 19 21.2 11 371 84
5 13.6 5 19 21.4 19 142 57
6 15.0 15.7 6 19 23 20 165 65
7 19.3 15.5 4 19 15.9 10 242 66
7 16.9 11.8 3 19 15.2 10 291 83
7 16.2 9.1 3 19 4.3 3 244 71
8 17.6 20.8 6 19 42.4 29 274 83
8 13.3 15.1 5 19 8.1 6 279 88
Female 3-9 years
4 13.5 13.8 6 19 20.6 21 160 74
4 11.3 5.6 3 19 1.6 2 88 40
4 12.1 13.8 6 19 10.8 10 193 83
5 13.4 8.5 2 19 7.6 4 352 92
5 13.5 8.5 4 19 7.9 9 78 38
6 13.8 24.7 6 19 15.7 9 336 84
7 11.2 20.0 10 19 27.1 30 126 61
7 22.1 6 19 34 20 207 55
8 16.8 9.0 3 19 3.2 2 192 55
Male 10-17 years
10 22 14.8 3.6 34 7.7 4 245 60
10 20.8 21.1 3.7 34 35.6 14 467 81
11 13.5 25.4 8.5 34 37.2 28 192 64
11 19.8 42.0 6.5 34 33 12 295 46
11 21.8 34.8 6.1 34 44 17 428 75
13 23.6 45.9 5.3 34 37.4 10 165 38
15 24.5 13.6 3.9 52 19.9 13 278 80
16 21.3 15.8 4.2 52 21.4 13 301 80
16 31.6 26.3 4.4 52 38.5 14 477 80
Female 10-17 years
10 19.3 17.5 3.3 34 18.6 8 422 78
11 24.8 7.7 2.4 34 4.4 3 195 61
13 29.3 14.6 3.7 34 20.7 12 309 78
15 35.8 28.5 4.3 46 34.8 12 553 83
15 36.5 14.8 4.0 46 9.8 6 325 89
16 29.6 23.2 3.4 46 18.2 6 550 80 a Recommended Dietary Allowance,. bCarbohydrates
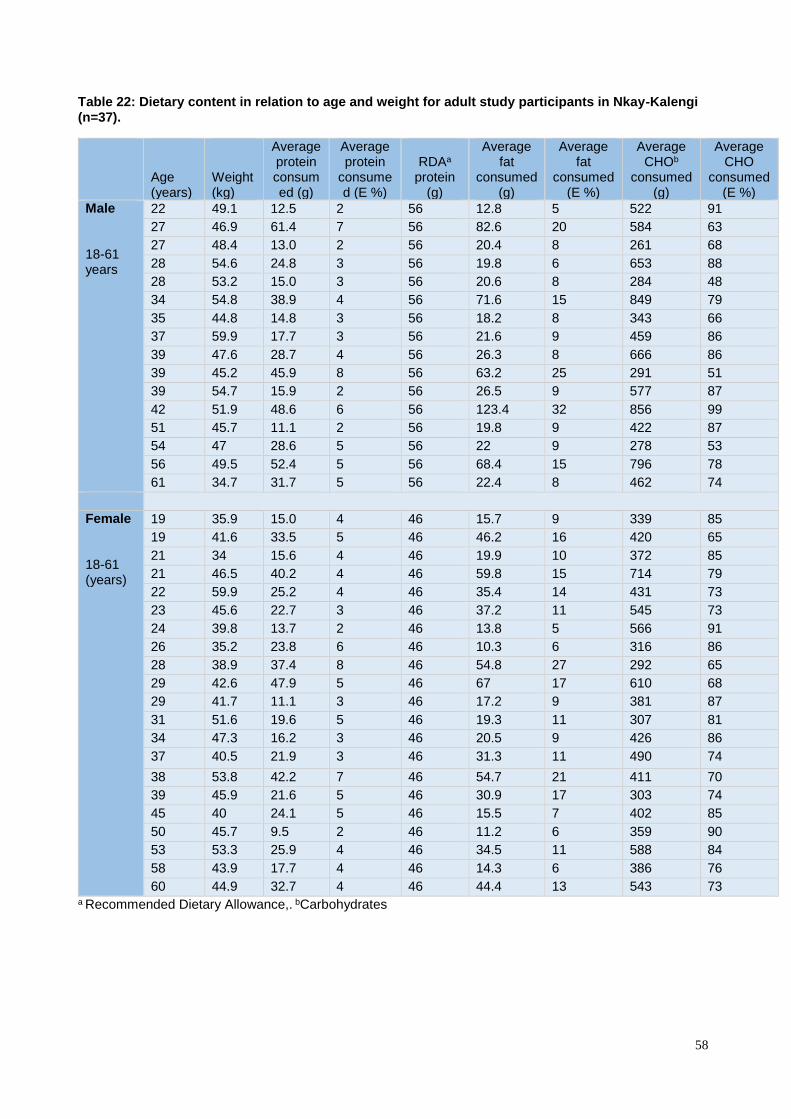
58
Table 22: Dietary content in relation to age and weight for adult study participants in Nkay-Kalengi (n=37).
Age (years)
Weight (kg)
Average protein consumed (g)
Average protein
consumed (E %)
RDAa
protein (g)
Average fat
consumed (g)
Average fat
consumed (E %)
Average CHOb
consumed (g)
Average CHO
consumed (E %)
Male 18-61 years
22 49.1 12.5 2 56 12.8 5 522 91
27 46.9 61.4 7 56 82.6 20 584 63
27 48.4 13.0 2 56 20.4 8 261 68
28 54.6 24.8 3 56 19.8 6 653 88
28 53.2 15.0 3 56 20.6 8 284 48
34 54.8 38.9 4 56 71.6 15 849 79
35 44.8 14.8 3 56 18.2 8 343 66
37 59.9 17.7 3 56 21.6 9 459 86
39 47.6 28.7 4 56 26.3 8 666 86
39 45.2 45.9 8 56 63.2 25 291 51
39 54.7 15.9 2 56 26.5 9 577 87
42 51.9 48.6 6 56 123.4 32 856 99
51 45.7 11.1 2 56 19.8 9 422 87
54 47 28.6 5 56 22 9 278 53
56 49.5 52.4 5 56 68.4 15 796 78
61 34.7 31.7 5 56 22.4 8 462 74
Female 18-61 (years)
19 35.9 15.0 4 46 15.7 9 339 85
19 41.6 33.5 5 46 46.2 16 420 65
21 34 15.6 4 46 19.9 10 372 85
21 46.5 40.2 4 46 59.8 15 714 79
22 59.9 25.2 4 46 35.4 14 431 73
23 45.6 22.7 3 46 37.2 11 545 73
24 39.8 13.7 2 46 13.8 5 566 91
26 35.2 23.8 6 46 10.3 6 316 86
28 38.9 37.4 8 46 54.8 27 292 65
29 42.6 47.9 5 46 67 17 610 68
29 41.7 11.1 3 46 17.2 9 381 87
31 51.6 19.6 5 46 19.3 11 307 81
34 47.3 16.2 3 46 20.5 9 426 86
37 40.5 21.9 3 46 31.3 11 490 74
38 53.8 42.2 7 46 54.7 21 411 70
39 45.9 21.6 5 46 30.9 17 303 74
45 40 24.1 5 46 15.5 7 402 85
50 45.7 9.5 2 46 11.2 6 359 90
53 53.3 25.9 4 46 34.5 11 588 84
58 43.9 17.7 4 46 14.3 6 386 76
60 44.9 32.7 4 46 44.4 13 543 73 a Recommended Dietary Allowance,. bCarbohydrates

59
I. Critically appraisal using STROBE checklist for articles selected in the review regarding
assessment of dietary intake
Study 1: Feeding practices, nutritional status and associated factors of lactating women in Samre
Woreda, South Eastern Zone of Tigray, Ethiopia
1. Tittle and abstract:
Abstract gives clear description of the study’s design i.e. community based cross-sectional
survey.
Structured abstract: Background, Objectives, design, setting, methods, results and
conclusion. It provided detailed and thorough information on study focus and findings.
2. Background/Rationale:
Gives good, general scientific background of the topic.
Cites and references previous studies in the text.
Rationale of the study was stated, although could be more clearly defined (e.g. why the
study conducted in this area?)
3. Objectives: Both general and specific objectives were stated.
4. Main elements of the study were presented early in the paper and design was appropriate for
aim of the study.
5. Setting, location and dates of the study were clearly described.
6. Eligibility criteria, sources and methods of selection were given.
7. Study clearly defined outcomes (intakes below recommended were considered as inadequate),
potential confounder (land size, family size, length of marriage, education, age of the breastfeed
child, growing maize, number of gravity, own farm animals and number of meals) were
clarified.
8. Data sources and methods of assessment (1-day WFR and anthropometric measurements) were
adequately explained.
9. Effort to address bias: study was community based approach, households and subjects were
selected randomly, and thus sample was more likely to be representative of the entire population.
Mothers were also well convinced not to change their normal feeding patterns and to eat
separately. Besides these, calibrating of utensils and standardizing of anthropometric techniques
were also performed. However data were collected for only one day that might affect the
accuracy of the data (intakes patterns might change in that day, thus it lead to either
underestimation or overestimation).
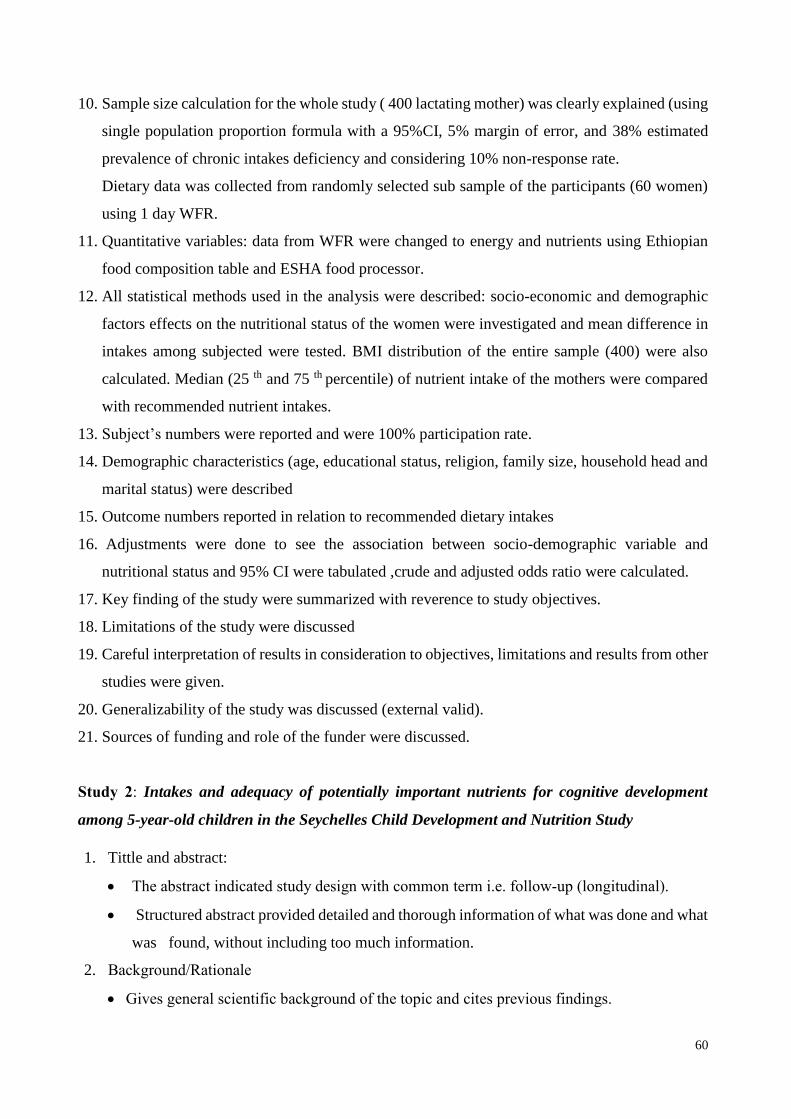
60
10. Sample size calculation for the whole study ( 400 lactating mother) was clearly explained (using
single population proportion formula with a 95%CI, 5% margin of error, and 38% estimated
prevalence of chronic intakes deficiency and considering 10% non-response rate.
Dietary data was collected from randomly selected sub sample of the participants (60 women)
using 1 day WFR.
11. Quantitative variables: data from WFR were changed to energy and nutrients using Ethiopian
food composition table and ESHA food processor.
12. All statistical methods used in the analysis were described: socio-economic and demographic
factors effects on the nutritional status of the women were investigated and mean difference in
intakes among subjected were tested. BMI distribution of the entire sample (400) were also
calculated. Median (25 th and 75 th percentile) of nutrient intake of the mothers were compared
with recommended nutrient intakes.
13. Subject’s numbers were reported and were 100% participation rate.
14. Demographic characteristics (age, educational status, religion, family size, household head and
marital status) were described
15. Outcome numbers reported in relation to recommended dietary intakes
16. Adjustments were done to see the association between socio-demographic variable and
nutritional status and 95% CI were tabulated ,crude and adjusted odds ratio were calculated.
17. Key finding of the study were summarized with reverence to study objectives.
18. Limitations of the study were discussed
19. Careful interpretation of results in consideration to objectives, limitations and results from other
studies were given.
20. Generalizability of the study was discussed (external valid).
21. Sources of funding and role of the funder were discussed.
Study 2: Intakes and adequacy of potentially important nutrients for cognitive development
among 5-year-old children in the Seychelles Child Development and Nutrition Study
1. Tittle and abstract:
The abstract indicated study design with common term i.e. follow-up (longitudinal).
Structured abstract provided detailed and thorough information of what was done and what
was found, without including too much information.
2. Background/Rationale
Gives general scientific background of the topic and cites previous findings.

61
Rationale was stated clearly.
3. Objectives: Only the general objective is stated not the specific objectives.
4. Study design was appropriate for the aim of the study.
5. Setting, location and dates of the study were clearly described.
6. Eligibility criteria, sources and methods of selection were explained in other previous study
and reference was provided for that study.
7. Source of data and method of assessment (4 days WF diaries) described clearly and UK EAR
(Estimated Average Requirement) for children in aged 4-6 was used as standard.
8. No effort to address potential sources of bias: dietary intakes were assessed using two different
weighed food diaries, one recorded by child’s parent or caregiver and other by child’s teacher,
thus social desirability bias, measuring variation and miss to weigh could happen, which all
could be sources of potential bias.
9. No information on how the sample size was calculated.
10. The way quantitative variables handled in the analysis were explained (data collected by WF
diaries were converted to energy and nutrient using food composition table and then energy
intake and energy expenditure were calculated using age -and -sex specific equation).
11. Statistical methods were described clearly, in order to correct intra- and inter-individual intake
variability, adjustment was carried out and then adjusted nutrient intake were compared with
EAR according to UK DRV (Dietary Reverence Value), which could help to control for
confounding. There were subjects with underreporting food diaries, so assessment of the cohort
was performed two times for both sex, first including under-reporter (270 subject) and second
excluding them (180 subjects). After that comparison were done between the two assessments
and underreporting did not show any effect in dietary intake.
12. Subjects’ number reported for both sex. Reasons for underreporting were not mentioned and
no flow diagram.
13. Demographic characteristics were given (age, sex, height and weight).
14. Summary of the findings were presented
15. Both unadjusted and adjusted dietary intake compared with the UK EAR as a cut-off point
were presented.
16. Key results were summarized adequately with reference to study objective.
17. Limitations of the study were discussed, i.e. Weighing of all food was not possible and the
absence of DRV for the Seychelles.
18. No discussion about external validity (generalizability).
19. Sources of funding and collaborators were acknowledged.
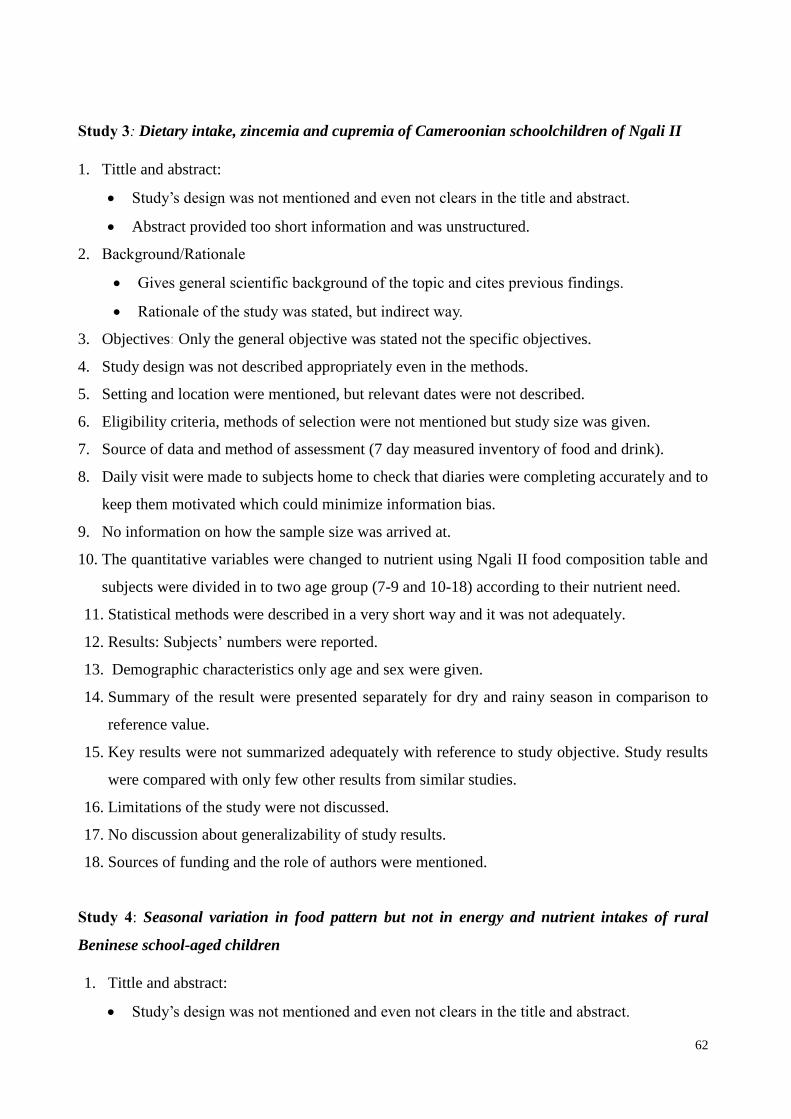
62
Study 3: Dietary intake, zincemia and cupremia of Cameroonian schoolchildren of Ngali II
1. Tittle and abstract:
Study’s design was not mentioned and even not clears in the title and abstract.
Abstract provided too short information and was unstructured.
2. Background/Rationale
Gives general scientific background of the topic and cites previous findings.
Rationale of the study was stated, but indirect way.
3. Objectives: Only the general objective was stated not the specific objectives.
4. Study design was not described appropriately even in the methods.
5. Setting and location were mentioned, but relevant dates were not described.
6. Eligibility criteria, methods of selection were not mentioned but study size was given.
7. Source of data and method of assessment (7 day measured inventory of food and drink).
8. Daily visit were made to subjects home to check that diaries were completing accurately and to
keep them motivated which could minimize information bias.
9. No information on how the sample size was arrived at.
10. The quantitative variables were changed to nutrient using Ngali II food composition table and
subjects were divided in to two age group (7-9 and 10-18) according to their nutrient need.
11. Statistical methods were described in a very short way and it was not adequately.
12. Results: Subjects’ numbers were reported.
13. Demographic characteristics only age and sex were given.
14. Summary of the result were presented separately for dry and rainy season in comparison to
reference value.
15. Key results were not summarized adequately with reference to study objective. Study results
were compared with only few other results from similar studies.
16. Limitations of the study were not discussed.
17. No discussion about generalizability of study results.
18. Sources of funding and the role of authors were mentioned.
Study 4: Seasonal variation in food pattern but not in energy and nutrient intakes of rural
Beninese school-aged children
1. Tittle and abstract:
Study’s design was not mentioned and even not clears in the title and abstract.

63
Abstract was informative and balanced about what was done and what was found without
too much information and was structured.
2. Background/Rationale
General scientific background of the topic was described well.
Rationale was stated clearly.
3. Objectives: General and specific objectives stated.
4. Study design was described in the early of the methods, i.e. longitudinal study.
5. Setting, location, dates (including time of follow-up) were described.
6. Participants eligibility criteria were not mentioned, but methods of selection and the source
were mentioned (from the local birth registry randomly selected).
7. Source of data and method of assessment (3 day weighed records) were given.
8. Effort to address potential biases: participants were selected randomly from local birth registry,
measurements were performed by well-trained local assistants every day from 07:00 to 21:00,
and food consumed between 21:00-07:00 was also assessed by recall using local household
measures. Mothers were also convinced to serve their children on a separate plate. Thus, all
these efforts could help in accuracy of weighing the food intake.
9. No information on how the sample size was arrived at.
10. The way quantitative variables handled were explained .Energy and nutrient intake were
calculated using Benin food composition table and mean intake values were obtained by
averaging intake over three consecutive days.
11. Statistical methods were described well, energy and nutrient intake were presented for both sex
in both post-and pre- harvest seasons. No information on how missed data handled.
12. Results: Subjects’ numbers were reported. No information for those non-participants (5
subjects).
13. Demographic characteristics (age, sex and school attendance) were given.
14. Summary of the result were presented for both pre and post-harvest. And comparison of
nutrient intake was done in relation to seasons and school attendance.
15. Key results were summarized in discussion adequately with the help of figures.
16. Limitations of the study were not mentioned.
17. Cautious interpretations of the overall findings were done and study findings were compared
with other similar studies findings.
18. Generalizability of study results was not mentioned.
19. Sources of funding and the role of authors were mentioned.

64
Study 5: Inadequate feeding practices and impaired growth among children from subsistence
farming households in Sidama, Southern Ethiopia.
1. Tittle and abstract:
Study design was not described in the tittle or in the abstract.
Unstructured abstract summarized what was done and what was found in the study.
2. Background/Rationale: good scientific background information were given. Rationale of the
study was stated clearly.
3. Both general and specific objectives of the study were mentioned.
4. Main elements of study design were presented. Study design was cross-sectional.
5. Setting, locations and dates of the study were mentioned
6. Eligibility criteria (children from mother with multiple pregnancies and children with
evidence of chronic illness were excluded). Subjects aged 6-23 months were selected by
convenience sampling.
7. Source of data and method of assessment were mentioned (for three communities’ socio-
demographic status, anthropometry, and breastfeeding, complimentary feeding practice
using one-day WFR and motor development milestones.
8. To minimize potential bias:Training of data collectors prior the study started, continuous
supervision during data collection and calibrating of equipment’s and standardizing of
techniques were done. But, convenience sampling was used to select participants, in which
the method is criticized by sampling bias and sample might not represent for the entire
population. Thus, external validity of the study become too low.
9. No information on sample size arrival.
10. The quantities of the WFR were changed in to nutrients. Samples of the complimentary food
were collected and analyzed in New Zealand using flame atomic absorption spectrometry
for calcium, zinc and iron contents. Analysis of data for energy, protein, vitamin B and C
were compiled from Ethiopian food composition tables. Breast milk were assumed an
average intakes and composition, except for vitamin A was assumed.
11. Statistical methods used were described, children were classified in to two according Z-
scores for length-for-age (LAZ) and differences in energy intake and millstone were
assessed Mann-Whitney U test.
12. Individuals numbers were reported (97, (52 males and 45 females)), there were 100%
response rate. However three children were excluded from the final sample and reasons were
mentioned.

65
13. Anthropometrical measurement and Z-score, adequacy of energy and nutrient intakes and
micronutrients densities for three age groups were calculated. The energy and nutrient
intakes were compared with FAO\WHO \UNU recommended need.
14. Demographic characteristics of the children were mentioned.
15. Children were classified in two groups (stunted and non-stunted) based on LAZ, then 95%
CI or P value were tabulated to see if there were differences in anthropometric indices,
energy intakes and milestones of these groups, together with maternal anthropometric and
socio-economic status variables.
16. Key finding of the study were summarized well according to study objectives and findings
were compared with other similar studies.
17. Limitations of the study were discussed (sample was not representative).
18. Results were carefully interpreted, by considering objectives, limitations and findings from
other study.
19. Generalizability of the study was discussed (study has no external validity).
20. Sources of funding and role of the funder were mentioned.
Study 6: A comparison of weighed and recalled intakes for schoolchildren and mothers in rural
Kenya. Public health nutrition
1. Tittle and abstract:
The abstract indicate study’s design and was structured.
Abstract provided adequate information of what was done and what was found.
2. Background/Rationale: Too short and less informative background. Rational of the study
stated fairly good.
3. Objectives of the study were stated (both general and specific).
4. Study design is appropriate for the aim of the study
5. Setting, location and dates of data collection were described
6. Source and methods of selection were mentioned but not eligibility criteria.
7. Source of data and method of assessment (24 h recall and 1 day WFR) described clearly.
Validity comparison between two assessment methods were done
8. Some efforts to address potential biases were done like training of enumerator and
calibrating of scales and using validated protocol of WFR (proved by other studies). But
there were also problems which causes bias like the sampling method used i.e. convenient
sampling which is less likely to get representative population and hard to generalize) and

66
during schooling time food consumed by the children during were estimated by recall
methods not by WFR.
9. All grade one students were used as a sample size, no calculation was done.
10. The way quantitative variables handled were explained. Amount from WFR and 24 were
changed to energy and nutrients using food composition table for use in Kenya.
11. Statistical analysis used were described clearly, difference between two methods and the
presence of any systematic bias were examined using statistical methods.
12. Numbers of subjects were reported separately for children and mothers.
13. Demographic characteristics were not reported all (only age of the children). There were no
missing data.
14. All the results regarding the validity comparisons of the two methods were presented in the
form of tables and figures.
15. Key results were summarized with reference to aims of the study.
16. Limitations of the two methods were discussed by putting in consideration for potential bias.
17. Good interpretations of the study findings were presented and comparison was made with
other studies findings.
18. No discussion about generalizability of the study.
19. Sources of funding and collaborators were acknowledged.
Study 7: Nutritional status and dietary adequacy in rural communities of a protected area in
Gabon
1. Tittle and abstract:
Pointed out study’s design i.e. community based survey.
Structured abstract presented summary information of the study.
2. Background/Rationale: Explained general background information of the topic and cites
previous studies findings. Rationale of the study was stated.
3. Specific objective including pre-specified hypothesizes were stated.
4. Study design was presented and was appropriate for the aim of the study.
5. Setting, location and relevant dates (data collection) were described adequately.
6. Eligibility criteria: villages were selected using non-randomly sampling and selected villages
were assigned to four strata, within each stratum, most populated were selected.
7. Source of data and method of assessment (7 days WFR) were given.

67
8. A numbers of efforts were done to avoid potential bias: Like, the principal investigator had
spent some time prior the study in order to inform (not to change their way eating in the study)
the population and to invite the households to participate. Training of surveyors and
standardization of data collection instruments were done. The survey was carried out for 7
days in two major seasons (14 days in total). But, villages were selected using non-randomly
sampling methods which could be sources for biases and made the study not to have external
validity.
9. No sample size calculation was done; all residents of the villages were included.
10. The way quantitative variables handled in the analysis were explained (anthropometric
measurements were taken, and prevalence of inadequacy intake, satisfaction of nutrient
requirement were and nutrient adequacy were estimated from the WFR data.
11. Statistical methods were described clearly, finding in each strata (continental and coastal
villages) were presented separately in both seasons.
12. Subjects number were presented in each of the study and reason for no-participation were
given (those unwilling to weighed their intakes were excluded and left before the survey the
completion of the survey).
13. Demographic characteristics were given (age, sex, village, and schooling).
14. Summary of the findings were presented, prevalence of inadequate intake, nutrient intake
and satisfaction of requirements and nutrient adequacy were estimated by adjusting their age,
sex and location.
15. Analysis was also performed to see the association between nutritional status, nutrient
adequacy and health status.
16. The limitations of the study were discussed in relation to source of bias ( non-random
sampling)
17. Good interpretations of the study results were present by putting a consideration to the
objectives and drawbacks of the study.
18. No discussion about generalizability of the study.
19. Sources of funding and role of funders were presented.
Study 8: A culture-sensitive quantitative food frequency questionnaire used in an African
population: 2. Relative validation by 7-day weighed records and biomarkers
1. Tittle and abstract:
Study design described in the abstract i.e. cross-sectional.

68
Structured abstract described what was done and what was found in the study.
2. Background/Rationale: scientific background information was given. Rationale of the study
was stated in indirect way (lack of stringent procedures for testing validity of dietary
assessment instrument for use in Africa).
3. Objective of the study was mentioned.
4. Key elements of the design were described.
5. Only the location of the study was mentioned, no information on setting and relevant dates.
6. Eligibility criteria and methods of selection were not mentioned, the only information was that
participants were recruited from other study (THUSA).
7. Source of data and method of assessment (quantitative food frequency questionnaire, 7-day
WF diaries and 24-hour urinary nitrogen) were given.
8. Efforts to address potential bias were done: Subjects recorded intakes for 7 consecutive days,
instructions were given on how to complete the diaries and how to use measuring scaled
equipment. But in selecting of participants no efforts were done to make them representative
(volunteers without any sampling method were included). Diaries were completed by
participant themselves, thus more likely to have social desirability bias.
9. No sample size calculation was done, 85 for WR diaries and 104 for 24-hour urinary nitrogen
volunteers were recruited.
10. The way quantitative variables handled were explained (nutrient analyses were done by the
Food Finder program and PABA content of the urine specimens was analyzed by
chromatography).
11. All statistical methods used were described; average energy and nutrient intakes from
quantitative food frequency questionnaire (QFFQ) were compared with WR diaries.
12. Subjects number with complete 7-day weighed food diaries were presented (74 subject). No
information was on those 11 no-participants.
13. Demographic characteristics (sex, income level, place of residence) were mentioned.
14. Summary of the findings were presented.
15. Main results obtained from QFFQ and WR were compared for their difference (95% CI were
tested if the difference is statically significant). Bland-Altman plot was also used to describe
the level of agreement and the presence of proportional bias between the two assessment
methods. None of the plot showed proportion bias.
16. Under reporters were identified by a ratio of EI: BMR of less 1.2 or a UN: NI of greater than
one.

69
17. Key findings of the study were summarized well according to study objectives and findings
were compared with other similar studies.
18. No discussion about limitations of the study.
19. Good interpretation of the study finding was given in relation to other study findings.
20. Generalizability of the study was discussed, but not clears enough.
21. Sources of funding and role of the funder were mentioned.
Study 9 and 10: Assessment of dietary intake in rural communities in Africa: experiences in
Kenya
1. Tittle and abstract: Study design was not mentioned either in tittle or in abstract.
2. Unstructured abstract with inadequate summary of the study.
3. Background/Rationale: scientific background information was given and rationale of the study
stated broadly.
4. Objectives of the study were mentioned (both general and specific objectives).
5. The study design was not mentioned throughout the entire paper.
6. Setting, location and relevant dates (including period and duration) of the study were
described.
7. Sources and methods of selection of subjects (randomly selected) were mentioned, but
eligibility criteria were not described.
8. Source of data and method of assessment (24- h recall and 3 day WFR) were given.
9. Efforts to address potential bias: A pilot study was carried out for three months for identifying,
standardizing and coding of local utensils. Besides this training of data collectors were carried
out. In the main study, data were collected in the some way of the pilot study.
10. No clues on how sample size was arrived at.
11. The weights of foods consumed by subjects were converted to nutrients using food
composition table for use in Africa.
12. Statistical methods were not described adequately (too very short).
13. The study was conducted in three periods (two lean seasons and one harvest seasons) and in
all periods, numbers of subjects were reported. These with incomplete three days food records
were excluded and no information was given for why they didn’t complete the WFR.
14. Energy and nutrient intakes of both preschoolers and elderly were reported in three periods.
15. No demographic characteristics of the subjects were given.
16. Energy and nutrient intakes were adjusted in three periods of seasons.

70
17. Limitations of the study were not discussed.
18. No results interpretation.
19. No discussion on the external validity of the study.
20. No information about funding of the study.
Note: we gave the last study two number (9 and 10) because it presented intakes of the preschool
children and elderly separately.

71
II. Critically appraisal using STROBE checklist for articles selected in the review regarding
BMI assessments
Study 11: Body mass index and waist circumference in Mozambique: urban/rural gap during
epidemiological transition
1. Tittle and abstract:
Study design was not descried either in the tittle or in the abstract.
Unstructured abstract provided a summary of the study without including too much
information.
2. Background/Rationale:
Gives short general scientific background of the topic.
Cites and references previous studies in the text.
General rationale of the study was stated, but not specifically for the study (due to
nutritional transition, obesity and overweight were increased worldwide).
3. Objectives: Both general and specific objectives were stated.
4. Main elements of the study were presented early in the paper and design was appropriate for
aim of the study.
5. Setting, location and dates of the study were clearly described.
6. Eligibility criteria, sources and methods of selection were clearly presented.
7. Outcomes of the study (underweight, overweight, obesity and waist circumference) were
defined using the WHO categories for BMI assessment, potential confounder (age, sex,
residence place, education, family income) were adequately defined.
8. Source of data (WHO STEP wise approach to surveillance) and methods of assessment
(anthropometrical measurements) were clearly explained.
9. Effort to address bias: study was community based approach, subjects were selected randomly
from sampling frame of the 1997 census, which was designed to be representative at a national
level and by place of residence (urban and rural). Anthropometrical measurements were also
measured using calibrated utensils and standardized techniques.
10. Sample size calculation: 95 geographical clusters, among which all the households were listed
and 25 randomly selected and visited, and then all eligible subjects were invited. 55 subjects
refused and 3323 were included in the study.
11. Quantitative variables: BMI was calculated as weight (kg) divided by square height (m2). And
waist circumference was analyzed; subjects were categorized using the WHO standard used

72
for BMI assessment. Waist circumference was evaluated by the cut-off point (women>88 cm
and men>102 were classified as abdominal obesity).
12. All statistical methods used in the analysis were described, including those used to control for
confounding (stratification were done by gender, sex, residence place and education, besides
this age-, family income-and –adjusted prevalence ratios, computed using multiple regression
model). Thus in the analysis both stratification and multiple regression were used to control for
confounding. 397 subjects with incomplete information were excluded from the analysis.
13. Numbers of subjects were reported in the percentage and reasons for those excluded from the
study were given.
14. Demographic characteristics (age, sex, residence place, education and their annual income)
were given. Information regarding potential confounders were presented.
15. Prevalence of BMI categories and abdominal obesity and average waist circumference, among
women and men from rural and urban areas were presented in % (95%CI).
16. The main results give both unadjusted and adjusted estimates. Adjustment were done according
to their age, education, annual income and residence place, 95% CI were calculated to test for
cofounding. Odds ratios and linear regression coefficients were tabulated to check the
association between residences of place and the outcomes among both sexes.
17. Other analysis: BMI vs waist circumference analysis was done to see the magnitude of their
association.
18. Key finding of the study were summarized with reference to study objectives.
19. Limitations of the study were not discussed
20. Careful interpretation of results in consideration to objectives and results from other studies
were given.
21. Generalizability of the study was not discussed.
22. Sources of funding and role of the funder were not discussed.
Study 12: Association between body mass index and blood pressure across three populations in
Africa and Asia
1. Tittle and abstract:
Study design was indicated in the abstract i.e. was cross-sectional descriptive design.
Unstructured abstract was informative about what was done and what was found.
2. Background/Rationale:

73
Background explained general scientific information of the topic. It also explained and
cited the finding of other studies.
Rationale of the study was stated (correlation between BMI and blood pressure in very lean
population was less explored).
3. Objectives: Both general and specific objectives were stated was also mentioned.
4. Key elements were presented early in the paper and design was appropriate for aim of the study.
Data were generated from DSS (demographic surveillances sites) of three country.
5. Setting, location and dates of the study were clearly described.
6. Eligibility criteria (all adults aged 25-64 years in the DSS, excluding pregnant and subject with
gross physical problem, sources and methods of selection were also mentioned.
7. Outcomes of the study (BMI defined according the conventional cutoff recommended by WHO
and WHO cutoff for blood pressure was used for BP), potential confounder (age, education,
occupation, residence place and sex) were mentioned.
8. Source of data (from DSS of Ethiopia, Vietnam and Indonesia) and methods of assessment
(anthropometrical measurements, blood pressure measuring and questionnaires) were clearly
explained.
9. Effort to address bias: Study was conducted in nationwide and anthropometrical measurements
were taken using the WHO STEP instruments (calibrated instruments and standardized
techniques). Blood pressure (BP) was also measured according the WHO guidelines. Training
of the data collectors were carried out in order to make them familiar with survey instruments
(questionnaire and anthropometric measurements) .Subjects were also randomly selected from
the DSS database of each country.
10. Sample size was calculated using the formula for single population proportion.
11. Quantitative variables: BMI was calculated as weight (kg) divided by square height (m2) and
conventional BMI cutoff points were applied to classified subjects in to different nutritional
status. Three BP measurements were taken, average BP were determined from the second and
third measurements.
12. All statistical methods used in the analysis were described. To control for confounding subjects
were stratified by age, sex, residence place, education, BMI categories and occupation and
logistic regression analysis were carried out to determine odds ratio of hypertension and BMI
across the two sexes and different age groups.

74
13. Number of subjects were reported (8014 subjects, where 4050 from Ethiopia, 2020 from
Vietnam and 1944 from Indonesia. For BMI 7675 subjects were included, 339 subjects were
excluded either due to pregnancy or subject’s weight or height was not measured.
14. Demographic characteristics (age, sex, residence place, education, BMI categories and
occupation) were given. Information regarding potential confounders was presented.
15. Outcome data: Prevalence of underweight, normal weight, overweight and obesity were
presented for all country and mean value of both diastolic and systolic BP were presented.
16. The main results give both unadjusted and adjusted estimates. Correlation coefficients of age
with BMI, BP for both sexes were calculated. Subjected were adjusted by their age, sex,
education, occupation and BMI category, then adjusted OR (95% CI) were calculated using
logistic regression to test for cofounding.
17. Key finding of the study were summarized with reference to study objectives.
18. Limitations of the study were not discussed.
19. Careful interpretation of the results in consideration study objectives, and results from other
studies were given.
20. Generalizability of the study was not discussed (external valid).
21. Sources of funding and role of the funder were discussed.
Study 13: The association between the body mass index of first-year female university students
and their weight-related perceptions and practices, psychological health, physical activity and
other physical health indicators
1. Tittle and abstract:
Study design was mentioned in the abstract i.e. cross-sectional.
Structured abstract provided adequate summary of the study methodology and findings.
2 Background/Rationale:
Explained adequate scientific background of the topic.
Rationale of the study was stated, (less is known about the association between weight
status, health and lifestyle indicators, weight management practices and psychological
parameters of the target group). But could be clarified more (why only first year student?).
3. Objectives: Both general and specific objectives were stated.
4. Key elements of the study were presented early in the paper and design was appropriate for
aim of the study.

75
5. Setting and location (female residence at a South African university) of the study were clearly
described. No information on relevant dates of the study.
6. Eligibility criteria, sources and methods of selection were presented (volunteers female
university students in South Africa).
7. Outcomes of the study (BMI defined and categorized according the WHO guidelines, triceps
skinfold were classified in to five categories, blood pressure SBP <130 and DBB<85
considered normal, physical activities divided in to three components, body shape, eating
attitudes and self-concept) were defined. Other that could be as potential confounders (year of
birth, weather, medication, accommodation, illness and smoking were also defined.
8. Source of data (baseline data of first year student participating in a weight-management
intervention trial, from this data volunteers were selected for this study) and methods of
assessment (anthropometrical measurements and all other mentioned outcomes) were clearly
explained.
9. Effort to address bias: After an information session, volunteers were selected for participation.
Anthropometric data was measured using calibrated instruments and standardized techniques.
Thus, as only volunteers involved in the study the risk for potential bias was high.
10. Quantitative variables: BMI was calculated as weight (kg) divided by square height (m2).
11. All statistical methods used in the analysis were described, including those used to control
for confounding (stratification in to different categories).
12. Number of subjects (n=360) were reported and there were no no-participants.
13. Demographic characteristics (age, school, language, living with and self-reported prevalence
of chronic diseases and smoking habit were collected
14. Summary reports of the outcome data were given: mean BMI, WC, triceps skinfold thickness,
systolic BP and diastolic BP. In addition to those information regarding smoking habit, weight
related perception and practice, psychological health and physical activity were reported.
15. In the main results, no adjustments were done. The association between BMI and weight
related characteristics; weight related perception and practices were presented in tables. P
value was tabulated to see if it was statistically significance.
16. Key finding of the study were summarized with reverence to study objectives, study was
compared with other studies findings.
17. Limitations of the study were not discussed.
18. Cautious and broad interpretation of results in consideration to objectives and results from
other studies were given.
19. Generalizability of the study was not discussed.

76
20. Source of funding was mentioned.
Study 14.1 and 14.2: The potential use of maternal size in priority setting when combating
childhood malnutrition
1. Tittle and abstract:
Study design was not described either in the tittle or abstract.
Abstract was structured and provided adequate summary of the study.
2. Background/Rationale:
Delivered broad scientific background of the topic.
Mentioned other studies findings in the text.
Rationale of the study was stated.
3. Objectives: Both general and specific objectives were stated.
4. Methods: Key elements of the study were presented early in the paper and design was
appropriate for aim of the study (community-based survey).
5. Setting, location and dates of the study were clearly described.
6. The study used three different data (Ethiopia, India and Zimbabwe), subject’s eligibility criteria
was mentioned only for Ethiopia. Sources of the data were clearly presented for all. But
methods of selection for India were not explained.
7. Outcomes of the study (underweight, normal, overweight and obesity) were defined using the
WHO categories for BMI assessment and Z-score cut-off was used for children. No
information was given on potential confounder, predictor and effect modifiers.
8. Source of data and methods of assessment (anthropometrical measurements) were clearly
explained.
9. Effort to address bias: In both African nations, subjects were selected randomly. In all countries
anthropometrical measurements were done according to internationally acceptable and
standardized procedures.
10. There was no sample size calculation, 3865 adults women from three Ethiopian surveys, 801
adults women from Zimbabwe and 296 adults women from India were included in the study.
11. Quantitative variables: BMI was calculated as weight (kg) divided by square height (m2). And
nutritional status of the children was expressed as the mean of the z-score.
12. All statistical methods used in the analysis were described. The correlation between z-scores
of children and their mother’s BMI were estimated and tested for heterogeneity in relation

77
between the communities. Sensitivity and specificity analysis were also performed for
suggesting children’s appropriate z-score cut-off point.
13. Results: Number of subjects were reported for each country and the proportion of each group
in different BMI categories (BMI<16, BMI<16-16.9, BMI 17-18.4, BMI18.5-24.9 and BMI
25-29.9) were also presented.
14. Descriptive data: Demographic characteristics (age, sex, and family size, country including
residence area or region) for both children and mothers were mentioned. Adolescents were
excluded from the study because of marked discrepancies in the timing of puberty and change
in WFH in these groups compared with the reference population.
15. Outcome data: Prevalence of BMI in each categories and mean and standard deviation of the
z-score for children in relation to the WHO reference pattern were reported. The
concordance(c) between the anthropometry of siblings within a household and correlation(r)
between mean z-score of children and the average BMI of all the adult women within each
household were reported. At last classification of the households based on both adults and
children’s anthropometry were reported.
16. Main results: no adjustments were carried out, there was no statistically significant evidence
of heterogeneity between the different countries in the relationship between maternal BMI and
WFH (weight for height) z-score of the children aged <10 years.
17. Other analysis: Sensitivity and specificity analysis were used for suggesting the appropriate
cut-off point of children’s WFH z-score and -2 z-score cut-off point was suggested to be more
appropriate.
18. Key results: finding of the study were summarized with reference to study objectives.
19. Limitations of the study were not discussed
20. Interpretation of results in consideration to objectives and results from other studies were given.
21. Generalizability of the study was not discussed.
22. Sources of funding and role of the funder were discussed.
Study 15: Body mass index as indicator of standard of living in developing countries
1. Tittle and abstract:
Study design was descried neither in the tittle nor in the abstract.
Structured abstract provided an informative summary of what was done and what was
found without including too much information.
2. Background/Rationale:

78
General scientific background of the topic was given.
Rationale of the study was stated, (less is known about the suitability of BMI as an indicator
of standard of living in developing countries.
3. Objectives: Both general and specific objectives were stated.
4. Key elements of the study were presented early in the paper and design was appropriate for
aim of the study.
5. Setting, location and dates of the study were clearly described (data collected in the first round
of the Ghana Living standard survey, held in 1987\88 (GLSS-I) and 1988\89 (GLSS-II).
6. Eligibility criteria (all adults in the age group 20-65 years, excluding pregnant, lactating
,individuals from households with total expenditures higher than 1 million cedis per year and
individuals with BMI<10 and >40 ), sources (GLSS I and II), and methods of selection
(proportionate sampling) were clearly presented.
7. Variables: Outcomes of the study (underweight, overweight, and obesity) were defined using
the WHO categories for BMI assessment, other variables (potential confounders) such as
income and expenditure, years of schooling of head of households, access to services, quality
of housing, age, and nutritional of status children were also defined.
8. Source of data (GLSS I and II)) and methods of assessment (anthropometrical measurements)
were clearly explained.
9. Effort to address bias: Study was nationwide approach and in both surveys over 3000
households proportionally distributed over Ghana were selected. To make the sample
representative for both sex and households, one male and one female were selected in the
analysis as subsample (4228 adults) from each household. Anthropometrical measurements
were also measured using calibrated utensils and standardized techniques.
10. There was no sample size calculation, 9214 adults were selected in both surveys (male=4961
and female=4253) and BMI were calculated for all. In the analysis to reduce possible bias, only
4228 adults (2114 females and 2114 males) from 2114 households as subsample were used.
11. Quantitative variables: BMI was calculated as weight (kg) divided by square height (m2) and
were categorized using the WHO standard used for BMI assessment.
12. All statistical methods used in the analysis were described, sample was divided in to socio-
economic groups on the basis of four criteria: first geographical location (coastal, forest),
second, place (community <5000 inhabitants was considered as rural and these with over 5000
as urban and finally, rural households were divided on the basis of their economic activity and
urban on the basis of record of training and experience of the head of the household (skilled

79
unskilled). These classification results 12 groups and mean BMI, weight, height and the
various households’ characteristics and correlation coefficient were obtained. Finally multiple
regressions was carried out to see the effect of various socioeconomic characteristics on BMI,
weight and height.
13. Results: Mean and distribution of the subjects were reported, separately for both sex and for
the rural and urban population, and for the whole sample.
14. Demographic characteristics (age, sex, residence place, education and income and expenditure)
were given. Information regarding potential confounders were presented.
15. Proportions of BMI for box sexes in urban and rural were reported. Correlation between adult
BMI and household income expenditure, correlation coefficients between adults BMI and five
household characteristics (electricity, treated water, educational level of the head of the
household, quality dwelling and nutritional status) and mean BMI for the twelve
socioeconomic groups were reported.
16. Main results: To evaluate BMI as an indicator of household wellbeing, multiple regressions
were used. Regression included three variables: individual, household and community levels.
P-value was calculated to check for statistically significance. In this model most selected
households variable appeared to have significant effect on both BMI and weight, but not on
height.
17. Other analysis: no other analysis was reported other than these mentioned.
18. Key finding of the study were summarized with reverence to study objectives.
19. Limitations of the study were not discussed
20. Interpretation of results in consideration to objectives and results from other studies were given.
21. Generalizability of the study was not discussed.
22. Sources of funding and role of the funder were not discussed.
Study 16.1, 16.2,16.3, 16.4 and 16.5: These studies were carried out by FAO. We retrived them
from one article which reported a modified form of those FAO findings without describing
the methods. Thus, we could not critically appraisal for them.
Study 17.1, 17.2 and 17.3: The findings in those studies were obtained from the WHO global
database on BMI, therefore similar to the above studies, we could not do critically appraisal
for those study either.


![o d P r o c e sing l o f F o ec ra Sobowale et al, Food ... · PDF fileand cyanide content, ... cassava starch, roasted/boiled cassava, fufu (akpu) and gari [4,5]. ... The traditional](https://static.fdocuments.in/doc/165x107/5a8f4fda7f8b9adb648dbe1f/o-d-p-r-o-c-e-sing-l-o-f-f-o-ec-ra-sobowale-et-al-food-cyanide-content-.jpg)