CORE CASE STUDY - Katy Independent School...
31
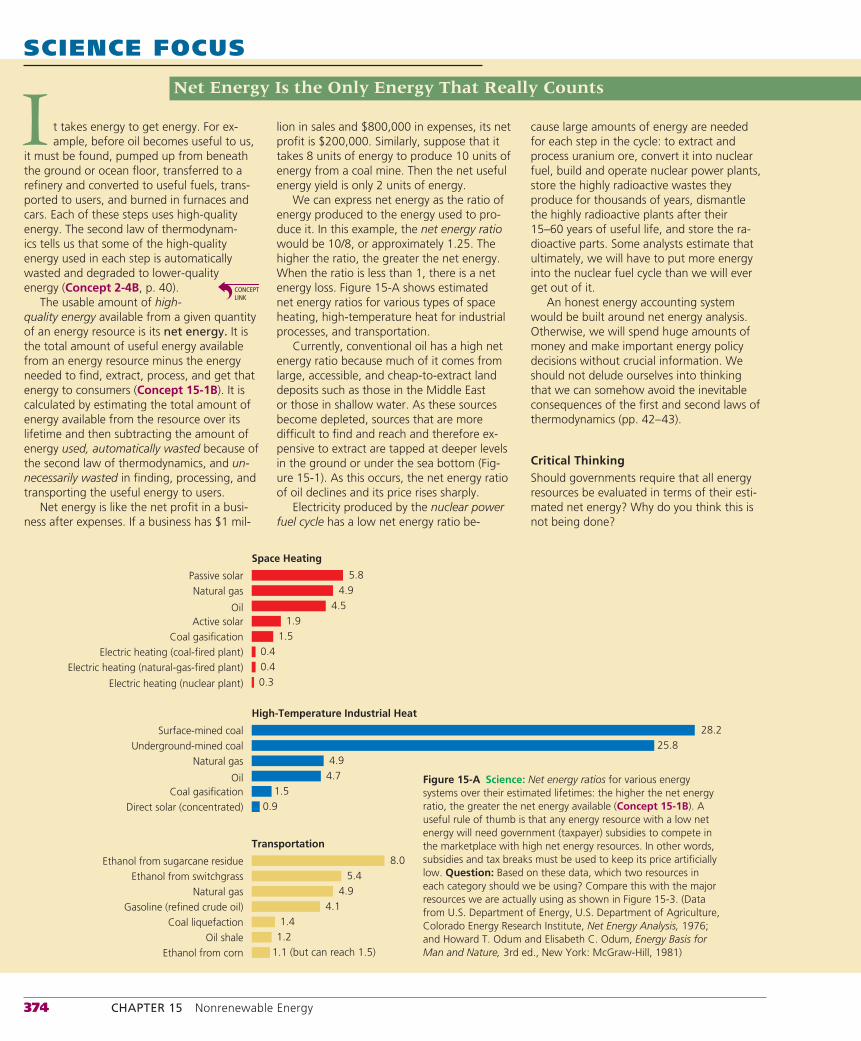
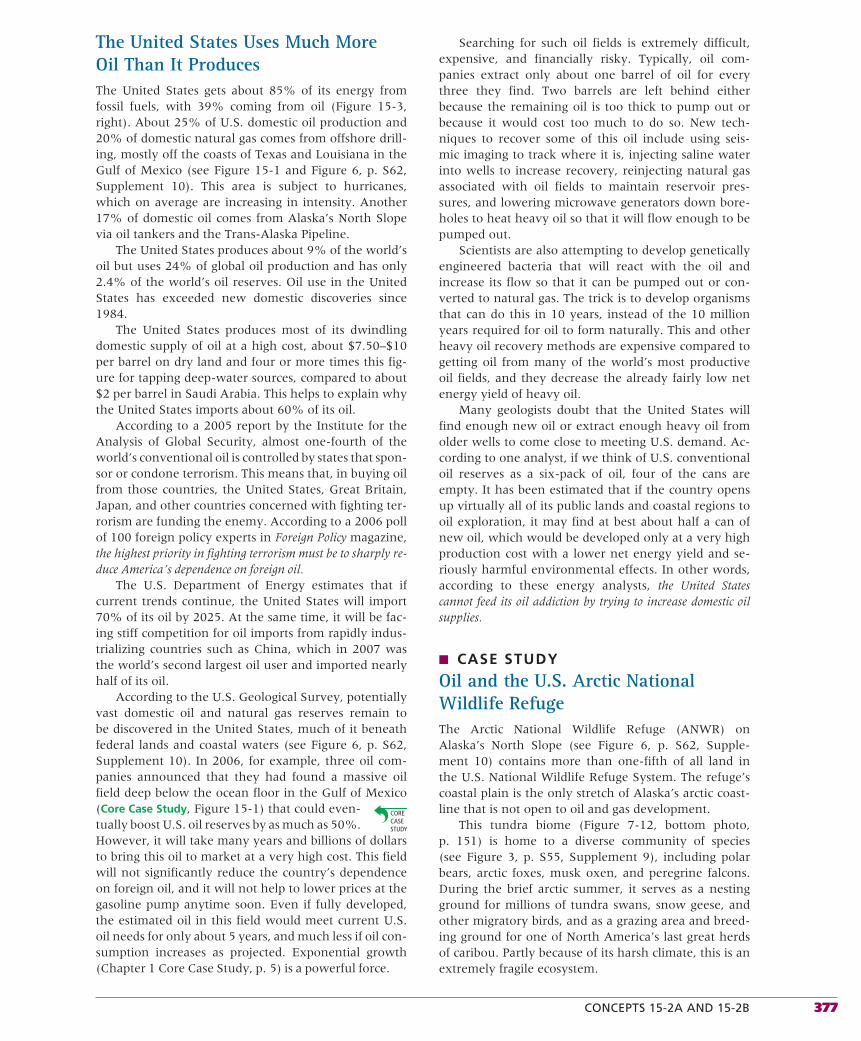
CORE CASE STUDY should vigorously pursue all three options. Some contend that higher prices will stimulate the search for new oil to meet global oil needs. Others doubt that oil reserves can be increased enough to meet the rapidly growing future demand for oil, despite greatly increased oil exploration. Yet, because oil companies and many governments are secretive about oil reserves, no one really knows how much oil might be available. Some geologists fear that Saudi Arabia and other OPEC countries have deliberately overestimated the size of their oil reserves to discourage a switch to other alternatives. Others argue that even if much more conventional oil is somehow found, we are ignoring the consequences of the high exponential growth (Chapter 1 Core Case Study, p. 5) in global oil consumption. If we continue to use oil reserves at the current rate of about 2.8% per year with the unlikely assumption that the rate will not increase, then • Saudi Arabia, with the world’s largest known crude oil re- serves, could supply the world’s entire oil needs for about 10 years. • The estimated reserves under Alaska’s North Slope—the larg- est ever found in North America—would meet current world demand for only 6 months or U.S. demand alone for 3 years. • The estimated reserves in Alaska’s Arctic National Wildlife Refuge (ANWR) would meet current world oil demand for only 1–5 months and U.S. demand for 7–24 months. Contrary to popular belief, the world is not about to run out of oil in the near future. The well-publicized debate over peak oil production is not about the world’s ultimate supply of oil. Instead, it is about flow rate based on the ability of existing oil supplies to meet the annual demands for oil. An adequate an- nual flow of oil cannot be maintained indefinitely unless new and affordable supplies are found to replace the oil being depleted from existing reserves. And between 2000 and 2007, the world consumed nine times more oil than the amount the oil industry discovered according to British Petroleum and the International Energy Agency. To keep using conventional oil at the projected rate of increase, we must discover global oil reserves equivalent to a new Saudi Arabian supply every 5 years. Most oil geologists say this is highly unlikely. The exciting and urgent challenge for this century is to sharply reduce the waste of oil and other energy resources and to find an array of substitutes for oil and other fossil fuels to slow emissions of carbon dioxide, which are warming the atmosphere and triggering global climate change. There are no easy solu- tions, because all energy options have advantages and disadvan- tages. We discuss those of nonrenewable energy sources in this chapter and those of renewable energy sources in Chapter 16. How Long Will Supplies of Conventional Oil Last? Oil, which supplies about one-third of the world’s energy, is the lifeblood of most of the world’s economies and modern life- styles. We use oil to grow most of our food, transport people and goods, and make most of the things we use every day— from plastics to asphalt on roads. Stretched end to end, the number of barrels of oil the world used in 2007 would circle the equator 650 times! And projected oil use in 2020 would raise that number to 870. To meet this rapidly growing demand, oil companies have drilled wells on the land and at sea (Figure 15-1). They extract this oil and refine it to make gasoline, heating oil, asphalt, and other products. Geologists project that known and projected global reserves of conventional oil will be 80% depleted sometime between 2050 and 2100, depending on consumption rates. If this esti- mate is correct, conventional oil should be reaching its sunset years sometime during this century. (See Figure 8, p. S64, Sup- plement 10 for a brief history of the Age of Oil.) We have three options: look for more oil, reduce oil use and waste, or use other energy resources. Many analysts think we Nonrenewable Energy 15 Figure 15-1 Thunder Horse offshore floating oil production platform, located in the Gulf of Mexico. Brad Martin/Stockphoto.com
Transcript of CORE CASE STUDY - Katy Independent School...

C O R E C A S E S T U D Y
should vigorously pursue all three options. Some contend that higher prices will stimulate the search for new oil to meet global oil needs. Others doubt that oil reserves can be increased enough to meet the rapidly growing future demand for oil, despite greatly increased oil exploration. Yet, because oil companies and many governments are secretive about oil reserves, no one really knows how much oil might be available. Some geologists fear that Saudi Arabia and other OPEC countries have deliberately overestimated the size of their oil reserves to discourage a switch to other alternatives.
Others argue that even if much more conventional oil is somehow found, we are ignoring the consequences of the high exponential growth (Chapter 1 Core Case Study, p. 5) in global oil consumption. If we continue to use oil reserves at the current rate of about 2.8% per year with the unlikely assumption that the rate will not increase, then
• Saudi Arabia, with the world’s largest known crude oil re-serves, could supply the world’s entire oil needs for about 10 years.
• The estimated reserves under Alaska’s North Slope—the larg-est ever found in North America—would meet current world demand for only 6 months or U.S. demand alone for 3 years.
• The estimated reserves in Alaska’s Arctic National Wildlife Refuge (ANWR) would meet current world oil demand for only 1–5 months and U.S. demand for 7–24 months.
Contrary to popular belief, the world is not about to run out of oil in the near future. The well-publicized debate over peak oil production is not about the world’s ultimate supply of oil. Instead, it is about flow rate based on the ability of existing oil supplies to meet the annual demands for oil. An adequate an-nual flow of oil cannot be maintained indefinitely unless new and affordable supplies are found to replace the oil being depleted from existing reserves. And between 2000 and 2007, the world consumed nine times more oil than the amount the oil industry discovered according to British Petroleum and the International Energy Agency. To keep using conventional oil at the projected rate of increase, we must discover global oil reserves equivalent to a new Saudi Arabian supply every 5 years. Most oil geologists say this is highly unlikely.
The exciting and urgent challenge for this century is to sharply reduce the waste of oil and other energy resources and to find an array of substitutes for oil and other fossil fuels to slow emissions of carbon dioxide, which are warming the atmosphere and triggering global climate change. There are no easy solu-tions, because all energy options have advantages and disadvan-tages. We discuss those of nonrenewable energy sources in this chapter and those of renewable energy sources in Chapter 16.
How Long Will Supplies of Conventional Oil Last?
Oil, which supplies about one-third of the world’s energy, is the lifeblood of most of the world’s economies and modern life-styles. We use oil to grow most of our food, transport people and goods, and make most of the things we use every day—from plastics to asphalt on roads.
Stretched end to end, the number of barrels of oil the world used in 2007 would circle the equator 650 times! And projected oil use in 2020 would raise that number to 870. To meet this rapidly growing demand, oil companies have drilled wells on the land and at sea (Figure 15-1). They extract this oil and refine it to make gasoline, heating oil, asphalt, and other products.
Geologists project that known and projected global reserves of conventional oil will be 80% depleted sometime between 2050 and 2100, depending on consumption rates. If this esti-mate is correct, conventional oil should be reaching its sunset years sometime during this century. (See Figure 8, p. S64, Sup-plement 10 for a brief history of the Age of Oil.)
We have three options: look for more oil, reduce oil use and waste, or use other energy resources. Many analysts think we
Nonrenewable Energy15
Figure 15-1 Thunder Horse offshore floating oil production platform, located in the Gulf of Mexico.
Brad
Mar
tin/S
tock
phot
o.co
m

Fossil Fuels Supply Most of Our Commercial EnergyAlmost all of the energy that heats the earth and our buildings comes from the sun at no cost to us—one of the four scientific principles of sus-tainability (see back cover). Without this es-sentially inexhaustible solar energy (solar capital, Concept 1-1A, p. 6), the earth’s aver-
age temperature would be �240 °C (�400 °F), and life as we know it would not exist. This direct input of so-lar energy produces several other forms of renewable energy that can be thought of as indirect solar energy: wind (moving air masses heated by the sun), hydropower (flowing water kept fluid by heat from the sun), and biomass (solar energy converted to chemical energy and stored in trees and other plants); we examine these en-ergy sources in Chapter 16.
Key Questions and Concepts
15-1 What major sources of energy do we use?CONCEPT 15 - 1A About three-quarters of the world’s commercial energy comes from nonrenewable fossil fuels and the rest comes from nonrenewable nuclear fuel and renewable sources.
CONCEPT 15 - 1B Net energy is the amount of high-quality usable energy available from a resource after the amount of energy needed to make it available is subtracted.
15-2 What are the advantages and disadvantages of oil?CONCEPT 15 -2A Conventional oil is currently abundant, has a high net energy yield, and is relatively inexpensive, but using it causes air and water pollution and releases greenhouse gases to the atmosphere.
CONCEPT 15 -2B Heavy oils from oil sand and oil shale exist in potentially large supplies but have low net energy yields and higher environmental impacts than conventional oil has.
15-3 What are the advantages and disadvantages of natural gas?CONCEPT 15 -3 Conventional natural gas is more plentiful than oil, has a high net energy yield and a fairly low cost, and has the lowest environmental impact of all fossil fuels.
15-4 What are the advantages and disadvantages of coal?CONCEPT 15 -4A Conventional coal is very plentiful and has a high net energy yield and low cost, but it has a very high environmental impact.
CONCEPT 15 -4B Gaseous and liquid fuels produced from coal could be plentiful, but they have lower net energy yields and higher environmental impacts than conventional coal has.
15-5 What are the advantages and disadvantages of nuclear energy?CONCEPT 15 -5 Nuclear power has a low environmental impact and a very low accident risk, but high costs, a low net energy yield, long-lived radioactive wastes, vulnerability to sabotage, and the potential for spreading nuclear weapons technology have limited its use.
Typical citizens of advanced industrialized nations each consume as much energy in 6 months
as typical citizens in developing countries consume during their entire life.
MAURICE STRONG
15-1 What Major Sources of Energy Do We Use?CONCEPT 15-1A About three-quarters of the world’s commercial energy comes from nonrenewable fossil fuels and the rest comes from nonrenewable nuclear fuel and renewable sources.
CONCEPT 15-1B Net energy is the amount of high-quality usable energy available from a resource after the amount of energy needed to make it available is subtracted.
▲▲
Note: Supplements 2 (p. S4), 9 (p. S53), 10 (p. S59), and 13 (p. S78) can be used with this chapter.
371Links: refers to the Core Case Study. refers to the book’s sustainability theme. indicates links to key concepts in earlier chapters.

372 CHAPTER 15 Nonrenewable Energy
The Case Study at right gives a brief history of hu-man energy use. Currently, most commercial energy—energy sold in the marketplace—comes from extracting and burning nonrenewable energy resources obtained from the earth’s crust, primarily carbon-containing fossil fu-els—oil, natural gas, and coal (Figure 15-2).
About 82% of the commercial energy consumed in the world comes from nonrenewable energy re-sources—76% from fossil fuels (oil, natural gas, and coal) and 6% from nuclear power (Figure 15-3, left). The remaining 18% of the commercial energy we use comes from renewable energy resources—biomass, hydropower, geothermal, wind, and solar energy (Concept 15-1A).
Supplement 10 (pp. S59-S73) has several graphs showing trends in energy consumption in the world and in the United States. These graphs include world oil consumption from 1950 to 2006 (Figure 4, p. S61), global coal and natural gas consumption between 1950 and 2005 (Figure 5, p. S61), total and per capita energy consumption in the United States (Figure 2, p. S60), and energy consumption by fuel in the United States between 1980 and 2006 (Figure 3, p. S60).
In order, the three largest users of fossil fuels are the United States, China, and the European Union, to-gether accounting for more than half of all fossil fuel consumption. Energy use per person varies through-
out the world (see Figure 1, p. S59, Supplement 10). Despite its rapidly growing total energy consumption, China’s per-capita energy consumption is far below that of other industrial countries.
Examine and compare energy sources used in developing and developed countries at CengageNOW™.
■ CASE STUDY
A Brief History of Human Energy UseEarly humans were scavengers and hunter–gatherers whose main source of energy was muscle power. A human living at this basic survival level needed about 2,000 kilocalories of energy per day, most of it in the form of food.
In a modern industrial society such as the United States, the average person uses 2,000 kilocalories of en-ergy per day for basic energy needs, plus about 600,000 kilocalories of energy per day used by machines and systems that maintain an individual’s complex lifestyle. This 300-fold increase over the minimum survival level of energy use gives individuals in the United States and other industrialized countries immense power to alter
Oil drillingplatform
Oil well
Gas well
Natural gas
Undergroundcoal mine
Impervious rock
Water
Water
Water is heatedand brought upas dry steam orwet steam
Hot rock
Magma
Oil
Pump
Pipeline
Pipeline
Geothermalpower plant
Contourstrip mining
Area stripmining
Mined coal
Drillingtower
Water penetratesdown throughthe rock
Coal
Geothermal energy
Oil and natural gas
Coal seam
Oil storage
Hot water storage
Figure 15-2 Natural capital: important nonrenewable energy resources that can be removed from the earth’s crust are coal, oil, natural gas, and some forms of geothermal energy (Concept 15-1A). Nonrenewable uranium ore is also extracted from the earth’s crust and processed to increase its concentration of uranium-235, which serves as a fuel in nuclear reactors that produce electricity. Question: During a typical day, which of these resources do you use directly or indirectly?

CONCEPTS 15-1A AND 15-1B 373
natural systems through their huge total and per capita energy footprints.
Humanity’s first step along this energy path began with the discovery of fire, which hunters–gatherers used to cook food and to light and heat their dwellings. Later they learned to use fire to burn grasslands in or-der to stampede animals they hunted over cliffs.
After humans began settling down as farmers about 12,000 years ago, they learned how to domesticate wild animals, using muscle power to plow fields, carry loads, and transport people from place to place. Later, they learned to tap into energy from the wind in or-der to pump up underground water and to transport people and goods in sailing ships. They also used the power of flowing water to move goods and people on boats, to power mills for grinding grain, and eventually to produce electricity.
About 275 years ago, we began inventing machines such as the steam engine used to power ships, trac-tors, locomotives, and factory machinery. Renewable firewood provided about 91% of the energy used for heating and for running steam engines. But in 1850, this began changing as many forests were depleted. In other words we used a potentially renewable energy resource—wood—unsustainably by harvesting it faster than nature replaced it.
We survived this early energy crisis by learning how to burn coal for heating and for running factories and trains. By 1900, wood provided only about 18% of our energy, and coal provided 73%. In 1859, we learned how to pump oil out of the ground and later invented ways to convert it to fuels such as gasoline and heating oil.
In 1885, Carl Benz invented the internal combus-tion engine to power cars and other vehicles that could
run on gasoline. By 1900, we got 40% of our energy from oil, 38% from coal, and 18% from natural gas—all nonrenewable resources.
In the 1950s, we learned how to get enormous amounts of energy by splitting the nuclei of certain types of uranium atoms (Figure 2-7, top, p. 41) and to use this energy to produce electricity. Today, we con-tinue to live in a fossil fuel era with 82% of our energy coming from nonrenewable oil, natural gas, and coal resources (Figure 15-3).
Now we face a new energy crisis because of the air and water pollution, greenhouse gas emissions, and en-vironmental degradation caused by our excessive use of fossil fuels and our failure to get serious about reducing unnecessary energy waste. An urgent question is, can we greatly improve energy efficiency and shift to a va-riety of renewable energy resources, before we do even more serious harm to our own life-support system and to many of the world’s other species.
THINKING ABOUTThe Future of Energy Use
Do you think the total use of energy by all humans, regardless of where it comes from, must keep growing as it has in the past? Explain.
How Should We Evaluate Energy Resources?According to scientists, all energy resources should be evaluated on the basis of their supplies, the environ-mental impact of our using them, and how much useful energy they actually provide (Science Focus, p. 374).
World
Natural gas21%
Nuclear power6%
Oil33%
Biomass11%
RENEWA
BLE18%
NO
NREN
EWABLE 82%
Coal22%
Hydropower4.5%
Geothermal,solar, wind2.5%
United States
Biomass 3%
Nuclear power8%
Oil39%
Coal23%
Naturalgas23% REN
EWA
BLE7%
NO
NRENEW
ABLE 93%
Hydropower,3%
Geothermal,solar, wind1%
Figure 15-3 Com-mercial energy use by source for the world (left) and the United States (right) Question: Why do you think the world as a whole relies more on renew-able energy than the United States does? (Data from U.S. Department of Energy, British Petroleum, World-watch Institute, and International Energy Agency)
374 CHAPTER 15 Nonrenewable Energy
SCIENCE FOCUS
Net Energy Is the Only Energy That Really Counts
cause large amounts of energy are needed for each step in the cycle: to extract and process uranium ore, convert it into nuclear fuel, build and operate nuclear power plants, store the highly radioactive wastes they produce for thousands of years, dismantle the highly radioactive plants after their 15–60 years of useful life, and store the ra-dioactive parts. Some analysts estimate that ultimately, we will have to put more energy into the nuclear fuel cycle than we will ever get out of it.
An honest energy accounting system would be built around net energy analysis. Otherwise, we will spend huge amounts of money and make important energy policy decisions without crucial information. We should not delude ourselves into thinking that we can somehow avoid the inevitable consequences of the first and second laws of thermodynamics (pp. 42– 43).
Critical ThinkingShould governments require that all energy resources be evaluated in terms of their esti-mated net energy? Why do you think this is not being done?
t takes energy to get energy. For ex-ample, before oil becomes useful to us,
it must be found, pumped up from beneath the ground or ocean floor, transferred to a refinery and converted to useful fuels, trans-ported to users, and burned in furnaces and cars. Each of these steps uses high-quality energy. The second law of thermodynam-ics tells us that some of the high-quality energy used in each step is automatically wasted and degraded to lower-quality energy (Concept 2-4B, p. 40).
The usable amount of high-quality energy available from a given quantity of an energy resource is its net energy. It is the total amount of useful energy available from an energy resource minus the energy needed to find, extract, process, and get that energy to consumers (Concept 15-1B). It is calculated by estimating the total amount of energy available from the resource over its lifetime and then subtracting the amount of energy used, automatically wasted because of the second law of thermodynamics, and un-necessarily wasted in finding, processing, and transporting the useful energy to users.
Net energy is like the net profit in a busi-ness after expenses. If a business has $1 mil-
I lion in sales and $800,000 in expenses, its net profit is $200,000. Similarly, suppose that it takes 8 units of energy to produce 10 units of energy from a coal mine. Then the net useful energy yield is only 2 units of energy.
We can express net energy as the ratio of energy produced to the energy used to pro-duce it. In this example, the net energy ratio would be 10/8, or approximately 1.25. The higher the ratio, the greater the net energy. When the ratio is less than 1, there is a net energy loss. Figure 15-A shows estimated net energy ratios for various types of space heating, high-temperature heat for industrial processes, and transportation.
Currently, conventional oil has a high net energy ratio because much of it comes from large, accessible, and cheap-to-extract land deposits such as those in the Middle East or those in shallow water. As these sources become depleted, sources that are more difficult to find and reach and therefore ex-pensive to extract are tapped at deeper levels in the ground or under the sea bottom (Fig-ure 15-1). As this occurs, the net energy ratio of oil declines and its price rises sharply.
Electricity produced by the nuclear power fuel cycle has a low net energy ratio be-
5.8Passive solar4.9
4.5
1.51.9
0.40.40.3
Natural gas
Active solarCoal gasification
Electric heating (coal-fired plant)Electric heating (natural-gas-fired plant)
Electric heating (nuclear plant)
28.2Surface-mined coal25.8
4.94.7
1.50.9
Underground-mined coalNatural gas
OilCoal gasification
Direct solar (concentrated)
Oil
Space Heating
High-Temperature Industrial Heat
4.9
Transportation
Natural gas4.1
1.41.2
Gasoline (refined crude oil)Coal liquefaction
Oil shale1.1 (but can reach 1.5)Ethanol from corn
8.0Ethanol from sugarcane residue5.4Ethanol from switchgrass
Figure 15-A Science: Net energy ratios for various energy systems over their estimated lifetimes: the higher the net energy ratio, the greater the net energy available (Concept 15-1B). A useful rule of thumb is that any energy resource with a low net energy will need government (taxpayer) subsidies to compete in the marketplace with high net energy resources. In other words, subsidies and tax breaks must be used to keep its price artificially low. Question: Based on these data, which two resources in each category should we be using? Compare this with the major resources we are actually using as shown in Figure 15-3. (Data from U.S. Department of Energy, U.S. Department of Agriculture, Colorado Energy Research Institute, Net Energy Analysis, 1976; and Howard T. Odum and Elisabeth C. Odum, Energy Basis for Man and Nature, 3rd ed., New York: McGraw-Hill, 1981)
CONCEPTS 15-2A AND 15-2B 375
We Depend Heavily on OilPetroleum, or crude oil (oil as it comes out of the ground), is a thick and gooey liquid consisting of hun-dreds of different combustible hydrocarbons along with small amounts of sulfur, oxygen, and nitrogen impuri-ties. It is also known as conventional or light oil. Crude oil and natural gas are called fossil fuels because they were formed from the decaying remains (fossils) of or-ganisms that lived 100–500 million years ago.
Deposits of crude oil and natural gas often are trapped together under a dome deep within the earth’s crust on land or under the seafloor (Figure 15-2). The crude oil is dispersed in pores and cracks in under-ground rock formations, somewhat like water saturat-ing a sponge. It is extracted by means of a well drilled
into the deposit. High-tech equipment can drill oil and natural gas wells on land and at sea (Core Case Study, Figure 15-1) to a depth of 11 kilometers (7 miles). Then oil, drawn by gravity out of the rock pores flows into the bottom of the well and is pumped to the surface.
At first oil almost squirts from many wells. But af-ter years of pumping, usually a decade or so, the pres-sure drops and production starts declining at a point referred to the peak production of a well. For global oil production to expand, the oil output from newly found reserves must stay ahead of the declining output from wells that have passed their peak production.
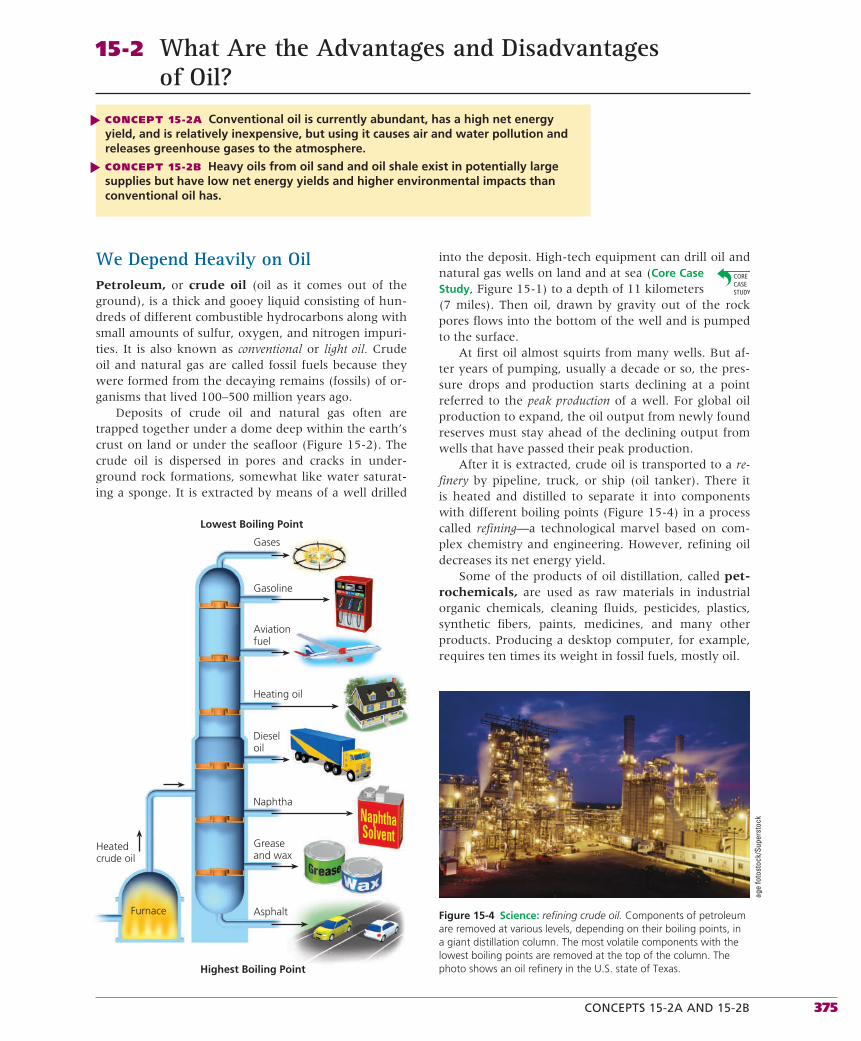
After it is extracted, crude oil is transported to a re-finery by pipeline, truck, or ship (oil tanker). There it is heated and distilled to separate it into components with different boiling points (Figure 15-4) in a process called refining—a technological marvel based on com-plex chemistry and engineering. However, refining oil decreases its net energy yield.
Some of the products of oil distillation, called pet-rochemicals, are used as raw materials in in dustrial organic chemicals, cleaning fluids, pesticides, plastics, synthetic fibers, paints, medicines, and many other products. Producing a desktop computer, for example, requires ten times its weight in fossil fuels, mostly oil.
15-2 What Are the Advantages and Disadvantages of Oil?
CONCEPT 15-2A Conventional oil is currently abundant, has a high net energy yield, and is relatively inexpensive, but using it causes air and water pollution and releases greenhouse gases to the atmosphere.
CONCEPT 15-2B Heavy oils from oil sand and oil shale exist in potentially large supplies but have low net energy yields and higher environmental impacts than conventional oil has.
▲▲
Gases
Lowest Boiling Point
Highest Boiling Point
Gasoline
Aviationfuel
Heating oil
Dieseloil
Heatedcrude oil
Furnace
Naphtha
Greaseand wax
Asphalt Figure 15-4 Science: refining crude oil. Components of petroleum are removed at various levels, depending on their boiling points, in a giant distillation column. The most volatile components with the lowest boiling points are removed at the top of the column. The photo shows an oil refinery in the U.S. state of Texas.
age
foto
stoc
k/Su
pers
tock
376 CHAPTER 15 Nonrenewable Energy
THINKING ABOUTPetrochemicals
Look at your clothing and the room you are sitting in and try to identify the items that were made from petrochemicals. What are three important ways in which your lifestyle will be affected if conventional oil becomes unafford-able (Core Case Study)?
World oil consumption has been growing since 1950 (Figure 4, p. S61, Supplement 10), and oil is now the single largest source of commercial energy in the world and in the United States (Figure 15-3). In or-der, the world’s three largest oil users in 2007 were the United States (using 24% of all oil produced), China (using 8%), and Japan (7%). A vital question is, how long can the world’s oil reserves meet the growing global oil consumption (Core Case Study)?
OPEC Controls Most of the World’s Oil SuppliesOil reserves are identified deposits from which conven-tional oil can be extracted profitably at current prices with current technology. Since the world currently is greatly dependent on oil, the oil industry is the world’s largest business. Thus control of oil reserves is the single greatest source of global economic and political power.
The 13 countries that make up the Organization of Petroleum Exporting Countries (OPEC) have at least 60% of the world’s crude oil reserves and, in 2006, pro-duced 43% of the world’s oil. OPEC is expected to have long-term control over the supplies and prices of the world’s conventional oil. Today, OPEC’s members are Algeria, Angola, Indonesia, Iran, Iraq, Kuwait, Libya, Nigeria, Qatar, Saudi Arabia, the United Arab Emirates, and Venezuela. In 2007, OPEC oil revenue averaged about $1.3 million per minute.
Saudi Arabia has by far the largest portion of the world’s crude oil reserves (25%). It is followed by Canada (15%), whose huge supply of oil sand was re-cently classified as a conventional source of oil. In or-der, other countries with large proven reserves are Iran, Iraq, Kuwait, the United Arab Emirates, Venezuela, and Russia. However, as mentioned earlier, because of secrecy by OPEC and other government-controlled oil companies, no one knows the real size of the world’s proven oil reserves. U.N. and other agencies that proj-ect future oil production and demand have to rely mostly on figures given to them by oil-producing coun-tries and private companies.
About 75% of the world’s oil reserves, according to analysts at California’s Stanford University, are in the hands of government-owned companies, not private oil companies. Private companies such as Exxon Mobil, Chevron, and BP control only a small percentage of the world’s oil reserves and thus have a declining influence over oil supplies and prices.
According to oil-producing countries, the world’s proven oil reserves increased by about 15% between 1996 and 2006, with the largest increases in the Mid-dle East. The problem is that oil production from ex-isting reserves has exceeded new oil discoveries since 1984. Global oil production has leveled off since 2005. This helps to explain why, between 2005 and 2008, oil prices climbed from $50 to more than $140 a barrel.
Global oil production peaks when the demand for oil exceeds the amount that can be produced. When the annual global demand for oil exceeds the rate at which it is produced, the flow rate of oil to consumers decreases, and oil prices start rising. Oil production peaked in the United States in 1970 (just as U.S. geolo-gist M. King Hubbert predicted in 1956 that it would). It also peaked in Venezuela in 1970, the United Kingdom in 1999, Norway in 2000, and Mexico in 2004; and it may soon peak in China and even in Saudi Arabia.
Some believe that steeply rising oil prices will lead to long-overdue crash programs to reduce energy waste and shift to non-carbon energy resources such as wind, solar energy, geothermal energy, biomass, and hydro-gen (all of which are discussed in the next chapter).
THINKING ABOUTOIL
Suppose supplies of conventional oil last longer than most geologists expect (Core Case Study). List three environmental disadvantages of this scenario.
Other analysts have a different and more pessimis-tic view. As oil prices rise sharply because annual pro-duction cannot meet the demand, they project that:
• Prices of food produced by oil-dependent industri-alized agriculture (Figure 12-15, p. 290) and prod-ucts such as plastics, pesticides, asphalt, and other widely used materials produced from petrochemi-cals will rise sharply.
• Food production may become more localized—reversing the current trend toward global food pro-duction and distribution built on cheap oil.
• Airfares will go up, and air travel and air freight shipments will likely level off and perhaps decline.
• The oil-intensive automobile industry will see a steep decline in the demand for cars and trucks that run on conventional gasoline or diesel fuel and for motor vehicles with fuel economies lower than 17 kilometers per liter (40 miles per gallon).
• In countries such as the United States, which have long neglected public transportation systems, there could be a mass exodus from car-dependent sub-urbs as property values plummet. This migration could leave behind closed shopping malls, discount stores, and other businesses that have sprung up in far-flung suburbs where people currently must drive to get most of what they need.
CONCEPTS 15-2A AND 15-2B 377
The United States Uses Much More Oil Than It ProducesThe United States gets about 85% of its energy from fossil fuels, with 39% coming from oil (Figure 15-3, right). About 25% of U.S. domestic oil production and 20% of domestic natural gas comes from offshore drill-ing, mostly off the coasts of Texas and Louisiana in the Gulf of Mexico (see Figure 15-1 and Figure 6, p. S62, Supplement 10). This area is subject to hurricanes, which on average are increasing in intensity. Another 17% of domestic oil comes from Alaska’s North Slope via oil tankers and the Trans-Alaska Pipeline.
The United States produces about 9% of the world’s oil but uses 24% of global oil production and has only 2.4% of the world’s oil reserves. Oil use in the United States has exceeded new domestic discoveries since 1984.
The United States produces most of its dwindling domestic supply of oil at a high cost, about $7.50–$10 per barrel on dry land and four or more times this fig-ure for tapping deep-water sources, compared to about $2 per barrel in Saudi Arabia. This helps to explain why the United States imports about 60% of its oil.
According to a 2005 report by the Institute for the Analysis of Global Security, almost one-fourth of the world’s conventional oil is controlled by states that spon-sor or condone terrorism. This means that, in buying oil from those countries, the United States, Great Britain, Japan, and other countries concerned with fighting ter-rorism are funding the enemy. According to a 2006 poll of 100 foreign policy experts in Foreign Policy magazine, the highest priority in fighting terrorism must be to sharply re-duce America’s dependence on foreign oil.
The U.S. Department of Energy estimates that if current trends continue, the United States will import 70% of its oil by 2025. At the same time, it will be fac-ing stiff competition for oil imports from rapidly indus-trializing countries such as China, which in 2007 was the world’s second largest oil user and imported nearly half of its oil.
According to the U.S. Geological Survey, potentially vast domestic oil and natural gas reserves remain to be discovered in the United States, much of it beneath federal lands and coastal waters (see Figure 6, p. S62, Supplement 10). In 2006, for example, three oil com-panies announced that they had found a massive oil field deep below the ocean floor in the Gulf of Mexico (Core Case Study, Figure 15-1) that could even-tually boost U.S. oil reserves by as much as 50%. However, it will take many years and billions of dollars to bring this oil to market at a very high cost. This field will not significantly reduce the country’s dependence on foreign oil, and it will not help to lower prices at the gasoline pump anytime soon. Even if fully developed, the estimated oil in this field would meet current U.S. oil needs for only about 5 years, and much less if oil con-sumption increases as projected. Exponential growth (Chapter 1 Core Case Study, p. 5) is a powerful force.
Searching for such oil fields is extremely difficult, expensive, and financially risky. Typically, oil com-panies extract only about one barrel of oil for every three they find. Two barrels are left behind either because the remaining oil is too thick to pump out or because it would cost too much to do so. New tech-niques to recover some of this oil include using seis-mic imaging to track where it is, injecting saline water into wells to increase recovery, reinjecting natural gas associated with oil fields to maintain reservoir pres-sures, and lowering microwave generators down bore-holes to heat heavy oil so that it will flow enough to be pumped out.
Scientists are also attempting to develop genetically engineered bacteria that will react with the oil and increase its flow so that it can be pumped out or con-verted to natural gas. The trick is to develop organisms that can do this in 10 years, instead of the 10 million years required for oil to form naturally. This and other heavy oil recovery methods are expensive compared to getting oil from many of the world’s most productive oil fields, and they decrease the already fairly low net energy yield of heavy oil.
Many geologists doubt that the United States will find enough new oil or extract enough heavy oil from older wells to come close to meeting U.S. demand. Ac-cording to one analyst, if we think of U.S. conventional oil reserves as a six-pack of oil, four of the cans are empty. It has been estimated that if the country opens up virtually all of its public lands and coastal regions to oil exploration, it may find at best about half a can of new oil, which would be developed only at a very high production cost with a lower net energy yield and se-riously harmful environmental effects. In other words, according to these energy analysts, the United States cannot feed its oil addiction by trying to increase domestic oil supplies.
■ CASE STUDY
Oil and the U.S. Arctic National Wildlife RefugeThe Arctic National Wildlife Refuge (ANWR) on Alaska’s North Slope (see Figure 6, p. S62, Supple-ment 10) contains more than one-fifth of all land in the U.S. National Wildlife Refuge System. The refuge’s coastal plain is the only stretch of Alaska’s arctic coast-line that is not open to oil and gas development.
This tundra biome (Figure 7-12, bottom photo, p. 151) is home to a diverse community of species (see Figure 3, p. S55, Supplement 9), including polar bears, arctic foxes, musk oxen, and peregrine falcons. During the brief arctic summer, it serves as a nesting ground for millions of tundra swans, snow geese, and other migratory birds, and as a grazing area and breed-ing ground for one of North America’s last great herds of caribou. Partly because of its harsh climate, this is an extremely fragile ecosystem.

378 CHAPTER 15 Nonrenewable Energy
■✓
■✓
Since 1980, oil companies have been lobbying Con-gress for permission to carry out exploratory drilling in the coastal plain because they believe it might con-tain oil and natural gas deposits. Advocates say that the United States must use all of the oil resources it has, including ANWR, to help decrease dependence on im-ported oil and to help the economy. They believe that economic security should have a higher priority than environmental concerns. Advocates contend that oil production in the nearby Prudhoe Bay will soon de-cline and that the production facilities already in place could be used to help produce and transport oil from the nearby refuge.
Alaska’s elected representatives in Congress strongly support such drilling because the state uses revenue from oil production to finance most of its budget and to provide annual dividends to its citizens. Oil company officials also say that they can now extract oil with less damage than was done in taking oil from nearby Prudhoe Bay.
Finding oil in the ANWR will increase oil company profits. But many experts say it will do little to increase domestic oil supplies or reduce U.S. dependence on oil imports. Geologists estimate that there is a moderate chance of finding enough oil in the ANWR to meet U.S. demand for only 7–24 months. If the projected supply of oil is found, it will be a tiny drop in the nation’s oil bucket compared to projected future U.S. oil consump-tion (Figure 15-5).
Opponents say getting relatively little oil from the ANWR’s coastal plain is not worth degrading this ir-replaceable and fragile ecosystem. They point out that
improving motor vehicle fuel efficiency is a much faster, cheaper, cleaner, and more secure way to in-crease future oil supplies. For example, improving fuel efficiency by just 0.4 kilometer per liter (1 mile per gal-lon) for new cars, SUVs, and light trucks in the United States would save more oil than is ever likely to be pro-duced from the ANWR.
Opponents also point to the severe environmental damage that has occurred in nearby Prudhoe Bay. The Alaska pipeline and a large complex of roads and pro-duction facilities have destroyed and degraded natural habitats and exposed parts of the fragile tundra eco-system and its wildlife to oil spills and toxic chemicals. To opponents, the large oil spill from a BP Alaska pipe-line in 2006, which was caused by inadequate main-tenance, cast major doubts on claims by oil companies that they can develop oil in the ANWR without serious and long-lasting environmental damage. They believe that the ANWR is a place so rare and special that it should be permanently protected from oil drilling and other forms of development.
HOW WOULD YOU VOTE?
Should the U.S. Congress allow oil and gas development in the coastal plain of Alaska’s Arctic National Wildlife Refuge (ANWR) or permanently protect it from oil and gas explora-tion and development? Cast your vote online at academic.cengage.com//biology/miller.
Conventional Oil Has Advantages and DisadvantagesFigure 15-6 lists the advantages and disadvantages of using conventional crude oil as an energy resource (Concept 15-2A). The extraction, processing, and burn-ing of nonrenewable oil and other fossil fuels have a se-vere environmental impact (Figure 14-15, p. 356), in-cluding land disruption, air pollution, water pollution, and losses and degradation of wildlife (Figure 15-7).
A critical and growing problem is the fact that burning oil or any carbon-containing fossil fuel releases CO2 into the atmosphere and helps to promote climate change caused by global warming. Currently, burning oil, mostly as gasoline and diesel fuel for transportation, accounts for 43% of global CO2 emissions. Another problem with relying on oil is that its once high net energy yield is declining as oil producers are forced to turn to oil that is buried far offshore (Figure 15-1) and deep underground. In addition, much of the world’s oil must be imported from unfriendly and politically un-stable producer countries.
HOW WOULD YOU VOTE?
Do the advantages of relying on conventional oil as the world’s major energy resource outweigh its disadvantages? Cast your vote online at academic.cengage.com/biology/miller.
Year
Barr
els
of o
il pe
r ye
ar (b
illio
ns)
2000 2010 2020 2030 2040 20500
1
2
3
4
5
6
7
8
9
10
11
12
13
14
Projected U.S.oil consumption
Arctic refuge oiloutput over 50 years
Figure 15-5 The amount of oil that might be found in the Arctic National Wildlife Refuge, if developed and extracted over 50 years, is only a tiny fraction of projected U.S. oil consumption. (Data from U.S. Department of Energy, U.S. Geological Survey, and Natural Resources Defense Council)

CONCEPTS 15-2A AND 15-2B 379
expose oil sand deposits. Then gigantic electric shovels dig up the oil sand, and load it into house-sized trucks, which carry it to energy-intensive upgrading plants. There the oil sand is mixed with hot water and steam to extract the bitumen, which is heated by natural gas in huge cookers and converted into a low-sulfur, syn-thetic, crude oil suitable for refining.
About 4 metric tons of overburden are removed to produce 1 metric ton of bitumen. This has a severe impact on the land as machines create open pits large enough to be seen in satellite images. The huge vol-umes of toxic mine tailings and other wastes are stored as slurries in ponds, also large enough to be seen from space, and the wastes are extremely toxic to aquatic life and migratory birds.
The entire process results in huge amounts of toxic sludge, as well as much more water pollution and air pollution than are created by the extraction and pro-cessing of conventional crude oil. It releases at least three times more CO2 per barrel of oil than is released in the production of a barrel of conventional oil. Since 2003, Alberta has been Canada’s industrial air pollu-tion capital.
The process also uses large amounts of water, drawn from the Athabasca River. Each barrel of mined bitu-men requires four to five barrels of water. And the Canadian government allows the tar sands industry to continue withdrawing water regardless of how low the river flow becomes.
Because of its huge environmental impact, the United Nations Environment Programme has listed Alberta’s oil sand strip mines as one of the world’s 100 key hotspots
Need to find substitutes within 50 years
Large government subsidies
Environmental costs not included in market price
Artificially low price encourages waste and discourages search for alternatives
Pollutes air when produced and burned
Releases CO2 when burned
Can cause water pollution
Ample supply for 42–93 years
Low cost
High net energy yield
Easily transported within and between countries
Low land use
Technology is well developed
Efficient distribution system
Advantages Disadvantages
T R A D E - O F F SConventional Oil
Figure 15-6 Advantages and disadvantages of using conventional crude oil as an energy resource (Concept 15-2A). Question: Which single advantage and which single disadvantage do you think are the most important? Why?
Figure 15-7 Bird covered with oil from an oil spill in Brazilian wa-ters. Unless volunteers remove the oil, it will destroy this bird’s natu-ral buoyancy and heat insulation, causing it to drown or die from exposure because of a loss of body heat.
Will Heavy Oils from Oil Sand Be a Viable Option?Oil sand, or tar sand, is a mixture of clay, sand, water, and a combustible organic material called bitumen—a thick and sticky, heavy oil with a high sulfur content that makes up about 10% of the gooey mixture.
Northeastern Alberta in Canada has three-fourths of the world’s oil sand resources in sandy soil under a re-mote boreal forest (Figure 7-15, bottom photo, p. 154). Other deposits are in Venezuela, Colombia, Russia, and the U.S. state of Utah. Together the oil sands of Canada and Venezuela contain more oil than is found in Saudi Arabia—nearly as much as the total conventional oil reserves in the Middle East.
In 2003, the oil industry began counting Canada’s oil sands as reserves of conventional oil. As a conse-quence, Canada has 15% of the world’s oil reserves, second only to Saudi Arabia.
About 20% of Alberta’s oil sand is close enough to the surface to be strip-mined, but removing it creates a serious environmental impact. Before the mining takes place, the boreal forest is clear-cut, its wetlands are drained, and its rivers and streams are diverted. Next the overburden of soil, rocks, and clay is removed to
D. R
odriq
ues-
UNEP
/Pet
er A
rnol
d

380 CHAPTER 15 Nonrenewable Energy
of environmental degradation. In 2008, Environmental Defence called Canada’s oil sands industry “the most de-structive project on earth.”
In 2006, energy economist Peter Tertzakian esti-mated that it takes the energy equivalent (mostly in the form of natural gas) of 0.7 barrels of oil to extract, upgrade, and produce 1 barrel of oil from oil sands. In other words, the net energy yield for producing oil from oil sands is low. To make matters worse, in Canada, there is a looming shortage of natural gas. Having to import natural gas to produce this energy resource will raise its cost and further decrease its already low net energy yield. It has been projected that by 2015, heavy oil from oil sand will meet only 4% of the world’s esti-mated oil consumption (Concept 15-2B).
Will Oil Shales Be a Useable Resource?Oily rocks are another potential supply of heavy oil. Such rocks, called oil shales (Figure 15-8, left), contain a solid combustible mixture of hydrocarbons called kerogen. It can be extracted from crushed oil shales by heating them in a large container, a process that yields a distillate called shale oil (Figure 15-8, right). Before the thick shale oil can be sent by pipeline to a refinery, it must be heated to increase its flow rate and processed to remove sulfur, nitrogen, and other impurities.
About 72% of the world’s estimated oil shale re-serves are buried deep in rock formations in the west-ern United States beneath an area called the Green River Formation—a barren stretch of arid land covering portions of Colorado, Wyoming, and Utah. The federal government (American citizens) own about 80% of this land. The U.S. Bureau of Land Management esti-mates that these deposits contain an amount of poten-tially recoverable heavy oil equal to almost four times
the size of Saudi Arabia’s oil reserves and eleven times the size of Alberta’s oil sand reserves—enough to meet the current U.S. oil demand for 110 years.
So what is the catch? One problem is that most of these deposits are locked up in rock and ore of such low grade that it would take considerable energy and money to mine and convert the kerogen to crude oil. In other words, its net energy is low, even lower than that of oil from oil sands. It also takes a lot of water to produce shale oil. The massive U.S. deposits are mostly in arid areas of the West, where water is in short supply (Figure 13-5, p. 318) and likely to become even scarcer because of intense and prolonged drought projected for this area throughout most of this century. Further-more, producing and using shale oil has a much higher environmental impact than exploiting conventional oil. It includes digging up and processing 0.8 metric tons (1 ton) of rock to produce 1 barrel of oil.
Figure 15-9 lists the advantages and disadvantages of using heavy oil from oil sand and oil shale as energy resources (Concept 15-2B).
THINKING ABOUTHeavy Oils
Do the advantages of relying on heavy oils from oil sand and oil shale outweigh their disadvantages? Explain.
High cost (oil shale)
Low net energy yield
Environmental costs not included in market price
Large amounts of water needed for processing
Severe land disruption
Severe water pollution
Air pollution and CO2 emissions when produced and burned
Moderate cost (oil sand)
Large potential supplies, especially oil sands in Canada
Easily transported within and between countries
Efficient distribution system in place
Technology well-developed (oil sand)
Advantages Disadvantages
T R A D E - O F F SHeavy Oils from Oil Shaleand Oil Sand
Figure 15-9 Advantages and disadvantages of using heavy oils from oil sand and oil shale as energy resources (Concept 15-2B). Question: Which single advantage and which single disadvantage do you think are the most important? Why?
Figure 15-8 Oil shale rock (left) and the shale oil (right) extracted from it. Producing shale oil has a low net energy yield and a very high environmental impact. It also requires considerable amounts of water and money (Concept 15-2B).
U.S.
Dep
artm
ent o
f Ene
rgy

CONCEPT 15-3 381
Natural Gas Is a Useful and Clean-Burning Fossil FuelNatural gas is a mixture of gases of which 50–90% is methane (CH4). It also contains smaller amounts of heavier gaseous hydrocarbons such as ethane (C2H6), propane (C3H8), and butane (C4H10), and small amounts of highly toxic hydrogen sulfide (H2S).
Conventional natural gas lies above most reservoirs of crude oil (Figure 15-2). However, unless a natural gas pipeline has been built, these deposits cannot be used. Indeed, the natural gas found above oil reservoirs in deep-sea and remote land areas is often viewed as an unwanted by-product and is burned off. This practice wastes a valuable energy resource and releases climate-changing carbon dioxide into the atmosphere.
When a natural gas field is tapped, propane and butane gases are liquefied and removed as liquefied petroleum gas (LPG). LPG is stored in pressurized tanks for use mostly in rural areas not served by natu-ral gas pipelines. The rest of the gas (mostly methane) is dried to remove water vapor, cleansed of poisonous hydrogen sulfide and other impurities, and pumped into pressurized pipelines for distribution across land areas.
Russia—the Saudi Arabia of natural gas—has about 27% of the world’s proven natural gas reserves, fol-lowed by Iran (15%) and Qatar (14%). The United States has only 3% of the world’s proven natural gas reserves (see Figure 6, p. S62, Supplement 10) but uses about 27% of the world’s annual production.
Natural gas is a versatile fuel that can be burned to heat space and water or produce electricity and to propel vehicles with fairly inexpensive engine modi-fications. In the United States, a pipeline grid delivers natural gas from domestic wells to towns and cities and directly to 60 million American homes. A homeowner can also obtain a small compressor for using natural gas to fuel cars with slightly modified engines.
Natural gas is also used to run medium-sized tur-bines that produce electricity. These clean-burning tur-bines have almost twice the energy efficiency (50–60%) of coal-burning and nuclear power plants (24–35%). They are also cheaper to build, require less time to in-stall, and are easier and cheaper to maintain than large-scale coal and nuclear power plants.
As with any fossil fuel, burning natural gas releases carbon dioxide into the atmosphere. However, it re-
leases much less CO2 per unit of energy gained than does producing and burning coal, conventional oil, or oil from oil sand and oil shale.
So that it can be transported across oceans, natu-ral gas is converted to liquefied natural gas (LNG) at a very low temperature and high pressure. This highly flammable liquid is then put aboard refrigerated tanker ships. After arriving at its destination, it is heated and converted back to the gaseous state at regasification plants before it is distributed by pipeline.
Japan imports large amounts of LNG from Russia. By 2025, the United States plans to become the world’s largest importer of LNG by greatly increasing LNG port and regasification facilities in at least 40 locations. Some analysts warn that this could make the United States too dependent on countries that have not been consis-tently stable and friendly, such as Russia and Iran, for supplies of LNG.
In addition, LNG has a low net energy yield. The equivalent of more than a third of its energy content is required to compress, decompress, refrigerate, and transport it long distances. Like oil sands and oil shale, LNG has met limits imposed by the first and second laws of thermodynamics (pp. 42–43). This explains why some analysts do not view LNG as an economi-cally viable alternative to conventional natural gas un-less its price is kept artificially low by government (tax-payer) subsidies.
Unconventional natural gas is also found in under-ground sources. Coal bed methane gas is found in coal beds near the earth’s surface across parts of the United States and Canada (most yellow areas in Figure 6, p. S62, Supplement 10). But the environmental im-pacts of producing it—scarring of land and pollution of air and water—are causing a public backlash against using this energy source in parts of the western United States.
Another unconventional source of natural gas is methane hydrate—methane trapped in icy, cage-like structures of water molecules. They are buried in some areas of tundra under arctic permafrost, in places such as Alaska and Siberia, and deep beneath the ocean bottom (see Figure 7, p. S63, Supplement 10). So far, it costs too much to get natural gas from meth-ane hydrates, and the release of methane (a potent greenhouse gas) into the atmosphere during removal and processing will speed up global warming and the resulting climate change. In other words, this energy
15-3 What Are the Advantages and Disadvantages of Natural Gas?
CONCEPT 15-3 Conventional natural gas is more plentiful than oil, has a high net energy yield and a fairly low cost, and has the lowest environmental impact of all fossil fuels.
▲

382 CHAPTER 15 Nonrenewable Energy
alternative, like several others, has a low net energy yield and a high environmental impact.
RESEARCH FRONTIER
Finding affordable and environmentally acceptable ways to tap methane hydrates. See academic.cengage.com/biology/miller.
Natural Gas Has More Advantages Than DisadvantagesThe long-term global outlook for conventional natu-ral gas supplies is better than that for conventional oil. At the current consumption rate, known reserves of conventional natural gas should last the world for 62–125 years depending on how rapidly they are used. In 2007, natural gas producer Robert A. Heffner III es-timated that reserves of conventional natural gas in the United States should last 70–100 years at today’s rate of consumption.
Figure 15-10 lists the advantages and disadvantages of using conventional natural gas as an energy resource (Concept 15-3). Because of its advantages over oil, coal, and nuclear energy, some analysts see natural gas (but not LNG or unconventional sources of natural gas) as a bridge fuel to help make the transition to a more sus-tainable energy future based on improved energy effi-ciency and greater reliance on a mix of renewable en-ergy resources, as discussed in Chapter 16.
Nonrenewable resource
Releases CO2 when burned
Government subsidies
Environmental costs not included in market price
Methane (a greenhouse gas) can leak from pipelines
Difficult to transfer from one country to another
Can be shipped across ocean only as highly explosive LNG
Ample supplies
High net energy yield
Low cost
Less air pollution than other fossil fuels
Lower CO2 emissions than other fossil fuels
Easily transported by pipeline
Low land use
Good fuel for fuel cells, gas turbines, and motor vehicles
Advantages Disadvantages
T R A D E - O F F SConventional Natural Gas
Gas turbine
Figure 15-10 Advantages and disadvantages of using conventional natural gas as an energy resource (Concept 15-3). Question: Which single advantage and which single disadvantage do you think are the most important? Why?
15-4 What Are the Advantages and Disadvantages of Coal?
CONCEPT 15-4A Conventional coal is very plentiful and has a high net energy yield and low cost, but it has a very high environmental impact.
CONCEPT 15-4B Gaseous and liquid fuels produced from coal could be plentiful, but they have lower net energy yields and higher environmental impacts than conventional coal has.
▲▲
Coal Comes in Several Forms and Is Burned Mostly to Produce ElectricityCoal is a solid fossil fuel that was formed in several stages out of the remains of land plants that were bur-ied 300–400 million years ago and subjected to in-tense heat and pressure over many millions of years (Figure 15-11).
Coal is burned in about 2,100 power plants (Fig-ure 15-12) to generate about 40% of the world’s elec-
tricity. Using a coal-burning power plant is essentially a complex and inefficient way to boil water and produce steam, which is used to spin turbines and produce elec-tricity. Coal is also burned in various industrial plants. For example, bituminous coal is converted to coke, which is burned in blast furnaces to make iron.
In order, the three largest coal-burning countries are China (Case Study, p. 384), the United States, and In-dia. By 2025, China is expected to burn twice as much coal as the United States burns, and between 2006 and 2031, India’s use of coal is projected to quadruple. In the United States, coal produces 49% of the electricity,

CONCEPTS 15-4A AND 15-4B 383
Peat(not a coal)
Lignite(brown coal)
Increasing moisture content Increasing heat and carbon content
Bituminous(soft coal)
Anthracite(hard coal)
Heat
Pressure Pressure Pressure
Heat Heat
Partially decayed plant matter in swamps and bogs; low heat content
Low heat content; low sulfur content; limited supplies in most areas
Extensively used as a fuel because of its high heat content and large supplies; normally has a high sulfur content
Highly desirable fuel because of its high heat content and low sulfur content; supplies are limited in most areas
Figure 15-11 Stages in coal formation over millions of years. Peat is a soil material made of moist, partially decomposed organic matter and is not classified as a coal, although it too is used as a fuel. The different major types of coal vary in the amounts of heat, carbon dioxide, and sulfur dioxide released per unit of mass when they are burned.
Stack
Toxic ash disposal
Filter
Boiler
Condenser
Cooling loop
Generator
TurbineCoal bunker
Pulverizing mill
Cooling towertransfers wasteheat to atmosphere
Waste heat
age
foto
stoc
k/Su
perS
tock
Figure 15-12 Science: coal-burning power plant. Heat produced by burning pulverized coal in a furnace boils water to produce steam that spins a turbine to produce electricity. The steam is cooled, condensed, and re-turned to the boiler for reuse. Waste heat can be transferred to the atmosphere or to a nearby source of water. Water is pumped through a condenser and back to the water source to remove the waste heat. The largest coal-burning power plant in the United States is in Indiana. It burns 23 metric tons (25 tons) of coal per minute, or three 100-car trainloads of coal per day. The photo shows a coal-burning power plant in Soto de Ribera, Spain. Question: Does the electricity that you use come from a coal-burning power plant?

384 CHAPTER 15 Nonrenewable Energy
followed by natural gas (21%), nuclear power (19%), renewable energy (9%, with 7% from hydroelectric power plants), and oil (2%).
Coal Is a Plentiful but Dirty FuelCoal is the world’s most abundant fossil fuel. According to the U.S. Geological Survey, identified and uniden-tified global supplies of coal could last for 214–1,125 years, depending on how rapidly they are used. The United States—the Saudi Arabia of coal—has 25% of the world’s proven coal reserves (see Figure 6, p. S62, Supplement 10). Russia has 15%, followed by India with 13%, China with 13%, Australia with 8%, and South Africa with 7%.
The U.S. Geological Survey estimates that identified U.S. coal reserves should last about 250 years at the current consumption rate. But a 2007 study by the U.S. National Academy of Sciences estimated that U.S. coal supplies were overestimated and would last for 100 years at current consumption rates, and for only a few decades if coal consumption continues to increase.
Without sophisticated and expensive pollution con-trol devices, burning coal severely pollutes the air (Fig-ure 15-13). Coal is mostly carbon but contains small amounts of sulfur, which are released into the air as sulfur dioxide (SO2) when the coal burns. Burning coal also releases large amounts of particulates (soot), the greenhouse gas CO2 (Figure 15-14), and trace amounts of toxic mercury and radioactive materials. According
to a 2007 report by the Center for Global Development, coal-burning power plants account for 25% of the world’s emissions of CO2 from human activities and 40% of such emissions in the United States.
Another problem is that the harmful environmen-tal costs of using coal are not included in the price of coal-generated electricity. Environmental economists call for changing this situation by taxing each unit of carbon dioxide produced, as Norway and Sweden have done since 1991. This would promote the development of cleaner coal-burning plants as well as improvements in energy efficiency and increased use of renewable energy resources such as wind, solar, hydroelectricity, and geothermal energy. We discuss such economic is-sues more fully in Chapter 23.
■ CASE STUDY
Coal Consumption in ChinaTo support its rapid economic growth, China burns a third of the world’s coal to provide 70% of its com-mercial energy, compared to less than 25% in the United States and Japan. China gets 80% of its electric-ity from burning coal (compared to 49% in the United States), and is adding the equivalent of three large coal-burning power plants per week. As a result, China burns more coal than the United States, Europe, and Japan combined. A 2007 study by German scientists, led by Werner Zittel, estimated that at its current con-sumption rate, China has about 37 years of proven coal reserves left, and only 10–15 years if its coal consump-tion continues to increase by 10–15% a year.
China and other parts of the world as well are pay-ing a heavy environmental price for its dependence
286%Coal-firedelectricity
150%Synthetic oil and
gas producedfrom coal
100%Coal
86%Oil
58%Natural gas
92%Oil sand
17%Nuclear power fuel cycle
10%Geothermal
Figure 15-13 Air pollution from a coal-burning industrial plant in India with inad-equate air pollution controls.
Figure 15-14 CO2 emissions per unit of electrical energy produced for various energy resources, expressed as percentages of emissions released by burning coal directly. These emissions can enhance the earth’s natural greenhouse effect (Figure 3-8, p. 56) and promote climate change (Concept 15-4A). Question: Which produces more CO2 emissions: burning coal to heat a house, or heating with elec-tricity generated by coal? (Data from U.S. Department of Energy)
Deb
Kush
al/P
eter
Arn
old,
Inc.
CONCEPTS 15-4A AND 15-4B 385
on coal. Pollution controls on older, inefficient plants in China are almost nonexistent. And even the newest coal-burning plants are inefficient and have inadequate air pollution control systems.
Since 2005, China has been the world’s leading source of sulfur dioxide, which can cause respiratory and cardiovascular diseases. And sulfur dioxide and ni-trogen oxides spewed by China’s coal-burning power plants interact in the atmosphere to form harmful acidic compounds that fall as acid precipitation in parts of China and other countries. This pollution contributes to the air quality problems in cities such as Seoul, South Korea and Tokyo, Japan. It takes about 5 to 10 days for long-lived pollution from coal-burning plants in China to make its way to the west coast of United States. There it shows up as higher levels of ozone and other forms of air pollution in major California cities such as Los Angeles and San Francisco. Toxic mercury from China’s emissions has been found in fish caught in Or-egon’s Willamette River. In 2008, China became the world’s leading emitter of carbon dioxide, mostly from burning coal.
Major Chinese cities are in an almost perpetual haze from particulates and other pollutants released by burning coal. According to a World Bank report, China has 20 of the world’s 30 most polluted cities. In 2007, another World Bank study estimated that outdoor and indoor air pollution, mostly from coal burning, were causing 650,000 to 700,000 premature deaths a year in China.
This already serious environmental and health problem is likely to get much worse if China continues to rely on coal to fuel its rapid economic growth, unless it spends the money to improve the efficiency and air pollution control systems of its new coal-fired power and industrial plants and to retrofit older plants with such equipment. Researchers across China are work-ing on the next generation of cleaner plants, including plants that burn gases produced from coal.
THINKING ABOUTChina’s Use of Coal
If you were in charge of China’s energy policy, what would be your strategy for long-term coal use? How might this affect the country’s rapid economic growth?
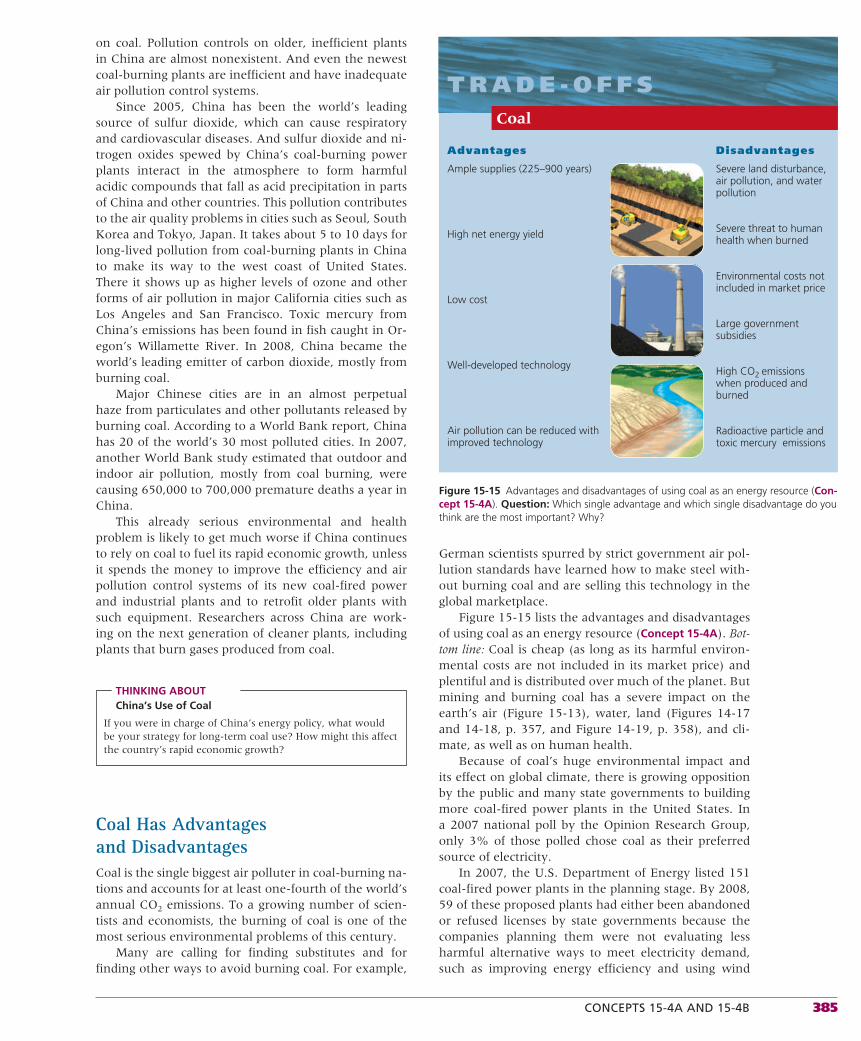
Coal Has Advantages and DisadvantagesCoal is the single biggest air polluter in coal-burning na-tions and accounts for at least one-fourth of the world’s annual CO2 emissions. To a growing number of scien-tists and economists, the burning of coal is one of the most serious environmental problems of this century.
Many are calling for finding substitutes and for finding other ways to avoid burning coal. For example,
German scientists spurred by strict government air pol-lution standards have learned how to make steel with-out burning coal and are selling this technology in the global marketplace.
Figure 15-15 lists the advantages and disadvantages of using coal as an energy resource (Concept 15-4A). Bot-tom line: Coal is cheap (as long as its harmful environ-mental costs are not included in its market price) and plentiful and is distributed over much of the planet. But mining and burning coal has a severe impact on the earth’s air (Figure 15-13), water, land (Figures 14-17 and 14-18, p. 357, and Figure 14-19, p. 358), and cli-mate, as well as on human health.
Because of coal’s huge environmental impact and its effect on global climate, there is growing opposition by the public and many state governments to building more coal-fired power plants in the United States. In a 2007 national poll by the Opinion Research Group, only 3% of those polled chose coal as their preferred source of electricity.
In 2007, the U.S. Department of Energy listed 151 coal-fired power plants in the planning stage. By 2008, 59 of these proposed plants had either been abandoned or refused licenses by state governments because the companies planning them were not evaluating less harmful alternative ways to meet electricity demand, such as improving energy efficiency and using wind
Severe land disturbance, air pollution, and water pollution
Severe threat to human health when burned
Environmental costs not included in market price
Large government subsidies
High CO2 emissions when produced and burned
Radioactive particle and toxic mercury emissions
Ample supplies (225–900 years)
High net energy yield
Low cost
Well-developed technology
Air pollution can be reduced with improved technology
Advantages Disadvantages
T R A D E - O F F SCoal
Figure 15-15 Advantages and disadvantages of using coal as an energy resource (Con-cept 15-4A). Question: Which single advantage and which single disadvantage do you think are the most important? Why?

386 CHAPTER 15 Nonrenewable Energy
■✓
turbines and solar cells. An additional 50 of the pro-posed plants are being contested in the courts, as will most of the other proposed plants. Major U.S. Wall Street investment companies are also turning their backs on new coal-fired power plants. They see such plants as a bad investment because of their enormous
carbon footprint, the likelihood of costly emission caps on their CO2 emissions in the near future, and the avail-ability of less harmful options. Coal will still be burned in many U.S. power plants, but any significant expan-sion of use of this resource seems unlikely.
HOW WOULD YOU VOTE?
Should using coal to produce electricity be phased out over the next 20–30 years? Cast your vote online at academic.cengage.com/biology/miller.
We Can Convert Coal into Gaseous and Liquid FuelsSolid coal can be converted into synthetic natural gas (SNG) by a process called coal gasification and into a liquid fuel such as methanol or synthetic gasoline by coal liquefaction. Compared to conventional uses of coal, producing these gaseous and liquid fuels (called syn-fuels) requires mining 50% more coal. Producing and burning them could add 50% more carbon dioxide to the atmosphere (Figure 15-14). As a result, these syn-fuels have a low net energy yield and cost more to pro-duce per unit of energy than conventional coal costs.
Figure 15-16 lists the advantages and disadvan-tages of using liquid and gaseous synfuels produced from coal (Concept 15-4B). Like energy from tar sands, oil shales, and LNG, synfuels from coal are running up against environmental limits and low net energy yields imposed by the first and second laws of thermodynam-ics (pp. 42–43).
RESEARCH FRONTIER
Improving coal gasification and coal liquefaction technologies. See academic.cengage.com/biology/miller.
Low to moderate net energy yield
Higher cost than coal
Requires mining 50% more coal
Environmental costs not included in market price
High environmental impact
Large government subsidies
High water use
Higher CO2 emissions than coal
Large potential supply
Vehicle fuel
Moderate cost
Lower air pollution than coal when burned
Advantages Disadvantages
T R A D E - O F F SSynthetic fuels
Figure 15-16 Advantages and disadvantages of using synthetic natural gas (SNG) and liquid synfuels produced from coal (Concept 15-4B). Question: Which single advan-tage and which single disadvantage do you think are the most important? Why?
15-5 What Are the Advantages and Disadvantages of Nuclear Energy?
CONCEPT 15-5 Nuclear power has a low environmental impact and a very low accident risk, but high costs, a low net energy yield, long-lived radioactive wastes, vulnerability to sabotage, and the potential for spreading nuclear weapons technology have limited its use.
▲
How Does a Nuclear Fission Reactor Work?To evaluate the advantages and disadvantages of nu-clear power, we must know how a nuclear power plant and its accompanying nuclear fuel cycle work. A nu-
clear power plant is a highly complex and costly system designed to perform a relatively simple task: to boil wa-ter to produce steam that spins a turbine and generates electricity.
What makes it complex is the use of a controlled nuclear fission reaction (Figure 2-7, center, p. 41) to
CONCEPT 15-5 387
Small amounts ofradioactive gases
Periodic removal andstorage of radioactive
wastes and spentfuel assemblies
Periodic removaland storage of
radioactiveliquid wastes
Control rods
Heat exchanger
Containment shell
Steam
Water
Uraniumfuel input(reactor core)
Hotcoolant
Coolant
Pump
Pump
Pump
PumpModerator
Coolantpassage
Pressurevessel
Shielding
Waste heat
Waste heat
Water source(river, lake, ocean)
Turbine Generator
Useful electricalenergy
25%–30%Hotwateroutput
Coolwaterinput
Condenser
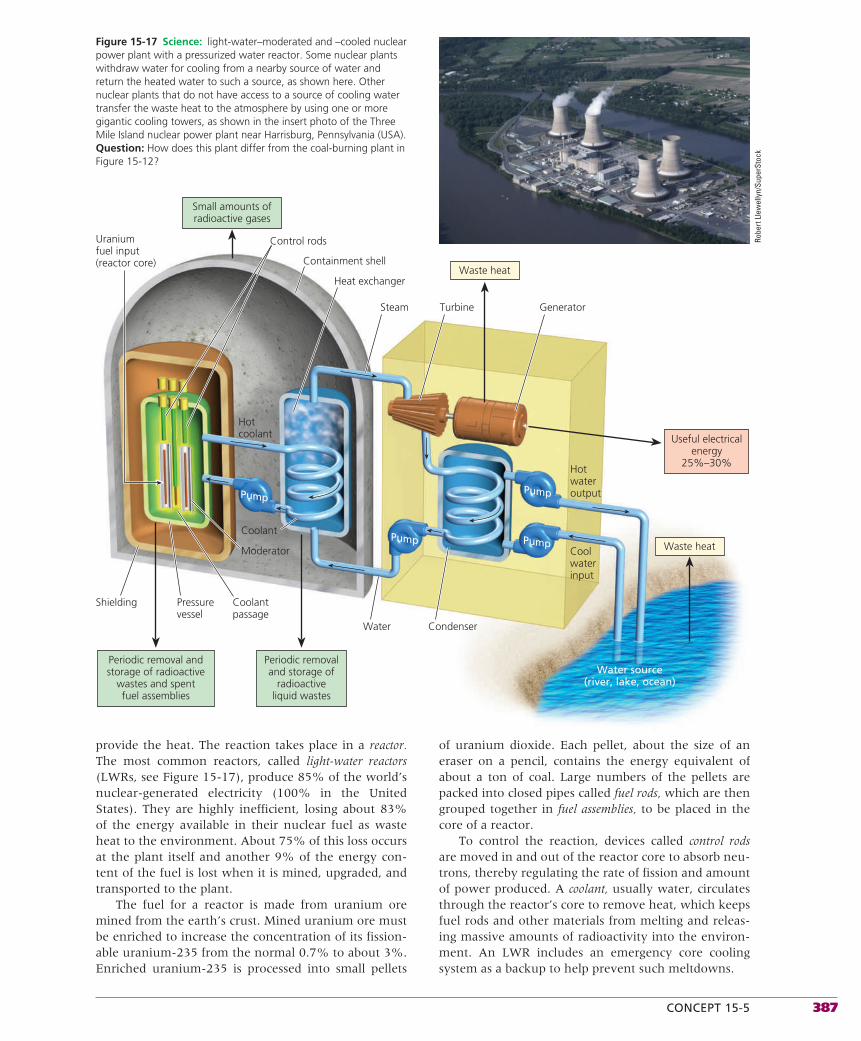
Figure 15-17 Science: light-water–moderated and –cooled nuclear power plant with a pressurized water reactor. Some nuclear plants withdraw water for cooling from a nearby source of water and return the heated water to such a source, as shown here. Other nuclear plants that do not have access to a source of cooling water transfer the waste heat to the atmosphere by using one or more gigantic cooling towers, as shown in the insert photo of the Three Mile Island nuclear power plant near Harrisburg, Pennsylvania (USA). Question: How does this plant differ from the coal-burning plant in Figure 15-12?
of uranium dioxide. Each pellet, about the size of an eraser on a pencil, contains the energy equivalent of about a ton of coal. Large numbers of the pellets are packed into closed pipes called fuel rods, which are then grouped together in fuel assemblies, to be placed in the core of a reactor.
To control the reaction, devices called control rods are moved in and out of the reactor core to absorb neu-trons, thereby regulating the rate of fission and amount of power produced. A coolant, usually water, circulates through the reactor’s core to remove heat, which keeps fuel rods and other materials from melting and releas-ing massive amounts of radioactivity into the environ-ment. An LWR includes an emergency core cooling system as a backup to help prevent such meltdowns.
provide the heat. The reaction takes place in a reactor. The most common reactors, called light-water reactors (LWRs, see Figure 15-17), produce 85% of the world’s nuclear-generated electricity (100% in the United States). They are highly inefficient, losing about 83% of the energy available in their nuclear fuel as waste heat to the environment. About 75% of this loss occurs at the plant itself and another 9% of the energy con-tent of the fuel is lost when it is mined, upgraded, and transported to the plant.
The fuel for a reactor is made from uranium ore mined from the earth’s crust. Mined uranium ore must be enriched to increase the concentration of its fission-able uranium-235 from the normal 0.7% to about 3%. Enriched uranium-235 is processed into small pellets
Robe
rt Ll
ewel
lyn/
Supe
rSto
ck

388 CHAPTER 15 Nonrenewable Energy
A containment shell with thick, steel-reinforced, con-crete walls surrounds the reactor core. It is designed to keep radioactive materials from escaping into the en-vironment, in case there is an internal explosion or a melting of the core within the reactor. It also protects the core from some external threats such as tornadoes and impacts from airplane crashes.
When reactors are shut down and refueled about once a year, intensely hot and radioactive spent fuel rod assemblies are removed and stored outside of the nuclear reactor building in water-filled pools (Fig-ure 15-18, left) or in dry casks (Figure 15-18, right). Spent-fuel pools or casks are not nearly as well pro-tected as the reactor core and thus are much more vul-nerable to sabotage. The long-term goal is to transport spent fuel rods and other long-lived radioactive wastes to an underground facility for long-term storage ranging from 10,000 to 240,000 years, depending on what ra-dioactive isotopes are present. But after almost 60 years of using nuclear power, no country has developed such a facility. Meanwhile, spent fuel rods are stored at nu-clear power plant sites, mostly in deep pools of water.
The overlapping and multiple safety features of a modern nuclear reactor greatly reduce the chance of a serious nuclear accident. They also make nuclear power plants very expensive to build and maintain.
What Is the Nuclear Fuel Cycle?Nuclear power plants, each with one or more reactors, are only one part of the nuclear fuel cycle (Figure 15-19). This cycle includes the mining of uranium, processing and enriching the uranium to make fuel, using it in a reactor, and safely storing the resulting highly radio-active wastes until their radioactivity falls to safe levels.
Figure 15-18 Science: after 3 or 4 years in a reactor, spent fuel rods are removed and stored in a deep pool of water contained in a steel-lined concrete basin (left). After they have cooled considerably, some fuel rods are stored upright on concrete pads (right) in dry-storage containers made of steel or concrete. Question: Do you think these are safe storage methods? Why or why not?
The final step in the cycle occurs when, after 15–60 years, a reactor comes to the end of its useful life and must be retired, or decommissioned. It cannot simply be shut down and abandoned, because its structure con-tains large quantities of intensely radioactive materi-als that must be kept out of the environment for many thousands of years. Each step in the nuclear fuel cycle adds to the cost of nuclear power and reduces its net energy yield (Concept 15-1B). Overall, the current nu-clear fuel cycle is extremely inefficient, using or wast-ing an amount of energy equivalent to about 92% of the energy content of its nuclear fuel.
In evaluating the safety, economic feasibility, and overall environmental impact of nuclear power, energy experts and economists caution us to look at the entire fuel cycle, not just the nuclear plant.
What Happened to Nuclear Power?In the 1950s, researchers predicted that by the year 2000, at least 1,800 nuclear power plants would sup-ply 21% of the world’s commercial energy (25% in the United States) and most of the world’s electricity.
After almost 60 years of development, enormous government subsidies, and an investment of $2 trillion, these goals have not been met. Instead, in 2007, 439 commercial nuclear reactors in 30 countries produced only 6% of the world’s commercial energy and 16% of its electricity. However, France gets 77% of its elec-tricity from nuclear power and has an excellent safety record. And Japan and South Korea each get 39% of their electricity from nuclear power.
But nuclear power is now the world’s slowest-growing energy source with only 34 plants under con-struction and 93 ordered or planned. The International
U.S.
Dep
artm
ent o
f Ene
rgy/
Nuc
lear
Reg
ulat
ory
Com
mis
sion
U.S.
Dep
artm
ent o
f Ene
rgy/
Nuc
lear
Reg
ulat
ory
Com
mis
sion

CONCEPT 15-5 389
Atomic Energy Agency and the U.S. Department of Energy predict that the percentage of the world’s elec-tricity produced by nuclear power will decline gradu-ally to about 12% by 2025 because the retirement of aging plants is expected to exceed the construction of new ones.
Figure 9, p. S65, in Supplement 10 shows the trend in electricity production by nuclear power plants in the United States between 1960 and 2006. In the United States, all of the 120 plants ordered between 1973 and 2007 have been canceled. In 2007, there were 104 licensed commercial nuclear power reactors in 31 states—most of them located in the eastern half of the country (Figure 10, p. S65, Supplement 10). These re-actors generate about 20% of the country’s electricity. This percentage is expected to decline over the next 2–3 decades as existing reactors wear out and are re-tired faster than new ones are built.
Without huge government (taxpayer) subsidies, tax breaks, loan guarantees, and accident insurance guarantees—amounting to about $9 billion a year—the
nuclear power industry would not exist in the United States. In 2007, the U.S. Congress offered $10.1 billion in additional government tax breaks and loan guaran-tees that could lead to the construction of several new reactors, perhaps by 2015 or 2020.
According to energy analysts and economists, sev-eral reasons explain the failure of nuclear power to grow as projected. They include multibillion-dollar construction cost overruns, high operating costs, more malfunctions than expected, poor management, and the low net energy yield of the nuclear fuel cycle. There have been two other obstacles—public concerns about safety and stricter government safety regulations—espe-cially after an accident in 1979 at the Three Mile Island nuclear plant in the U.S. state of Pennsylvania (see Case Study, p. 390), and another in 1986 at the Chernobyl nuclear plant in Ukraine (see Case Study, p. 390).
Another problem is investor concerns about the eco-nomic feasibility of nuclear power. Even with massive government subsidies and loan guarantees, the highly energy-inefficient nuclear fuel cycle (Figure 15-19)
Open fuel cycle todayRecycling of nuclear fuel
Fuel assemblies
Fuel fabricationFuel fabrication
ReactorEnrichment
of UF6
(conversion of enrichedUF6 to UO2 and fabricationof fuel assemblies)
Temporary storageof spent fuel assemblies
underwater or in dry casks
Spent fuelreprocessing
Uranium-235 as UF6Plutonium-239 as PuO2
(conversion of enrichedUF6 to UO2 and fabricationof fuel assemblies)
Temporary storageof spent fuel assemblies
underwater or in dry casksConversionof U3O8to UF6
Low-level radiationwith long half-life
Geologic disposalof moderate-and high-levelradioactive wastes
Decommissioningof reactor
Spent fuelreprocessing
Uranium-235 as UF6Plutonium-239 as PuO2
Figure 15-19 Science: the nuclear fuel cycle (Concept 15-5). As long as a plant is operating safely, this fuel cycle has a fairly low environmental impact and a very low risk of an accident. But costs are high, radioactive wastes must be stored safely for thousands of years, and facilities are vulnerable to terrorist attack. Also, the technology can be used to produce material for use in nuclear weapons, and an amount equal to about 92% of the energy content of the nuclear fuel is wasted in producing nuclear power. Questions: Do you think the market price of nuclear-generated electricity should include all the costs of the fuel cycle? Explain. If so, how would this affect the use of nuclear power to produce electricity?

390 CHAPTER 15 Nonrenewable Energy
costs more than using coal, natural gas, or wind power to produce electricity. According to economic analyses, without huge government subsidies, no existing nu-clear power plant anywhere in the world can compete in the open marketplace with most other methods of producing electricity, if the entire nuclear fuel cycle is taken into account.
In 2008, analysts warned that prolonged drought projected for much of the United States during this century could lead to seasonal or permanent closure of nuclear power plants that must get huge amounts of cooling water from nearby lakes or rivers whose sup-plies might dry up. When water levels in these bodies of water drop below a certain level, the plant must be shut down.
Another problem that can limit the global expan-sion of nuclear power plants is that many of the world’s shipping companies and ports are putting much tighter restrictions on the shipping of radioactive uranium fuel around the globe because of concerns over safety, ter-rorist attacks, and rising insurance costs. But govern-ments say they have the power to override such restric-tions. Other problems that have limited the growth of nuclear power and that could limit future growth are discussed below.
■ CASE STUDY
Three Mile Island: America’s Worst Commercial Nuclear Power Plant AccidentOn March 29, 1979, one of the two reactors at the Three Mile Island (TMI) nuclear plant near Harrisburg, Pennsylvania (photo in Figure 15-17), lost its coolant water because of a series of mechanical failures and hu-man operator errors. This led to the most serious com-mercial nuclear power plant accident in U.S. history.
With the loss of coolant, the reactor’s intensely ra-dioactive core became partially uncovered and about half of it melted and fell to the bottom of the reac-tor. Had there been a complete core meltdown, large amounts of dangerous radioactivity would have been released into the surrounding countryside. Fortunately, the containment building kept most of the radioactivity released from the partially exposed core from escaping, and there were no immediate human casualties.
However, unknown amounts of radioactivity had escaped into the atmosphere. About 50,000 people were evacuated, and another 50,000 fled the area on their own. Various studies have shown no increase in cancer rates from radiation released by the accident, but there is controversy over this issue because of in-sufficient data.
Partial cleanup of the damaged TMI reactor, along with lawsuits and payment of damage claims, have cost $1.2 billion—almost twice the reactor’s $700 million construction cost. Without significant government sub-sidies, loan guarantees, and accident insurance guaran-
tees, banks and other lending institutions have shown little interest in financing new U.S. nuclear power plants, because the TMI accident showed that utility companies could lose more than $1 billion in equip-ment and cleanup costs, even without any established harmful effects on public health.
In raising public fears about the safety of nuclear power, the TMI accident led to improved safety regula-tions for U.S. nuclear plants and improved emergency and evacuation plans. Nuclear power proponents point out that there have been no notable U.S. accidents since TMI. And since 1991, the U.S. reactor fleet has operated at about 90% capacity, up from about 60% in the early 1980s.
■ CASE STUDY
Chernobyl: The World’s Worst Nuclear Power Plant AccidentChernobyl is known around the globe as the site of the world’s most serious nuclear power plant accident. On April 26, 1986, a series of explosions in one of the re-actors in a nuclear power plant in Ukraine (then part of the Soviet Union) blew the massive roof off a reac-tor building. The reactor partially melted down (Fig-ure 15-20) and its graphite moderator caught fire and burned for 10 days, releasing more than 100 times the amount of radiation generated by the atomic bombs dropped by the United States on the Japanese cities of Hiroshima and Nagasaki at the end of World War II. The initial explosion and the prolonged fires released a huge radioactive cloud that spread over much of Belarus, Russia, Ukraine, and Europe and eventually encircled the planet. In 2008, after 22 years, areas of the Ukraine and northern Europe are still dangerously contaminated with radioactive materials as a result of the accident.
According to U.N. studies, the Chernobyl disas-ter was caused by poor reactor design (not used in the United States or in most other parts of the world) and by human error, and it had serious consequences. By 2005, 56 people had died prematurely from exposure to radiation released by the accident. The World Health Organization projects that eventually, this number will grow to 9,000. But the Russian Academy of Medical Sciences estimated the eventual death toll at 212,000. Because of secrecy and sparse reliable data, we will never know the real death toll.
After Chernobyl, some 350,000 people had to aban-don their homes because of contamination by radioac-tive fallout. In addition to fear about long-term health effects such as cancers, many of these victims con-tinue to suffer from stress and depression. In parts of Ukraine, people still cannot drink the water or eat lo-cally produced fruits, vegetables, fish, meat, or milk. In contaminated areas, the frequency of birth defects and mental retardation in newborns has increased. There are also higher incidences of thyroid cancer, leukemia,

CONCEPT 15-5 391
and immune system abnormalities in children exposed to radioactive fallout. Thyroid cancers are so common that the resulting surgical scars at the base of the neck are known as the “Chernobyl necklace.”
Chernobyl taught us a hard lesson: A major nuclear accident anywhere has effects that reverberate through-out much of the world. One more major nuclear power accident anywhere in the world could have a devastat-ing impact on the future of nuclear power.
Japan, an earthquake-prone country that gets 39% of its electricity from nuclear power, has come close to having such an accident. The country has suffered a string of nuclear accidents and cover-ups of such ac-cidents. In 2007, a powerful earthquake in northern Japan caused severe damage to the world’s largest nuclear plant (largest in terms of power output) and caused it to be shut down for at least a year. Despite the risks, Japan plans to replace 20 of its 55 aging nu-clear reactors between 2010 and 2030.
Watch how winds carried radioactive fall-out around the world after the Chernobyl meltdown at CengageNOW.
Nuclear Power Has Advantages and DisadvantagesFigure 15-21 lists the major advantages and disadvan-tages of the nuclear power fuel cycle (Concept 15-5). In particular, using nuclear power to produce electricity has some important advantages over using coal-burning power plants (Figure 15-22, p. 392).
Figure 15-20 Remains of a nuclear reactor at the Chernobyl nuclear power plant in Ukraine 3 days after it blew up and released massive amounts of dangerous radiation into the environment. Workers and volunteers put out the fires and hastily built a concrete tomb around the reactor to contain its high-level radiation, and many of these work-ers died from radiation exposure.
Cannot compete economically without huge government subsidies
Low net energy yield
High environmental impact (with major accidents)
Environmental costs not included in market price
Risk of catastrophic accidents
No widely acceptable solution for long-term storage of radioactive wastes
Subject to terrorist attacks
Spreads knowledge and technology for building nuclear weapons
Large fuel supply
Low environmental impact (without accidents)
Emits 1/6 as much CO2 as coal
Moderate land disruption and water pollution (without accidents)
Moderate land use
Low risk of accidents because of multiple safety systems (except for Chernobyl-type reactors)
Advantages Disadvantages
T R A D E - O F F SConventional NuclearFuel Cycle
Figure 15-21 Advantages and disadvantages of using the nuclear power fuel cycle (Figure 15-19) to produce electricity (Concept 15-5). Question: Which single advan-tage and which single disadvantage do you think are the most important? Why?
H. W
in d
eck-
UNEP
/Pet
er A
rnol
d, In
c.
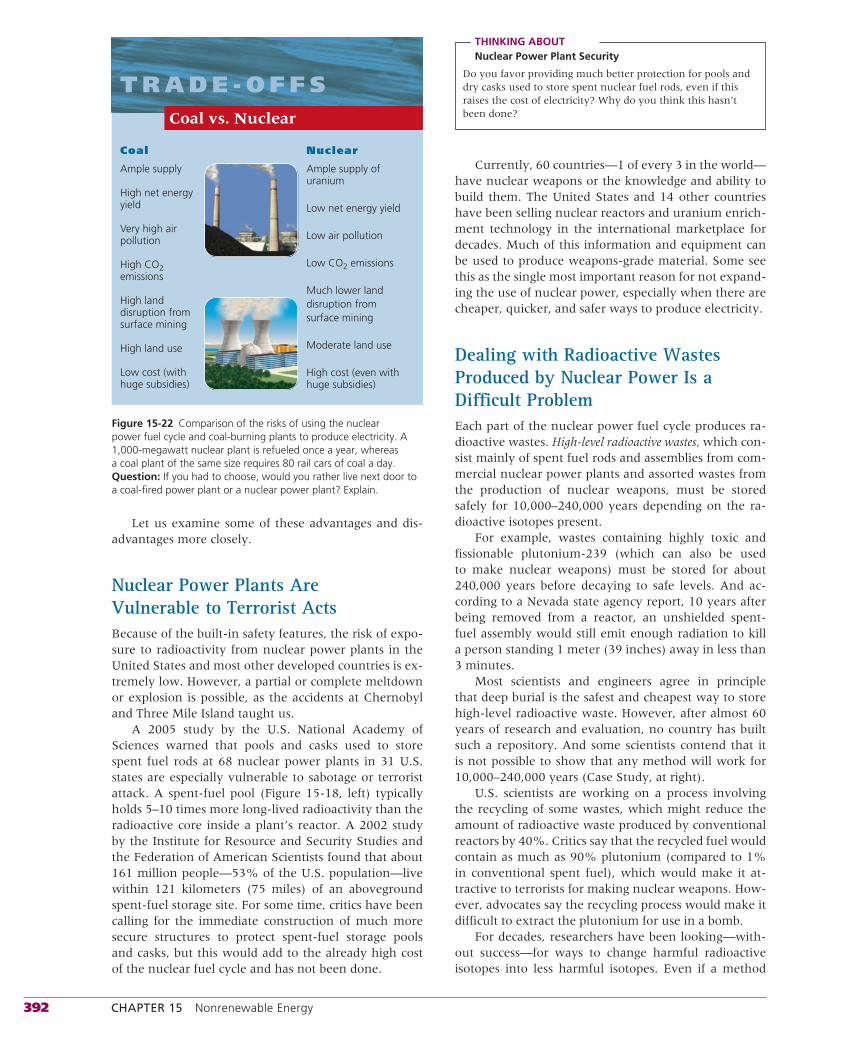
392 CHAPTER 15 Nonrenewable Energy
Let us examine some of these advantages and dis-advantages more closely.
Nuclear Power Plants Are Vulnerable to Terrorist ActsBecause of the built-in safety features, the risk of expo-sure to radioactivity from nuclear power plants in the United States and most other developed countries is ex-tremely low. However, a partial or complete meltdown or explosion is possible, as the accidents at Chernobyl and Three Mile Island taught us.
A 2005 study by the U.S. National Academy of Sciences warned that pools and casks used to store spent fuel rods at 68 nuclear power plants in 31 U.S. states are especially vulnerable to sabotage or terrorist attack. A spent-fuel pool (Figure 15-18, left) typically holds 5–10 times more long-lived radioactivity than the radioactive core inside a plant’s reactor. A 2002 study by the Institute for Resource and Security Studies and the Federation of American Scientists found that about 161 million people—53% of the U.S. population—live within 121 kilometers (75 miles) of an aboveground spent-fuel storage site. For some time, critics have been calling for the immediate construction of much more secure structures to protect spent-fuel storage pools and casks, but this would add to the already high cost of the nuclear fuel cycle and has not been done.
THINKING ABOUTNuclear Power Plant Security
Do you favor providing much better protection for pools and dry casks used to store spent nuclear fuel rods, even if this raises the cost of electricity? Why do you think this hasn’t been done?
Currently, 60 countries—1 of every 3 in the world—have nuclear weapons or the knowledge and ability to build them. The United States and 14 other countries have been selling nuclear reactors and uranium enrich-ment technology in the international marketplace for decades. Much of this information and equipment can be used to produce weapons-grade material. Some see this as the single most important reason for not expand-ing the use of nuclear power, especially when there are cheaper, quicker, and safer ways to produce electricity.
Dealing with Radioactive Wastes Produced by Nuclear Power Is a Difficult ProblemEach part of the nuclear power fuel cycle produces ra-dioactive wastes. High-level radioactive wastes, which con-sist mainly of spent fuel rods and assemblies from com-mercial nuclear power plants and assorted wastes from the production of nuclear weapons, must be stored safely for 10,000–240,000 years depending on the ra-dioactive isotopes present.
For example, wastes containing highly toxic and fissionable plutonium-239 (which can also be used to make nuclear weapons) must be stored for about 240,000 years before decaying to safe levels. And ac-cording to a Nevada state agency report, 10 years after being removed from a reactor, an unshielded spent-fuel assembly would still emit enough radiation to kill a person standing 1 meter (39 inches) away in less than 3 minutes.
Most scientists and engineers agree in principle that deep burial is the safest and cheapest way to store high-level radioactive waste. However, after almost 60 years of research and evaluation, no country has built such a repository. And some scientists contend that it is not possible to show that any method will work for 10,000–240,000 years (Case Study, at right).
U.S. scientists are working on a process involving the recycling of some wastes, which might reduce the amount of radioactive waste produced by conventional reactors by 40%. Critics say that the recycled fuel would contain as much as 90% plutonium (compared to 1% in conventional spent fuel), which would make it at-tractive to terrorists for making nuclear weapons. How-ever, advocates say the recycling process would make it difficult to extract the plutonium for use in a bomb.
For decades, researchers have been looking—with-out success—for ways to change harmful radioactive isotopes into less harmful isotopes. Even if a method
Ample supply of uranium
Low net energy yield
Low air pollution
Low CO2 emissions
Much lower landdisruption fromsurface mining
Moderate land use
High cost (even with huge subsidies)
Ample supply
High net energyyield
Very high airpollution
High CO2emissions
High land disruption fromsurface mining
High land use
Low cost (with huge subsidies)
Coal Nuclear
T R A D E - O F F SCoal vs. Nuclear
Figure 15-22 Comparison of the risks of using the nuclear power fuel cycle and coal-burning plants to produce electricity. A 1,000-megawatt nuclear plant is refueled once a year, whereas a coal plant of the same size requires 80 rail cars of coal a day. Question: If you had to choose, would you rather live next door to a coal-fired power plant or a nuclear power plant? Explain.

■✓
CONCEPT 15-5 393
were developed, costs would probably be extremely high, and the resulting toxic materials and low-level (but very long-lived) radioactive wastes would still re-quire a safe disposal method.
After almost 60 years of effort, no country has come up with a scientifically and politically accept-able way to store high-level radioactive wastes safely for tens of thousands of years. An important and of-ten ignored fact about using nuclear power to produce electricity is that, even if all the nuclear power plants in the world were shut down tomorrow, we would still have to deal with all the intensely radioactive wastes they have produced, some of which will have to be isolated safely for 240,000 years. No other existing or abandoned technology has subjected the world to such long-term health risks.
RESEARCH FRONTIER
Safe, affordable nuclear waste storage. See academic.cengage.com/biology/miller.
■ CASE STUDY
Experts Disagree about What to Do with Radioactive Wastes in the United StatesIn 1985, the DOE announced plans to build a reposi-tory for underground storage of high-level radioactive wastes from commercial nuclear reactors. The proposed site is on federal land in the Yucca Mountain desert region, 160 kilometers (100 miles) northwest of Las Vegas, Nevada (Figure 10, p. S65, Supplement 10).
The projected cost of this facility (financed jointly by nuclear power companies and taxpayers) is at least $58 billion and may reach $100 billion. The projected open-ing date is 2017 but it will probably be 2020 or later because of scientific problems with the site, a number of legal battles, and insufficient federal funding.
The idea is to encapsulate the radioactive material in a synthetic material called zircon, seal it in steel can-isters, and store the canisters in underground tunnels that are supposed to be unaffected by earthquakes or a rising water table for at least 10,000 years. However, the site is located in the third most seismically active region in the United States. And a 2007 study by Ian Farman and other scientists indicated that the zircon coatings may degrade faster than originally projected.
Critics charge that the selection of the Yucca Mountain site has been based more on political con-venience than on scientific suitability. Some scientists argue that the site should never be allowed to open, mostly because rock fractures and tiny cracks may al-low water to leak into the site and eventually corrode the waste storage casks.
According to a 2004 review panel, any rain that percolates into the mountain could carry radioactive
wastes leaking from corroded containers into ground-water, irrigation systems, and drinking-water wells and contaminate them for thousand of years. In 1998, Jerry Szymanski, formerly the DOE’s top geologist at Yucca Mountain and now an outspoken opponent of the site, said that if water flooded the site it could cause an explosion so large that “Chernobyl would be small potatoes.”
In 2002, the U.S. National Academy of Sciences, in collaboration with Harvard University and Univer-sity of Tokyo scientists, urged the U.S. government to slow down and rethink its nuclear waste storage pro-cess. These scientists contend that storing spent fuel rods in dry-storage casks (Figure 15-18, right) in well-protected buildings at nuclear plant sites, or at several other larger interim storage sites, is an adequate solu-tion for at least 100 years, in terms of safety and na-tional security. This would buy time to carry out more research on this complex problem and to evaluate other sites and storage methods.
Opponents also contend that the Yucca Mountain waste site should not be opened because it could de-crease national security. The plan calls for wastes to be shipped by truck or rail cars to the Nevada site. This would require about 19,600 shipments of wastes from nuclear power plants across much of the country (Fig-ure 10, p. S65, Supplement 10) for an estimated 38 years before the site is filled. At the end of this period, the amount of newly collected radioactive waste stored at nuclear power plant sites would be about enough to fill another such repository. Critics contend that it would be much more difficult to protect such a large number of shipments from terrorist attacks than to pro-vide more secure ways to store such wastes at nuclear power plant sites or other centralized sites.
The U.S. government is over 10 years behind in providing a repository for radioactive wastes from com-mercial power plants. Because of contracts it signed with owners of nuclear reactors in the 1980s, taxpayers must now reimburse plant owners for the costs of stor-ing spent fuel rods at 122 plant sites in 39 states. If the Yucca Mountain site opens by 2017, these little-known government expenses will cost taxpayers about $7 bil-lion and about $11 billion if the opening of the reposi-tory is delayed until 2020. Such subsidies plus the es-timated $58 billion that the government has spent on developing the Yucca Mountain site add to the already high cost of the nuclear fuel cycle.
Despite rising costs and serious objections from scientists and citizens, in 2002, the U.S. Congress ap-proved Yucca Mountain as the official site for storing the country’s commercial nuclear wastes.
HOW WOULD YOU VOTE?
Should highly radioactive spent fuel be stored in casks at high-security sites or near nuclear power plants instead of being shipped to a single site for burial? Cast your vote online at academic.cengage.com/biology/miller.

394 CHAPTER 15 Nonrenewable Energy
What Do We Do with Worn-out Nuclear Power Plants?A nuclear power plant eventually comes to the end of its useful life, mostly because of corrosion and radiation damage to its metal parts. Because it contains intensely radioactive materials, it cannot simply be abandoned. Instead, it must be decommissioned, or retired—the last step in the nuclear power fuel cycle (Figure 15-19). Scientists have proposed three ways to do this.
One strategy is to dismantle the plant after it closes and store its large volume of highly radioactive materi-als in a high-level nuclear waste storage facility, which no country has built so far. A second approach is to in-stall a physical barrier around the plant and set up full-time security for 30–100 years, until the plant can be dismantled after its radioactivity has reached safer but still quite dangerous levels.
A third option is to enclose the entire plant in a tomb that must last and be monitored for several thou-sand years. Such a tomb was built around the Cher-nobyl reactor that exploded (Figure 15-20), but after a few years, it began crumbling and leaking radioactive wastes. It is being rebuilt at great cost.
Regardless of the method chosen, decommissioning adds to the total costs of nuclear power and reduces its already low net energy yield. Dismantling a plant and storing the resulting radioactive wastes costs 2–10 times more than building the plant in the first place.
At least 228 of the world’s 439 large commercial re-actors (20 in the United States) are scheduled for retire-ment by 2012. However, under political pressure from the nuclear industry, by 2006, the Nuclear Regulatory Commission (NRC) had extended the operating licenses from 40 years to 60 years for many of the 104 U.S. nu-clear reactors. Opponents contend this could increase the risk of nuclear accidents in aging reactors. At the same time, the NRC is cutting back on the frequency of safety tests from four times a year to once a year.
The nuclear industry is hoping to replace aging reac-tors with new second-generation reactors (see Science Focus, at right).
Can Nuclear Power Lessen Dependence on Imported Oil and Help Reduce Global Warming?Some proponents of nuclear power in the United States claim it will reduce the country’s dependence on im-ported oil. Other analysts disagree, pointing out that only 2–3% of the electricity in the United States (and in most other countries) is generated by burning oil.
Nuclear power advocates also contend that in-creased use of nuclear power will reduce the threat of global warming by greatly reducing or eliminating emissions of CO2. Scientists point out that this argu-ment is only partially correct. Nuclear plants them-
selves do not emit CO2, but the nuclear fuel cycle does (Figure 15-19)—a fact rarely reported in media stories about nuclear power.
Such emissions are presumably much less than those produced by burning coal or natural gas to gen-erate the same amount of electricity (Figure 15-14) and about the same as those emitted by the entire process of producing and operating solar cells and offshore wind farms. However, according to a 2004 study by German scientists, considering the entire nuclear fuel cycle, CO2 emissions per kilowatt-hour of electricity are much higher than the numbers in Figure 15-14 indicate.
In a 2003 study “The Future of Nuclear Power,” MIT researchers concluded that some 1,000 to 1,500 new reactors (compared to the 439 that exist today) would have to be built worldwide by 2025 in order to put a serious dent in projected global warming. Those plants would require a new large repository every few years to store the resulting amount of highly radioac-tive nuclear waste. Building and operating this many new plants would also hasten the depletion of high-grade uranium ores, and mining, processing, and trans-porting these ores releases CO2. Shifting to low-grade ores to meet increased fuel demands would increase the carbon footprint of the nuclear fuel cycle.
In 2007, a leading think tank, the Oxford Research Group, said that in order to play an effective role in slowing global warming, a new nuclear reactor would have to be built somewhere in the world every week for the next 70 years—an impossibility for logistical and economic reasons. And physicist Brice C. Smith estimates that even if this were possible, because of the retirement of old reactors, the proportion of electric-ity coming from nuclear power would increase only slightly from its current 16% to 20%. Analysts contend that cutting energy waste and increasing the use of renewable energy resources to produce electricity are much better and faster ways to reduce CO2 emissions.
Will Nuclear Fusion Save Us?Nuclear fusion is a nuclear change in which two iso-topes of light elements, such as hydrogen, are forced together at extremely high temperatures until they fuse to form a heavier nucleus, releasing energy in the pro-cess. Scientists hope that controlled nuclear fusion will provide an almost limitless source of high-temperature heat and electricity. Research has focused on the D–T nuclear fusion reaction, in which two isotopes of hy-drogen—deuterium (D) and tritium (T)—fuse at about 100 million degrees (Figure 2-7, bottom, p. 41).
With nuclear fusion, there would be no risk of melt-down or release of large amounts of radioactive materi-als from a terrorist attack, and little risk of additional proliferation of nuclear weapons, because bomb-grade materials are not required for fusion energy. Fusion power might also be used to destroy toxic wastes, sup-ply electricity for ordinary use, and decompose water

CONCEPT 15-5 395
to produce hydrogen fuel, which holds promise as an energy source.
This sounds great. So what is holding up fusion en-ergy? In the United States, after more than 50 years of research and a $25 billion investment of mostly gov-ernment funds, controlled nuclear fusion is still in the laboratory stage. None of the approaches tested so far has produced more energy than it uses.
In 2006, the United States, China, Russia, Japan, South Korea, and the European Union agreed to spend
at least $12.8 billion in a joint effort to build a large-scale experimental nuclear fusion reactor by 2040 and to see if it can produce a net energy yield. If everything goes well, after 34 years, the plant is supposed to pro-duce enough electricity to run the air conditioners in a small city for a few minutes. This helps to explain why many energy experts do not expect nuclear fusion to be a significant energy source until 2100, if then. Indeed, some skeptics joke that “nuclear fusion is the power of the future and always will be.”
SCIENCE FOCUS
Are New Second-Generation Nuclear Reactors the Answer?
must be so inherently safe that a runaway chain reaction is impossible; (2) their fuel must be of the sort that cannot be used to make nuclear weapons; (3) their spent fuel must be easy to dispose of without burden-ing future generations with radioactive waste piles; (4) taking the entire fuel cycle into ac-count, they must generate higher net energy yields than other energy alternatives do, and compete in the open marketplace without huge government subsidies; and (5) the en-tire nuclear fuel cycle must generate far fewer greenhouse gas emissions than other energy alternatives do. So far, no existing or pro-posed reactor even comes close to meeting these requirements.
Some nuclear power proponents urge the development and widespread use of breeder nuclear fission reactors, which generate more nuclear fuel than they consume by converting nonfissionable uranium-238 into fissionable plutonium-239. However, a failure of the breeder reactor’s safety system could result in a runaway fission chain reaction and perhaps a nuclear explosion powerful enough to blast open the containment building. This would release a cloud of highly radioactive gases and particles into the atmosphere.
In December 1986, France opened a commercial-size breeder reactor. It was so expensive to build and operate that, in 1998 after spending $13 billion, the government spent another $2.75 billion to shut it down permanently. Because of this experience, most countries have abandoned their plans to build full-size commercial breeder reactors. However, India, China, Japan, South Korea, and Russia have built or are planning to build small-scale breeder reactors to continue eval-uating this technology.
Critical ThinkingDo you think we should invest in second-generation nuclear reactors? Explain.
pile and the others are removed. Unreactive helium gas flowing through the spaces be-tween the spheres removes heat from the fis-sioning fuel. The hot gas can then be used for a number of purposes, including generation of electricity.
Proponents contend that this and other inherently safe designs eliminate the need for an expensive containment shell and emergency core cooling system. Such reac-tors are now in the planning stages in China and South Africa. China plans to perfect and eventually mass-produce these reactors, ship them anywhere in the world, and assemble them like Legos.
Edwin Lyman and several other nuclear physicists oppose the pebble bed reactor. They contend that
• A crack in the reactor could expose graph-ite protective coatings to air. At high tem-peratures, the graphite could burn and release massive amounts of radioactivity—similar to what happened at Chernobyl.
• A lack of a containment shell for any reac-tor would make it easier for terrorists to enter such facilities and steal nuclear fuel material or blow them up to release large amounts of radioactivity.
• This technology would create about ten times the volume of high-level radioactive waste per unit of electricity as a conven-tional nuclear reactor produces. This would greatly increase the expense and hazards of long-term radioactive waste storage and power plant decommissioning.
According to the U.S. Energy Information Administration, the costs of building next generation nuclear power plants are likely to be 2–4 times greater than the costs of build-ing natural gas or coal plants or wind farms with equivalent output.
To be acceptable, new generation nuclear reactors must satisfy five criteria: (1) They
artly to address economic and safety concerns, the U.S. nuclear industry
has persuaded Congress to provide govern-ment subsidies and loan guarantees to help them build hundreds of smaller, second-generation plants using standardized designs. The industry claims these plants are safer and can be built quickly (in 3–6 years). How-ever, experts estimate that even if everything goes well, a new round of plants in the United States will not come online before 2020 or later and will cost an estimated $4 billion each.
These advanced light-water reactors (ALWRs) have built-in passive safety features designed to make meltdowns, explosions, and the release of radioactive emissions al-most impossible. Most are high-temperature, gas-cooled re actors (HTGC ), which avoid some of the problems associated with water-cooled reactors. Proponents also contend that gas-cooled reactors could be used to de-compose water to produce hydrogen fuel for powering motor vehicles and planes.
However, according to Nucleonics Week, an important nuclear industry publication, “Experts are flatly unconvinced that safety has been achieved—or even substantially increased—by the new designs.” In addi-tion, these new designs do not eliminate the expense and hazards of long-term radioac-tive waste storage, threats of terrorist at-tack, power plant decommissioning, and the spread of knowledge and materials for the production of nuclear weapons.
One proposed new design is called a pebble bed modular reactor (PBMR), an idea first proposed by physical chemist Farrington Daniels just after World War II. One advan-tage of the pebble design is that it does not need to be shut down for refueling. Instead, pebbles are taken from the bottom of the reactor every day and weighed to see if they still contain usable nuclear fuel; those that still have fuel are returned to the top of the
P

396 CHAPTER 15 Nonrenewable Energy
■✓
Experts Disagree about the Future of Nuclear PowerProponents of nuclear power argue that governments should continue funding research, development, and pilot-plant testing of potentially safer and cheaper con-ventional fission reactor designs, along with breeder fission and nuclear fusion. They say we need to keep these potentially useful nuclear options available for use in the future, in case energy efficiency and renewable energy options fail to keep up with electricity demands while reducing CO2 emissions to acceptable levels.
Others would support expansion of nuclear power only when the five criteria listed in the Science Focus on p. 395 are met. Some analysts call for phasing out all or most government subsidies, tax breaks, and loan guar-antees for nuclear power. They argue that nuclear power is a complex, expensive, inefficient, and inflexible way to produce electricity. They see it as an unacceptable risk, because it is too vulnerable to terrorist attack and threatens global security by spreading knowledge and materials that can be used to build nuclear weapons.
According to many investors and World Bank eco-nomic analysts, conventional nuclear power cannot compete in today’s increasingly open, decentralized, and unregulated energy market, unless it is shielded from competition by large government subsidies (as is the case in every country that has nuclear power plants). Both the U.S. Congressional Budget Office and the private investment firm Standard and Poors have concluded that investing in loans to build nuclear power plants is an unwise financial risk unless govern-ments (taxpayers) are willing to guarantee the loans.
Opponents of nuclear power say it makes more sense to invest government funds in spurring the rapid development of energy efficiency and renewable energy resources that are much safer and can be developed more quickly. We explore these options in Chapter 16.
HOW WOULD YOU VOTE?
Should nuclear power be phased out in the country where you live over the next 20–30 years? Cast your vote online at academic.cengage.com/biology/miller.
Oil Supplies and Sustainability
In this chapter, we have seen that oil—the lifeblood of today’s economies—may become unaffordable sometime during this century (Core Case Study and Figure 8, p. S64, Supplement 10). If this happens, we will need to find substitutes for oil and begin phasing them in during your lifetime, starting now. This urgent challenge is controversial, partly because of its complexity. It in-volves multiple problems, the solutions for which will require ap-plications of science, economics, politics, and ethics.
A serious long-term problem is that, in using nonrenewable fossil fuels, we violate the four scientific principles of sustain-ability (see back cover). We depend not on solar energy but on
nonrenewable resources such as oil. The technologies we use to obtain energy disrupt the earth’s chemical cycles by diverting huge amounts of water, disrupting land and aquatic systems, and emitting large quantities of pollutants and greenhouse gases. Using these technologies also destroys and degrades biodiversity and ecosystem services that help to control species populations.
In the next chapter, we will look at the advantages and disad-vantages of reducing energy waste and relying more on renew-able energy resources as ways to apply the four principles of sustainability.
R E V I S I T I N G
Civilization as we know it will not survive unless we can find a way to live without fossil fuels.
DAVID GOLDSTEIB
REVIEW
1. Review the Key Questions and Concepts for this chapter on p. 371. Summarize the issue of whether or not and when we are likely to run out of affordable oil.
2. What major energy resources do the world and the United States rely on? Give a brief history of human energy use. What is net energy and why is it important in evaluating
energy resources? Why does the nuclear power fuel cycle have a low net energy yield?
3. What is crude oil (petroleum) and how is it extracted from the earth and refined? What is a petrochemical and why are such chemicals important? Who controls most of the world’s oil supply? What percentage of the

ACADEMIC.CENGAGE.COM/BIOLOGY/MILLER 397
CRITICAL THINKING
1. To continue using oil at the current rate (not the pro-jected higher exponential rates), we must discover and add to global oil reserves the equivalent of two new Saudi Arabian supplies every 10 years, as discussed in the Core Case Study that opened this chapter. Do you think this is possible? If not, what effects might the failure to find such supplies have on your life and on the lives of your children or grandchildren?
2. Do you think that the United States (or the country where you live) should make every effort possible to find new domestic supplies of conventional oil (Core Case Study) as a way to sharply reduce its depen-dence on imported oil? Explain. What are other possible options?
3. List three actions you can take to reduce your dependence on oil and gasoline in order to save you money and help to slow depletion of the world’s oil (Core Case Study). Which of these things do you already do or plan to do?
4. Explain why you are for or against increasing oil imports to the United States or in the country where you live. If you favor reducing dependence on oil imports, what do you think are the three best ways to do this?
5. Some people in China point out that the United States and European nations fueled their economic growth dur-
ing the industrial revolution by burning coal, with little effort to control the resulting air pollution, and then sought cleaner energy sources later when they became more affluent. China says it is being asked to clean up before it becomes affluent enough to do this, without greatly slowing its economic growth. How would you deal with this contradiction? Since China’s air pollution has implications for the entire world, what role, if any, should the developed nations play in helping it to reduce its dependence on coal and to burn coal more cleanly and efficiently?
6. Explain why you agree or disagree with the following pro-posals made by various energy analysts as ways to solve U.S. energy problems: (a) find and develop more domestic supplies of oil; (b) place a heavy federal tax on gasoline and imported oil to help reduce the waste of oil resources and to encourage use of other alternatives; (c) increase dependence on coal; (d) increase dependence on nuclear power; (e) phase out all nuclear power plants by 2025.
7. Would you favor having high-level nuclear waste from nuclear power plants transported by truck or train through the area where you live to a centralized storage site? Explain. What are the alternatives?
8. Explain why you agree or disagree with each of the following proposals made by the U.S. nuclear power
Note: Key Terms are in bold type.
world’s proven oil reserves does the United States have? How much of the world’s annual oil production does the United States use and what percentage of the oil it uses is imported? Describe the relationship between import-ing oil and fighting terrorism. Explain why the United States cannot even come close to meeting its oil needs by increasing domestic oil supplies. Discuss the pros and cons of drilling for oil in Alaska’s Arctic National Wildlife Ref-uge. What are the major advantages and disadvantages of using conventional oil as an energy resource?
4. What is oil sand, or tar sand, and how is it extracted and converted to heavy oil? What is shale oil and how is it produced? What are the major advantages and disad-vantages of using heavy oils produced from oil sand and oil shales as energy resources?
5. Define natural gas, liquefied petroleum gas (LPG), and liquefied natural gas (LNG)? What are the major advantages and disadvantages of using natural gas as an energy resource? What are some problems involved with increasing our use of LNG?
6. What is coal and how is it formed? Compare the use of coal in the United States and China. What are the major advantages and disadvantages of using coal as an energy resource?
7. What is synthetic natural gas (SNG)? What is coal liquefaction and how can liquid fuels be produced from coal? What are the major advantages and disadvan-
tages of using liquid and gaseous synfuels produced from coal?
8. How does a nuclear fission reactor work and what are its major safety features? Describe the nuclear fuel cycle. What factors have hindered the development of nuclear power? Describe the nuclear power plant accidents at Three Mile Island and Chernobyl. What are the major advantages and disadvantages of relying on nuclear power as a way to produce electricity?
9. How can we deal with the highly radioactive wastes pro-duced by nuclear power plants? Describe the controversy over this issue in the United States. What are our options for safely retiring worn out nuclear power plants? Discuss the degree to which nuclear power can reduce depen-dence on imported oil. Discuss the question of whether using nuclear power can help to significantly slow pro-jected global warming. Discuss the pros and cons of build-ing safer nuclear reactors. List the problems encountered in using breeder reactors. What is nuclear fusion and what is its potential as an energy resource? Summarize the arguments for and against relying more on nuclear power.
10. Discuss the relationship between relying on oil as our major source of energy (Core Case Study) and the four scientific principles of sustainability.
398 CHAPTER 15 Nonrenewable Energy
industry: (a) provide up to $350 billion in government subsidies to build a large number of better-designed nu-clear fission power plants, in order to reduce dependence on imported oil and slow global warming, (b) prevent the public from participating in hearings on licensing of new nuclear power plants and on safety issues at the na-tion’s nuclear reactors, (c) restore government subsidies to develop a breeder nuclear fission reactor program, and (d) greatly increase federal subsidies for developing nu-clear fusion.
Note: See Supplement 13 (p. S78) for a list of Projects related to this chapter.
ECOLOGICAL FOOTPRINT ANALYSIS
In 2008, the average fleet-wide fuel economy of new cars, light trucks, and SUVs in the United States was 11.4 kilo-meters per liter (kpl) or 26.6 miles per gallon (mpg), and the average motor vehicle in the United States was driven 19,300 kilometers (12,000 miles). There were about 250 mil-
lion motor vehicles in the United States in 2008. Use these data to calculate the gasoline consumption and carbon dioxide (CO2) footprints of individual motor vehicles with different fuel efficiencies and for all of the motor vehicles in the United States by answering the following questions.
1. Suppose a car has an average fuel efficiency of 8.5 kpl (20 mpg) and is driven 19,300 kilometers (12,000 miles) a year. (a) How many liters (and gallons) of gasoline does this vehicle consume in a year? (b) If gasoline costs $1.05 per liter ($4.00 per gallon), how much will the owner spend on fuel in a year? (c) How many liters (and gallons) of gasoline would be consumed by a U.S. fleet of 250 mil-lion such vehicles in a year? (Note: 1 liter � 0.265 gallons and 1 kilometer � 0.621 miles.)
2. Recalculate the values in Question 1, assuming that a car has an average fuel efficiency of 19.6 kpl (46 mpg).
3. The U.S. Environmental Protection Agency estimates that 2.4 kilograms of CO2 are released when 1 liter of gasoline is burned (20 pounds of CO2 are released when 1gallon is burned). Use this information to determine the number of metric tons of CO2 emitted annually by
(a) the car described in Question 1 with a low fuel ef-ficiency, (b) a fleet of 250 million vehicles with this same fuel efficiency, (c) the car described in Question 2 with a high fuel efficiency, and (d) a fleet of 250 million ve-hicles with this same high fuel efficiency. These calcula-tions provide a rough estimate of the CO2 footprints for individual cars and for the entire U.S. fleet with low and high efficiency cars. (Note: 1 kilogram � 2.20 pounds; 1 metric ton � 1,000 kilo grams � 2,200 pounds � 1.1 tons; 1 ton � 2,000 pounds).
4. If the average fuel efficiency of the U.S. fleet increased from 8.5 kpl (20 mpg) to 19.6 kpl (46 mpg), by what per-centage would this reduce the CO2 emissions from the entire fleet per year? You can think of this as the percent-age reduction in the carbon footprint of the U.S. motor vehicle fleet.
LEARNING ONLINE
Log on to the Student Companion Site for this book at academic.cengage.com/biology/miller, and choose Chapter 15 for many study aids and ideas for further read-
ing and research. These include flash cards, practice quizzing, Weblinks, information on Green Careers, and InfoTrac® Col-lege Edition articles.
9. Congratulations! You are in charge of the world. List the three most important features of your policy to continue relying on nonrenewable energy resources during the next 50 years.
10. List two questions that you would like to have answered as a result of reading this chapter.

Use the graph below to answer questions 1–4.
1. According to the graph, what was the approximate total energy consumption in BTUs for the United States in 2000?
(A) 40 quadrillion (B) 95 quadrillion (C) 60 quadrillion (D) 35 quadrillion (E) 350 million
2. According to the graph, the projected energy consump-tion for nuclear power is
(A) growing exponentially. (B) decreasing. (C) remaining fairly flat. (D) an example of logistic growth. (E) growing at about 40% per year.
3. Energy use per person in America is (A) growing exponentially. (B) decreasing. (C) remaining fairly flat. (D) an example of logistic growth. (E) growing at about 40% per year.
4. The increase in total energy consumption from 1950–2010 has risen
(A) 10%. (B) 20%. (C) 40%. (D) 50%. (E) 70%.
AP* Review Questions for Chapter 15
398A
Tota
l ene
rgy
cons
umpt
ion
(qua
drill
ion
Btu)
Ener
gy c
onsu
mpt
ion
per
pers
on(m
illio
n Bt
u)
Year Year
0
20
40
60
80
100
120
19500
100
200
300
400
500
19501960 19601970 19701980 19801990 19902000 2010 2000 2010
Ener
gy c
onsu
mpt
ion
(qua
drill
ion
Btu)
Year
History Projected
1985 1990 1995 2000 2005 2010 2015 2020 2025 20300
10
20
30
40
50
60
1980
Oil
Coal
Natural gas
NuclearNonhydro renewablesHydropower

398B AP* REVIEW QUESTIONS FOR CHAPTER 15
5. The world’s largest oil reserves are found in (A) Saudi Arabia. (B) Mexico. (C) China. (D) Venezuela. (E) the United States.
6. When global demand for oil exceeds the rate at which it is produced
(A) price decreases and demand goes up. (B) price and demand stay the same. (C) flow rate is stopped. (D) flow rate to consumers goes down and price goes up. (E) flow rate to consumers goes up and price goes down.
7. Advocates of drilling for oil in the Alaska National Wild-life Refuge (ANWR) believe that by using the oil found here we would decrease our dependence on imported oil. However, opponents feel that
(A) tundra ecosystems recover quickly and can handle the stress.
(B) there is relatively little oil so it is not worth degrading this fragile ecosystem.
(C) since there are 20 years worth of oil found there we should do more research into this resource.
(D) as demand goes up we will not need this resource. (E) a switch to renewable energy will cause America to
not need this resource.
8. The conventional way we extract oil has all of the following disadvantages EXCEPT
(A) air pollution. (B) release of CO2. (C) water pollution. (D) price reduction. (E) dealing with the overburden.
9. Three-fourths of the world’s oil sand is found in (A) Alberta, Canada. (B) Bogota, Colombia. (C) Sydney, Australia. (D) Austin, Texas. (E) Mexico City, Mexico.
10. Which of the following is a benefit of using natural gas? (A) It is 4 times as energy efficient as coal. (B) It is cleaner burning than coal. (C) Coal power plants are cheaper to build and maintain
than natural gas power plants. (D) Getting natural gas from Canada is inexpensive. (E) CO2 is not released when burning natural gas.
11. If America’s per capita energy consumption was approxi-mately 350 million BTUs, then how much does the entire population use?
(A) 105 � 105
(B) 105 � 106
(C) 105 � 107
(D) 105 � 108
(E) 105 � 109
12. The three largest users of coal are (A) China, the United States, and India. (B) China, the United States, and Mexico. (C) the United States and Mexico. (D) Russia, China, and India. (E) Saudi Arabia, Japan, and China.
13. Coal has a huge environmental impact because of its (A) new technology. (B) high cost. (C) effect on global climate. (D) threat to human health. (E) high net energy yield.
14. Nuclear power was predicted to supply 21% of the world’s commercial energy. This has prediction not been met due to
(A) nuclear’s huge air pollution problem. (B) the inefficiency of nuclear power. (C) the small supply of nuclear fuel resources. (D) the solution to long-term storage of radioactive
waste. (E) the high risk of accidents.