Copyright©1998IEEE. ReprintedfromIEEEInternational ... · PDF filekilometer. Theaccuracy...
4
Transcript of Copyright©1998IEEE. ReprintedfromIEEEInternational ... · PDF filekilometer. Theaccuracy...

Copyright © 1998 IEEE. Reprinted from IEEE International Geoscience and Remote
Sensing Symposium Proceedings, Seattle, Washington, July 6-10,1998, Institute of
Electrical and Electronics Engineers, Inc., Piscataway, New Jersey.
This material is posted here with permission of the IEEE. Such permission of the IEEE
does not in any way imply IEEE endorsement of any of USGS/EROS"s products or
services. Internal or personal use of this material is permitted. However, permission to
reprint/republish this material for advertising or promotional purposes or for creating
new collective works for resale or redistribution must be obtained from the IEEE by
writing to [email protected].
By choosing to view this document, you agree to all provisions of the copyright laws
protecting it.

Accuracy Assessment of a Global Elevation Model Using Shuttle Laser Altimeter Data
Dean B. Gesch*
EROS Data Center / U.S. Geological Survey
Sioux Falls, SD 57198
Telephone: (605)594-6055 Fax: (605)594-6529
Email: [email protected]
ABSTRACT
The U.S. Geological Survey's global elevation model,
GTOPO30, has elevations posted approximately every 1
kilometer. The accuracy of GTOPO30 varies spatially due to
the 8 different sources used to produce it, and the estimated
accuracy is based on characteristics of the sources. High
accuracy Shuttle Laser Altimeter (SLA) data were used as an
independent source for assessing the absolute vertical accuracy
of GTOPO30. Results show that some areas of GTOPO30 are
more accurate than previously estimated, while for other areas
the accuracy is less than that which had been stated in the
data set documentation. Future analysis with additional SLA
data will lead to a more comprehensive assessment of
GTOPO30.
BACKGROUND
Digital elevation models (DEM's) are routinely used in
many earth science applications. In many investigations the
phenomena being studied and mapped occur on a regional,
continental, or global scale, thus requiring global data sets.
Global digital geospatial data layers, including DEM's, are
used together in sophisticated models of earth surface and
atmospheric processes. Whenever geospatial data sets are
used in combination, the accuracies of the individual layers
together influence the overall quality of the model results.
The accuracy of the individual layers must be documented as
thoroughly as possible so that users can determine the
proportionate contribution of each to the accuracy of the end
results. Such an accuracy assessment of a basic global data
set is the subject of this study.
Global Elevation Model
The U.S. Geological Survey (USGS) recently has completed
and made available a digital elevation model of the Earth's
land surface, The GTOPO30 data set has a horizontal grid
spacing of 30-arc seconds (approximately 1 kilometer).
GTOPO30 represents a significant improvement in terms of
resolution and data quality over previously available global
elevation models [1]. GTOPO30 data are proving to be useful
in a variety of applications, including continental-scale
hydrologic modeling , radiometric and geometric correction of
satellite image data, global land cover mapping, climate
modeling, and visualization and animation.
Accuracy
Even though GTOPO30 has been widely accepted by the
user community, its accuracy only has been described in a
general manner. GTOPO30 was developed based on 8
different source data sets, so the accuracy of the elevation
model varies by location. The spatially varying vertical
accuracy of GTOPO30 was inherited from the variable
accuracy of the sources. In the documentation that
accompanies GTOPO30, the accuracy of each source is either
stated very generally as an overall product specification or is
an estimate based on the contour interval of the source.
For 6 of the 8 sources, Table 1 lists the percentage of the
global land surface derived from the source, the estimated
vertical accuracy expressed as the root mean square error
(RMSE), and the basis used to estimate the accuracy. For the
raster sources, the stated product specification is used as the
estimate, although inspection of the full resolution data clearly
shows that the accuracy can vary considerably from the
specification. Also, the effects of generalizing to the coarser
grid spacing of GTOPO30 have not been quantified, and are
therefore not included in the estimate. For the cartographic
sources, the assumption is made that the original maps meet
the commonly used accuracy standard which states that 90%
of the mapped elevations are within ± one-half of the primary
contour interval. It is unknown if any of the maps actually
meet this standard. Also, map digitizing and elevation surface
interpolation errors are unknown, and therefore not included.
Hie following section provides more details on the
characteristics of the GTOPO30 sources.
Sources
Digital Terrain Elevation Data (DTED), a raster topographic
data base with a horizontal grid spacing of 3-arc seconds
(approximately 90 meters), was the primary source for
GTOPO30. The secondary source was the Digital Chart of
the World (DCW), a vector cartographic data set based on
l:l,000,000-scale navigational charts. The primary contour
interval in the DCW is 1000 feet (305 meters). USGS DEM's
are equivalent to DTED in terms of resolution and accuracy,
and were used as the source data for the United States.
To fill gaps in the coverage of DTED and DCW, elevation
information was extracted from several different types of
0-7803-4403-0/98/$ 10.00 © 1998 IEEE 840
Authorized licensed use limited to: U.S. GEOLOGIC SURVEY - EROS. Downloaded on February 11, 2009 at 09:38 from IEEE Xplore. Restrictions apply.

Table 1. Estimated accuracies of GTOPO30 sources.
Source
DTED
DCW
USGS DEM's
AMS maps
IMW maps
Peru maps
Percent of GTOPO30 area
50.0
29.9
6.7
1.1
3.7
OA
Estimated RMSE (meters)
18
93
18
152
30
304
Basis for accuracy estimate
product specification
1000-foot contour interval
product specification
500-meter contour interval
100-meter contour interval
1000-meter contour interval
l:l,000,000-scale maps. Contours at intervals of 100, 150,
and 500 meters were digitized from maps produced by the
Army Map Service (AMS). Contours with a 100-meter
interval were digitized from the International Map of the
World (IMW), a series of national maps produced to a United
Nations standard for small scale mapping. Small areas from
a Peruvian topographic map with a 1,000-meter contour
interval were digitized to fill gaps in the source data for South
America.
Shuttle Laser Altimeter Data
The Shuttle Laser Altimeter (SLA), developed by the
Laboratory for Terrestrial Physics at NASA's Goddard Space
Flight Center (GSFC), collected land surface elevation data
during Space Shuttle missions in January 1996 and August
1997. The SLA emits infrared laser pulses and measures the
time of return of the backscattered echoes. Given knowledge
of the shuttle's position and attitude, a highly accurate
measurement of the target's elevation is calculated from the
timing information. SLA-01 data (from the January 1996
mission) and SLA-02 data (from the August 1997 mission)
provide an excellent source of independent, high vertical
accuracy control data with which to assess the GTOPO30
elevation model.
At the time of this study, only SLA-01 data were publicly
available, so the analysis presented here is solely based on
data from the first SLA mission. When they become
available, the SLA-02 data will be extremely valuable for
validation of global DEM's. The digitized waveforms of SLA-
02 data are being processed for the return from the first
reflective surface and the last reflective surface, thus giving
elevations at the canopy top and ground level in most forested
areas. Also, the second SLA mission has more extensive
coverage, with ground tracks covering the area between 58°
north and 58* south latitude. SLA-01 data were collected on
a shuttle mission in which the ground tracks of the orbit
traverse the area between 29" north and 29° south latitude.
An analysis by SLA project staff at GSFC showed a
vertical RMSE of less than 3 meters when SLA-01 data were
compared to precise sea surface height data, including
adjustment for tides. The analysis also showed that the
horizontal geolocation accuracy of the SLA point data is on
the order of 150-200 meters, which would limit their
usefulness for assessing the accuracy of high resolution
DEM's, but is entirely suitable for use with the 1-kilometer
ground spacing of the GTOPO30 data set. The pulse
repetition rate of SLA-01 resulted in an along track ground
spacing of approximately 700 meters between points, a
sufficient sampling interval for assessing elevation data on a
1-kilometer grid.
DATA PROCESSING AND ANALYSIS
The SLA-01 data were reformatted and processed to convert
them into a spatial framework consistent with GTOPO30.
Routines available from GSFC were used to convert the data
from the distribution format to ASCII point data with geodetic
coordinates referenced to the WGS84 ellipsoid. The
GTOPO30 elevations were adjusted to be relative to the
ellipsoid, rather than the geoid (approximated by mean sea
level). In their original state, GTOPO30 elevations are
referenced vertically to mean sea level, which was inherited
as the vertical datum from the sources. Conversion of the
GTOPO30 orthometric heights to ellipsoidal heights was
facilitated by the recently developed Earth Gravitational
Model 1996 (EGM96) [2],
The SLA-01 point data formed the reference data set,
serving as ground truth to which GTOPO30 elevations were
compared. Bilinear interpolation was used to calculate the
GTOPO30 elevation at the location of each SLA-01 point.
The difference between the SLA-01 elevation and the
GTOPO30 elevation was calculated for every point (the
GTOPO30 elevation was subtracted from the SLA-01
elevation), and summary statistics were calculated to
characterize the differences. Statistics were calculated for all
points, and also separately for points grouped by GTOPO30
841
Authorized licensed use limited to: U.S. GEOLOGIC SURVEY - EROS. Downloaded on February 11, 2009 at 09:38 from IEEE Xplore. Restrictions apply.
source. Prior to calculation of the statistics, the data set was
refined by eliminating from the reference data the SLA-01
points that most likely represented cloud heights rather than
ground surface elevation. Points with a difference exceeding
± 450 meters were eliminated. The 450-meter threshold
represents the estimated 3o error of the least accurate
GTOPO30 source with significant areal coverage, the AMS
maps, and the assumption is made that any differences
exceeding this threshold are cloud elevations or other
anomalous points. Future analysis using SLA-02 data will not
require such use of an arbitrary threshold as each point will be
labeled to indicate if it represents a cloud, ocean, canopy top,
or ground elevation.
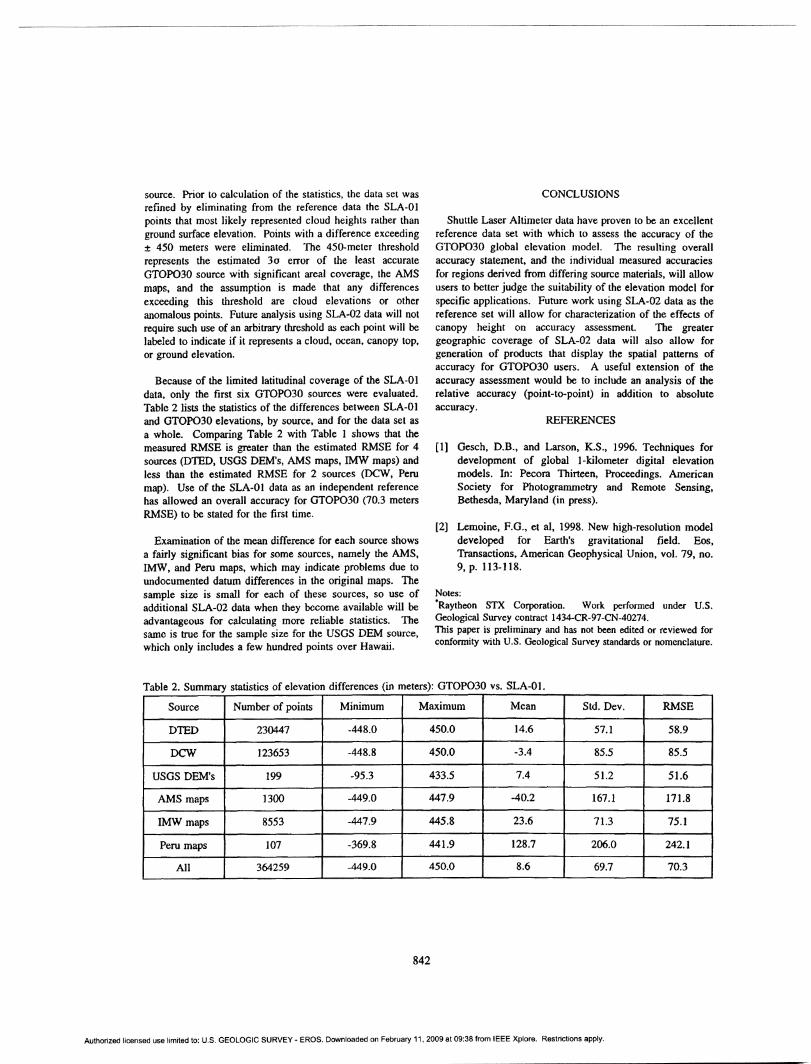
Because of the limited latitudinal coverage of the SLA-01
data, only the first six GTOPO30 sources were evaluated.
Table 2 lists the statistics of the differences between SLA-01
and GTOPO30 elevations, by source, and for the data set as
a whole. Comparing Table 2 with Table 1 shows that the
measured RMSE is greater than the estimated RMSE for 4
sources (DTED, USGS DEM's, AMS maps, IMW maps) and
less than the estimated RMSE for 2 sources (DCW, Peru
map). Use of the SLA-01 data as an independent reference
has allowed an overall accuracy for GTOPO30 (70.3 meters
RMSE) to be stated for the first time.
Examination of the mean difference for each source shows
a fairly significant bias for some sources, namely the AMS,
IMW, and Peru maps, which may indicate problems due to
undocumented datum differences in the original maps. The
sample size is small for each of these sources, so use of
additional SLA-02 data when they become available will be
advantageous for calculating more reliable statistics. The
same is true for the sample size for the USGS DEM source,
which only includes a few hundred points over Hawaii.
CONCLUSIONS
Shuttle Laser Altimeter data have proven to be an excellent
reference data set with which to assess the accuracy of the
GTOPO30 global elevation model. The resulting overall
accuracy statement, and the individual measured accuracies
for regions derived from differing source materials, will allow
users to better judge the suitability of the elevation model for
specific applications. Future work using SLA-02 data as the
reference set will allow for characterization of the effects of
canopy height on accuracy assessment. The greater
geographic coverage of SLA-02 data will also allow for
generation of products that display the spatial patterns of
accuracy for GTOPO30 users. A useful extension of the
accuracy assessment would be to include an analysis of the
relative accuracy (point-to-point) in addition to absolute
accuracy.
REFERENCES
[1] Gesch, D.B., and Larson, K.S., 1996. Techniques for
development of global 1-kilometer digital elevation
models. In: Pecora Thirteen, Proceedings. American
Society for Photogrammetry and Remote Sensing,
Bethesda, Maryland (in press).
[2] Lemoine, F.G., et al, 1998. New high-resolution model
developed for Earth's gravitational field. Eos,
Transactions, American Geophysical Union, vol. 79, no.
9, p. 113-118.
Notes:
*Raytheon STX Corporation. Work performed under U.S.Geological Survey contract 1434-CR-97-CN-40274.
This paper is preliminary and has not been edited or reviewed for
conformity with U.S. Geological Survey standards or nomenclature.
Table 2. Summary statistics of elevation differences (in meters): GTOPO30 vs. SLA-01.
Source
DTED
DCW
USGS DEM's
AMS maps
IMW maps
Peru maps
All
Number of points
230447
123653
199
1300
8553
107
364259
Minimum
-448.0
-448.8
-95.3
-449.0
-447.9
-369.8
-449.0
Maximum
450.0
450.0
433.5
447.9
445.8
441.9
450.0
Mean
14.6
-3.4
7.4
-40.2
23.6
128.7
8.6
Std. Dev.
57.1
85.5
51.2
167.1
71.3
206.0
69.7
RMSE
58.9
85.5
51.6
171.8
75.1
242.1
70.3
842
Authorized licensed use limited to: U.S. GEOLOGIC SURVEY - EROS. Downloaded on February 11, 2009 at 09:38 from IEEE Xplore. Restrictions apply.