
Copyright by Roseanna Beth Robles 2012
178
Copyright by Roseanna Beth Robles 2012
Transcript of Copyright by Roseanna Beth Robles 2012

Copyright
by
Roseanna Beth Robles
2012

The Dissertation Committee for Roseanna Beth Robles Certifies that this is the
approved version of the following dissertation:
Diazepam binding inhibitor and tolerance to ethanol in Drosophila
melanogaster
Committee:
Nigel Atkinson, Supervisor
Richard Aldrich
Christine Duvauchelle
John Mihic
Harold Zakon

Diazepam binding inhibitor and tolerance to ethanol in Drosophila
melanogaster
by
Roseanna Beth Robles, B.S.
Dissertation
Presented to the Faculty of the Graduate School of
The University of Texas at Austin
in Partial Fulfillment
of the Requirements
for the Degree of
Doctor of Philosophy
The University of Texas at Austin
December, 2012

Dedication
To my husband Josh.
v
Acknowledgements
The second chapter of this dissertation is a modified version of a paper that was
published in The Journal of Neuroscience Methods. It is reprinted here with permission
from the publisher, Elsevier. Thank you to the other authors: Harish Krishnan, Susan
Bergeson, and Nigel Atkinson, for their contributions to the publication.
Parts of this project depend on work done by students who previously worked in
the lab. Kapil Ramachandran was a high school student while he was a part of the
Atkinson lab, and he performed the RT-PCR experiments that are described in Chapter 4.
Josh Atkinson worked in the lab as an undergraduate, and he constructed the UAS-DBI
transgenic flies that are behaviorally tested in Chapter 5. Kevin Bieri and Tanzeen Yusuff
were undergraduates in the lab, and they perfected the knock down assay method for
measuring tolerance that is employed in Chapters 3-6. I am grateful to all of you.
Thank you to the Atkinson lab members, past and present, and to our advisor,
Nigel Atkinson. You made this a rewarding and enjoyable experience.

vi
Diazepam binding inhibitor and tolerance to ethanol in Drosophila
melanogaster
Roseanna Beth Robles, Ph.D.
The University of Texas at Austin, 2012
Supervisor: Nigel S. Atkinson
Tolerance to ethanol is an endophenotype of alcoholism, allowing the study of a
complex psychiatric condition using animal models. To identify new genes involved in
the acquisition of tolerance, I designed an automated and high-throughput tolerance assay
and screened a collection of deficiency mutants for the inability to develop tolerance. The
screen yielded several “regions of interest” where more than one overlapping deficiency
failed to develop tolerance. One of these regions comprised nine genes, and testing the
expression levels of each gene revealed that diazepam binding inhibitor (Dbi) showed
grossly increased expression in the deficiency mutant compared to wild type. Another
mutant stock, with a P-element transposon inserted downstream of the Dbi gene, both
failed to develop tolerance and showed further increased expression of Dbi. There are
two insulator binding sites flanking Dbi, and the P-element transposon also contains
insulator binding sites. Based on these results, it was hypothesized that an insulator
complex kept Dbi expression low in wild type flies and that disrupting the insulator
complex allowed aberrantly high expression of Dbi in the mutants. Furthermore, we
assumed that induction of Dbi blocked tolerance by making the mutants resistant prior to
the first sedation. A UAS-DBI transgene was constructed to over-express Dbi. Induction

vii
of the UAS-DBI with a heat shock gal4 driver induced resistance to ethanol sedation; a
similar response was observed in the parental control, but the effect was smaller.
Although driving UAS-DBI with the neural elav-gal4 driver did not block tolerance, the
experimental stock was resistant to ethanol sedation compared to the parental controls,
indicating that increased Dbi expression produced “pre-tolerance.” To confirm the theory
that insulator disruption was responsible for the increase in Dbi and the resulting no-
tolerance phenotype, the P-element in the second mutant was mobilized by introducing a
transposase source. These offspring lines were analyzed using qualitative PCR to
determine whether the transposon excised precisely, left a portion of the transposon
behind, or removed some of the flanking region. A precise excision mutant was
identified, but this mutation did not rescue tolerance as predicted. This result might
indicate that genetic background was the cause of the no-tolerance phenotype, or it might
indicate that the excision was not exactly precise and removed the native insulator
binding site, causing the insulator complex to remain disrupted.

viii
Table of Contents
Table of Contents ................................................................................................. viii
List of Tables ......................................................................................................... xi
List of Figures ....................................................................................................... xii
Chapter 1: Introduction ............................................................................................1
Alcoholism ......................................................................................................1
Benefits of Drosophila as a model system ......................................................2
Tolerance.........................................................................................................5
Prior work in flies ...........................................................................................7
Inebriometer ...........................................................................................7
Inebri-actometer ...................................................................................10
Loss of righting reflex ..........................................................................11
eRING assay ........................................................................................12
DIAS ....................................................................................................13
CAFE assay ..........................................................................................14
Alcoholism and memory ...............................................................................15
Alcoholism and the circadian system ...........................................................16
GABA receptors............................................................................................16
Ethanol and GABAA receptors ......................................................................18
DBI ..............................................................................................................19
Addiction and DBI ........................................................................................22
Invertebrate GABA receptors .......................................................................23
Chapter 2: Computer automated movement detection for the analysis of behavior26
Introduction ...................................................................................................26
Methods.........................................................................................................30
Fly Maintenance...................................................................................30
Image Acquisition ................................................................................30
Image Analysis Methods......................................................................31

ix
Sliding Window Method .............................................................33
Nested Window Method .............................................................34
Compare to First Method ............................................................35
Compare to First Staggered Method ...........................................37
Tell Me When They Move Method ............................................38
Quantification of White Pixels.............................................................39
Canton S / parats1
temperature experiment ..........................................40
Tolerance Climbing Assay ...................................................................41
Tolerance First Movement Assay ........................................................42
Mouse Novelty Assay ..........................................................................43
Results ...........................................................................................................44
Discussion .....................................................................................................56
Chapter 3: Tolerance screen...................................................................................60
Introduction ...................................................................................................60
Methods.........................................................................................................61
Recovery assay.....................................................................................61
Knock down assay ...............................................................................64
Results ...........................................................................................................68
Chapter 4: Moving from region to gene ................................................................77
Introduction ...................................................................................................77
Results ...........................................................................................................79
Discussion .....................................................................................................84
Insulator disruption in df-7589 ............................................................88
Insulator disruption in 13493 ...............................................................90
Induction of DBI might make flies pre-tolerant to ethanol ..................92
Chapter 5: Over-expression of DBI via the GAL4/UAS system ...........................93
Introduction ...................................................................................................93
Methods.........................................................................................................94
Heat shock induction of UAS-DBI ......................................................94

x
Tolerance assay with elav-gal4 induction of DBI................................96
Results ...........................................................................................................99
Heat shock induction of UAS-DBI ......................................................99
Tolerance assay with elav-gal4 induction of DBI..............................102
Discussion ...................................................................................................107
Chapter 6: Excising the P element .......................................................................108
Introduction: P-element transposons ...........................................................108
Excising the P element ................................................................................109
Characterizing the P-element excisions ......................................................115
Tolerance tests of P-element excision mutants ...........................................117
Chapter 7: General Methods ................................................................................120
Fly maintenance ..........................................................................................120
Fly collection for behavioral experiments ..................................................120
DNA collection (single fly prep) ................................................................121
Polymerase Chain Reaction protocol ..........................................................121
Chapter 8: Summary and conclusions..................................................................124
Appendix A: sliding_window.pl ..........................................................................127
Appendix B: nested_window.pl ...........................................................................132
Appendix C: compare2first_staggered.pl ............................................................138
Appendix D: tellmewhentheymove.pl .................................................................144
References ............................................................................................................153
Vita .....................................................................................................................164

xi
List of Tables
Table 2.1: Compare2first.pl accurately scores the position of a single mouse.. ....55

xii
List of Figures
Figure 1.1: FlyAtlas anatomical expression levels for Dbi in Drosophila. ............21
Figure 2.1: The sliding window method shows the movement of a single fly ......45
Figure 2.2: Changes in temperature affect the locomotor behavior of flies. .........47
Figure 2.3: Heat pulses elicit repeatable effects on the movement of flies. ..........48
Figure 2.4: Flies recover from a second dose of ethanol more quickly than from a first
dose. ..................................................................................................50
Figure 2.5: Wild type flies show rapid tolerance to ethanol in a climbing assay. .51
Figure 2.6: Sliding_window.pl can be used to detect tolerance to ethanol sedation in
individual flies within a 96-well microtiter dish. ..............................53
Figure 3.1: Schematic of the knock down assay. ...................................................65
Figure 3.2: The staggered start times of ethanol treatment were accounted for by
deleting the extraneous data from each column. ...............................67
Figure 3.3: Wild type flies become tolerant to ethanol in a recovery assay after a
single sedating dose 24 hours prior. ..................................................69
Figure 3.4: Wild type flies become tolerant to ethanol in a knock down assay after a
single sedating dose 24 hours prior. ..................................................70
Figure 3.5: Deficiency screen of the third chromosome. .......................................72
Figure 3.6: df-7589 sometimes develops tolerance and sometimes fails to develop
tolerance to ethanol in a recovery assay. ..........................................74
Figure 3.7: Three overlapping deficiencies fail to develop tolerance in a knock down
assay. .................................................................................................75
Figure 4.1: Map of the genes covered by df-7589 and their putative functions. ...78

xiii
Figure 4.2: Expression levels for the genes covered by df-7589, a comparison
between wild type and the mutant df-7589. ......................................80
Figure 4.3: DBI is overexpressed in the P-element mutant 13493. .......................82
Figure 4.4: The P-element mutant 13493 fails to develop tolerance to ethanol sedation
in a knock down assay. .....................................................................83
Figure 4.5: Dbi is flanked by su(Hw) insulator binding sites. ...............................86
Figure 4.6: Insulator pairs protect a gene from adjacent enhancers. .....................87
Figure 4.7: Model for insulator disruption in a deficiency mutant. .......................89
Figure 4.8: Model for insulator disruption in a P-element mutant. .......................91
Figure 5.1: Cantonized w1118
flies fail to acquire tolerance to ethanol in a knock down
assay. .................................................................................................98
Figure 5.2: Heat shock induces resistance in the offspring of UAS-DBI II 16 and a
heat shock gal4 driver. ....................................................................100
Figure 5.3: Heat shock induces a low level of resistance in the parental stocks. 101
Figure 5.4: Both the experimental cross (UAS-DBI II 16 crossed to elav-gal4) and the
parental stocks became tolerant to ethanol in a knock down assay.104
Figure 5.5: The offspring of the experimental cross (UAS-DBI II 16 crossed to elav-
gal4) were resistant to ethanol sedation relative to the parental controls.
.........................................................................................................105
Figure 5.6: The offspring of the experimental cross were resistant to ethanol sedation
relative to the parental controls, according to the KD-50 values for the
sedation curves ................................................................................106
Figure 6.1: Cross to excise the P element. ...........................................................111
Figure 6.2: Map of primers for qualitative PCR. .................................................116

xiv
Figure 6.3: The precise excision mutant 70a1 does not become tolerant to ethanol
sedation in a knock down assay. .....................................................118

1
Chapter 1: Introduction
ALCOHOLISM
Alcoholism is a complex disease. It depends on an interplay of genetic and
environmental factors, and the transition from casual use to abuse remains poorly
understood. Although usage is widespread across various cultures, a small part of the
population of alcohol users will progressively escalate their usage and enter a state of
abuse or dependence. For example, although the World Health Organization estimates
that approximately 65% of Americans will drink alcohol at some point over the course of
a year, only 3.7% will go on to develop an alcohol use disorder (WHO, 2011). Alcohol
abuse and dependence are marked by uncontrolled consumption patterns that are
hazardous to the user’s health and impair his/her ability to meet work and social
obligations, according to the DSM–IV–TR (2000). Estimates of the monetary costs
associated with alcohol abuse vary, but range in the billions for the United States. These
costs include hospital bills incurred by accidents (for both alcoholics and their victims),
chronic health issues caused by drinking, lost productivity at work, and property damage
(Navarro et al., 2011). And beyond the financial burden, alcoholism can create a level of
emotional devastation in the lives of alcoholics and their loved ones that is impossible to
quantify.
Alcoholism is also notoriously difficult to treat. There are high rates of relapse
across all types of treatments, despite numerous advances in cognitive-behavioral therapy

2
and pharmacotherapy. It is difficult to quantify the success rate of treatment because the
treatments, the initial characteristics of the patient population, and the definition of what
constitutes relapse can vary. However, during the first year following a single episode of
treatment, only 25% of individuals will abstain from alcohol completely, and two-thirds
will continue to have some periods of heavy drinking (Miller et al., 2001). Because of
these therapeutic limitations, there is a continual push to dissect the molecular
underpinnings of why some people become alcoholics and how to treat (and hopefully
reverse) the neural changes that underlie uncontrolled alcohol abuse.
BENEFITS OF DROSOPHILA AS A MODEL SYSTEM
In the effort to tease out the neuroadaptive changes associated with alcoholism,
many animal models have been developed. One of these is the fruitfly Drosophila
melanogaster. Although there are large morphological differences between humans and
Drosophila, there are also many similarities at the molecular and genetic levels. Despite
having a much smaller genome (with approximately 13,000 genes to a human’s 25,000),
there is a surprising degree of gene homology (Adams et al., 2000; IHGSC, 2004). Out of
929 human disease gene entries associated with at least one mutant allele in the Online
Mendelian Inheritance in Man database, 714 distinct human disease genes (77% of
disease genes searched) could be matched to 548 unique Drosophila sequences (Reiter et
al., 2001). There is also a wealth of genetic markers that can be visually scored and used
to track other, less visible alleles or mutations. The similarities between Drosophila and

3
humans, combined with their ease of use and powerful genetic tools, have made
Drosophila workhorses of genetic research. Experiments that would take years in mice
can be performed in months in fruit flies, and the unique genetic tools in Drosophila offer
the potential to perform studies that are not yet possible in mammals. Furthermore,
Drosophila exhibit many of the same behaviors as humans: they court, fight, sleep, learn,
and become intoxicated when exposed to ethanol (Hendricks et al., 2000; Quinn et al.,
1974; Moore et al., 1998; Quinn and Greenspan, 1984; Chen et al., 2002).
The molecular conservation between fruit flies and humans has allowed
discoveries made with Drosophila to pave the way for new insights into mammalian
biology. The Hirsh laboratory showed that repeated cocaine exposure induced behavioral
sensitization to some of the effects of cocaine in flies, as has also been observed in
mammals (McClung and Hirsh, 1998; Shuster et al., 1977). Furthermore, this group
demonstrated that mutations in circadian rhythm genes (period, clock) blocked this effect
(Andretic et al., 1999). This observation in flies led to the demonstration that circadian
genes play a central role in mammalian cocaine responses (Abarca et al., 2002; McClung
et al., 2005). This is just one example of work in an invertebrate model system offering
evidence that transferred to mammalian systems. Another example of the translatability
between the Drosophila model system and mammalian systems is the Lmo gene. This
gene was identified in an unbiased screen for an altered cocaine response, then expanded
to identify an ethanol phenotype (Tsai et al., 2004; Lasek et al., 2011). After taking
advantage of the speed and ease of the Drosophila system to verify Lmo’s importance to

4
ethanol responses, an RNAi mutant was designed to further test its applicability to
mammalian ethanol responses. In both model systems, a reduction in the activity of Lmo
produced increased sensitivity to ethanol sedation (Lasek et al., 2011).
Drosophila also encounter alcohol in their native environment because it is a
byproduct of the fermentation of rotting fruit, and they exhibit a preference for it because
of its nutritional value (Pohl et al., 2012; Ogueta et al., 2010). Housing flies in an ethanol
containing medium can increase their preference for ethanol-infused food, whereas
housing them in a mixture of ethanol and an ADH inhibitor decreased their ethanol
preference (Cadieu et al., 1999). This finding parallels studies of humans with ADH
polymorphisms (Ehlers et al., 2001). Consumption of ethanol can also protect flies from
certain parasites (which, unlike flies, have not evolved to withstand the toxic metabolites
of ethanol), and fly larvae that are infected with these parasites have been observed to
increase their consumption in an apparent effort to “self-medicate” (Milan et al., 2012).
Because of this innate preference for ethanol as a food source, the argument for studying
Drosophila as a model system for the effects of ethanol is even stronger than that for
many common mammalian model systems, such as mice and rats. Unlike humans,
rodents do not consume ethanol in their natural environment, and voluntary ethanol
consumption behavior only appears in certain inbred strains or as a consequence of
selective breeding (Li et al., 1979).

5
Flies also show a biphasic response to ethanol intoxication that parallels the
response of humans. Initially upon ethanol exposure, flies become hyperactive and
uncoordinated. At higher doses, this hyperactivity transitions into sedation, and they will
cease moving until a period of time after the ethanol source is removed. At low doses of
ethanol, flies may only exhibit the hyperactive phase of ethanol intoxication. This
biphasic response in humans might be particularly relevant to vulnerability to alcoholism,
with heavy drinkers (relative to light drinkers) exhibiting a heightened response to the
stimulant-like effects of ethanol and a blunted response to the sedative effects (King et
al., 2002).
TOLERANCE
The complexities of alcohol abuse and dependence have been difficult to model in
animals, mostly due to an intractable inability to measure an animal’s psychological state.
Because of this difficulty, researchers have studied various endophenotypes of addiction
as proxies for the process of addiction itself. Commonly considered in psychiatry, an
endophenotype is a biological marker that is associated with susceptibility to an illness
and has a clear genetic component (Gottesman and Gould, 2003). Both ethanol sensitivity
(the response to the initial exposure to ethanol) and ethanol tolerance have been studied
in animal models as endophenotypes of addiction. Tolerance is a reduced effect of a drug
caused by prior drug exposure. It is important to note that tolerance to one effect of a
drug can be manipulated independently from tolerance to the other effects (Le et al.,

6
1989). Similarly, the acquisition of tolerance can create a narrowing of the therapeutic
index; the dose needed to produce the desired therapeutic effect is elevated, but the dose
that produces an unwanted and dangerous side effect remains the same. An individual can
also become tolerant to the sedative effects of alcohol but not to the euphoric effects,
leading them to increase their drinking on two fronts (lack of sedation prolongs the time
available to drink, continued euphoria also promotes drinking). Furthermore, these same
individuals might remain sensitive (i.e., not develop tolerance) to the neural effects of
alcohol that progressively trigger addiction as their consumption escalates. The link
between alcohol response and alcohol dependence has been well established in humans.
For example, Schuckit found that a low level of response to ethanol corresponded with a
family history of alcoholism and predicted the future risk of developing alcoholism
(Schuckit, 1998).
Metabolic tolerance refers to changes in the organism that allow it to process
alcohol faster. The result is that a second dose is cleared from the body more rapidly,
reducing the exposure time and the exposure level of the cells and tissues, relative to the
first dose. Another advantage to the use of Drosophila as a model system for the effects
of ethanol is that adult flies do not develop metabolic tolerance, allowing functional
tolerance to be studied in isolation. This lack of metabolic tolerance is particularly
notable because fruit flies share with humans a common molecular pathway for breaking
down ethanol—the alcohol dehydrogenase pathway—and genetic variations in this
pathway can both influence sensitivity (the dose of ethanol required to produce a

7
response) and avoidance behavior (Gelfand and McDonald, 1980). However,
importantly, exposure to ethanol does not elicit changes in the metabolism of ethanol and
neither induces the expression of nor increases the activity of alcohol dehydrogenase in
adult flies (Geer et al., 1988). Functional tolerance describes cellular changes that reduce
the responsiveness of a cell to a given amount of alcohol. Included in functional tolerance
are the cellular adaptations that occur in the brain in response to ethanol exposure, and so
this type of tolerance is more pertinent to neurobiological research.
PRIOR WORK IN FLIES
A number of different techniques have been employed to assess ethanol
intoxication in flies. Because ethanol research using Drosophila as a model system is a
new field (relative to other model systems, such as rodents), many labs have developed
their own approaches to the problem rather than duplicate field standards.
Inebriometer
One of the oldest and most widespread devices for measuring ethanol intoxication
in flies is the inebriometer (Weber, 1988). This device consists of a long vertical tube
with a series of slanted mesh baffles; flies are inserted into the top of the tube and are
able to remain near the top by clinging to these baffles. Flies are negatively geotactic—
they will attempt to climb upward and have a tendency to remain near the top of an
enclosed space. However, if ethanol vapor is also introduced into the tube, the flies will
gradually become intoxicated, which will cause them to lose postural control and be

8
unable to cling to the baffles. This will ultimately cause them to fall out the bottom of the
apparatus, where they can be collected. The time it takes the animals to pass through the
column is called the mean elution time, and this value is a measure of the ethanol
sensitivity of that population of flies. The inebriometer measures the length of ethanol
exposure (which is analogous to the dose because the flies continually breathe in more
ethanol vapor throughout their exposure) required to produce incoordination. It is well
suited to a mutant screen because the collection of data can proceed in an automated
fashion. However, it is limited because either the sedative phase of late ethanol
intoxication or the hyperactive early phase can produce the incoordination that causes the
flies to lose their grip on the mesh baffles, and the mean elution time does not distinguish
between these two circumstances.
The inebriometer has been frequently employed to screen collections of mutant
flies. One of the strengths of Drosophila as a model system lies in its powerful genetic
tools. These tools allow for unbiased surveys of the genetic expression changes
associated with the effects of ethanol. Mutagens such as EMS have been used to induce
random point mutations in flies, and each mutant can be screened for behavioral
abnormalities with regard to the ethanol response. An EMS mutagenesis screen was used
to identify the novel ethanol response genes barfly and tipsy (which were less and more
sensitive to ethanol sedation in the inebriometer, respectively) (Singh and Heberlein,
2000). However, these genes remain uncharacterized and unannoted, leaving doubt as to
their veracity as genes. In addition, unbiased screens of P-element insertion mutants

9
(which are generated by mobilizing a non-autonomous transposon with a transposase
source) have been employed to identify ethanol response genes such as arouser (which is
involved in activation by Egfr/Erk signaling and its inhibition by PI3K/Akt signaling),
hangover (which encodes a large nuclear zinc-finger protein and has also been implicated
in the stress response), and the memory mutant amnesiac (which is involved in activation
of the cAMP pathway) (Eddison et al., 2011; Scholz et al., 2005; Moore et al., 1998). P-
element mutagenesis offers the significant advantage that once a mutant with the desired
phenotype has been identified, the P element itself can serve as a tag to identify the
location of insertion and the affected gene.
The inebriometer has also been employed for candidate gene approaches. A
collection of 52 learning and memory mutants and 1 control were assayed in the
inebriometer for ethanol sensitivity: 11 of the mutants showed significant alterations in
ethanol sensitivity, 8 mutants exhibited reduced rapid tolerance, and 9 mutants displayed
aberrant chronic tolerance (Berger et al., 2008). Flies mutant for the fasII gene were
shown to be sensitive to the effects of ethanol using the inebriometer (Cheng et al., 2001).
Another candidate gene approach using the inebriometer examined the functional brain
regions necessary for tolerance by examining a group of mutant with structural brain
abnormalities (Scholz et al., 2000). Three of these mutants (cex1, ccb
2, and vap
1) showed
reduced tolerance, but their results did not implicate a specific brain region as being the
locus of tolerance because each mutant affected several (and often overlapping) brain
regions and the results were conflicting. Rather, the results suggest that a circuit that

10
spans several brain regions might be involved (Scholz et al., 2000). In addition, the
inebriometer was used to show that TβH mutants, which lack octopamine (the presumed
Drosophila analog for norepinephrine), developed tolerance at a reduced level (Scholz et
al., 2000). Similarly, Drosophila mutants for inactive, which are characterized by reduced
levels of both tyramine and octopamine, show decreased sensitivity to ethanol sedation
(Scholz, 2005). In another study, inhibition of PKA in insulin producing cells increased
the sensitivity of flies to ethanol sedation (Corl et al., 2005).
Inebri-actometer
An additional method that has been developed for measuring ethanol intoxication
in flies is the inebri-actometer (Parr et al., 2001). The inebri-actometer consists of a grid
of 128 narrow chambers connected to a computer. Each chamber is large enough for a
single fly and is equipped with a photodiode emitter/detector. When the fly moves across
the midpoint of the tube, it blocks the infrared signal being emitted by the photodiode
emitter, and this event is scored by the computer as a movement. When ethanol vapor is
pumped into the chambers, the flies show an increase in locomotor activity that peaks
after 5 minutes, followed by a gradual decrease in activity until there is a complete
cessation of movement after 30 minutes (Parr et al., 2001). Beyond the original paper
describing the method, no other work has been published using the inebri-actometer.

11
Loss of righting reflex
Another method that has been employed to measure ethanol intoxication in flies
has been to expose the flies to ethanol vapor while in vertical tubes and watch the flies to
visually score the number of sedated flies at regular intervals. Although this method does
not have a formal label, it is similar to the loss of righting reflex assay used with
mammals and is sometimes referred to as such (Rothenfluh et al., 2006).
A wide variety of genes have been implicated in ethanol intoxication using this
method. The BK channel slowpoke has been shown to be necessary for the acquisition of
rapid tolerance to ethanol sedation (Cowmeadow et al., 2005), and induction of slowpoke
has been shown to phenocopy tolerance in the absence of prior ethanol sedation
(Cowmeadow et al., 2006). Although Godenschwege et al. (2004) describe their method
of assaying ethanol tolerance as an adapted inebriometer, the procedure they describe
consists of visually observing flies in vertical tubes as they become sedated and lose their
postural control; they demonstrate that flies that are mutant for the synapsin gene
(involved in the fine-tuning of vesicle release) develop an enhanced level of ethanol
tolerance (Godenschwege et al., 2004). Similarly, mutations in the shibire and syntaxin
genes, also involved in neurotransmitter exocytosis, blocked tolerance (Krishnan et al.,
2012). The homer gene was identified in a microarray analysis as decreasing in
expression in response to both rapid and chronic ethanol treatment; mutants in this gene
were subsequently shown to be more sensitive to the sedative effects of ethanol and less
able to develop tolerance (Urizar et al., 2007). Mutations in the gene encoding
RhoGAP18B produced flies that were less sensitive to the effects of ethanol (Rothenfluh

12
et al., 2006). The NPF circuit (the invertebrate homolog to the NPY circuit in mammals)
was shown to be important for ethanol sedation because disrupting either the gene
encoding the neuropeptide or that of its receptor decreased the sensitivity of flies to
ethanol sedation (Wen et al., 2005). NPY has also been implicated in the action of
ethanol in mammals (Thiele et al., 1998). In flies, this line of investigation was extended
to also implicate PKC in the NPF pathway (Chen et al., 2008, 2010).
eRING assay
Similar to visually scoring the sedation level of the flies, eRING (ethanol Rapid
Iterative Negative Geotaxis) was established as an assay for measuring ethanol
intoxication (Bhandari et al., 2009). As described previously, flies exhibit a tendency to
climb upward, and this can be observed most readily as a startle response after tapping
the container against the table so that the flies all fall to the bottom of the container. The
flies were placed in clear vertical tubes and a plug soaked with an ethanol water mixture
was placed at the top of the tube, allowing passive diffusion of ethanol vapor. The flies
were sharply rapped to the bottom of the tube and then a digital camera was used to take
a picture 4 seconds later. The activity of the flies was determined by examining the
picture and measuring the total distance traveled by the flies during the interval; the assay
was repeated at regular intervals during the ethanol exposure to detect the sedation of the
flies. Using this method, the β integrin gene myospheroid and the α integrin gene scab
were shown to increase ethanol sensitivity and enhance the development of rapid

13
tolerance to ethanol (Bhandari et al., 2009). Recently, this method was employed to
describe the importance of chloride intracellular channels (CLICs), which were first
identified through bioinformatic analysis of mammalian data and verified by the
observation that cortical expression increased in mice following ethanol treatment.
Drosophila (and the eRING assay) was able to further support the conclusions because
Drosophila only have a single Clic gene and it was possible to partially disrupt the
function of the gene while avoiding lethality (Bhandari et al., 2012)
DIAS
A program called Dynamic Image Analysis System (DIAS) was adapted for
analyzing the locomotor activity of flies during ethanol intoxication. The flies are
exposed to ethanol vapor while free to move around a clear, shallow box, and a video
camera is used to record the movement of the flies. DIAS is used to calculate the position
of the flies throughout the trial and determines various aspects of their movement: bouts
of activity (both the number of bouts and the length of each bout), turning behavior, and
velocity (Wolf et al., 2002). This method arose from simpler assays in which the activity
of flies was monitored by videotape as they walked within a chamber across grids of
orthogonal lines; motion was quantified by the number of lines crossed per minute
(Bainton et al., 2000; Singh and Heberlein, 2000). One of the benefits of this method is
that it can measure both the hyperactivity phase of ethanol intoxication and the sedation
phase. However, it is less well suited to screening large collections of mutants and is

14
usually employed as a finer level of analysis once a screen has identified mutants of
interest. In most cases, it has been used to characterize mutants that were identified by
other means. For example, Kong et al. (2010) used microarray to compare expression
levels of many genes following ethanol sedation and identified several groups of genes
affecting sedation, then DIAS was used to assay tolerance in some of the genes identified.
This data was contrasted with results from two other similar microarray assays (Urizar et
al., 2007; Morozova et al., 2006), and there was a core group of 29 genes that were
common to all three data sets (Kong et al., 2010).
CAFE assay
An assay has been developed that consists of capillary tubes that have been filled
with liquid food that may or may not contain ethanol (Ja et al., 2007). This assay is
analogous to the two bottle choice assay in mammals and has been named the CAFE
(CApillary FEeder) assay. As the flies feed on the food contained in the tube, the
meniscus descends and its changing location can be observed over time. Flies showed a
strong preference for ethanol when given a choice between plain food and food
containing 15% ethanol. The transition from ethanol vapor to consumption of ethanol-
laced food is an important step in the utility of Drosophila as an ethanol model system.
This ethanol preference has been shown to be dependent on the adenyl cyclase (and
memory mutant) gene rutabaga (Xu et al., 2012). Using this assay, flies have been shown
to prefer ethanol-containing food over non-ethanol-containing food, and this effect

15
increased over time as the flies consumed more ethanol (Devineni and Heberlein, 2009).
However, ethanol provides a substantial source of calories. Although limiting the effect
of the ethanol calories by keeping the ethanol concentration fixed and varying the
concentration of the food (non-ethanol calories) indicated that the caloric value of ethanol
was not a factor, more strict calorie balancing eliminated the preference for ethanol,
implying that the ethanol preference observed was dependent on the (substantial) calories
of ethanol and not a craving-like effect induced by intoxication (Devineni and Heberlein,
2009; Pohl et al., 2012). Although this method remains promising, more work (and
careful controls) will be needed to use the assay to model ethanol preference in flies.
ALCOHOLISM AND MEMORY
Drosophila have been used to demonstrate the overlap between genes involved in
learning and memory and the genes involved in the action of ethanol; these data support
the model of addiction as an aberrant learning process in which the drug is assigned a
level of salience and incentive that is out of sync with the havoc it is wreaking in the life
of the addicted individual (Robinson and Berridge, 2001). The memory mutant amnesiac
was shown to forget more quickly relative to wild type, despite a normal ability to learn
(Quinn et al., 1979). Amnesiac encodes a neuropeptide that activates the cAMP pathway
(Feany and Quinn, 1995). An allele of this same gene was later identified in an ethanol
screen as being associated with a greater sensitivity to the effects of ethanol (Moore et al.,
1998). Out of a selection of candidate genes involved in learning and memory, a

16
disproportionately large portion showed ethanol phenotypes, either changes in sensitivity
or changes in rapid or chronic tolerance (Berger et al., 2008).
ALCOHOLISM AND THE CIRCADIAN SYSTEM
The link between the circadian system and ethanol response has been explored in
animal models and parallels what we know about alcoholism and sleep in humans.
Alcoholics, and particularly recovering alcoholics, frequently suffer from sleep
disturbances during periods of abstinence, and problems sleeping can contribute to
relapse. In fact, sleep disturbances in sober alcoholics are considered to be a major risk
factor for relapse (Brower, 2003).
GABA RECEPTORS
GABAA receptors are ionotropic Cl- channels and members of the Cys-loop
superfamily of receptors, which include nicotinic acetylcholine receptors, glycine
receptors, and 5-HT3 receptors. All of these Cys-loop receptors are arranged as subunit
pentamers around a central pore and often occur as heteromultimers. For human GABAA
channels, there are currently 19 known subunit variants: α1-6, β1-3, γ1-3, δ, ε, θ, π, ρ1-3
(Paul et al., 2012). The most common configuration observed in the CNS consists of two
α subunits, two β subunits, and one γ subunit (Paul et al., 2012). GABA binds to an
extracellular ligand binding domain between the α and β subunits, with two such
interfaces per channel.

17
When the ligand GABA binds to the GABAA receptor, the channel opens and Cl-
conductance is increased. Although the extracellular and intracellular ion concentrations
can vary per tissue and throughout development, the equilibrium potential of chloride is
usually close to or slightly more negative than the resting potential. As a result, opening
the GABAA channels causes Cl- ions to flow into the cell, and the neuron becomes less
likely to fire an action potential. In mammals, GABAA receptors serve to mediate fast
inhibitory transmission throughout the brain (Follesa et al., 2006).
One of the more notable characteristics of GABAA receptors is the fact that many
allosteric agents can modulate receptor function. These agents include ethanol,
barbituates, picrotoxin, inhaled anesthetics, neuroactive steroids, and benzodiazepines
(Johnston, 1996). Of these agents, benzodiazepines have been thoroughly studied because
of their therapeutic utility as anxiolytics. Whereas GABA binds at the interfaces between
α and β subunits, benzodiazepines bind at the interface between α and γ subunits in
mammals (Paul et al., 2012), and only in the subset of channels that contain α1, α2, α3,
and α5 subunits (Möhler, 2006).
Benzodiazepines were discovered in the 1950s and exert their effects (among
which are anxiolytic, sedative, hypnotic, anticonvulsant, muscle relaxant, and amnesic)
via their allosteric activation of the GABAA channel. Because of their wide therapeutic
index, they have largely replaced barbiturates and have become one of the most

18
commonly prescribed classes of drugs. When used alone (in other words, not in
combination with other drugs that act on the GABAA receptor), their risk of toxicity is
extremely low.
The binding of benzodiazepines at their receptor serve to increase the response of
the GABAA channel to GABA. Traditionally, this has been thought to be the result of
increasing the affinity of GABA for its binding site. However, it has recently been
suggested that the action of benzodiazepines is the result of increasing the preactivation
state of the receptor following the binding of GABA (Gielen et al., 2012). For some
members of the Cys-loop family of receptors, channel activation involves several stages:
a ligand-bound resting state, a ligand-bound preactivation state, and channel opening.
Shifting the equilibrium from the resting state to the preactivation state effectively
increases the efficacy of the ligand (Gielen et al., 2012).
ETHANOL AND GABAA RECEPTORS
The interaction between GABAA receptors and ethanol is much less understood
than that of GABAA receptors and benzodiazepines. Ethanol appears to have many
different effects on the GABAA channel, and this channel is just one of many targets of
ethanol. It is likely that GABAA receptors mediate the sedative and incoordinating effects
of ethanol at low concentrations and the anesthetic effects of ethanol at higher
concentrations (Johnston, 1996).

19
DBI
Diazepam binding inhibitor (DBI) was first identified in the rat in 1978 (Guidotti
et al., 1978) and later purified from human and bovine brain (Shoyab et al., 1986). It is an
endogenous ligand of approximately 10,000 Da and acts as an inverse agonist at the
benzodiazepine binding site of the GABAA receptor. In other words, DBI is a negative
allosteric modulator of GABAA receptors, diminishing the action of GABA at the
GABAA receptor (Bormann, 1991). In a preparation of cultured mammalian neurons, it
was shown to reduce the effect of GABA at the GABAA channel by acting at the
benzodiazepine receptor (its effect was blocked by the benzodiazepine antagonist Ro 15-
1788) (Bormann, 1991). It has been associated with proconflict behavior in rats (see
Vogel test below) (Guidotti et al., 1983).
In a conflict assay that pairs an appetitive stimulus with an aversive stimulus
called the Vogel test, benzodiazepines reduce the shock-induced suppression of drinking
(indicating their anxiolytic action), and diazepam binding inhibitor both blocked the
effect of benzodiazepines and independently facilitated the suppression of drinking when
the shock stimulus was reduced (Guidotti et al., 1983). Briefly, in this test, water-
deprived rats will voluntarily and continually drink water from a stainless steel drinking
tube, but the application of an electrical shock while they are drinking will suppress their
drinking behavior (Vogel et al., 1971).

20
DBI was cloned and sequenced in Drosophila, showing 50 to 54% identity to the
mammalian proteins. Northern analysis revealed expression from the larval stage through
the adult stage, although no expression was observed in the adult nervous system
(Kolmer et al., 1994). However, a more recent examination of expression has indicated
high levels of expression in the adult head and brain (Figure 1.1) (Chintapalli et al.,
2007).

21
Figure 1.1: FlyAtlas anatomical expression levels for Dbi in Drosophila.
Diazepam binding inhibitor is expressed across a wide variety of tissues in the adult, and
expression is very high in the head and moderately high in the brain. From
http://flybase.org/reports/FBgn0010387.html (Chintapalli et al., 2007).

22
ADDICTION AND DBI
Ethanol treatment of cultured neurons induced expression of DBI (Katsura et al.,
1995a). Similarly, chronically treating mice by inhalation of ethanol vapor increased the
mRNA levels of DBI in the brain, and withdrawal from the ethanol vapor elicited further
induction of DBI (Katsura et al., 1995b). This effect was mediated through the GABAA
receptor because concomitant treatment with either flunitrazepam, Ro15-1788, or Ro15-
4513 (a benzodiazepine receptor agonist, antagonist, and inverse agonist, respectively)
blocked this ethanol-induced induction (Katsura et al., 1998b).
There is evidence that DBI is also involved in the process of addiction because
other addictive agents also increase DBI expression. Continuous treatment of mice with
nicotine increased both DBI and DBI mRNA in the brain; this effect was abolished when
the nAChR antagonist mecamylamine was co-administered (Katsura et al., 1998c).
Furthermore, withdrawal from nicotine induced even higher levels of DBI expression
(Katsura et al., 2001). Similarly, chronic morphine treatment induced DBI expression in
mice, and morphine withdrawal further increased DBI expression, although a single
administration of morphine did not induce DBI. Simultaneous administration of
naloxone, a morphine antagonist, abolished the DBI induction (Katsura et al., 1998a).
This effect is specifically mediated by the μ-opiod receptor because the effect of
morphine was mimicked by DAMGO (a μ agonist) and abolished by β-funaltrexamine (a
μ antagonist) but was unaffected by κ- and δ-antagonists (Shibasaki et al., 2007). For all

23
three of the drugs tested (ethanol, nicotine, and morphine), chronic administration was
also associated with an upregulation of L-type high voltage-gated Ca2+
channels (Mohri
et al., 2003; Katsura and Ohkuma, 2005; Shibasaki et al., 2006). In addition, treatment
with benzodiazepines also upregulated these channels (Katsura et al., 2007).
Functionally, it is possible that DBI mediates a stress response during withdrawal
from addictive drugs, and the induction of DBI following chronic administration of a
drug increases the potential for relapse. In mice, psychological stress, but not physical
stress produced increases in the levels of DBI mRNA (Katsura et al., 2002). However,
when CSF levels of both DBI and CRF were assayed in human alcoholics, there were no
differences observed between the two groups (Roy et al., 1990). This result might
indicate that DBI is not involved in the stress of alcohol withdrawal, or it might be
explained by the fact that the method of collecting CSF (lumbar puncture) is in itself a
stressful event and served to occlude the results.
INVERTEBRATE GABA RECEPTORS
Much less is known about GABA receptors in invertebrates. The main inhibitory
channel is composed of rdl (resistance to dieldrin) subunits, which was identified based
on a mutation that conferred resistance to the insecticide dieldrin (Hitchen and Wood,
1975). When this gene was identified in Drosophila, the mutation conferring insecticide
resistance was localized to a single amino acid substitution (Ala302 → serine or glycine)

24
within the second membrane spanning region of the channel (Ffrench-Constant et al.,
1993). Homozygous rearrangements that disrupt this gene result in lethality (indicating its
importance), but the introduction of a cosmid minigene rdl rescued the lethal phenotype
(Stilwell et al., 1995).
Invertebrate GABA receptors show similarities to mammalian channels but also
some key differences. Mechanically isolated neuronal cells were collected from two
species of locusts (Locusta migratoria and Schistocerca gregaria) and subjected to both
current and voltage clamp (Lees et al., 1987). The neurons were sensitive to both GABA
and muscimol (inducing hyperpolarization with a reversal potential of -65 mV) but were
insensitive to baclofen. In a small subset of the cells (<10% of the Locusta neurons),
there was both a fast and a slow response; the GABAA antagonists bicuculline and
pitrazepin has no effect on the fast response, but picrotoxin was able to block both. The
benzodiazepine flunitrazepam enhanced the magnitude of the fast response but did not
affect its duration; the barbiturate sodium pentobarbital enhanced both the magnitude and
duration of the fast response (Lees et al., 1987). In addition, Ro5-4864 and diazepam
were shown to potentiate the GABA responses of a cockroach (Periplaneta amicana)
motor neuron, although clonazepam was ineffective (Buckingham et al., 2009). These
results indicate the presence of a benzodiazepine binding site on insect GABA channels,
although crucial distinctions persist.

25
RDL subunits will assemble into homo-oligomeric channels when expressed in
Xenopus oocytes (Shirai et al., 1995; Hosie and Sattelle, 1996). These channels were not
sensitive to bicuculline, but did respond to some allosteric modulators (a property that is
normally associated with vertebrate GABAA channels). Barbiturates enhanced the current
induced by GABA, although they did not induce currents in the absence of GABA (Hosie
and Sattelle, 1996). Attempts to coexpress RDL subunits with GRD or LCCH3 (two
other ligand-gated ion channels subunits) have not yielded functional channels, although
GRD and LCCH3 will coexpress with one another to produce a GABA-gated cation
channel (Gisselmann et al., 2004).
The pharmacological responses of homomeric RDL channels expressed in
Xenopus oocytes do not match up precisely to native insect GABA channels, suggesting
that RDL might coexpress another subunit that has not yet been identified (Knipple and
Soderlund, 2010). Another possibility is that splicing and RNA editing of rdl create a
variety of subunits that form heteromultimer channels out of a single gene, compensating
for the rich diversity observed in human GABA channel subunits. Post transcriptional
changes have been shown to affect the potency of GABA on RDL channels (Jones et al.,
2009).

26
Chapter 2: Computer automated movement detection for the analysis of
behavior
INTRODUCTION
Behavioral phenotypes are thought to be an emergent property of the nervous
system. The measurement of animal behavior offers us a glimpse into the neural activity
of the animal without the invasive drawbacks of inserting electrodes into the brain. We
can observe movement to determine circadian rhythms, exploratory behavior (and the
associated lack of anxiety), ability and/or motivation to learn a link between two cues,
ability to navigate a maze, and changes in locomotor behavior resulting from
pharmacological manipulations. Although human observation can quantify such
behavior, it is time consuming, labor intensive, and carries the risk of experimenter bias.
To this end, using computers to automate the collection and interpretation of data can be
useful.
Our interest in movement analysis stems from our study of ethanol sedation in the
fruit fly Drosophila melanogaster as a model for human ethanol intoxication. Initially
upon exposure to ethanol vapor, flies exhibit a hyperactive phase, followed by in-
coordination and sedation (Moore et al., 1998). Lower doses of ethanol can elicit the
hyperactive response without consequent sedation. Withdrawing the source of ethanol
vapor allows the flies to gradually recover. This biphasic response (hyperactivity then
sedation) seems to parallel humans, who show a loss of inhibition at low doses of ethanol

27
that is overshadowed later by depressive effects. Flies can also develop rapid tolerance to
ethanol sedation; with prior exposure 24 hours earlier, a group of flies will recover from a
sedating dose of ethanol faster than their naïve counterparts (Cowmeadow et al., 2005).
Though past work using Drosophila as a model system for ethanol intoxication
has yielded many tolerance and sensitivity mutants, the methods used have limitations.
The inebriometer has been used most commonly in the past and is the best suited to
screening large numbers of mutations. However, it can only measure the knockdown
phase of intoxication (Leibovitch et al., 1995; Moore et al., 1998; Singh and Heberlein,
2000; Berger et al., 2004). As has been demonstrated with other assays, flies become
hyperactive when exposed to ethanol before becoming sedated (Moore et al., 1998). The
inebriometer is unable to separate the two effects; a fly may fall through the apparatus
because it has lost consciousness or it may fall because its hyperactivity leaves it unable
to grip the baffles. Hyperactivity and sedation phases likely represent an important
distinction in the human ethanol response. The inebri-actometer (Parr et al., 2001) solves
this problem but introduces another. Because there are multiple tubes feeding into the
apparatus, extreme care must be exercised to ensure that each tube is conducting the same
flow rate of ethanol vapor. In its first published study, one of the trial runs showed a
significant row effect (Parr et al., 2001). Direct visual observation of the negative
geotactic response and postural control has been used by multiple labs, including ours
(Berger et al., 2004; Ghezzi et al., 2004; Wen et al., 2005; Cowmeadow et al., 2005).
While this is certainly a thorough way to quantify sedation, it is also labor-intensive and

28
therefore not well suited to the large volume of measurements inherent in a genetic
screen. Thus, one of the greatest strength of Drosophila as a model system, the ability to
perform high-throughput genetic screens, can be difficult to utilize in the study of ethanol
responses because the assays are time-consuming and require individual attention. A
natural solution to this problem is computer monitoring of behavior. To be effective, the
approach should be inexpensive and scalable.
We have created a system that could be adapted to large screens and that has the
longevity to be used by other labs in the future. For most responses to alcohol (e.g.,
sedation, tolerance, and hyperactivity), a computer need only to detect whether
movement has occurred or the relative amount of movement among a population in order
to be useful. Other activity monitoring programs have been described in the literature.
The image analysis program DIAS has been used to document complex responses to
alcohol but unfortunately, it is not readily scalable (Wolf et al., 2002). Although
developed independently, the proposed method is similar to older methods in that all use
the digital subtraction of images to determine when the animal moves (Hasegawa et al.,
1988; Hoy et al., 1996; Cole and Cheshire, 1996). Some of these previous methods might
have been able to meet our needs. Unfortunately, these previous programs are no longer
available and all use proprietary software and/or hardware that no longer exists. The
methods that we describe depend only on open source software tools and can be run
interchangeably on different hardware platforms (we have used Mac OSX, Windows XP
and Linux, although the data in this chapter were all analyzed with a computer running

29
Linux). Open source tools tend to have greater permanence than closed source tools
because they are maintained by communities and can be modified by the end user. The
proposed method is also not limited to a single camera system or computer platform. It is
readily available to the public, and can be modified by future users, provided that they
have a general understanding of the scripting language Perl.
In the proposed method, a camera records images of a group of flies at a regular
interval and the images are analyzed to provide an estimate of the population movement
at any given moment. The collection and analysis of data can proceed in an automated
fashion. Unlike visual observation, a much larger population of flies can be tested with a
relatively small investment of time and effort. The technique offers the ability to measure
various aspects of ethanol intoxication, such as the hyperactivity phase, the knockdown to
sedation, and the recovery from sedation. It can be implemented in a lab with relatively
low start up costs; the software is free and the only required equipment is a standard
computer and any camera capable of interfacing with that computer. The number of
groups of flies that can be observed concurrently is limited only by the visual field of the
camera. We applied it towards a genetic screen (Chapter 3), but with minor modifications
it could be adapted to many situations where analysis of locomotor activity is needed,
including studies with mammals.

30
METHODS
Fly Maintenance
Flies were raised on cornmeal/agar medium and newly eclosed flies were
collected over a two day period and tested five days later unless otherwise noted. No
anesthesia was used prior to behavioral experiments; transfer of flies was done using
mouth-applied suction through a flypette (a trimmed yellow pipet tip shoved into a
section of plastic tubing, with a small piece of nylon mesh or cotton acting as a barrier to
prevent flies from being sucked through).
Image Acquisition
Flies were placed in shallow, transparent containers. The containers were either
placed horizontally and a video camcorder (Canon ZR80) was positioned above looking
down, or placed vertically and a video camera was placed in front viewing the container
from the side. A black plastic sheet was used as a drape to reduce glare from the overhead
lights and two compact fluorescent lights (Sylvania CF23EL/MINITWIST, 23W, 120V,
60Hz, 0.39A) were angled towards the flies. Alternately, the light source was placed
behind or below the dishes, with a piece of translucent white plastic placed between the
dishes and the lights.
The camcorder was connected via an IEEE 1394 link to a computer running linux
on an x86 processor. The video camera provided 30 frames per second, and the open

31
source acquisition program dvgrab (GNU General Public License) collected still images
at regular intervals. The basic form of the command is
dvgrab –format jpeg –every N filename
where N specifies that the program records every “Nth
” frame. Because the
baseline frame rate is 30 frames per second, N=1 indicates 30 frames per second, N=30
indicates one frame per second and N=1800 indicates 1 frame per 60 seconds. The output
of this command is a sequence of consecutively numbered jpeg images of the form:
filename001-00000001.jpg.
In addition to the Canon ZR80 camcorder, a Canon Powershot G3 was used to
acquire images in the Tolerance First Movement Assay. In this instance, the camera was
connected to a laptop running Windows XP via USB and the program Zoombrowser EX
5.6 (which is packaged with Canon digital cameras that are capable of remote shooting)
was used to collect the images at regular intervals.
Image Analysis Methods
We wrote three Perl scripts to handle our different image analysis needs:
sliding_window.pl, compare2first.pl and compare2first_staggered.pl. We later adapted
these original scripts to meet our changing needs and created tellmewhentheymove.pl and
32
nested_window.pl. These scripts can be obtained at
http://w3.biosci.utexas.edu/atkinson/software/Home22.html and can also be found below
in the Appendices. These scripts invoked commands from an image software toolkit
called ImageMagick. Prior to running the script, one of the images to be analyzed was
opened with a third party image editing program (we used GIMP) and the dimensions of
an arena (the region of the image that corresponds to a group of flies being analyzed) and
the coordinates of each arena’s top left corner were determined. All arenas needed to be
the same shape and size within an analysis run. These coordinates and dimensions were
entered into the Perl script, along with the total number of arenas, by manually inserting
the values into the script with a text editor. Once a particular set up has been established
and fixed in place, the process of selecting and entering dimensions and coordinates does
not need to be repeated for each experiment. This makes the analysis as simple as putting
the images to be processed in the same directory as the Perl script and initiating the
script. Each script used the following ImageMagick commands (more detailed
descriptions of the use of these commands follow):
mogrify -depth 8
mogrify -colorspace gray
convert -crop
composite -compose difference
mogrify -modulate 300

33
Sliding Window Method
Sliding_window.pl (Appendix A) is used to measure locomotor activity per unit
time. To run the script, the following command is typed into the console:
perl sliding_window.pl X *.jpg
where X is the total number of frames (the window) to be combined into each
final composite image (this number needs to be a power of 2) and *.jpg denotes the
sequence of raw images to be analyzed.
Sliding_window.pl automates the following process. For each arena to be
analyzed, the region is extracted by cropping. These images are converted from 16-bit
color to 8-bit grayscale, then digitally subtracted in consecutive and non-overlapping
pairs, producing a sequence of difference images in which the background and non-
moving flies have disappeared. Each composite image represents the subtraction of two
raw images. After all of the raw images have been subtracted, the entire process of
subtraction repeats, now using the previously generated composite images to create new
composite images (with each now being produced from four of the original images). This
pairwise subtraction process repeats until there is one composite image for every window
of X original images, satisfying the X parameter above. For instance, using X=4 (four
raw images per window) causes the script to undergo two rounds of pairwise subtraction,
X=8 (eight images per window) causes three rounds, etc. Increasing the X parameter

34
reduces the time resolution of any changes in movement, but it allows a larger volume of
data to be condensed into a more manageable number of data points. The final images are
renamed and the contrast is increased.
Nested Window Method
The script nested_window.pl (Appendix B) is similar to sliding_window.pl. To
run the script, the following command is typed into the console:
perl nested_window.pl *.jpg
where *.jpg denotes the collection of images to be analyzed. The steps outlined
above for sliding_window.pl are also applied here. However, for this script, the number
of frames per window is not specified because it is always 2. There is only one round of
subtractions, and images are subtracted in overlapping pairs rather than non-overlapping
pairs. In other words, if sliding_window.pl was given the following sequence of images:
A, B, C, D, E, and F, it would make the following subtractions in the first round: A/B,
C/D, and E/F. For the same sequence of images, nested_window.pl would make the
following subtractions: A/B, B/C, C/D, D/E, and E/F. This script does not condense the
original data points into a smaller number of composite images; instead, it gives the
highest resolution of activity level per unit time.

35
The quantify.pl script (see below) is integrated into this script, so the final output
is a tab-delimited file that provided a sequence of numbers (the quantity of white pixels)
for each arena being analyzed. Staggered start times were not integrated into this script,
even though vials of flies were exposed to ethanol at different start times due to the
treatment method used (see Recovery assay in Chapter 3 below). Instead, it was apparent
upon viewing the output file when each vial of flies began ethanol treatment because the
column would have a series of zeros, then a large number (from the subtraction between
an image with the vial present and the preceding image with no vial present, the
difference between these two images was greater than any difference caused solely by fly
movement)—these values were deleted from each column before comparing vials (Figure
3.2).
Compare to First Method
Compare2first.pl is used to measure the time it takes a non-moving group of
animals to begin moving again. To run the script, the following command is typed into
the console:
perl compare2first.pl *.jpg
where *.jpg denotes the collection of images to be analyzed. The script crops each
image to a single arena, converts it to 8-bit grayscale, then subtracts the first image from
36
each subsequent image. The composite images (the difference between each image in the
sequence and the first image) are renamed, converted to grayscale and the contrast is
increased.
The application of this method is to detect when a non-moving animal begins to
move. In the first image, all animals are at a baseline, non-moving position. As long as no
movement occurs in subsequent images, the composite images (subtractions) will contain
little to no white pixels. As soon an animal moves from its baseline location, the
composite images will show white pixels. Whether that animal moves once then stays
put, or continues to move around, the amount of white signal generated will remain fairly
constant. When all the animals in the field of view have moved from their baseline
location, the amount of white pixels in the composite images will plateau at a maximum
value.
An alternate application of this method is to detect “where” an animal is within a
given region. To do this, the first image should be identical to the rest of the images
except that there is no animal present. It is simply a picture of the background. Instead of
having each arena correspond to the entire field of movement for a given animal, the field
is divided into several arenas. Each arena is analyzed to measure the number of white
pixels it contains, and at each timepoint, the arena with the most white pixels corresponds
to the location of the animal at that moment.

37
An additional application of this method would involve using an “empty” field as
the first image (for example, if flies in a vial are gradually succumbing to ethanol
sedation, in the last image, all of the flies are at the bottom of the vial, sedated and not
moving). If the entire vial of flies (excluding the bottom of the vial) is defined as the
arena, the white pixels quantified by the script will provide an estimate of the number of
flies that are crawling on the sides of the vial (and are therefore not yet sedated).
Compare to First Staggered Method
Compare2first_staggered.pl (Appendix C) is used in the same cases as
compare2first.pl, except that the initial image (the one being subtracted from the others)
is different for each group of flies being analyzed.
In some cases, the sedative must be given to each group of flies by hand (for
example, by transferring them from a clean vial to a drug-coated vial), and so the
different groups begin their dose (and their recovery from that dose) at different times.
The script compare2first_staggered.pl takes this factor into account.
The use and utility of this script is identical to compare2first.pl. For the first arena
(the region of the image representing the first group of flies to be analyzed), the baseline
image is the first in the sequence. However, for the second arena, the comparison image

38
is the second in the sequence (the first image in the sequence is ignored because at that
point in time, those flies have not yet begun their sedation or recovery).
Tell Me When They Move Method
The purpose of tellmewhentheymove.pl (Appendix D) is to report the time point
at which single flies leave their starting positions. It is an adaptation of compare2first.pl.
The script is run by typing the following command into the console:
perl tellmewhentheymove.pl *.jpg
where *.jpg denotes the sequence of images to be analyzed. Prior to running the
script, the arenas to be analyzed have been defined as rectangles that are approximately
the size of a single fly. This script crops the picture to each arena to be analyzed
(corresponding to a single fly) and then subtracts each cropped image from the first
cropped image in the sequence and quantifies the number of white pixels. The script
quantify.pl (see below) was integrated into tellmewhentheymove.pl. When the number of
white pixels reaches a certain threshold, the fly is scored as recovered (because it has left
its original, sedated position), and the position of the image within the sequence of
images is noted. This value is combined with the time interval between images, and the
output of the script is the time required for that fly to recover from ethanol sedation.

39
Quantification of White Pixels
The subtracted images that many of the Perl scripts create are 8-bit grayscale
images that appear to consist of a black background with white flies where motion has
occurred.
The following command is used to analyze the white content of the pictures:
perl quantify.pl X *.jpg > filename.txt
where X is the threshold for white (default is 72; inputting 0 will default to this),
*.jpg represents the images to be quantified (if the original images are still in the folder,
then the string must be modified to exclude the originals), and filename.txt is the tab-
delimited output file.
The default of 72 was chosen by performing empirical tests and choosing a value
that maximized the white pixels produced by movement of the fly while minimizing
noise. After quantify.pl is run, the resulting pixel counts can be reviewed alongside a few
examples of the images that were analyzed. If noise levels are too high, meaning that
there are pixels being counted in frames where no movement is taking place, the
quantify.pl script can be run again with a higher (more strict) threshold value.
This script calls up a histogram of each image using the ImageMagick command
“identify -verbose” and tallies up all the pixels at the white threshold and higher (i.e., the
40
pixels that are “whiter” than the cutoff). The output is a two column list of the image files
analyzed and the number of pixels above threshold for each image.
Canton S / parats1
temperature experiment
Age-matched (3–5 days old), mixed male and female flies were used in this
experiment under the presumption that courting behavior would increase movement. Two
genotypes were used: Canton S flies (CS, a common wild type strain) and parats1
, a
temperature sensitive paralytic in which the restrictive temperature causes paralysis via
inactivation of a sodium channel.
A PCR thermocycler was used as a programmable heat source. A piece of foil
covered the metal block, and a kimwipe was laid over the foil to provide a white
background for the pictures. Flies were tapped down onto the kimwipe then quickly
covered with the lid of a small Petri dish (40 mm in diameter and 5 mm high). There
were approximately the same numbers of flies in each group (22 CS flies and 24 parats1
flies).
The thermocycler was set to 20°C for five minutes. It then cycled between five
minutes at 40°C and ten minutes at 20°C, for five cycles. The video camera was
positioned above the flies with a tripod and, controlled by the computer, collected data at

41
10 frames per minute. Sliding_window.pl was used for analysis with four frames per
window.
Tolerance Climbing Assay
Flies were divided into two groups, experimental and control. The experimental
group was treated with ethanol as described previously (Cowmeadow et al., 2005).
Briefly, flies were placed into glass vials (with diameters of 23 mm and lengths of 95
mm) with small holes in the bottom, and air was pumped into the top of the vials at a
flow rate of 15 ml/min. For the experimental group, the air was bubbled through water,
then twice through heated (65°C) ethanol to produce an ethanol saturated air stream; for
the control group, the air was only pumped through water. Treatment continued until all
flies in the experimental group lost their negative geotactic response (i.e., they were no
longer climbing and had fallen to the bottom of the vial). Flies were then removed to their
food vials, with the vials on their sides until the sedated flies recovered.
Four hours after the end of the first treatment, flies were returned to the treatment
apparatus and all flies received ethanol. A fluorescent light box lit the vials from behind
and a Canon ZR80 digital video camera captured images at one frame per second. When
all flies had become sedated, the air source was switched back to humidified air and the
flies were allowed to recover. The compare2first.pl script was used to analyze the
recovery data.

42
Tolerance First Movement Assay
In this experiment, treatment proceeded identically to the Tolerance Climbing
Assay, except that 24 hours elapsed between the first and second treatment. Also, after all
flies were sedated on the second day, they were removed from the treatment apparatus
and placed individually into the wells of a plastic 96-well plate using a flypette. Seven
minutes and eighteen seconds elapsed between the end of their ethanol treatment and the
start of the image acquisition. In this experiment, the 96-well plate was horizontal, resting
on a piece of glass covered with white paper, and the two compact fluorescent lights were
positioned one foot below the glass. The camera (Canon G3) was positioned above, and it
captured an image once every ten seconds.
Analysis was performed with sliding_window.pl, with the window size set to 2.
The composite images were visually examined to identify instances in which the fly had
completely displaced its position between two raw images. The pixel count for the
subtraction of these examples was determined to be around 450 pixels, and this was used
to represent the quantity of white signal produced when a fly moved completely to a new
position. In the tolerance assay, once a fly moved enough to produce 450 white pixels in
the composite image, it was considered to have recovered from sedation. Although this
simplifying assumption is rather arbitrary, its use produces an outcome that matches the
manual scoring of flies for ethanol tolerance. The recovery times for the experimental

43
group following their second dose of ethanol were compared to the recovery times for the
control group following their first dose of ethanol on the test day. Prior ethanol sedation
has been shown to induce behavioral tolerance and to cause flies to recover more rapidly
from sedation (Cowmeadow et al., 2005).
Mouse Novelty Assay
The FVB mouse was housed in the University of Texas Vivarium, which is
AAALAC accredited, and was treated within the guidelines of the National Institutes of
Health (Council, 1996). The naïve mouse, prior to and after use, had 24-hr ad libitum
access to standard rodent chow, water and 12-hr:12-hr lighting. The mouse was
videotaped in a test cage consisting of a standard plastic rat cage (19” w x 10.5” l x 8” h)
with black plastic attached to the bottom. A digital camcorder recorded the animal
moving around the test cage for fifteen minutes, then it was returned to its home cage
with food and water for five minutes. A mouse toy consisting of interlocking plastic walls
was placed on the left side of the cage and attached with tape. The mouse was returned to
the test cage and recorded in the presence of the toy for 15 minutes, then returned to its
home cage for five minutes. The toy was removed and the animal spent another 15
minutes in the test cage. Analysis was carried out using compare2first.pl with an empty
cage (with or without the toy in place) as the first comparison image. The area of the cage
was divided into 40 different zones, and the location of the mouse was scored as being
the zone with the most white signal. Visual scoring was done by looking at each image

44
and recording whether the majority of the mouse was on the right or the left side of the
cage.
RESULTS
The basic form of the image analysis can be seen in Figure 2.1. A camera delivers
a sequence of images captured at regular intervals (Figure 2.1a–d), and each pair of
images in the sequence are subtracted from one another to produce two composite images
(Figure 2.1e–f). In the composite images, the background and any non-moving flies have
disappeared. Because the fly moved in both cases (between Figure 2.1a and Figure 2.1b,
and between Figure 2.1c and Figure 2.1d), each subtraction produced an image of two
flies—one from its location in the first image and one from its location in the second
image. These two composite images can be pair-subtracted again to yield another
composite image (Figure 2.1g). The four white flies seen in Figure 2.1g correspond to the
fact that two movements occurred during the time interval.

45
Figure 2.1: The sliding window method shows the movement of a single fly
The four images in the top row (a–d) represent a single fly in a shallow dish at four
consecutive time points. Digitally subtracting (a) from (b) yields (e), and digitally
subtracting (c) from (d) yields (f). The background disappears and white flies on a black
background show that movement took place. Digitally subtracting (e) from (f) gives (g),
an image in which four white flies represent the fact that two movements occurred during
the interval measured (the maximum level of movement possible).
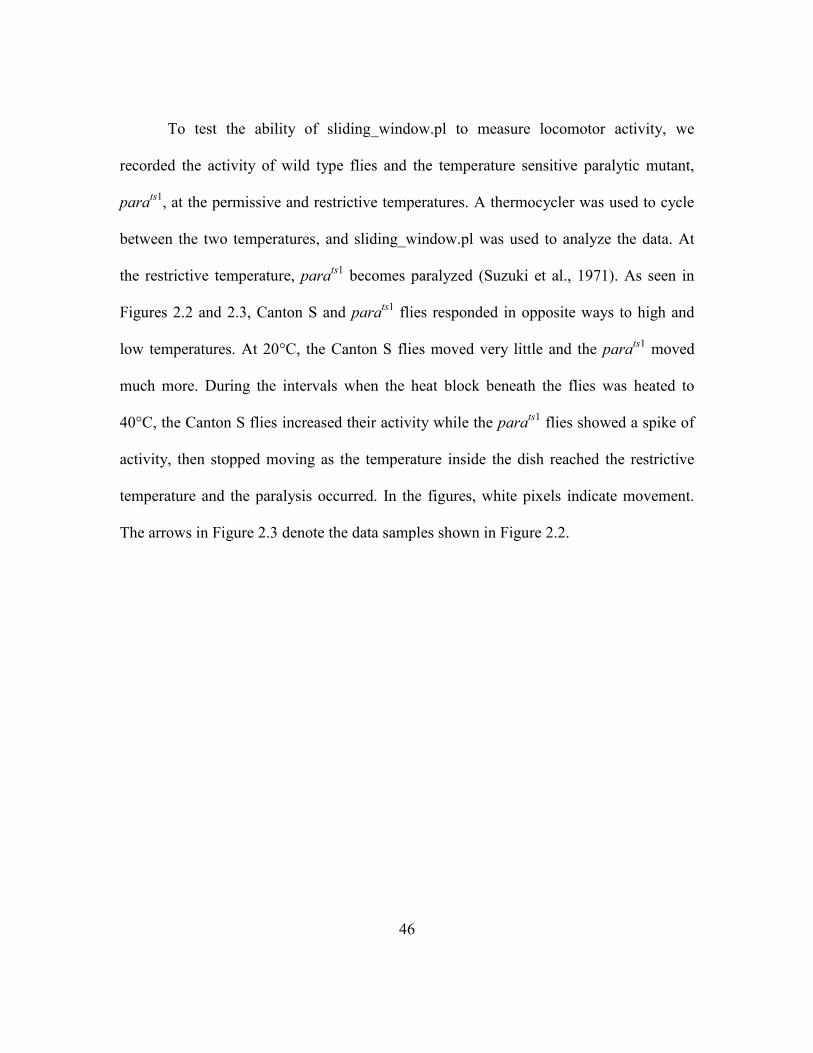
46
To test the ability of sliding_window.pl to measure locomotor activity, we
recorded the activity of wild type flies and the temperature sensitive paralytic mutant,
parats1
, at the permissive and restrictive temperatures. A thermocycler was used to cycle
between the two temperatures, and sliding_window.pl was used to analyze the data. At
the restrictive temperature, parats1
becomes paralyzed (Suzuki et al., 1971). As seen in
Figures 2.2 and 2.3, Canton S and parats1
flies responded in opposite ways to high and
low temperatures. At 20°C, the Canton S flies moved very little and the parats1
moved
much more. During the intervals when the heat block beneath the flies was heated to
40°C, the Canton S flies increased their activity while the parats1
flies showed a spike of
activity, then stopped moving as the temperature inside the dish reached the restrictive
temperature and the paralysis occurred. In the figures, white pixels indicate movement.
The arrows in Figure 2.3 denote the data samples shown in Figure 2.2.
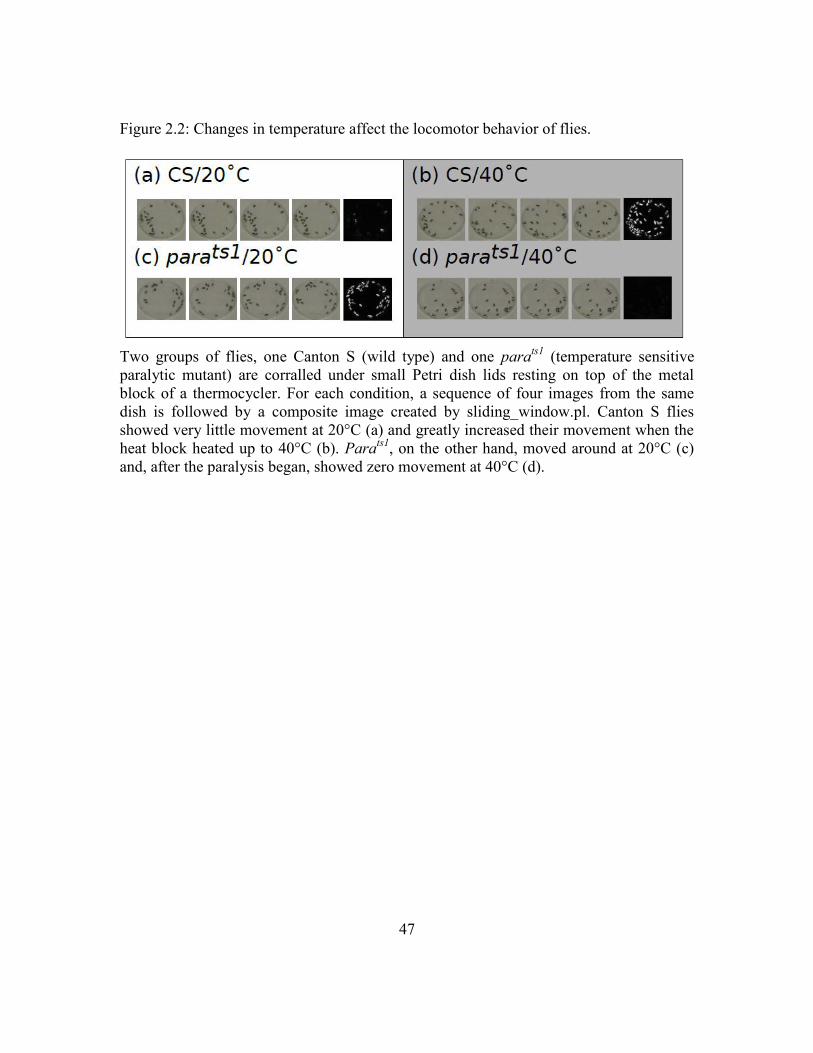
47
Figure 2.2: Changes in temperature affect the locomotor behavior of flies.
Two groups of flies, one Canton S (wild type) and one para
ts1 (temperature sensitive
paralytic mutant) are corralled under small Petri dish lids resting on top of the metal
block of a thermocycler. For each condition, a sequence of four images from the same
dish is followed by a composite image created by sliding_window.pl. Canton S flies
showed very little movement at 20°C (a) and greatly increased their movement when the
heat block heated up to 40°C (b). Parats1
, on the other hand, moved around at 20°C (c)
and, after the paralysis began, showed zero movement at 40°C (d).

48
Figure 2.3: Heat pulses elicit repeatable effects on the movement of flies.
This is a summary plot of the sampled data shown in Figure 2.2; arrows show the
locations of the image sequences in that figure. The original images were collected at 10
frames/min. The y axis is the number of white pixels above threshold (72 on a 256
grayscale), and each data point comes from the analysis of four raw images (meaning that
it corresponds to a 24-s interval). Shaded regions represent times when the heat block
heated up to 40°C. During these intervals, Canton S (a) increased their activity and
parats1
(b) briefly increased their activity, then as the chamber reached the restrictive
temperature, the paralysis began and they ceased moving. The non-shaded regions
represent intervals when the heat block cooled down to 20°C. During these times, Canton
S decreased their activity and parats1
increased their activity.

49
While it was expected that the behavior of CS and parats1
flies would differ
greatly at the restrictive temperature (activity vs. paralysis), it was not expected that these
genotypes would show such different activity levels at the permissive temperature. We
were surprised that there appeared to be a “rebound effect” of paralysis in that fly activity
increased following temperature induced paralysis.
In a second experiment, wild type flies were either given a sedating dose of
ethanol vapor or mock treatment (as a control). Four hours later, both groups were
sedated with ethanol and their recovery was quantified using the script compare2first.pl.
The bottom of the vials was not included in the cropped regions to exclude movement
other than climbing (e.g., twitching). This was done by examining the first image taken
(where the flies were sedated and lying at the bottoms of the vials) and selecting arena
locations that did not include the sedated flies. Figure 2.4 shows composite images of the
recovery of the flies, sampled every five minutes. Figure 2.5 shows a plot of the entire
recovery. The data being plotted were normalized by dividing the raw pixel count by the
maximum white pixel count seen in the duration of the trial. There were different
numbers of flies in each vial and therefore the raw number of white pixels plateaued at
different levels. Dividing by the maximum number of pixels eliminated this problem.

50
Figure 2.4: Flies recover from a second dose of ethanol more quickly than from a first
dose.
These composite images come from subtracting the first image of the sequence from all
of the subsequent images (using compare2first.pl). Images are shown at 5-min. intervals.
The flies in (a) are recovering from their first ethanol sedation, and the flies in (b) were
sedated 4 hours earlier, making this their second recovery.

51
Figure 2.5: Wild type flies show rapid tolerance to ethanol in a climbing assay.
This is the summary plot of the data shown in Figure 2.4. Images were taken at 1 frame/s
and the y axis represents the white pixels above threshold divided by the maximum
number of white pixels (this normalization was necessary because the number of flies in
each vial was not equal).

52
Tolerance to ethanol was also measured another way. After the final sedation,
flies were individually transferred to the wells of a 96-well microtiter dish.
Sliding_window.pl was used to analyze the images, and when the images produced 450
white pixels, that fly was scored as having recovered from sedation. Prior to the scoring
of recovery, we examined several of the images and determined that the complete
displacement of the fly from one position to another produced approximately 450 white
pixels. Figure 2.6 shows that prior sedation led to a significantly faster recovery time (p <
0.01, n=22). The control group took 34.9 ± 5.7 minutes to recover, and the experimental
group (with a sedation 24 hours prior) took 15.4 ± 1.8 minutes to recover. Significance
was determined using Student’s t test and error bars were standard error of the mean
(SEM).

53
Figure 2.6: Sliding_window.pl can be used to detect tolerance to ethanol sedation in
individual flies within a 96-well microtiter dish.
In this assay, functional behavioral tolerance is defined as an increase in the recovery rate
from ethanol sedation that is caused by prior ethanol sedation. Flies were sedated with
ethanol and placed individually into the wells of a 96-well microtiter dish. Movement
was quantified with the script sliding_window.pl, and recovery was defined as the first
time point at which the fly completely displaces its position. The appropriate “white
count” for this event was empirically determined as the minimal “white count” produced
by the flies in obviously different positions. Animals required 34.9 ± 5.7 min. (S.E.M., n
= 23) to recover from their first ethanol sedation (control) and 15.4 ± 1.8 min. (S.E.M., n
= 22) to recover from their second sedation (experimental). Significance was determined
by Student’s t test (p < 0.01). Error bars are standard error of the mean.

54
To demonstrate the utility of this method for mammalian systems, a mouse was
monitored alone and in the presence of a novel object. The script compare2first.pl was
used to analyze the data and determine the position of the mouse at a given moment.
Table 1 indicates that, with no object in the cage, the mouse spent roughly 40% of its
time on the left side of the cage. When the object was introduced on the left side, for the
first few minutes it avoided that side, spending 11% of its time there. Then, for the
remainder of the trial, it spent more than 90% of the time on the left side. After the object
was removed, the mouse returned to its baseline level, with 44% of its time spent on the
left side. Visual scoring of the data yielded similar results. These data are in concordance
with past studies that describe rodents responding to novelty with both avoidance and
exploration (Kim et al., 2005).

55
Table 2.1: Compare2first.pl accurately scores the position of a single mouse.
Computer scoring (%) Visual scoring (%)
Left Right Left Right Agreement (%)
No object (1st 6 min.) 33 67 34 66 99
No object (2nd
6 min.) 46 54 44 56 98
Object on left (1st 6 min.) 11 89 17 83 94
Object on left (2nd
6 min.) 93 7 94 6 100
No object (1st 6 min.) 42 58 43 57 99
No object (2nd
6 min.) 47 53 48 52 99
The movements of a caged mouse were recorded using a camcorder before, during, and after the
presentation of a novel object (plastic toy). The video was then sampled once per second and
converted into images. The images were scored by compare2first.pl and by a visual observer to
determine the position of the mouse at 1-s time intervals. The table shows the percentage of time
that that mouse spent on the left and the right halves of its cage during consecutive 6-min.
periods, as scored by compare2first.pl and by the visual observer. The two scoring methods are
essentially in agreement. In the absence of the novel object, the mouse spent approximately 40%
of the time on the left side of the cage. When the novel object was introduced to the left side of
the cage, the mouse first avoided the left side and then spent the majority of the time in the side
with the toy (> 90%). After the toy was removed, the occupancy pattern returned to what it was
before the appearance of the novel object.
56
DISCUSSION
Fruit flies exhibit many of the same behaviors as humans. They sleep, learn,
court, fight and respond similarly to ethanol (Quinn et al., 1974; Hall, 1994; Moore et al.,
1998; Hendricks et al., 2000; Chen et al., 2002). These behaviors have led to a growing
interest in Drosophila as a model for complex behavioral phenomena such as ethanol
responses. The primary advantage of the Drosophila model system is the capacity for
gene identification through genetic screening. However, scoring behavioral phenotypes is
time consuming. Since it is common for genetic screens to involve testing upwards of
2,000 lines, there is a significant benefit in automating the process.
In this chapter, we report a straightforward method for detecting movement of an
organism by comparing still images taken at regular intervals. We have used fruit flies
and a mouse, but the method could be adapted to any animal. This technique has
applications with a wide range of movement-based behavior. The process of collecting
and analyzing data is largely automated and can be easily scaled from observing a single
animal to observing hundreds of animals.
We have focused on two main techniques to detect movement. In the first, the
sequence of images is parceled out into windows of 2n frames per window. These are
digitally subtracted in a pyramid fashion to create one composite image per window. The

57
background and any non-moving flies disappear. A sequence of composite images gives
a “sliding window” measurement of the activity level of the animal.
We will be using this method to look at locomotor changes resulting from
overactivity of the nervous system. To illustrate the utility of this method, we applied
heat pulses to two groups of flies—a temperature sensitive paralytic mutant and a wild
type strain. Each heat pulse caused the mutant flies to stop moving and the wild type flies
to increase their activity, and the image analysis reflected these effects. In another
experiment, we analyzed flies placed individually into small containers recovering from a
dose of ethanol. When a fly produced a signal that corresponded to it displacing its
position, it was scored as having recovered.
A second technique comes from taking the first image in the sequence and
subtracting it from each of the rest of the images. While the animal remains in its original
location, the composite images show only a black field. As soon as the animal moves,
white pixels appear. This technique is useful in cases where animals start out stationary
and eventually begin to move. The experiment we used to demonstrate the method (and
the application for which we intend to use it) was to measure ethanol tolerance in flies via
their recovery of the ability to climb. But in more general terms, this technique has
applicability in cases where the experimenter wishes to measure “time to an event.”
Besides recovery from a sedative, examples of this include measuring time for an egg to
hatch or puparation to occur.

58
With a slight modification, this technique was used to look at the locomotor
behavior of a mouse alone and in the presence of a novel object. This can be extended to
other tests used with mammals that are interested in “where” an animal is within a field
(such as conditioned place preference). Compare2first.pl was employed with an empty
maze/box as the first image, yielding composite images that are black with the animal
appearing in white. Basically, the background was subtracted from each image. The field
of movement can be divided into appropriate zones for such tests as conditioned place
preference assays and the probe test of a Morris water maze. In cases where the path of
the animal is needed, the field might be divided up into a grid of relatively small
“sectors” and the sector with the greatest number of white pixels can serve as the
coordinates of the animal at that moment.
Unfortunately, this method is less applicable in cases where the movement of an
animal is expressed by stereotyped behaviors rather than exploratory behaviors. The
analysis of an animal that is grooming excessively vs. the analysis of an animal that is
grooming normally would most likely be too similar to detect a difference. Another
limitation is that it only detects whether movement has occurred between two
photographic frames, rather than the magnitude of the movement. In other words, the
analysis cannot distinguish between fast and slow movement as long as the animal
displaces itself between frames in both cases.

59
In all of these cases, the main draw of this system is the ease and low cost of set
up. Certainly there already exist powerful and elegant software programs to analyze
movement data, but in many cases the cost is prohibitive. The described method only
requires a digital camera or camcorder, a computer and appropriate lighting. All of the
analysis tools come from open source software, meaning that they are free for public use.
In particular, high schools and labs wishing to start up movement analysis (but who are
unwilling or unable to spend the money on traditional movement analysis software) will
be able to collect and analyze this type of data.

60
Chapter 3: Tolerance screen
INTRODUCTION
The goal of this phase of the project was to screen a collection of mutant flies and
identify regions of the third chromosome containing novel genes that affected tolerance.
To meet this goal, I developed the tolerance recovery assay method described below and
used it to screen a collection of deficiency mutants. A deficiency is a mutant that is
missing a region of the chromosome. The deletion varies in size, but it covers multiple
genes. These mutants are maintained as heterozygous stocks with balancer chromosomes,
as the deletions are recessive lethal due to the multiple genes affected. Despite the fact
that these mutant stocks are heterozygous, the reduction in gene copy number from two
to one frequently results in a phenotype (Ashton et al., 2001). To facilitate the process of
surveying entire chromosomes, the Bloomington Stock Center in Bloomington, IN has
put together “deficiency kits,” or collections of deficiency mutants in which the deleted
regions overlap, providing maximal coverage of the genome from a minimal number of
deficiencies. The deficiency kit used here contained deficiencies with cytologically
defined endpoints. Some of these endpoints are not precisely defined at the molecular
level, but instead fall within a range of molecular positions. This feature can limit the
interpretation of the mutant analysis. In 2009, this version of the kit was replaced with a
set of deficiencies with molecularly defined endpoints (Cook et al., 2012).

61
Although deficiency screens have not previously been used to identify ethanol
mutants in Drosophila, they have been used for other applications. These range from
prepupal heart rate to cardiomyopathy to phagocytosis (Ashton et al., 2001; Van
Goethem et al., 2012; Casad et al., 2012).
METHODS
Please see the General Methods (Chapter 7) for a description of the collection of
female flies for behavioral testing. Using this method, two groups of 14 females were
collected. One group served as the control flies and the other served as the experimental
group.
Recovery assay
On the first day of treatment, each group was placed into the inebriator
(Cowmeadow et al., 2005) on separate sides. The control group remained in the apparatus
during the duration of the treatment but was not exposed to ethanol vapor. The
experimental group received a continuous stream of saturated ethanol vapor until all of
the flies were sedated. Sedation was scored by a lack of walking or standing upright (i.e.,
the flies were sedated if their legs were splayed out and they had not recently stopped
walking). Because different lines of flies have different sensitivities to ethanol, it was
important to scale the first dose of ethanol based on the behavioral endpoint of sedation
rather than give a fixed dose for the first treatment. Flies that were less sensitive to

62
ethanol sedation received a larger first dose, and flies that were more sensitive received a
smaller dose. The length of ethanol exposure time required to achieve sedation was
noted; it was usually between 10-15 minutes. At this point, both groups of flies were
returned to their food vials and laid on their side overnight so that the recovering sedated
flies would not get stuck to the food.
On the second day, both groups of flies were placed in the inebriator and exposed
to a saturated ethanol stream until all of the flies were sedated. The two groups were then
placed on either side of a translucent platform, and the sedated flies were spread out using
a feather. There was a light bulb (compact fluorescent to reduce the amount of heat
produced) underneath the translucent platform and a camera controlled by a computer
positioned above, which began taking pictures every 20 seconds. The time elapsed
between the end of ethanol exposure and the beginning of image recording was noted; it
was generally between 1-2 minutes.
The perl script tellmewhentheymove.pl (Appendix D and Tell Me When They
Move Method in Chapter 2) was used to analyze the images. Examining the first image of
the sequence in an image editing program (e.g., the multi-platform program GIMP), an
arena was defined for each fly that represented the starting position of the sedated fly.
The upper left coordinates for each arena (fly location) were entered into the variables for
the perl script, and the script was run in a folder with the sequence of images. The
dimensions of the arena were constant for each fly; these dimensions were also added to

63
the perl script. The output of the script was a tab-delimited file that gave a single number
for each fly; this number was the amount of time it took for that fly to displace its original
starting position (i.e., the amount of time required for the fly to recover from sedation).
This day 2 treatment is the first ethanol sedation for the control group and the
second ethanol sedation for the experimental group. Making this comparison on the same
day between two different groups of flies, rather than a comparison within a single group
of flies between the first and second days, was considered to be a better choice because
there are day to day variations in the behavior of flies (caused by changes in the
environment, such as the barometric pressure) and same-day comparisons avoid these
confounding factors. Tolerance occurred if the control group (first sedation) took
significantly longer to wake up relative to the experimental group (second sedation).
Significance was determined using Student’s t test.
The benefits of this method were that it was automated, required a small number
of flies (approximately 34 female flies per trial), and provided an unambiguous outcome
(either there was a significant difference in wake up time or there was not). However, the
main drawback was that it was not a robust test—in other words, even flies who were
known to show tolerance (such as wild type flies) did not always show tolerance in this
assay. Because of this lack of robustness, the test was repeated for the lines of flies that
did not show tolerance. A final assessment of no tolerance was made when a line of flies
failed to develop tolerance for four trials in a row. If the line of flies sometimes showed

64
tolerance and sometimes did not show tolerance, they were considered able to acquire
tolerance and were not tested further. Because of this shortcoming, the method for
assaying tolerance changed after the conclusion of the deficiency screen.
Knock down assay
Once the initial deficiency screen was completed, the method for detecting
tolerance was revised as described below. The main reason for this change was the lack
of robustness of the previous method. However, this method required a much larger
number of flies—120 females compared to the 34 females needed for the previous assay.
This was considered to be an acceptable trade-off because fewer lines needed to be tested
following the completion of the mutant screen. The new method also offered the
important advantage that it showed both the early hyperactivity phase and the later
sedation phase of ethanol intoxication.
Age-matched female flies were collected as described in General Methods
(Chapter 7) and divided into 12 vials of 10 female flies each. Six of these vials served as
the experimental group and the remainder served as the control group. The treatment on
the first day was identical to the previous method. The experimental group was exposed
to a saturated ethanol stream until all of the flies were sedated, and the control flies were
placed in the apparatus but not exposed to ethanol. The flies were returned to their food
(with vials laid on their sides) until the following day.

65
Figure 3.1: Schematic of the knock down assay.
Flies are placed in a clear plastic vial (a), and a modified conical tube cap (the center has
been removed so that the cap is simply a ring that fits inside the vial) is wrapped with a
kimwipe and inserted into the vial, trapping the flies. A cotton plug is then soaked with 1
mL of a 35% ethanol solution and placed at the bottom of the vial, and the passive
diffusion of ethanol vapor causes the flies to become sedated gradually over the course of
approximately two hours. During this time, the vials are placed against a lit backdrop (b)
and a camera takes pictures at 20-s intervals. In this image, most of the flies are already
sedated and are lying motionless at the bottom of the chamber.
(a) (b)
Kimwipe
Conical tube cap
Cotton plug

66
On the second day, each vial of flies was placed into a plastic vial and a modified
conical tube cap was placed in the vial, covered by a kimwipe (Figure 3.1). The conical
tube cap was modified by cutting out the center of the cap—this allowed it to serve as a
frame that held the kimwipe in place, creating a kimwipe platform for the flies. The vials
were placed open-end-down, and a cotton plug that had been cut into thirds was placed at
the bottom of the vial with 1 mL of 35% ethanol soaking the plug. In this assay, the
ethanol vapor slowly diffused into the vials, and flies became hyperactive, then sedated
over a period of approximately two hours. Because this method induced a more gradual
sedation relative to the inebriator (which subjects the flies to a saturated ethanol stream),
differences in sedation rates were easier to detect. The vials were positioned in rows, one
row per trial, with the experimental vials alternating with the control vials. Behind the
vials was a sheet of paper between sections of plexiglass (providing a translucent
background), and behind that was a compact fluorescent light bulb. A camera was
positioned in front of the vials, and it was controlled by a computer to take pictures every
20 seconds, for approximately three hours. The ethanol-soaked plugs were inserted into
the vials and the vials were placed in position every 20 seconds; these staggered start
times were accounted for by deleting the data points in the output file that were taken
before treatment began for that particular vial (Figure 3.2). The image analysis script
nestedwindow.pl (Appendix B and Nested Window Method in Chapter 2) was used to
analyze the sequence of images. This program yielded a series of values for each vial
(with 6 vials in the experimental group and 6 vials in the control group) that described the
amount of movement occurring within the vial over the duration of the experiment.

67
Figure 3.2: The staggered start times of ethanol treatment were accounted for by deleting the
extraneous data from each column.
(a)
cell0 cell1 cell2 cell3 cell4 cell5 cell6 cell7 cell8 cell9 cell10 cell11
1254 0 0 0 0 0 0 0 0 0 0 0
147 0 0 0 0 0 1406 0 0 0 0 0
46 1241 0 0 0 0 402 0 0 0 0 0
57 336 0 0 0 0 322 1189 0 0 0 0
157 264 1342 0 0 0 306 431 0 0 0 0
239 236 503 0 0 0 315 410 1213 0 0 0
270 231 441 1464 0 0 338 444 491 0 0 0
199 247 360 417 0 0 358 432 285 1455 0 0
186 168 322 454 1611 0 281 428 406 614 0 0
94 199 177 257 546 0 294 370 371 451 1663 0
52 212 233 293 462 1048 317 347 471 562 485 0
158 219 198 183 407 502 329 411 420 499 407 1401
80 292 284 283 514 402 372 464 291 468 138 388
81 229 156 208 468 351 356 472 192 437 180 316
(b)
cell0 cell1 cell2 cell3 cell4 cell5 cell6 cell7 cell8 cell9 cell10 cell11
147 336 503 417 546 502 402 431 491 614 485 388
46 264 441 454 462 402 322 410 285 451 407 316
57 236 360 257 407 351 306 444 406 562 138
157 231 322 293 514
315 432 371 499 180
239 247 177 183 468
338 428 471 468
270 168 233 283
358 370 420 437
199 199 198 208
281 347 291
186 212 284
294 411 192
94 219 156
317 464
52 292
329 472
158 229
372
80
356
81
In the raw data (a), each vial of flies (represented by a column of data) begins to receive ethanol
at a different time. The gray areas represent the image subtractions that occur before that vial
begins to receive ethanol: the zeros occur before the vial is placed in the image and the
abnormally large number is the result of the first subtraction between the vial being present and
the vial not being present. Those values are deleted from the column to yield the adjusted data
(b), where the start time for each vial matches the point at which ethanol exposure began.

68
Although this method required more flies per test than the previous method, the
results were more robust (i.e., it was rare that wild type flies failed to show tolerance). It
also produced more information in terms of the response of the fly to ethanol. It captured
the hyperactivity upon initial ethanol exposure and the later sedation. Because the dose of
ethanol was lower, this method allowed for a gradual sedation and it was easier to make
comparisons between the groups of flies getting their first dose. However, we refrained
from making comparisons across days (because there are day to day variations in the
environment that can affect the ethanol response of flies) and avoided (when possible)
making comparisons between different genetic backgrounds.
RESULTS
In both the recovery assay and the knock down assay described above, wild type
flies (strain: Canton-S) became tolerant to ethanol sedation 24 hours after a single
sedating dose of ethanol 24 hours prior (Figures 3.3 and 3.4).
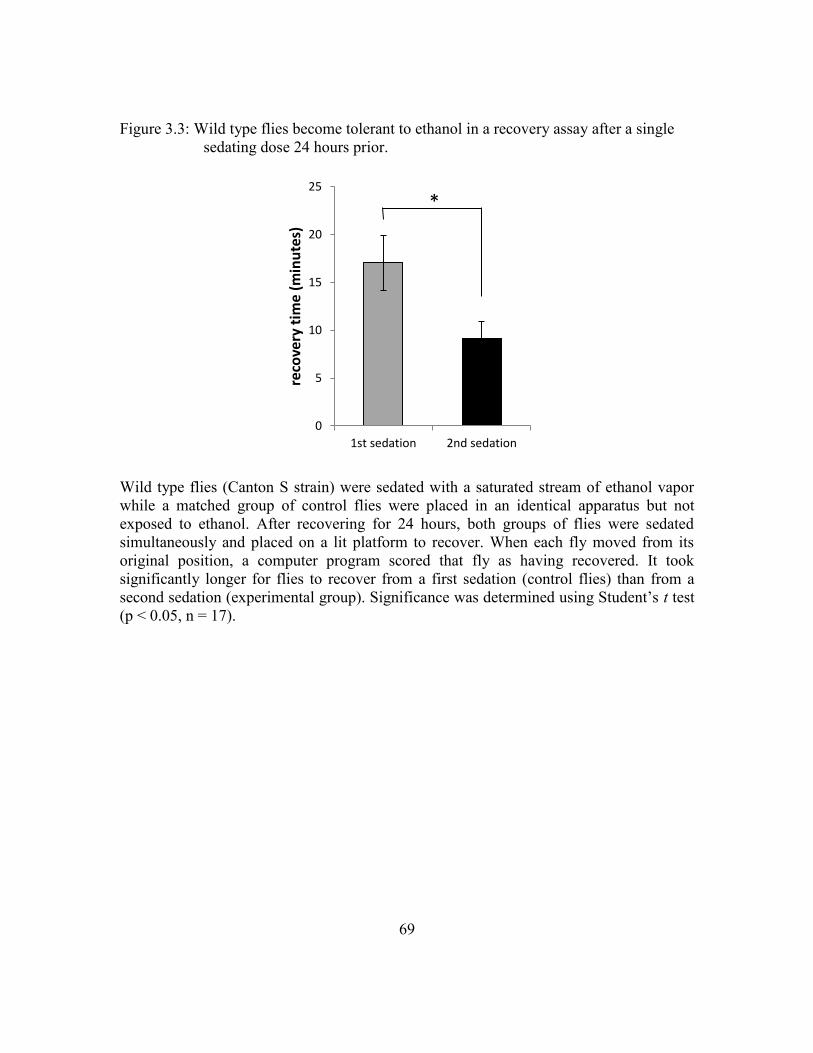
69
Figure 3.3: Wild type flies become tolerant to ethanol in a recovery assay after a single
sedating dose 24 hours prior.
Wild type flies (Canton S strain) were sedated with a saturated stream of ethanol vapor
while a matched group of control flies were placed in an identical apparatus but not
exposed to ethanol. After recovering for 24 hours, both groups of flies were sedated
simultaneously and placed on a lit platform to recover. When each fly moved from its
original position, a computer program scored that fly as having recovered. It took
significantly longer for flies to recover from a first sedation (control flies) than from a
second sedation (experimental group). Significance was determined using Student’s t test
(p < 0.05, n = 17).
0
5
10
15
20
25
1st sedation 2nd sedation
reco
very
tim
e (m
inu
tes)
*

70
Figure 3.4: Wild type flies become tolerant to ethanol in a knock down assay after a
single sedating dose 24 hours prior.
Wild type flies (Canton S strain) were sedated with a saturated stream of ethanol vapor
while a matched group of control flies were placed in an identical apparatus but not
exposed to ethanol. After recovering for 24 hours, both groups of flies were sedated by
exposure to a 35% ethanol-soaked plug within a plastic vial. This low level ethanol
exposure resulted in a gradual sedation while a camera collected images at 20-second
intervals. A computer program analyzed the amount of movement to detect when the flies
became sedated. Receiving a prior sedating dose of ethanol caused a rightward shift in
the sedation curve, indicating that these flies had become tolerant to ethanol sedation.
0 60 120 180
acti
vity
leve
l
time (minutes)
1st sedation
2nd sedation

71
Using the recovery assay method described above, 63 deficiency mutants were
tested. The screen yielded several regions of interest (Figure 3.5). Following the initial
screen, an additional 27 deficiency mutants were acquired from the Bloomington Stock
Center to further examine the regions of interest, and retesting was performed on the
deficiencies that were near the regions of interest.

72
Figure 3.5: Deficiency screen of the third chromosome.
Each box represents a region of the genome that is missing in one deficiency mutant line. The deficiency lines that were able to
acquire tolerance appear as white boxes, and the deficiencies that were unable to acquire tolerance (after repeating the assay
four times) appear as gray boxes. The deficiencies that did not acquire tolerance are also labeled by their Bloomington Stock
Center number. The deficiency df-7589 is also labeled, as it is discussed below.
left arm
right arm
6460
6867 1541
58774501
6411
9697
7589
3003 383
9152
430

73
In parallel with the work I was performing to screen the collection of deficiencies,
I was involved in assigning work to two undergraduates and a high school student who
were working in our lab. They were using a couple of different methods for measuring
tolerance, and I gave them some of the deficiencies that had not shown tolerance thus far
for me. One of them began to stand out—the deficiency mutant Df(3L)Exel6110. The
complete genotype of the line was w1118
; Df(3L)Exel6110, P{XP-U}Exel6110/TM6B,
Tb1, but hereafter it will be described by its Bloomington stock number, df-7589. In the
recovery assay described above, this mutant fell into the category of sometimes showing
tolerance and sometimes not showing tolerance (Figure 3.6). In other tolerance assays
(not described here), it either did not show tolerance or showed what appeared to be an
abnormally large amount of tolerance. When multiple deficiencies within this region
were tested using the knock down assay described above, df-7589 and two other
deficiencies covering the same region (df-6867 and df-9701) either did not show
tolerance or showed sensitization—in other words, the flies who had been previously
sedated became sedated more quickly (Figure 3.7). Because multiple overlapping
deficiencies failed to develop tolerance in the knock down assay, we assumed that one or
more genes within the overlapping region were responsible for the phenotype. These
results led to the gene expression testing described in the next chapter.

74
Figure 3.6: df-7589 sometimes develops tolerance and sometimes fails to develop
tolerance to ethanol in a recovery assay.
The deficiency mutant df-7589 was tested multiple times in the recovery assay. For trials
1 and 2, a prior sedating dose of ethanol caused flies to recover from ethanol sedation
more rapidly relative to flies receiving their first ethanol sedation. For trials 3 and 4, a
prior sedating dose of ethanol had no significant effect on recovery from ethanol
sedation. Significance was determined using Student’s t test (an * denotes that p < 0.05, n
= 17).
0
20
40
60
80
100
120
trial 1 trial 2 trial 3 trial 4
reco
very
tim
e (
min
ute
s)
*
1st sedation
2nd sedation
*

75
Figure 3.7: Three overlapping deficiencies fail to develop tolerance in a knock down assay.
(b) (c)
(e) (d)
(g) (f)
(a)

76
Panel (a) shows the cytological endpoints of six deficiency mutants and if they were able to
acquire tolerance (gray boxes) or unable to acquire tolerance (black boxes). All of the endpoints
of these deletions are cytologically defined, but some of them fall within a range of cytological
bands (white boxes). The blue shaded region denotes the overlapping region between the three
no-tolerance mutants; this region also spans the entire df-7589 deficiency deletion. Panels (b)-(f)
show the knock down tolerance plots for each of these mutants. The mutant df-4393 (d) exhibits
the most classic tolerance (for reference, see Figure 3.4). The mutants df-6867 (b) and df-9701
(c) are particularly interesting, as they showed sensitization: a prior sedation either caused the
mutant to become hyperactive sooner (b) or become sedated sooner (c). The mutant df-7589
(which is examined further in Chapter 4) shows no tolerance (e) in either phase of ethanol
intoxication. The mutants df-4501 (f) and df-4502 (g) appear to sedate at the same rate after a
prior sedating dose, but they both exhibit a delayed hyperactive phase as a result of prior
sedation (a normal response observed in tolerant flies).

77
Chapter 4: Moving from region to gene
INTRODUCTION
The next stage of the project was to go from region of interest to identify one or
more genes that affected tolerance to ethanol.
Several behavioral tests of ethanol tolerance suggested that at least one of the
genes within the region covered by df-7589 was involved in tolerance. There are 9 genes
within this region (Figure 4.1). They are formin 3, male specific lethal 3, BBS1, CG8629,
CG15829, CG8628, Diazepam binding inhibitor (Dbi), melted, and cornetto. Figure 4.1
also lists the putative functions of each of these genes. Even prior to further testing, we
were interested in the cluster of Dbi, CG15829, CG8629, and CG8628 because of their
suspected role in benzodiazepine receptor binding, as the GABAA receptor is a known
target of ethanol, and the benzodiazepine binding site of this receptor is potentially
involved in alcoholism via a stress response (Katsura et al., 2002, 1995b).

78
Figure 4.1: Map of the genes covered by df-7589 and their putative functions.
Gene Function
formin 3 actin binding
male specific lethal 3 chromatin binding; methlylated histone residue binding
BBS1 cilium assembly
CG8629 acyl-CoA binding; diazepam binding; enzyme inhibitor activity
CG15829 acyl-CoA binding; diazepam binding; enzyme inhibitor activity
CG8628 acyl-CoA binding; diazepam binding; enzyme inhibitor activity
Diazepam binding inhibitor acyl-CoA binding; diazepam binding; enzyme inhibitor activity
melted Phosphatidylinositol binding; phosphatidylinositol-5-phosphate
binding
cornetto protein binding; microtubule binding
There are 9 genes within the region that is deleted in the deficiency mutant df-7589. Their
relative locations are given in the top panel, and their indicating functions (according to
http://flybase.org/reports/FBgn0010387.html) are provided in the bottom panel.
form3
msl3
BBS1
CG8629
CG15829
CG8628
Dbi
melt
corn

79
RESULTS
In a project that was completed by Kapil Ramachandran (another student in the
lab), real-time PCR was performed using fly heads to compare the expression levels in
wild type flies relative to the deficiency mutant df-7589. The expectation here was that
each gene would be expressed at a lower level relative to that observed in wild type flies.
For most of these genes, this assumption was true (Figure 4.2a, personal communication).
However, the expression levels of Dbi were low for the wild type stock and extremely
high for df-7589 (Figure 4.2b, personal communication).

80
Figure 4.2: Expression levels for the genes covered by df-7589, a comparison between wild type
and the mutant df-7589.
The data shown here were collected by Kapil Ramachandran. (a) Each of the genes covered by
the deletion in the deficiency mutant df-7589 were tested for expression levels using real-time
PCR in both wild type flies (Canton S, CS) and the mutant (df-7589). Expression levels were
expected to decrease by roughly half because the deficiency has one copy of each of the genes
rather than two, and for most genes, this was the case. Exceptions included cases in which the
expression levels of a gene were low in both wild type and the mutant. (b) However, while the
expression of DBI in wild type flies was low (0.00033; this value would appear in the scale of (a)
but is too low to appear in the scale of (b) where it is plotted), the expression of DBI in the
mutant df-7589 was extremely high. Expression values are plotted relative to the housekeeping
gene cyclophilin. Error bars are SEM.
Rel
ativ
e m
RN
A e
xpre
ssio
n/c
yc
CS
df-7589
DbiR
elat
ive
mR
NA
exp
ress
ion
/cyc
CS
df-7589

81
Following this unexpected result, another mutant line was acquired from the
Bloomington Stock Center: 13493. The genotype of this stock is y1w
67c23; P{SUPor-
P}KG02766 ry506
. The genetic characteristics of this stock will be described in more
detail in Chapter 6, but it contains a P-element transposon that is inserted approximately
1,000 bases downstream of Dbi. When the Dbi expression level of this mutant was
assayed, it also showed a large increase in expression relative to the wild type stock
(Figure 4.3, personal communication). Furthermore, this mutant also failed to become
tolerant in the knock down assay (Figure 4.4). In fact, during the latter part of the
sedation, the flies receiving their second sedation appear to sedate somewhat faster than
the flies receiving their first sedation, indicating that prior sedation produced sensitization
to the sedating effects of ethanol.

82
Figure 4.3: DBI is overexpressed in the P-element mutant 13493.
The data shown here were collected by Kapil Ramachandran. When the expression of
DBI is assayed from fly heads using real-time PCR, the expression of Dbi in wild type
flies (CS) is present but low. However, the expression is many orders of magnitude
higher in the deficiency mutant df-7589, and an additional 3.5-fold higher in the P-
element mutant 13493. Expression levels are plotted relative to the housekeeping gene
cyclophilin. Error bars are SEM.

83
Figure 4.4: The P-element mutant 13493 fails to develop tolerance to ethanol sedation in
a knock down assay.
Exposure to a sedating dose of ethanol 24 hours prior did not cause the P-element mutant
13493 to become tolerant to ethanol sedation. In fact, these flies became sedated more
quickly during the latter phase of ethanol intoxication. In other words, prior sedation
induced sensitization.
0 60 120
acti
vity
leve
l
time (minutes)
1st sedation
2nd sedation

84
DISCUSSION
It was unexpected that df-7589 would show a higher expression level of Dbi
relative to the wild type because the wild type line has two intact copies of Dbi and df-
7589 only has one. It is also unexpected that inserting a P-element transposon near a gene
would increase transcription. One likely explanation for these results is that both of the
mutations affected the activity of insulators that are needed for normal regulation of
expression.
Insulators are elements within the sequence of DNA that set up boundaries that
block the action of enhancers. They can also serve to limit the spreading of condensed
chromatin, although it is the former function that we are interested in here. Blocking the
action of nearby enhancers allows two genes to coexist close to each other despite
different expression patterns, without the regulatory region of gene A influencing the
expression of gene B and vice-versa. Insulators are thought to function in pairs. For
su(Hw) insulator binding sites in Drosophila, these pairs have been observed between the
two copies of homologous chromosomes (Georgiev and Corces, 1995). Inserting one
insulator binding site between a gene and its enhancer has been shown to block enhancer
function, whereas inserting two insulator binding sites has been shown to activate
transcription (presumably by forming a loop between the two insulators that effectively
decreases the distance between the enhancer and the gene, or allows new enhancers
access to the gene) (Kuhn et al., 2003).

85
There are two su(Hw) insulator binding sites on either side of the Dbi gene
(Figure 4.5). In addition, the mutant 13493 contains the P-element transposon P{SUP-
orP} (named for suppressor-P element), which was engineered to contain two su(Hw)
binding sites. This transposon was designed to increase the ability of a P-element
insertion to disrupt the function of nearby genes and thereby cause a phenotype
(Roseman et al., 1995). Theoretically, in the wild type fly, the native insulators set up
boundaries that allow Dbi to be expressed at low levels in the adult fly head without
being induced by the enhancers of nearby genes (Figure 4.6). The disruption of normal
insulator function might be responsible for the overexpression of Dbi in both df-7589 and
the P-element insertion mutant 13493, as detailed below.

86
Figure 4.5: Dbi is flanked by su(Hw) insulator binding sites.
Modencode ChIP-chip data from http://flybase.org/reports/FBgn0010387.html.
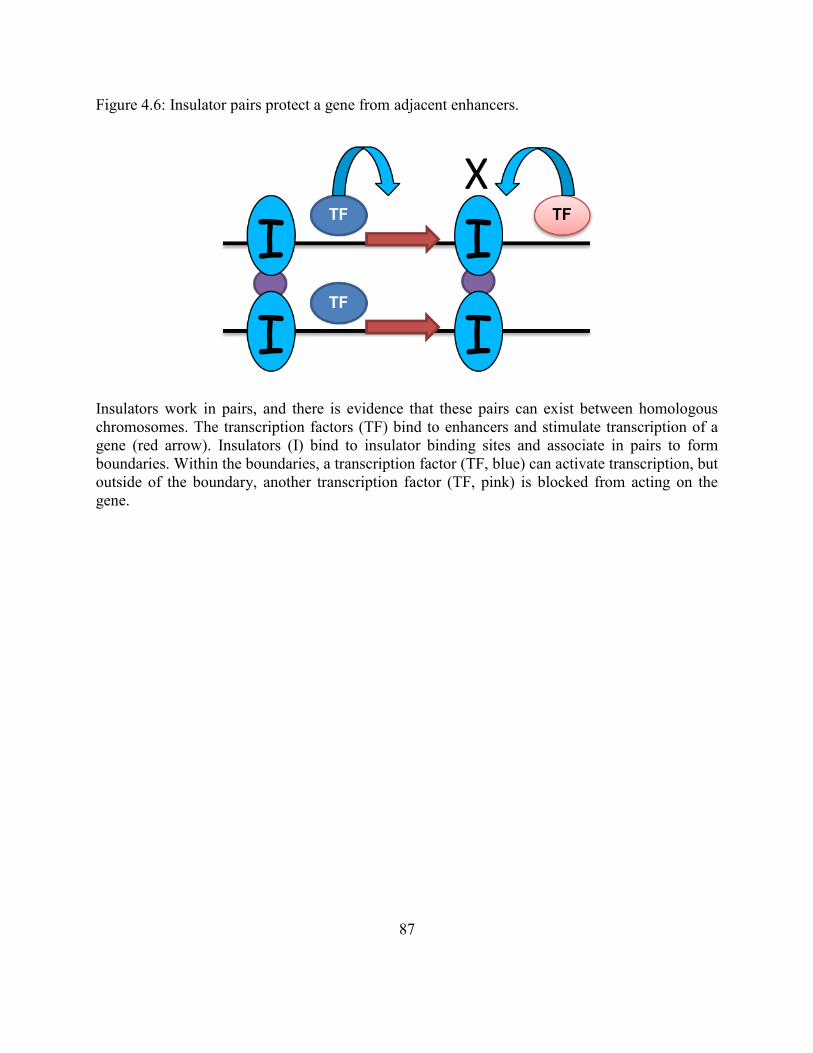
87
Figure 4.6: Insulator pairs protect a gene from adjacent enhancers.
Insulators work in pairs, and there is evidence that these pairs can exist between homologous
chromosomes. The transcription factors (TF) bind to enhancers and stimulate transcription of a
gene (red arrow). Insulators (I) bind to insulator binding sites and associate in pairs to form
boundaries. Within the boundaries, a transcription factor (TF, blue) can activate transcription, but
outside of the boundary, another transcription factor (TF, pink) is blocked from acting on the
gene.

88
Insulator disruption in df-7589
In this mutant, Dbi and the surrounding genes are missing in one chromosome
homolog (the deficiency chromosome) but present in the other (a balancer chromosome,
specifically TM6B, Tb1). Deficiency mutations are always heterozygous, as they are lethal
when homozygous because multiple genes have been deleted. If the su(Hw) binding sites
form trans associations between the two homologous chromosomes and those
associations are integral to their function, then removing one homolog will render the
remaining insulators unable to function, allowing nearby enhancers to activate
transcription of the single functional Dbi gene (Figure 4.7).

89
Figure 4.7: Model for insulator disruption in a deficiency mutant.
Insulators work in pairs, and there is evidence that these pairs can exist between
homologous chromosomes. If one half of each pair is eliminated by a deletion in the
chromosome, the remaining insulators (I) cannot form the proper complexes and will be
unable to block the action of transcription factors (TF, pink) binding to nearby enhancers.
I I
TF
TF
( )

90
Insulator disruption in 13493
In this mutant, the P-element transposon that is inserted into the genome has two
su(Hw) insulator binding sites (Figure 6.2). It is also inserted into a region that is known
to contain a native su(Hw) binding site (Figure 4.5). As described above, insulators
associate in pairs. The introduction of new insulators via the P element might disrupt the
normal associations and therefore block inadequately, allowing nearby enhancers to
induce transcription (Figure 4.8). Because this mutant is homozygous, in contrast to the
heterozygous deficiency mutant, aberrant induction would lead to a greater level of
expression because two copies of the gene are being overexpressed rather than one
(Figure 4.3).

91
Figure 4.8: Model for insulator disruption in a P-element mutant.
The introduction of new insulators via the insertion of a P-element transposon containing
insulator binding sites can disrupt the native trans-associated insulator (I) pairs. This
disruption can allow previously blocked transcription factors (TF, gray) bound to
enhancers to boost transcription, and the looping character of insulator associations can
also bring previously distant enhancers into closer proximity.
I TF
TF
TF
I
I I I
I

92
Induction of DBI might make flies pre-tolerant to ethanol
In an attempt to understand why increased expression of DBI might correlate with
an inability to become tolerant to ethanol sedation, we theorized that perhaps the
increased expression of DBI might cause flies to appear tolerant even when they are
naïve to ethanol sedation. Although it is not advisable to make comparisons between
stocks without extensive back-crossing to ensure that all of the flies have an identical
genetic background, a comparison of the ethanol response between wild type flies (Figure
3.4), the deficiency mutant df-7589 (Figure 3.7), and the P-element mutant 13493 (Figure
4.4) appears to indicate that the two mutants are showing a tolerant phenotype even when
they are receiving their first dose of ethanol. This observation led to the next stage of the
project, where a UAS-DBI transgenic fly was constructed to overexpress DBI using the
GAL4/UAS system.

93
Chapter 5: Over-expression of DBI via the GAL4/UAS system
INTRODUCTION
This phase of the project arose from an assumption that the lack of tolerance seen
in df-7589 and 13493 (the P-element insertion) (Figures 3.7 and 4.4) was caused by the
overexpression of DBI and that induction of DBI was making these mutant flies “pre-
tolerant” before they experienced their first ethanol sedation. To test this idea, a UAS-
DBI transgenic fly was constructed to overexpress DBI by another means and test the
effect of that overexpression on tolerance.
The GAL4/UAS system is one of the many genetic tools available in Drosophila.
The two components of the system are borrowed from yeast: a transcription factor called
GAL4 and a DNA enhancer called UAS (upstream activating sequence). Transcription of
the gal4 gene is directed by an upstream promoter (called a “driver”), causing the GAL4
protein to be produced in a particular tissue or cell type. These promoters are native to the
fly, and many different types have been identified and characterized for this purpose. The
GAL4 protein then binds to the UAS and drives expression of the downstream gene. The
result is tissue-specific overexpression of a target gene. There is a library of mutant fly
lines that each have the gal4 gene inserted downstream from a known driver, as well as
reporter lines in which the UAS has been inserted into a fly along with a reporter gene,
such as GFP. Crossing the two lines together will produce F1 offspring in which the

94
reporter gene is expressed in the cells or tissue determined by the driver, and the
expression pattern each driver has been characterized in this way.
METHODS
There were six UAS-DBI transgenic lines created by Josh Atkinson, an
undergraduate with whom I collaborated. Once these transgenic flies had been created, I
performed the experiments described below to test whether induction of DBI could
mimic the no-tolerance phenotype that was observed in the mutants df-7589 and 13493,
both of which overexpressed DBI.
Heat shock induction of UAS-DBI
The purpose of this experiment was to determine which UAS-DBI transgenic
would produce the most robust phenotype (because a UAS transgenic can activate
transcription more or less depending on the insertion site of the construct). It was also
unclear at this point what the optimal time interval would be to wait between induction of
the heat shock promoter and the measurement of resistance because genes take various
amounts of time between induction and phenotype presentation, so a range of time
intervals were tested. I also wanted to address the idea that expression of DBI was
creating a pre-tolerant state in the animal, which would imply that inducing DBI
expression with a heat shock gal4 driver would mimic tolerance.

95
The following test was performed for each of the six UAS-DBI transgenics. UAS-
DBI was crossed to a heat shock gal4 driver (which was previously shown to induce
expression throughout the body using a GFP reporter gene) and age-matched female
offspring were collected as described in the General Methods section (Chapter 7). Thirty-
six vials of ten females each were collected per cross: there were three time intervals
between the heat shock and test examined (6 hours, 12 hours, and 24 hours), six vials
served as each heat shock group, and six vials served as controls.
On the day after the flies were collected, each vial of flies was moved to a plastic
vial (without food) and the cotton plug was humidified by applying 1 mL of water. The
heat shock groups were subjected to 37°C for one hour while the control flies remained at
room temperature. After the heat shock, all flies were returned to food vials. After the
appropriate time interval had passed, the heat shock and the control flies were tested in
parallel for resistance using the knock down assay (see Knock down assay in Chapter 3
for a description). However, a 50% ethanol solution was used instead of a 35% solution
because it had previously been determined that these flies were less sensitive to ethanol
and 35% ethanol was an insufficient dose to knock down all of the flies during the
recording period (approximately three hours).
After the UAS-DBI transgenic was identified that exhibited the most robust and
clear heat shock induced resistance (UAS-DBI II 16), controls were performed by
crossing this UAS-DBI line to w1118
flies and by crossing the heat shock gal4 driver to

96
w1118
. The parental stocks were crossed to w1118
flies because they share a similar genetic
background and in the experimental cross, each fly has one copy of the heat shock gal4
transgene and one copy of the UAS-DBI transgene. Thus, the two parental control
crosses have one copy of each respective transgene. The offspring of these two crosses
were subjected to identical heat shock and ethanol resistance testing as described above.
Tolerance assay with elav-gal4 induction of DBI
Due to complications with the controls of the heat shock induction experiment (it
was difficult to identify a heat shock protocol that did not induce resistance in the
controls), a second experiment was performed using the pan-neural elav-gal4 driver. The
advantage here over the previous experiment is that a heat shock does not need to be
applied to the flies to induce expression (and heat shock was causing resistance to ethanol
sedation on its own). The disadvantage is that because there is no manipulation (such as
heat shock) to induce the GAL4-UAS system, the behavior of the experimental cross
must be compared to the behavior of the parental stocks. Generally, it is not preferable to
make comparisons between stocks because unforeseen differences in the genetic
backgrounds might confound the results. Compared to the heat shock induction described
above, choosing appropriate controls presents more of a challenge here.
Crosses were performed between elav-gal4 and UAS-DBI II 16, between elav-
gal4 and Canton S (wild type), between elav-gal4 and w1118
, and between UAS-DBI II 16
and Canton S. The latter three were the controls. The offspring of the parental control

97
crosses each have one component of the gal4/UAS system but not the other. There are
arguments for using Canton S to cross against the parental stocks and there are arguments
for using w1118
. The mutant line w1118
is the most similar in terms of genetic background.
However, it is missing the white (w) gene, and both the UAS-DBI transgenic and the
elav-gal4 transgenic carry a w+ in their respective transgenes (this marker is used to
detect when the transgene has successfully integrated into the fly). Consequently, the
experimental cross produces offspring with two w+ genes and a control cross between
one of the parental stocks and the w1118
mutant produces offspring with only one copy.
When Canton S is crossed against the parental stock, the resulting offspring have two
white genes just as the experimental cross does: one native copy from the wild type
Canton S and one w+ from the transgene in the parental stock. Ideally, the presence or
absence of the white gene would have no effect on tolerance, but this was not observed
experimentally, as w1118
flies failed to acquire normal tolerance (relative to wild type
flies) in the knock down assay (Figure 5.1). These data are in agreement with evidence
that mutations in the white gene affect sensitivity to the volatile general anesthetics
isoflurane and enflurane, indicating an alternate neural function for the white gene
beyond its role in the pigment-producing cells of the eye (Campbell and Nash, 2001).

98
Figure 5.1: Cantonized w1118
flies fail to acquire tolerance to ethanol in a knock down
assay.
Cantonized w1118
flies were previously created (for an unrelated experiment) by out-
crossing Canton S flies to w1118
mutant flies for several generations while periodically
maintaining the presence of the mutation by inbreeding. Through crossing over during
meiosis, this process results in flies that carry the w1118
mutation but have a genetic
background that is otherwise identical to Canton S. When these flies were tested for
tolerance in the knock down assay (for a description of the method, see Knock down
assay in Chapter 3), they fail to develop tolerance.
0 60 120
acti
vity
leve
l
time (minutes)
1st sedation
2nd sedation

99
RESULTS
Heat shock induction of UAS-DBI
The UAS-DBI line that clearly produced the most robust resistance following heat
shock was UAS-DBI II 16, and the optimal time interval between heat shock and ethanol
test was 24 hours (Figure 5.2). Based on these results, the control crosses were performed
using this line and also tested for tolerance (Figure 5.3). Although the controls appear to
show a lesser effect of heat, they unfortunately still show an effect of heat shock. Our
conclusion is that heat itself induces resistance (because the parental controls show heat-
induced resistance) but that the induction of DBI in the experimental cross causes further
resistance (because the heat-induced resistance in the experimental cross is greater than
that observed in the controls).

100
Figure 5.2: Heat shock induces resistance in the offspring of UAS-DBI II 16 and a heat shock
gal4 driver.
The offspring of a cross between UAS-DBI II 16 and heat shock gal4 driver were subjected to
37°C for one hour. The flies were then returned to food vials and allowed to recover for 6, 12, or
24 hours. Each group of flies was tested for ethanol resistance using the knock down assay (see
Knock down assay in Chapter 3). Heat shock induced resistance in the flies, and this effect was
most pronounced 24 hours following heat shock.
0 60 120 180
acti
vity
leve
l
time (minutes)
6 hours no heat shock
heat shock
0 60 120 180
acti
vity
leve
l
time (minutes)
12 hours no heat shock
heat shock
0 60 120 180
acti
vity
leve
l
time (minutes)
24 hours no heat shock
heat shock

101
Figure 5.3: Heat shock induces a low level of resistance in the parental stocks.
UAS-DBI II 16 x w1118
hs-gal4 x w1118
Offspring from two crosses: UAS-DBI II 16 x w1118
and heat shock gal4 x w1118
were subjected
to heat shock (37°C for one hour) in humidified chambers (plastic vials with water-soaked cotton
plugs). A control group was also placed in humidified chambers but remained at room
temperature. Flies were then returned to food vials and assayed for ethanol resistance 6, 12, or 24
hours later. These controls showed a lower amount of heat-induced resistance relative to the
experimental cross shown in Figure 5.2.
0 60 120 180
acti
vity
leve
l
time (minutes)
6 hours no heat shock
heat shock
0 60 120 180
acti
vity
leve
l
time (minutes)
6 hours
no heat shockheat shock
0 60 120 180
acti
vity
leve
l
time (minutes)
12 hours
no heat shock
heat shock
0 60 120 180
acti
vity
leve
l
time (minutes)
12 hours
no heat shock
heat shock
0 60 120 180
acti
vity
leve
l
time (minutes)
24 hours
no heat shock
heat shock
0 60 120 180
acti
vity
leve
l
time (minutes)
24 hours no heat shock
heat shock

102
Tolerance assay with elav-gal4 induction of DBI
The experimental cross and each of the three control crosses all developed
tolerance (Figure 5.4). This result was unexpected, as it was assumed that the induction
of DBI in the experimental cross (elav-gal4 x UAS-DBI II 16) would block the
acquisition of tolerance. However, when the ethanol response of each of the naïve groups
was compared to one another, the flies of the experimental cross were resistant to ethanol
sedation relative to the controls (Figure 5.5). To make this comparison, the data (number
of white pixels, this value provides an estimate of the activity level) had to be normalized
by dividing it by the max number of white pixels per vial. This manipulation was
necessary because the different lines were tested on different rows during the ethanol
knock down test. The camera sees a different view of the vials in the top row compared to
the vials in the middle or bottom row. In all other cases, comparisons are only made
within a single row. To statistically compare the sedation curves, the portion of the curve
between the peak activity and the end of the trial was fit to a non-linear curve for each
vial, and this best fit line was used to determine the KD-50, the time point at which the
activity was reduced to 50% of the max (Figure 5.6). These KD-50 values were
compared, and significance was determined using Bonferroni’s Multiple Comparison
Test to allow for post-hoc analysis. The KD-50 of the experimental cross (elav-gal4 x
UAS DBI II 16) was significantly greater than that of each of the parental crosses (vs.
elav-gal4 x CS, p < 0.01, 99% CI of the difference: 0.6006 to 20.96; vs. elav-gal4 x
w1118, p < 0.001, 99% CI of the diff.: 8.041 to 28.40; vs. CS x UAS DBI II 16, p <

103
0.001, 99% CI of the diff.: 9.216 to 29.57). There were no significant differences (p >
0.01) between the KD-50 values of the three parental crosses.

104
Figure 5.4: Both the experimental cross (UAS-DBI II 16 crossed to elav-gal4) and the
parental stocks became tolerant to ethanol in a knock down assay.
Four crosses were carried out: one experimental cross (elav-gal4 x UAS DBI II 16) and
three parental crosses (elav-gal4 x w1118, elav-gal4 x Canton S, and UAS-DBI II 16 x
Canton S). Offspring from each cross were assayed for tolerance in the knock down assay
(see Knock down assay in Chapter 3). All of the groups acquired tolerance.
0 60 120 180
acti
vity
leve
l
time (minutes)
elav-gal4 x UAS-DBI II 16
1st sedation
2nd sedation
0 60 120 180
acti
vity
leve
l
time (minutes)
elav-gal4 x w1118
1st sedation
2nd sedation
0 60 120 180
acti
vity
leve
l
time (minutes)
elav-gal4 x Canton S
1st sedation
2nd sedation
0 60 120 180
acti
vity
leve
l
time (minutes)
UAS-DBI II 16 x Canton S
1st sedation
2nd sedation

105
Figure 5.5: The offspring of the experimental cross (UAS-DBI II 16 crossed to elav-gal4)
were resistant to ethanol sedation relative to the parental controls.
Four crosses were carried out: one experimental cross (elav-gal4 x UAS DBI II 16) and
three parental crosses (elav-gal4 x w1118, elav-gal4 x Canton S, and UAS-DBI II 16 x
Canton S). When offspring from each of these crosses was given an initial sedating dose
of ethanol in the knock down assay, the offspring of the experimental cross were resistant
to sedation relative to the offspring of the control parental crosses.
0 30 60 90 120
acti
vity
leve
l
time (minutes)
elav x UAS
elav x CS
elav x w
CS x UAS

106
Figure 5.6: The offspring of the experimental cross were resistant to ethanol sedation
relative to the parental controls, according to the KD-50 values for the
sedation curves
(a) Best fit lines for the sedation curves from Figure 5.5. The peak-to-zero activity of
each vial of flies was fit to a non-linear curve; the averages of these curves are plotted
here. (b) The best fit curves were used to calculate KD-50 values: the point at which 50%
of the flies were knocked out. Significance was determined using Bonferroni’s Multiple
Comparison Test. There was a significant difference (*, p < 0.01) between the KD-50 of
the experimental cross (gray bar, elav-gal4 x UAS DBI II 16) and that of one of the
parental control crosses (green bar, elav-gal4 x CS), as well as significant differences (**,
p < 0.001) between the experimental cross and the other two parental crosses (red bar,
elav-gal4 x w1118
and blue bar, CS x UAS DBI II 16). There were no significant
differences (p > 0.01) between each of the parental crosses.
0
10
20
30
40
50
60
70
elav x UAS elav x CS elav x w CS x UAS
KD
-50
(m
inu
tes)
*
**

107
DISCUSSION
Based on these results, it appears that the induction of DBI does induce a pre-
tolerant state in the fly, but the level of induction produced by the gal4/UAS system is
likely much less than the level of induction observed in the two mutants, df-7589 and
13493 (Figure 4.3). Therefore, induction of DBI using this system was unable to mimic
the no-tolerance phenotype observed in df-7589 and 13493.
Interestingly, there appears to be two independent effects induced by heat shock:
an increased quiescent period of low activity early in the ethanol intoxication, and an
increased length of time required to reach full sedation. For all of the lines tested (both
the experimental cross and the two control crosses), the quiescent period effect is most
apparent 6 hours following heat shock and least apparent 24 hours following heat shock
(Figures 5.2 and 5.3). The length of time required to fully sedate seems to be more
affected by the induction of DBI because this effect of heat shock was most pronounced
in the experimental cross 24 hours following heat shock (Figure 5.2). However, the
induction of DBI cannot fully account for this effect because the control crosses also
showed an effect of heat (Figure 5.3).
Induction of DBI using the elav-gal4 driver was not able to block tolerance
(Figure 5.4), but the experimental stock was significantly resistant to ethanol sedation
relative to the parental crosses (Figure 5.6). These results support the conclusion that the
induction of DBI using the gal4/UAS system produces resistance, but not enough
resistance to block the acquisition of tolerance.

108
Chapter 6: Excising the P element
INTRODUCTION: P-ELEMENT TRANSPOSONS
The goal of this phase of the project was to demonstrate that the P element (and
the insulators it contained) was responsible for the no-tolerance phenotype by removing
the P element from the mutant.
A P element is a type of transposon that is found in Drosophila, and a transposon
is a sequence of DNA that has the ability to excise itself and reinsert elsewhere in the
genome. P elements were identified in the 1970s in wild type strains of flies but were
absent from laboratory strains (presumably because the ecological event that introduced P
elements into flies from a related species occurred after laboratory strains had been
separated from wild flies) (Ryder and Russell, 2003). The genomes of wild flies also
contained a repressor (an isoform of the transposase enzyme, see below for further
explanation) that prevented the P elements from moving around the genome repeatedly, a
process that is called hybrid dysgenesis and leads to sterility in the fly. The laboratory
strains do not make the repressor, so when a P element containing wild type male fly
(termed P strain) is crossed to a non-P element containing laboratory female fly (termed
M strain), the offspring will receive the necessary maternal factors (accumulated
repressor in the cytosol) to inhibit transposition and hybrid dysgenesis will result.

109
For this system to be used for genetic manipulation of flies in the laboratory, a
few adaptations were made. Normally, a P element contains a gene that encodes a
transposase, an enzyme that is necessary for the process of “cutting and pasting” (i.e.,
transposing) the P element to a new location in the genome. These transposons are called
“autonomous.” In somatic cells, a splicing inhibitor causes this enzyme to be spliced in
one pattern, and it acts as an inhibitor of transposition. In germ line cells, an alternate
splicing pattern is applied and an active transposase enzyme facilitates transposition.
However, there is another route to blocking repeated transposition—some P elements
have lost the transposase gene; they are called “non-autonomous.” These non-
autonomous P elements have been engineered to also contain marker genes (also known
as reporter genes, these are just genes whose expression is detectable in some way,
usually visible) and several restriction sites flanking the P element. The restriction sites
allow the P element to be cut and inserted into a plasmid vector, where it can then be
replicated in bacterial cultures and transfected into a host organism. The reporter genes
allow the P element to be detected when it has successfully inserted into a host genome.
EXCISING THE P ELEMENT
The mutant line, 13493, had the following genotype: y1w
67c23; P{SUPor-
P}KG02766 ry506
. P{SUPor-P} refers to the identity of the P-element transposon, and
KG02766 refers to the insertion site of the transposon. This P element is non-autonomous

110
and therefore unable to transpose independently. To induce excision, a transposase source
had to be introduced. The following cross was performed (Figure 6.1).

111
Figure 6.1: Cross to excise the P element.
In all of these flies, the second chromosome is wild type; therefore, it is omitted from the
description of each genotype. P{SUPor-P}* denotes a P element that has undergone transposition
and left its original position, either wholly or in part. w* denotes a mutant white gene; the precise
allele of the gene is unknown.
(a)
(b)
(c)
(d)
(e)
(f)

112
In the first cross (Figure 6.1a), a male fly containing the transposase source on the
first chromosome was crossed to a virgin female with balancer chromosomes present on
both the first and the third chromosomes (the other chromosomes present on the first and
third chromosome are not relevant, except that they are recessive lethal, as are the
balancer chromosomes, so one can be confident that the flies within this stock all have
the same heterozygous genotype). By selecting female virgin offspring that had both the
Bar- marker (indicating the presence of the FM6 balancer chromosome) and the Serrate
marker (indicating the presence of the TM3, Ser1 balancer chromosome), it could be
assumed that the offspring had the desired phenotype (the first chromosome in these
offspring has the transposase source: H{P∆2-3}HoP8, y1w
* and the balancer
chromosome: FM6, and the third chromosome has a wild type chromosome and the
balancer chromosome: TM3, Ser1).
In the second cross (Figure 6.1b), a virgin female offspring was crossed to a male
from stock 13493, which has the following genotype: y1w
67c23; P{SUPor-P}KG02766,
ry506
. Male offspring were selected that have did not have the Bar- marker (bar-shaped
eye, indicating that they did not receive the FM6 chromosome and therefore did receive
the H{P∆2-3}HoP8, y1w
* chromosome, the transposase source) and did have the Serrate
marker (indicating that they did receive the TM3, Ser1 chromosome and therefore did not
receive the wild type chromosome). These offspring have the transposase source and the
Y chromosome on the first chromosome and TM3, Ser1 and the P element-containing

113
chromosome on the third chromosome. In the gametes of these males, the presence of the
transposase source allows the P element to transpose to another location in the genome.
In the third cross (Figure 6.1c), single male offspring were crossed to virgin
females of the following genotype: y1; TM1/TM2. Males were collected from this cross
that showed the following attributes: a yellow body, the lack of the Serrate marker
(indicating that TM3, Ser1 was not present), and either the Me
- marker (a unique
patterning to the eye, indicating the presence of the TM1 balancer chromosome) or the
Ubx- marker (enlarged halteres, indicating the presence of the TM2 balancer
chromosome). Although the figure indicates that only TM1 offspring were collected,
either balancer is acceptable.
The fact that these offspring show the yellow phenotype (i.e., a mutant yellow
background) is important. The P element contains an intact yellow gene (y+) as a marker.
If the P element does not excise from its position, or if excises but reinserts itself fully
somewhere else (keeping the yellow gene intact), the fly will produce the yellow gene
product and the mutant yellow background will not be observed. If the P element excises
precisely, or if it excises and takes some of the flanking DNA with it, or if it excises
partially (as long as the part that contains the y+ gene is excised), the mutant yellow
background will be seen in the offspring.

114
In the fourth cross (Figure 6.1d), single male offspring are again crossed to virgin
females with a genotype of y1; TM1/TM2. Offspring (both male and virgin female) from
each cross are collected that carry the same balancer (either one) but do not carry both
balancer chromosomes (both TM1 and TM2). All balancers are recessive lethal, so as
long as only one balancer is present, the other chromosome must be the one that
previously contained the P element.
In some cases, males and virgin females with the same single balancer were
crossed together and maintained as a stable stock (Figure 6.1e). In other cases, the cross
was taken one step further by collecting males and virgin females that did not contain the
balancer chromosome (Figure 6.1f) and crossing them to one another to create a
homozygous stock. This step was facilitated by the fact that the chromosome that
previously contained the P element also contained ry506
. This allele is a recessive
amorphic allele of the gene rosy, and flies with two copies of ry506
show a distinctive eye
color phenotype. However, these homozygous stocks had a worse long term viability
relative to those stocks that were maintained as heterozygotes with a balancer
chromosome.
At the end of this cross, there were 359 lines of flies established in which the y+
marker gene in the P element had been lost (indicating that the P element had at least
partially excised). These were derived from 198 male offspring of cross B (fathers in
cross C). The offspring of cross C might have shared the same transposition event if they

115
had the same father, but independent fathers mean independent transposition events.
Therefore, the lines were named with a number and a letter. The number denotes their
father in cross C, and the letter denotes their father in cross D. Therefore, 11a and 11b
might or might not arise from the same transposition event, but 11a and 12a definitely
arose independently.
CHARACTERIZING THE P-ELEMENT EXCISIONS
As mentioned above, a P-element excision can be precise or imprecise, and
imprecise excisions can involve removing some of the flanking DNA from the insertion
site and/or leaving a portion of the P element behind. To determine the nature of the P-
element excision, qualitative PCR was performed. For a detailed explanation of the PCR
procedure, please see General Methods (Chapter 7). A series of primer pairs were
selected around the P-element insertion site or within the P element (Figure 6.2). Two of
these primer pairs were selected to produce a product that spanned the insertion site:
span-A and span-B. The expected product size of a PCR using span-A was 1581 bases,
and the expected product size of a PCR using span-B was 330 bases. For these two
primer sets, reactions that yielded products that were larger or smaller than the expected
size were considered to have left a portion of the P element behind or deleted a portion of
the flanking region of the insertion site, respectively. Reactions that did not produce a
product were ambiguous: either the excision had removed enough flanking region that the
primer could no longer anneal to the resulting sequence, or the excision had left enough
of the P element that the resulting product was too big to be successfully amplified.
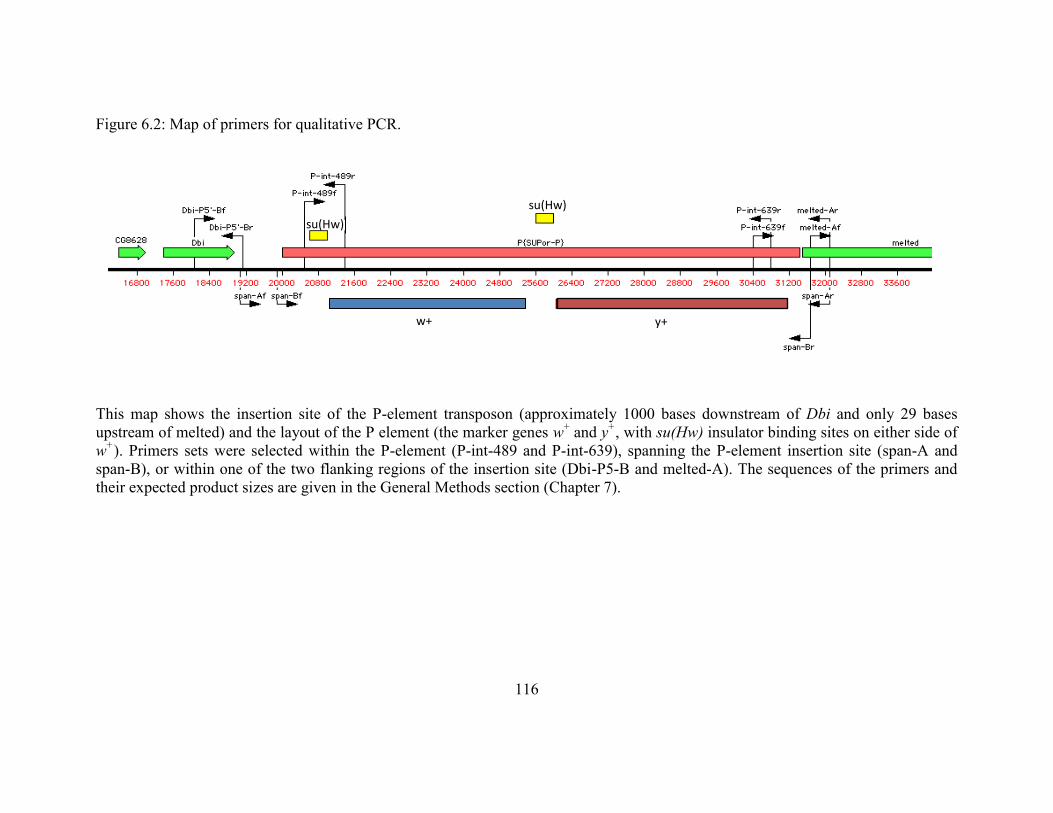
116
Figure 6.2: Map of primers for qualitative PCR.
This map shows the insertion site of the P-element transposon (approximately 1000 bases downstream of Dbi and only 29 bases
upstream of melted) and the layout of the P element (the marker genes w+
and y+, with su(Hw) insulator binding sites on either side of
w+). Primers sets were selected within the P-element (P-int-489 and P-int-639), spanning the P-element insertion site (span-A and
span-B), or within one of the two flanking regions of the insertion site (Dbi-P5-B and melted-A). The sequences of the primers and
their expected product sizes are given in the General Methods section (Chapter 7).
y+ w+
su(Hw) su(Hw)

117
Other primer sets were designed on either side of the sequence flanking the P
element (but outside the P element itself) or within the P element.
Using this strategy, 67 excision mutants were characterized and 55 of these were
precise excisions. There were three imprecise excisions in which flanking DNA had been
removed during the excision, and nine mutants in which the excision had left a portion of
the P element behind.
TOLERANCE TESTS OF P-ELEMENT EXCISION MUTANTS
One of the P-element precise excision mutants, 70a1, was identified using
qualitative PCR. It exhibited the expected product side with three primer sets: Dbi-P5-B,
span-A, and span-B. This mutant was tested for tolerance to ethanol sedation in a knock
down assay, but it failed to develop tolerance (Figure 6.3). This outcome is unexpected
because removing the P element precisely should have removed the insulators and
restored normal DBI expression, rescuing the no-tolerance phenotype.

118
Figure 6.3: The precise excision mutant 70a1 does not become tolerant to ethanol
sedation in a knock down assay.
The mutant 70a1 was created by excising the P element from the mutant 13493. The
excision was verified as precise using qualitative PCR. These flies failed to develop
tolerance to ethanol sedation in a knock down assay.
0 60 120 180
acti
vity
leve
l
time (minutes)
1st sedation
2nd sedation

119
There are a few possible explanations for this result. One explanation is that the
hypothesis was wrong, and either the overexpression of DBI or the no-tolerance
phenotype (or both) was caused by some factor in the genetic background of the mutants
and was unrelated to the primary mutations in the deficiency df-7589 and the P-element
mutant 13493. However, another possibility is that the excision of 70a1 was not actually
precise. ChIP-chip data had revealed that an insulator binding site exists somewhere in
the 1-kb region between Dbi and melted (Figure 4.5). If the excision was almost but not
exactly precise (for example, <10 bases of the flanking region were deleted), it would
look precise in the qualitative PCR assays, but might have removed enough material to
render the su(Hw) binding site defunct. The insulators would still be disrupted, and the
DBI overexpression would persist, as would the lack of tolerance.

120
Chapter 7: General Methods
FLY MAINTENANCE
Flies were raised on a standard cornmeal/agar/molasses medium. The lights in the
room were kept on a 12:12 light:dark cycle, and the temperature was maintained between
20-22°C.
FLY COLLECTION FOR BEHAVIORAL EXPERIMENTS
A culture of flies was cleared of all adults, and then flies were allowed to eclose
for a period of two days. At the end of the two days, the newly eclosed adults were
collected and stored in vials of fresh food until testing. One day before the first treatment,
female flies were collected using a light source and a flypette, a length of flexible tubing
with a plastic pipette tip and a mesh (or cotton) barrier. The light (which uses a compact
florescent bulb to reduce the heat produced) is directed to the closed end of the vial, and
the flies are attracted to the light and don’t escape from the open end, where the flypette
is being inserted to collect flies. The light also allows for easier visual identification of
the female flies. Mouth applied suction is used to trap female flies in the plastic tip so that
they can be transferred to new food vials.

121
DNA COLLECTION (SINGLE FLY PREP)
Individual male flies (males were used to avoid the possibility of females
harboring the DNA of males in heterogeneous collections of flies that were selected
based on the presence of a marker gene) were placed in 0.5 mL tubes and frozen for at
least 20 minutes. Squishing buffer (SB) was prepared according to the following recipe:
10 mM Tris-Cl pH 8.2, 1 mM EDTA, 25 mM NaCl, and 200 µg/mL Proteinase K.
A pipette tip was loaded with 50 µL of SB, and used to mash the fly against the
side of the tube for 10 seconds before expelling the liquid (enough moisture escapes from
the pipette tip to facilitate the squishing process). The flies were incubated at 37°C for 20
minutes, then heated to 95°C for 10 minutes in a thermocycler to inactivate the Proteinase
K. DNA samples were stored at 4°C until being used for qualitative PCR later that day.
POLYMERASE CHAIN REACTION PROTOCOL
Polymerase chain reaction (PCR) was performed by combining 17 mL PCR
SuperMix (Invitrogen, Carlsbad, CA), 1 mL each of the forward and reverse primers (10
mM), and 1 mL of template DNA. A thermocycler was used to heat the samples
according to the following protocol: 5 minutes at 94°C; followed by 30 cycles of: 30
seconds at 94°C, 30 seconds at 55°C, 2 minutes at 72°C; followed by 10 minutes at 72°C;
and holding at 10°C.
The following primers were used.

122
Dbi-P5-B forward:
5’-AGCCTCTTCACTCGGAACTGGTTT-3’
Dbi-P5-B reverse:
5’-GCGGTTTGGACAAACACACTCGAA-3’
Span-A forward:
5’-GCTTTGCAGTACTTTGAACCGCCA-3’
Span-A reverse:
5’-AAGCCGCTCTCTCAATACATCGCT-3’
Span-B forward:
5’-AACGGTAGCAAAGGTGAGAGA-3’
Span-B reverse:
5’-TTCAGCCACAATGCCTTGTTCCAC-3’
P-int-489 forward:
5’-TGACTGTGCGTTAGGTCCTGTTCA-3’
P-int-489 reverse:
5’-GCGATTCGGTTCGCTCAAATGGTT-3’
P-int-639 forward:
5’-TCCTGTCTTGCCACAGAAACCTCA-3’
P-int-639 reverse:
5’-AACCGCTGTTGCCCTATGTTGTTG-3’

123
Melted forward:
5’-GTGGAACAAGCATTGTGGCTGAA-3’
Melted reverse:
5’-AAGCCGCTCTCTCAATACATCGCT-3’
The expected product sizes were Dbi-P5-B: 1095 bp, span-A: 1581 bp, span-B:
330 bp, P-int-489: 911 bp, P-int-639: 404 bp, and melted: 452 bp. The product sizes were
analyzed using gel electrophoresis with an 0.8% agarose/TAE (or 1% agarose/TBE) gel.
Samples were run alongside a ladder sample (various ladders were used according to the
expected product size and availability: NEB 100-bp DNA ladder, NEB 1-kb DNA ladder,
Fermentas DNA ladder mix, and Fermentas generuler 1-kb DNA ladder).

124
Chapter 8: Summary and conclusions
The goal of this project was to identify a novel gene that played a role in tolerance
to ethanol sedation in Drosophila melanogaster. A high-throughput method for
measuring tolerance was developed, along with a series of computer programs that allow
the user to detect movement in groups of flies without watching and scoring their activity
in real time.
This method was applied to a tolerance screen of deficiency mutants on the third
chromosome. A small number of interesting regions were identified, and one in
particular, spanning 9 genes, was pursued further. Real-time PCR analysis was used to
compare the expression levels of these 9 genes between wild type flies and the deficiency
mutant (which was missing one copy of each gene due to the deletion). In most cases, the
deficiency mutant showed similarly low or greatly reduced expression of the genes, but
for one gene, diazepam binding inhibitor (Dbi), gene expression in the deficiency mutant
was much higher than expression in the wild type fly. DBI is an inverse agonist that acts
on the benzodiazepine binding site of the GABAA receptor. Its expression is induced by
chronic ethanol treatment and ethanol withdrawal in mammals, and it might be involved
in the stress response of ethanol withdrawal.
Another Drosophila Dbi mutant was identified, a P-element transposon insertion
found approximately 1 kb downstream of the gene. This mutant also failed to develop
tolerance and showed an even greater level of overexpression than did the deficiency
mutant. Comparing the ethanol responses of the two mutants and wild type flies seemed
to suggest that these flies might be “pre-tolerant” before ever receiving a sedating dose of
ethanol. To test the theory that Dbi overexpression might exert this effect, a UAS-DBI
transgenic fly was created. This transgene was driven with a hs-gal4 driver and heat

125
shock of the flies induced resistance to ethanol sedation. However, heat shock also
induced resistance in the parental controls, although the effect observed in the controls
was much smaller than the effect observed in the experimental cross. The UAS-DBI
transgene was also driven with the neural driver elav-gal4. In this experiment, both the
controls and the experimental cross all developed tolerance (contrary to the expectation
that the overexpression of Dbi in the experimental cross would block the acquisition of
tolerance), but a comparison of the ethanol sensitivity between the experimental cross
and the controls revealed that the former was resistant to ethanol sedation.
Our working hypothesis for why the two mutants (the P-element insertion mutant
13493 and the deficiency mutant df-7589) both overexpressed Dbi centered on insulators,
which are DNA elements that set up boundaries within the DNA to protect genes from
the enhancers of neighboring genes. Dbi has flanking insulator binding sites, and the P-
element inserted into 13493 also contains insulator binding sites. Insulators associate in
pairs, and can sometimes form trans associations with the homologous chromosome. A
deficiency mutation might disrupt an insulator complex by removing one of the two
homologous binding sites and preventing their association. A P-element insertion
mutation might disrupt an insulator complex by introducing new insulator binding sites
that form new associations that disrupt the native associations. In both cases, the
disruption of insulator complexes would allow nearby enhancers to aberrantly increase
transcription of the gene.
To address the insulator theory, a cross was undertaken to excise the P-element
from 13493. Using qualitative PCR, one of the offspring from this cross was identified as
a precise excision of the P element. It was expected that this mutation would rescue the
phenotype and that the mutant would be able to acquire tolerance; however, the mutant
failed to acquire tolerance. This result might indicate that genetic background is

126
responsible for the no-tolerance phenotype rather than the overexpression of Dbi, or it
might indicate that the P-element insertion site was within the native insulator binding
site next to Dbi (the precise location of the insulator binding site is not known). If the
excision was not completely precise (and the qualitative PCR method would be unable to
detect an excision that only removed 10 or fewer bases), the insulator binding site might
have remained disrupted in the excision mutant, allowing high DBI expression to persist.
Based on these results, Dbi remains a promising gene for further study of ethanol
responses in Drosophila.

127
Appendix A: sliding_window.pl
#!/usr/bin/perl
use strict;
use warnings;
#use integer;
#----------------------------------------
#Variables
#----------------------------------------
#dimensions refers to the dimension of a single cell
#The offsets give the location of the cell.
my %Xoffset_hash; my %Yoffset_hash; my %label;
#----------------------------
#INSERT_COORDINATES_HERE
$Xoffset_hash{0}=50;$Yoffset_hash{0}=115;
$Xoffset_hash{1}=367;$Yoffset_hash{1}=113;
#how many cells are in photograph?
my $total_number_of_cells=2;
#dimensions of each cell
my $dimensions="315x280";
#Do not move or alter the following line. The program transfer parameters depends on it.
#END_COORDINATES
#----------------------------
my $brightness_up=300;
#batch number is here so that we can process them into subgroups.
my $number_of_batches;
#The first cell is cell zero, the next one is cell one. So 9 cells would be cell_number=8
my $cell_number;
#Do you want debugging reports turned on? If this is a mystery to you then you don't
want it on.
my $DEBUG=0;
my $x;
my $y=0;
my $input_image1;
my $input_image2;
my $output_image;
my $cell_name;
my $formatted_number;
my $formatted_cell_number;
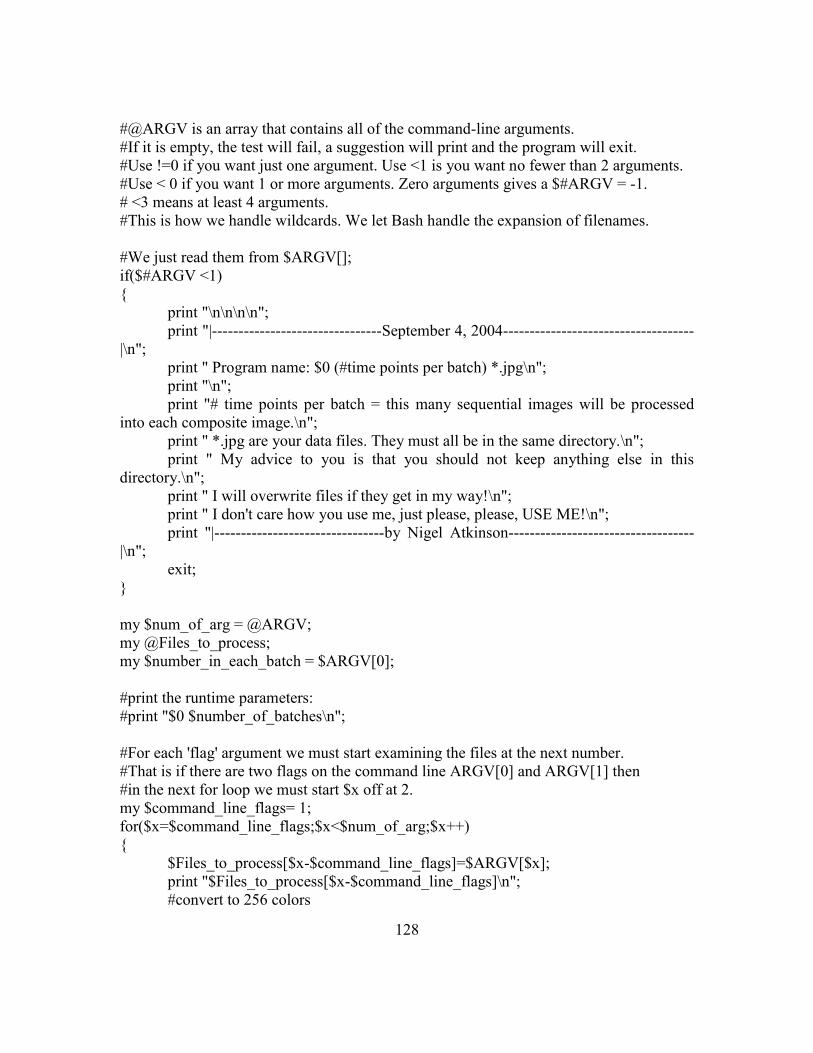
128
#@ARGV is an array that contains all of the command-line arguments.
#If it is empty, the test will fail, a suggestion will print and the program will exit.
#Use !=0 if you want just one argument. Use <1 is you want no fewer than 2 arguments.
#Use < 0 if you want 1 or more arguments. Zero arguments gives a $#ARGV = -1.
# <3 means at least 4 arguments.
#This is how we handle wildcards. We let Bash handle the expansion of filenames.
#We just read them from $ARGV[];
if($#ARGV <1)
{
print "\n\n\n\n";
print "|--------------------------------September 4, 2004------------------------------------
|\n";
print " Program name: $0 (#time points per batch) *.jpg\n";
print "\n";
print "# time points per batch = this many sequential images will be processed
into each composite image.\n";
print " *.jpg are your data files. They must all be in the same directory.\n";
print " My advice to you is that you should not keep anything else in this
directory.\n";
print " I will overwrite files if they get in my way!\n";
print " I don't care how you use me, just please, please, USE ME!\n";
print "|--------------------------------by Nigel Atkinson-----------------------------------
|\n";
exit;
}
my $num_of_arg = @ARGV;
my @Files_to_process;
my $number_in_each_batch = $ARGV[0];
#print the runtime parameters:
#print "$0 $number_of_batches\n";
#For each 'flag' argument we must start examining the files at the next number.
#That is if there are two flags on the command line ARGV[0] and ARGV[1] then
#in the next for loop we must start $x off at 2.
my $command_line_flags= 1;
for($x=$command_line_flags;$x<$num_of_arg;$x++)
{
$Files_to_process[$x-$command_line_flags]=$ARGV[$x];
print "$Files_to_process[$x-$command_line_flags]\n";
#convert to 256 colors

129
print "convert $Files_to_process[$x-$command_line_flags] -depth 8
$Files_to_process[$x-$command_line_flags]\n";
print `convert $Files_to_process[$x-$command_line_flags] -depth 8
$Files_to_process[$x-$command_line_flags]`;
}
$num_of_arg=$num_of_arg-$command_line_flags;
#Crop all files
my $number_new_files;
my $layer_in_Pyramid=1;
$number_of_batches = ($num_of_arg)/$number_in_each_batch;
print " number_of_batches = $number_of_batches\n";
my $original_number_in_each_batch=$number_in_each_batch;
my $previous_batch_no; my $current_batch;
my $zzz;
my $begin_at_this_number; my $end_at_this_number;
#Process one cell at a time
for($cell_number=0; $cell_number<$total_number_of_cells; $cell_number++)
{
print "cell_number=$cell_number,
total_number_of_cell=$total_number_of_cells,
(Xoffset,Yoffset)=($Xoffset_hash{$cell_number},$Yoffset_hash{$cell_number})\n";
#Process a batch at a time
for($current_batch=1;$current_batch<($number_of_batches+1);$current_batch++
)
{
$number_new_files=0;
print "BATCH $current_batch\n";
$previous_batch_no=$current_batch-1;
$begin_at_this_number=$previous_batch_no*$number_in_each_batch;
$end_at_this_number=$current_batch*$number_in_each_batch;
for($x=$begin_at_this_number; $x<$end_at_this_number; $x++)
{
#This loop crops.
$input_image1=$Files_to_process[$x];
$output_image="$current_batch.$layer_in_Pyramid.$number_new_files.jpg";
print "convert -crop
$dimensions+$Xoffset_hash{$cell_number}+$Yoffset_hash{$cell_number}
$input_image1 $output_image\n";

130
print `convert -crop
$dimensions+$Xoffset_hash{$cell_number}+$Yoffset_hash{$cell_number}
$input_image1 $output_image`;
#Mogrify might be used but it overwrites the file. Just in case we
want to do that one day here is the command.
#mogrify -crop 1068x564+141+1049 *.png <--1068x564 is WxH,
141 and 1049 are x and y offsets
$number_new_files++;
}
#foreach batch in steps of 2
# merge file(x) file(x+1)
# keep track of how many files you are producing ->
number_new_files
# Files need to be named like this:
LayerinPyramid.number_new_files so first layer is 1.1, 1.2 etc.
# Each time a file is written you need to increment the
number_new_files variable.
# Increment the LayerinPyramid number by one
# at end of routine set the magic_number=number_new_files
# set number_new_files back to zero.
#In the first pass through we use the data in ARGV later we do not.
while($number_in_each_batch>1)
{
$number_new_files=0;
for($x=0; $x<$number_in_each_batch; $x=$x+2)
{
#Use the following command to join all images in a
pairwise fashion.
$input_image1="$current_batch.$layer_in_Pyramid.$x.jpg";
$input_image2="$current_batch.$layer_in_Pyramid.".($x+1).".jpg";
$output_image="$current_batch.".($layer_in_Pyramid+1).".$number_new_files.j
pg";
print "composite -compose difference $input_image1
$input_image2 $output_image and then ";
print `composite -compose difference $input_image1
$input_image2 $output_image`;
print "unlink $input_image1 $input_image2\n";
unlink $input_image1; unlink $input_image2;
$number_new_files++;

131
#composite InputFile01.png avg.png -compose difference
nobackground01.png
}
$layer_in_Pyramid++;
$number_in_each_batch=$number_in_each_batch/2;
}#end while flag
# Format number with up to 8 leading zeroes
# $result = sprintf("%08d", $number);
#
$formatted_number = sprintf("%05d", $current_batch);
$formatted_cell_number = sprintf("%03d", $cell_number);
$cell_name="cell_$formatted_cell_number.$formatted_number.jpg";
print "mv $output_image $cell_name\n";
print `mv $output_image $cell_name`;
# print "and then unlink $output_image\n";
# print `unlink $output_image`;
#grayscale
print "convert $cell_name -colorspace gray $cell_name\n";
print `convert $cell_name -colorspace gray $cell_name`;
#turn up brightness
print "mogrify -modulate $brightness_up $cell_name\n";
print `mogrify -modulate $brightness_up $cell_name`;
#Restore values to the numbers needed to repeat the entire process with
the next cell
$number_new_files=0;
$layer_in_Pyramid=1;
$number_in_each_batch=$original_number_in_each_batch;
}#end of the batch loop
}#end of the cell for loop
print "Termino\n";
exit;

132
Appendix B: nested_window.pl
#!/usr/bin/perl
use strict;
use warnings;
#use integer;
my $version=1;
#convert 1.3.0.png -fill white -opaque black out.png
#convert 1.3.0.png -fill white -fuzz 5% -opaque black out.png
#convert 1.3.0.png -fill yellow4 -fuzz 50% -opaque white out.png
#
#----------------------------------------
#Variables
#----------------------------------------
#dimensions refers to the dimension of a single cell
#The offsets give the location of the cell.
my %Xoffset_hash; my %Yoffset_hash;
my @spreadsheet_array;
my @identify_array;
my $y=0;
my $which_white=100;
my $column; my $row;
#Do not move or alter the following line. The program transfer parameters depends on it.
#INSERT_COORDINATES_HERE
$Xoffset_hash{0}=272;$Yoffset_hash{0}=900;
$Xoffset_hash{1}=400;$Yoffset_hash{1}=900;
$Xoffset_hash{2}=556;$Yoffset_hash{2}=900;
$Xoffset_hash{3}=676;$Yoffset_hash{3}=900;
$Xoffset_hash{4}=816;$Yoffset_hash{4}=900;
$Xoffset_hash{5}=976;$Yoffset_hash{5}=900;
$Xoffset_hash{6}=1104;$Yoffset_hash{6}=900;
$Xoffset_hash{7}=1240;$Yoffset_hash{7}=900;
$Xoffset_hash{8}=1380;$Yoffset_hash{8}=900;
$Xoffset_hash{9}=1516;$Yoffset_hash{9}=900;
$Xoffset_hash{10}=1668;$Yoffset_hash{10}=900;
$Xoffset_hash{11}=1800;$Yoffset_hash{11}=900;
#how many cells are in photograph?
my $number_of_cells_per_image=12;
#dimensions of each cell
my $dimensions="120x232";

133
#Do not move or alter the following line. The program transfer parameters depends on it.
#END_COORDINATES
#To what degree should we brighten the final image?
my $brightness_up=300;
#The first cell is cell zero, the next one is cell one.
#$cell_number is the current cell that we are working with.
my $cell_number;
#Do you want debugging reports turned on? If this is a mystery to you then you don't
want it on.
my $DEBUG=0;
my $x;
my $input_image1; my $input_image2; my $output_image;
my $cell_name;
my $formatted_number;
#@ARGV is an array that contains all of the command-line arguments.
#If it is empty, the test will fail, a suggestion will print and the program will exit.
#Use !=0 if you want just one argument. Use <1 is you want no fewer than 2 arguments.
#Use < 0 if you want 1 or more arguments. Zero arguments gives a $#ARGV = -1.
# <3 means at least 4 arguments.
#This is how we handle wildcards. We let Bash handle the expansion of filenames.
#We just read them from $ARGV[];
if($#ARGV < 0)
{
print "\n\n\n\n";
print "|----------------------------November 15, 2006--------------------------------|\n";
print " Program name: $0 *.jpg\n";
print " version #$version\n";
print "\n";
print " *.jpg are your data files. They must all be in the same directory as $0.\n";
print " I use a moving window in which consecutive files are compared and the
window\n";
print " moves in increments of 1.\n";
print " That is; the comparisons will be file2-file1, file3-file2, file4-file3, etc.\n";
print " In this program the manner in which the window moves is not
adjustable.\n";
print "\n";
print " My advice to you is that you should not keep anything else in this
directory.\n";
print " I will overwrite files if they get in my way!\n";
print " I will output the white values in results.txt\n";

134
print " I acccept wild cards, but not Visa or Mastercard.\n";
print "|----------------------------by Nigel Atkinson--------------------------------|\n";
exit;
}
else
{
print "version #$version\n";
}
#----------------------------------------------------
#open the outputfile which will store the spreadsheet
#This will be a tab delimited text file.
my $output_file;
$output_file="results.txt";
unless(open(OUTPUTFILE,">$output_file"))
{
print("\ncannot open $output_file\n");
exit;
}
#----------------------------------------------------
my $number_of_timepoints = @ARGV;
my @Files_to_process;
print "number_of_cells_per_image=$number_of_cells_per_image\n";
print "number_of_timepoints = $number_of_timepoints\n";
for($x=0;$x<$number_of_timepoints;$x++)
{
$Files_to_process[$x]=$ARGV[$x];
print "$Files_to_process[$x]\n";
#convert to 256 colors
print `convert $Files_to_process[$x] -depth 8 $Files_to_process[$x]`;
}
#Process one cell at a time
for($cell_number=0; $cell_number<$number_of_cells_per_image; $cell_number++)
{
print "cell$cell_number,
number_of_cells_per_image=$number_of_cells_per_image,
(Xoffset,Yoffset)=($Xoffset_hash{$cell_number},$Yoffset_hash{$cell_number})
number_of_timepoints=$number_of_timepoints\n";

135
#Insert the column names into the spreadsheet array
$spreadsheet_array[$cell_number][0]= "cell$cell_number";
#cell_number is the current cell that we are working on.
#we start at cell 1 so that $Files_to_process[$x-1] can begin with cell 0.
for($x=0; $x<($number_of_timepoints); $x++)
{
#This loop crops and simultaneously converts to jpg.
$input_image1=$Files_to_process[($x)];
$output_image="crop$cell_number.$x.jpg";
#print "convert -crop
$dimensions+$Xoffset_hash{$cell_number}+$Yoffset_hash{$cell_number}
$input_image1 $output_image\n";
print `convert -crop
$dimensions+$Xoffset_hash{$cell_number}+$Yoffset_hash{$cell_number}
$input_image1 $output_image`;
}#end of cropping loop
#The next loop begins with 1 because 0 contains the first image which is too be
subtracted from each and every
#image in the series.
for($x=1; $x<($number_of_timepoints); $x++)
{
$input_image1="crop$cell_number.".($x-1).".jpg";
$input_image2="crop$cell_number.$x.jpg";
#$output_image="diff$cell_number.$x.jpg";
#output_image has been replaced with cell name.
# Format batch number with 3 digits
$formatted_number = sprintf("%05d", $x);
$cell_name="cell_$cell_number.$formatted_number.jpg";
#This is the subtraction.
#print "composite -compose difference $input_image1 $input_image2
$cell_name\n";
print `composite -compose difference $input_image1 $input_image2
$cell_name`;
#grayscale
#print "convert $cell_name -colorspace gray $cell_name\n";

136
print `convert $cell_name -colorspace gray $cell_name`;
#turn up brightness/contrast
#print "mogrify -modulate $brightness_up $cell_name\n";
print `mogrify -modulate $brightness_up $cell_name`;
#Harvest the information from the file. This contains the white values.
@identify_array= `identify -verbose $cell_name`;
print "$cell_name image manipulated\n";
my $white=0;
for($y=0; $y<@identify_array; $y++)
{
#Histogram:
# 247541: (0, 0, 0) black
# 2459: (240,240,240) grey94
# 5: ( 87, 87, 87) grey34
#This will harvest the black number.
#if($array[$y]=~/\w+(\d+):\s\(\s*\d+,\s*\d+,\s*\d+\)\s*black$/)
#{
#$black=$1;
#}
#Let's use grey29 as a default. I think that grey 29 is ( 72, 72, 72).
#In the statement below we really don't need to capture $2, $3 &
$4. However, we might be able to use it
#as a way to confirm that all of the values are the same. If this is
grey scale then all should be
#the same value.
if($identify_array[$y]=~/\s*(\d+): \(\s*(\d+),\s*(\d+),/)
{
#Now collect all of the greys that we want to call white.
#First guess was 72
#$which_white contains the white value to be used. You
can define it at the beginning of the program.
if($2>=$which_white)
{
$white=$white+$1;
#print "\n$1: ( $2,$3,$4)\n";
}
}
}
#$cell_number is how we want each column in the spreadsheet to begin.

137
#It would be nice to store this in an 2 dim array.
#spreadsheet_array[column][row] where the columns are different cells
and the row are differnt times.
$spreadsheet_array[$cell_number][$x]= "$white";
}#end of batch loop
#remove old files
print `rm crop*`;
}#end of cell for loop
#for($row=0; $row<$number_of_timepoints; $row++)
for $row(0 .. ($number_of_timepoints-1))
{
for $column(0 .. $#spreadsheet_array)
{
#for $row(1 .. $#{$spreadsheet_array[$column]})
print OUTPUTFILE $spreadsheet_array[$column][$row]."\t";
}
print OUTPUTFILE "\n";
}
print "Termino\n";
exit;

138
Appendix C: compare2first_staggered.pl
#!/usr/bin/perl
use strict;
use warnings;
#use integer;
my $version=2;
#
#----------------------------------------
#Variables
#----------------------------------------
#dimensions refers to the dimension of a single cell
#The offsets give the location of the cell.
my %Xoffset_hash; my %Yoffset_hash;
my @spreadsheet_array;
my @identify_array;
my $y=0;
my $which_white=72;
my $column; my $row;
#Do not move or alter the following line. The program transfer parameters depends on it.
#INSERT_COORDINATES_HERE
$Xoffset_hash{0}=99;$Yoffset_hash{0}=585;
$Xoffset_hash{1}=267;$Yoffset_hash{1}=585;
$Xoffset_hash{2}=438;$Yoffset_hash{2}=585;
$Xoffset_hash{3}=588;$Yoffset_hash{3}=585;
$Xoffset_hash{4}=753;$Yoffset_hash{4}=585;
$Xoffset_hash{5}=903;$Yoffset_hash{5}=585;
$Xoffset_hash{6}=1068;$Yoffset_hash{6}=585;
$Xoffset_hash{7}=1230;$Yoffset_hash{7}=585;
$Xoffset_hash{8}=1380;$Yoffset_hash{8}=585;
$Xoffset_hash{9}=1533;$Yoffset_hash{9}=585;
$Xoffset_hash{10}=1692;$Yoffset_hash{10}=585;
$Xoffset_hash{11}=1836;$Yoffset_hash{11}=585;
#how many cells are in photograph?
my $number_of_cells_per_image=12;
#dimensions of each cell
my $dimensions="129x411";
#Do not move or alter the following line. The program transfer parameters depends on it.
#END_COORDINATES
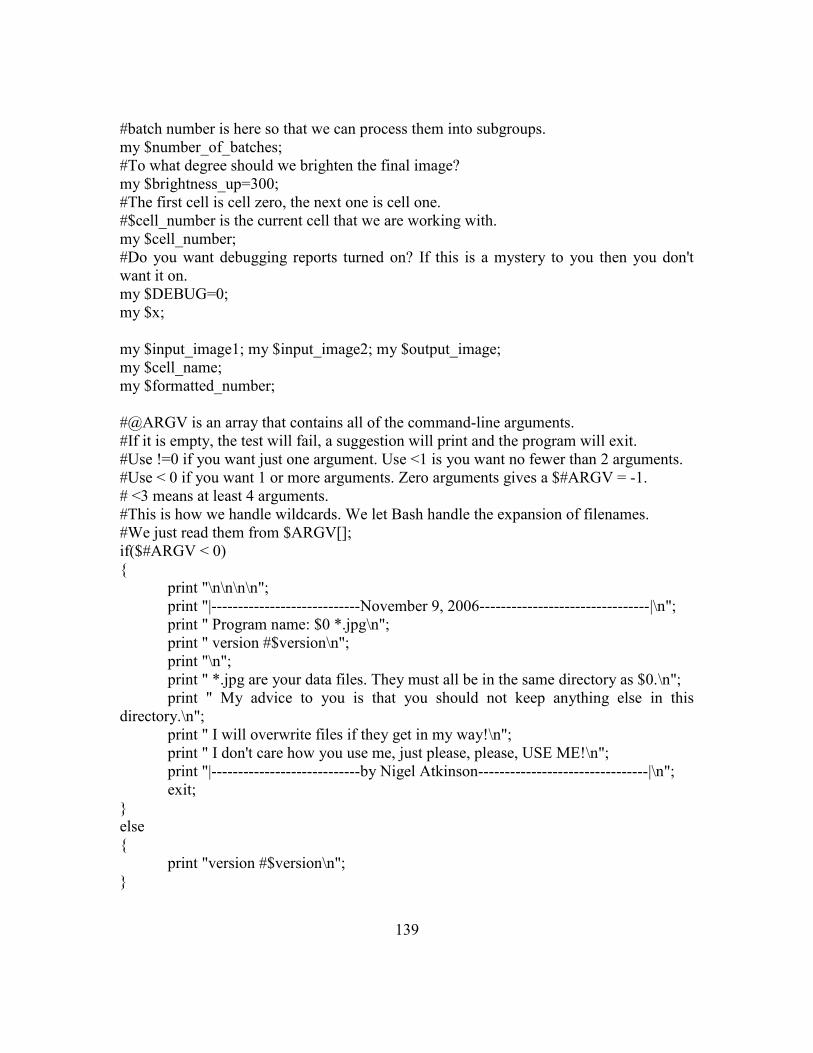
139
#batch number is here so that we can process them into subgroups.
my $number_of_batches;
#To what degree should we brighten the final image?
my $brightness_up=300;
#The first cell is cell zero, the next one is cell one.
#$cell_number is the current cell that we are working with.
my $cell_number;
#Do you want debugging reports turned on? If this is a mystery to you then you don't
want it on.
my $DEBUG=0;
my $x;
my $input_image1; my $input_image2; my $output_image;
my $cell_name;
my $formatted_number;
#@ARGV is an array that contains all of the command-line arguments.
#If it is empty, the test will fail, a suggestion will print and the program will exit.
#Use !=0 if you want just one argument. Use <1 is you want no fewer than 2 arguments.
#Use < 0 if you want 1 or more arguments. Zero arguments gives a $#ARGV = -1.
# <3 means at least 4 arguments.
#This is how we handle wildcards. We let Bash handle the expansion of filenames.
#We just read them from $ARGV[];
if($#ARGV < 0)
{
print "\n\n\n\n";
print "|----------------------------November 9, 2006--------------------------------|\n";
print " Program name: $0 *.jpg\n";
print " version #$version\n";
print "\n";
print " *.jpg are your data files. They must all be in the same directory as $0.\n";
print " My advice to you is that you should not keep anything else in this
directory.\n";
print " I will overwrite files if they get in my way!\n";
print " I don't care how you use me, just please, please, USE ME!\n";
print "|----------------------------by Nigel Atkinson--------------------------------|\n";
exit;
}
else
{
print "version #$version\n";
}

140
#----------------------------------------------------
#open the outputfile which will store the spreadsheet
#This will be a tab delimited text file.
my $output_file;
$output_file="results.txt";
unless(open(OUTPUTFILE,">$output_file"))
{
print("\ncannot open $output_file\n");
exit;
}
#----------------------------------------------------
my $num_of_arg = @ARGV;
my @Files_to_process;
#$number_of_timepoints is the same for each cell.
#However, in the staggered version of the program (this one) each cell is added in
consecutive images.
#So cell0 is added in the first picture, cell1 in picture 2, cell2 in picture 3, etc.
#So if we have 3 cells and we have taken 100 timeponts then we can only process 97 of
those timepoints.
#In each case the first timepoint FOR EACH CELL is being subtracted from all of the
rest. This should produce
#96 datapoints.
#For the first round of substractions for each cell this would be:
#image1cell0 - image0cell0, etc. AND image2cell1 - image1cell1, etc. AND image3cell2
- image2cell2, etc.)
#$number_of_timepoints gives the number of cells to manipulate but it does not tell us
where to start our manipulations.
my $number_of_timepoints = ($num_of_arg-$number_of_cells_per_image);
print "number of image files found=$num_of_arg\n";
print "number_of_cells_per_image=$number_of_cells_per_image\n";
print "actual number_of_timepoints to be produced=$number_of_timepoints\n";
for($x=0;$x<$num_of_arg;$x++)
{
$Files_to_process[$x]=$ARGV[$x];
print "$Files_to_process[$x]\n";
#convert to 256 colors
#print "convert $Files_to_process[$x] -depth 8 $Files_to_process[$x]\n";
print `convert $Files_to_process[$x] -depth 8 $Files_to_process[$x]`;
}

141
#$number_of_batches = ($num_of_arg)/$number_in_each_batch;
#print " number_of_batches = $number_of_batches\n";
#Process one cell at a time
#cell_number is the current cell that we are working on.
for($cell_number=0; $cell_number<$number_of_cells_per_image; $cell_number++)
{
print "cell$cell_number,
number_of_cells_per_image=$number_of_cells_per_image,
(Xoffset,Yoffset)=($Xoffset_hash{$cell_number},$Yoffset_hash{$cell_number})
number_of_timepoints=$number_of_timepoints\n";
#Insert the column names into the spreadsheet array
$spreadsheet_array[$cell_number][0]= "cell$cell_number";
my $final_cell=$num_of_arg-$cell_number;
for($x=0; $x<($final_cell); $x++)
{
#This loop crops and simultaneously converts to jpg.
#The blank for cell_number 0 is in $Files_to_process[0].
#The blank for cell_number 1 is in $Files_to_process[1].
$input_image1=$Files_to_process[($x+$cell_number)];
#The next line is the reason that the loop must count from 0 to the $final
cell number.
#This makes all of the consecuitively added tubes equivalent.
#They must be consequitively numbered from zero for the next loop to
work properly.
$output_image="crop$cell_number.$x.jpg";
#print "convert -crop
$dimensions+$Xoffset_hash{$cell_number}+$Yoffset_hash{$cell_number}
$input_image1 $output_image\n";
print `convert -crop
$dimensions+$Xoffset_hash{$cell_number}+$Yoffset_hash{$cell_number}
$input_image1 $output_image`;
}#end of cropping loop
#The next loop begins with 1 because 0 contains the first image which is too be
subtracted from each and every
#image in the series.
for($x=1; $x<($number_of_timepoints+1); $x++)
{

142
$input_image1="crop$cell_number.0.jpg";
$input_image2="crop$cell_number.$x.jpg";
#$output_image="diff$cell_number.$x.jpg";
#output_image has been replaced with cell name.
# Format batch number with 3 digits
$formatted_number = sprintf("%05d", $x);
$cell_name="cell_$cell_number.$formatted_number.jpg";
print `composite -compose difference $input_image1 $input_image2
$cell_name`;
#grayscale
print `convert $cell_name -colorspace gray $cell_name`;
#turn up brightness/contrast
print `mogrify -modulate $brightness_up $cell_name`;
#Harvest the information from the file. This contains the white values.
@identify_array= `identify -verbose $cell_name`;
print "$cell_name image manipulated\n";
my $white=0;
for($y=0; $y<@identify_array; $y++)
{
#Histogram:
# 247541: (0, 0, 0) black
# 2459: (240,240,240) grey94
# 5: ( 87, 87, 87) grey34
#This will harvest the black number.
#if($array[$y]=~/\w+(\d+):\s\(\s*\d+,\s*\d+,\s*\d+\)\s*black$/)
#{
#$black=$1;
#}
#Let's use grey29 as a default. I think that grey 29 is ( 72, 72, 72).
#In the statement below we really don't need to capture $2, $3 &
$4. However, we might be able to use it
#as a way to confirm that all of the values are the same. If this is
grey scale then all should be
#the same value.
if($identify_array[$y]=~/\s*(\d+): \(\s*(\d+),\s*(\d+),/)

143
{
#Now collect all of the greys that we want to call white.
#First guess was 72
#$which_white contains the white value to be used. You
can define it at the beginning of the program.
if($2>=$which_white)
{
$white=$white+$1;
#print "\n$1: ( $2,$3,$4)\n";
}
}
}
#$cell_number is how we want each column in the spreadsheet to begin.
#It would be nice to store this in an 2 dim array.
#spreadsheet_array[column][row] where the columns are different cells
and the row are differnt times.
$spreadsheet_array[$cell_number][$x]= "$white";
}#end of batch loop
}#end of cell for loop
#remove old files
print `rm crop*`;
for $row(0 .. ($number_of_timepoints))
{
for $column(0 .. $#spreadsheet_array)
{
#for $row(1 .. $#{$spreadsheet_array[$column]})
print OUTPUTFILE $spreadsheet_array[$column][$row]."\t";
}
print OUTPUTFILE "\n";
}
#
#
#
print "Termino\n";
exit;

144
Appendix D: tellmewhentheymove.pl
#!/usr/bin/perl
use strict;
use warnings;
#use integer;
my $version=1;
my $expected_ImageMagick_version = "6.3.5";
my $acceptable_IM_version = "6.1.8";
#
#----------------------------------------
#Variables
#----------------------------------------
#dimensions refers to the dimension of a single cell
#The offsets give the location of the cell.
my %Xoffset_hash; my %Yoffset_hash;
my @spreadsheet_array;
my @identify_array;
my $y=0;
my $which_white=72;
my $column; my $row;
my @awake_in_cell;
#Do not move or alter the following line. The program transfer parameters depends on it.
#INSERT_COORDINATES_HERE
#exp
$Xoffset_hash{0}=389;$Yoffset_hash{0}=236;
$Xoffset_hash{1}=279;$Yoffset_hash{1}=276;
$Xoffset_hash{2}=435;$Yoffset_hash{2}=346;
$Xoffset_hash{3}=191;$Yoffset_hash{3}=367;
$Xoffset_hash{4}=271;$Yoffset_hash{4}=364;
$Xoffset_hash{5}=326;$Yoffset_hash{5}=411;
$Xoffset_hash{6}=212;$Yoffset_hash{6}=438;
$Xoffset_hash{7}=453;$Yoffset_hash{7}=494;
$Xoffset_hash{8}=246;$Yoffset_hash{8}=528;
$Xoffset_hash{9}=315;$Yoffset_hash{9}=577;
$Xoffset_hash{10}=94;$Yoffset_hash{10}=650;
#cntrl
$Xoffset_hash{11}=174;$Yoffset_hash{11}=1024;
$Xoffset_hash{12}=195;$Yoffset_hash{12}=1081;
$Xoffset_hash{13}=340;$Yoffset_hash{13}=1121;

145
$Xoffset_hash{14}=335;$Yoffset_hash{14}=1171;
$Xoffset_hash{15}=439;$Yoffset_hash{15}=1189;
$Xoffset_hash{16}=320;$Yoffset_hash{16}=1201;
$Xoffset_hash{17}=442;$Yoffset_hash{17}=1243;
$Xoffset_hash{18}=266;$Yoffset_hash{18}=1235;
$Xoffset_hash{19}=176;$Yoffset_hash{19}=1264;
$Xoffset_hash{20}=393;$Yoffset_hash{20}=1302;
$Xoffset_hash{21}=252;$Yoffset_hash{21}=1328;
$Xoffset_hash{22}=305;$Yoffset_hash{22}=1380;
$Xoffset_hash{23}=386;$Yoffset_hash{23}=1370;
$Xoffset_hash{24}=470;$Yoffset_hash{24}=1460;
$Xoffset_hash{25}=322;$Yoffset_hash{25}=1493;
#how many cells are in photograph?
my $number_of_cells_per_image=10;
##dimensions of each cell
my $dimensions="15x15";
#END_COORDINATES
#batch number is here so that we can process them into subgroups.
my $number_of_batches;
#To what degree should we brighten the final image?
my $brightness_up=300;
#The first cell is cell zero, the next one is cell one.
#$cell_number is the current cell that we are working with.
my $cell_number;
#Do you want debugging reports turned on? If this is a mystery to you then you don't
want it on.
my $DEBUG=0;
my $x;
my $input_image1; my $input_image2; my $output_image;
my $cell_name;
my $formatted_number;
#@ARGV is an array that contains all of the command-line arguments.
#If it is empty, the test will fail, a suggestion will print and the program will exit.
#Use !=0 if you want just one argument. Use <1 is you want no fewer than 2 arguments.
#Use < 0 if you want 1 or more arguments. Zero arguments gives a $#ARGV = -1.
# <3 means at least 4 arguments.
#This is how we handle wildcards. We let Bash handle the expansion of filenames.
#We just read them from $ARGV[];
if($#ARGV < 0)
146
{
print "\n\n\n\n";
print "|-----------------------------August 22, 2007---------------------------------|\n";
print " Program name: $0\n";
print " version #$version\n";
print "\n";
print " My purpose is to watch individual flies and to record when they \"wake
up\".\n";
print " The first image in series must be without animals. It is the blank.\n";
print " You will set the coordinates to be a tight fitting boxes around each
animal.\n";
print " As long as the animal remains in place it will generate a white signal.\n";
print " When the animal moves the white signal will drop to zero.\n";
print " The data for each timepoint will be stored in \"results.txt\".\n";
print " The time at which each animal moved will be stored in
\"whenawake_nn.txt\"\n";
print " in which \"nn\" specifies the time interval\n";
print " Each cell is processed until the animal wakes up and then I stop.\n";
print "\n";
print " Example:\n";
print " $0 *.JPG 30\n";
print " The *.JPG will insure that all images which end in *.JPG will be
processed.\n";
print " They must all be in the same directory as the program.\n";
print " The \"30\" indicates that the time between each photo is 30 time units.\n";
print " The time is unit-less and so it might be seconds, minutes or hours.\n";
print " If you don't want to specify a time interval then just insert a 1 and the\n";
print " time variable will specifiy the image number.\n";
print " \n";
print " My advice to you is that you should not keep anything else in this
directory.\n";
print " I will overwrite files if they get in my way!\n";
print "\n";
print " I don't care how you use me, just please, please, USE ME!\n";
print "|----------------------------by Nigel Atkinson--------------------------------|\n";
exit;
}
else
{
print "version #$version\n";
}
my $version_checker=`identify -version`;

147
my $versionofimagemagick;
#Data looks like this:
#Version: ImageMagick 6.3.5 07/28/07 Q16 http://www.imagemagick.org
if($version_checker=~/Version: ImageMagick (\S+)/)
{
$versionofimagemagick = $1;
if($expected_ImageMagick_version ne $versionofimagemagick &&
$acceptable_IM_version ne $versionofimagemagick)
{
print "This script expects version
$expected_ImageMagick_version.\n";
print "You are using version $versionofimagemagick\n";
print "Contact Nigel Atkinson to get an updated script.\n";
exit;
}
}
else
{
print "I cannot determine the ImageMagick version.\n";
print "I expect that the command \"identify -version\" will return the
version number\n";
print "Contact Nigel Atkinson to get an updated script.\n";
exit;
}
#----------------------------------------------------
#open the outputfile which will store the spreadsheet
#This will be a tab delimited text file.
my $output_file;
$output_file="results.txt";
unless(open(OUTPUTFILE,">$output_file"))
{
print("\ncannot open $output_file\n");
exit;
}
#----------------------------------------------------
my $number_of_timepoints = @ARGV;
my @Files_to_process;
#$number_of_timepoints is the same for each cell.
#However, in the staggered version of the program (this one) each cell is added in
consecutive images.

148
#So cell0 is added in the first picture, cell1 in picture 2, cell2 in picture 3, etc.
#So if we have 3 cells and we have taken 100 timeponts then we can only process 97 of
those timepoints.
#In each case the first timepoint FOR EACH CELL is being subtracted from all of the
rest. This should produce
#96 datapoints.
#For the first round of substractions for each cell this would be:
#image1cell0 - image0cell0, etc. AND image2cell1 - image1cell1, etc. AND image3cell2
- image2cell2, etc.)
#$number_of_timepoints gives the number of cells to manipulate but it does not tell us
where to start our manipulations.
#my $number_of_timepoints = ($number_of_timepoints-$number_of_cells_per_image);
#Decrement this because the last value is the time interval.
#The time interval (last argument) is @ARGV-1 because we reference them from 0. The
means that the for loops will work
#when reading arguments if you start counting from 0.
$number_of_timepoints--;
my $timeinterval=$ARGV[$number_of_timepoints];
print "timeinterval=$timeinterval\n";
print "number of image files found=$number_of_timepoints\n";
print "number_of_cells_per_image=$number_of_cells_per_image\n";
print "actual number_of_timepoints to be produced=$number_of_timepoints\n";
for($x=0;$x<$number_of_timepoints;$x++)
{
$Files_to_process[$x]=$ARGV[$x];
print "$Files_to_process[$x]\n";
#convert to 256 colors
#print "convert $Files_to_process[$x] -depth 8 $Files_to_process[$x]\n";
print `convert $Files_to_process[$x] -depth 8 $Files_to_process[$x]`;
}
for($cell_number=0; $cell_number<$number_of_cells_per_image; $cell_number++)
{
print "cell$cell_number,
number_of_cells_per_image=$number_of_cells_per_image,
(Xoffset,Yoffset)=($Xoffset_hash{$cell_number},$Yoffset_hash{$cell_number})
number_of_timepoints=$number_of_timepoints\n";
#Insert the column names into the spreadsheet array
149
$spreadsheet_array[$cell_number][0]= "cell$cell_number";
#my $final_cell=$number_of_timepoints-$cell_number;
#mark
$input_image1=$Files_to_process[(0)];
$output_image="crop$cell_number.0.jpg";
print `convert -crop
$dimensions+$Xoffset_hash{$cell_number}+$Yoffset_hash{$cell_number}
$input_image1 $output_image`;
for($x=1; $x<($number_of_timepoints); $x++)
{
#This loop crops and simultaneously converts to jpg.
#The blank for cell_number 0 is in $Files_to_process[0].
#The blank for cell_number 1 is in $Files_to_process[1].
#$input_image1=$Files_to_process[($x+$cell_number)];
$input_image1=$Files_to_process[($x)];
#The next line is the reason that the loop must count from 0 to the
$final cell number.
#This makes all of the consecuitively added tubes equivalent.
#They must be consequitively numbered from zero for the next
loop to work properly.
$output_image="crop$cell_number.$x.jpg";
#print "convert -crop
$dimensions+$Xoffset_hash{$cell_number}+$Yoffset_hash{$cell_number}
$input_image1 $output_image\n";
print `convert -crop
$dimensions+$Xoffset_hash{$cell_number}+$Yoffset_hash{$cell_number}
$input_image1 $output_image`;
$input_image1="crop$cell_number.0.jpg";
$input_image2="crop$cell_number.$x.jpg";
#$output_image="diff$cell_number.$x.jpg";
#output_image has been replaced with cell name.
# Format batch number with 3 digits
$formatted_number = sprintf("%05d", $x);
$cell_name="cell_$cell_number.$formatted_number.jpg";
print `composite -compose difference $input_image1
$input_image2 $cell_name`;
150
#grayscale
print `convert $cell_name -colorspace gray $cell_name`;
#turn up brightness/contrast
print `mogrify -modulate $brightness_up $cell_name`;
#Harvest the information from the file. This contains the white
values.
@identify_array= `identify -verbose $cell_name`;
print "$cell_name image manipulated\n";
my $white=0;
for($y=0; $y<@identify_array; $y++)
{
#Histogram:
# 247541: (0, 0, 0) black
# 2459: (240,240,240) grey94
# 5: ( 87, 87, 87) grey34
#This will harvest the black number.
#if($array[$y]=~/\w+(\d+):\s\(\s*\d+,\s*\d+,\s*\d+\)\s*black$/)
#{
#$black=$1;
#}
#Let's use grey29 as a default. I think that grey 29 is ( 72,
72, 72).
#In the statement below we really don't need to capture $2,
$3 & $4. However, we might be able to use it
#as a way to confirm that all of the values are the same. If
this is grey scale then all should be
#the same value.
if($identify_array[$y]=~/\s*(\d+): \(\s*(\d+),\s*(\d+),/)
{
#Now collect all of the greys that we want to call
white.
#First guess was 72
#$which_white contains the white value to be used.
You can define it at the beginning of the program.
if($2>=$which_white)
{
$white=$white+$1;
#print "\n$1: ( $2,$3,$4)\n";
151
}
}
if($expected_ImageMagick_version eq
$versionofimagemagick)
{
if($identify_array[$y+1]=~/\s*Colormap/)
{
#last;
$y=@identify_array;
}
}
}
#$cell_number is how we want each column in the spreadsheet to
begin.
#It would be nice to store this in an 2 dim array.
#spreadsheet_array[column][row] where the columns are different
cells and the row are differnt times.
$spreadsheet_array[$cell_number][$x]= "$white";
if($white==0)
{
$awake_in_cell[$cell_number]=$x;
$x=$number_of_timepoints+1;
}
}#end of batch loop
#remove old files
print `rm crop*`;
#}
}#end of cell for loop
my @time_column_labels;
$time_column_labels[0]="time";
for $row(1 .. ($number_of_timepoints))
{
$time_column_labels[$row]=$row*$timeinterval;
}
print "Saving the spreadsheet\n";
for $row(0 .. ($number_of_timepoints))
{

152
print OUTPUTFILE "$time_column_labels[$row]\t";
for $column(0 .. $#spreadsheet_array)
{
#for $row(1 .. $#{$spreadsheet_array[$column]})
print OUTPUTFILE $spreadsheet_array[$column][$row]."\t";
}
print OUTPUTFILE "\n";
}
close OUTPUTFILE;
#----------------------------------------------------
#open the outputfile which will store the spreadsheet
#This will be a tab delimited text file.
$output_file="whenawake_$timeinterval.txt\n";
unless(open(OUTPUTFILE,">$output_file"))
{
print("\ncannot open $output_file\n");
exit;
}
#----------------------------------------------------
my $line1="";
my $line2="";
for($cell_number=0; $cell_number<$number_of_cells_per_image; $cell_number++)
{
$line1=$line1."cell_$cell_number\t";
my $temp=$awake_in_cell[$cell_number]*$timeinterval;
$line2=$line2."$temp\t";
print "cell_number $cell_number awake in cell $awake_in_cell[$cell_number]\n";
}
$line1=$line1."\n";
$line2=$line2."\n";
print "$line1$line2\n";
print OUTPUTFILE "$line1$line2\n";
print "Termino\n";
exit;
153
References
Abarca, C., Albrecht, U., and Spanagel, R. (2002). Cocaine sensitization and reward are
under the influence of circadian genes and rhythm. Proceedings of the National
Academy of Sciences of the United States of America 99, 9026–9030.
Adams, M. D., Celniker, S. E., Holt, R. A., Evans, C. A., Gocayne, J. D., Amanatides, P.
G., Scherer, S. E., Li, P. W., Hoskins, R. A., Galle, R. F., et al. (2000). The genome
sequence of Drosophila melanogaster. Science 287, 2185–2195.
Andretic, R., Chaney, S., and Hirsh, J. (1999). Requirement of circadian genes for
cocaine sensitization in Drosophila. Science 285, 1066–1068.
Ashton, K., Wagoner, A. P., Carrillo, R., and Gibson, G. (2001). Quantitative trait loci
for the monoamine-related traits heart rate and headless behavior in Drosophila
melanogaster. Genetics 157, 283–294.
Bainton, R. J., Tsai, L. T., Singh, C. M., Moore, M. S., Neckameyer, W. S., and
Heberlein, U. (2000). Dopamine modulates acute responses to cocaine, nicotine and
ethanol in Drosophila. Curr Biol 10, 187–194.
Berger, K. H., Heberlein, U., and Moore, M. S. (2004). Rapid and chronic: two distinct
forms of ethanol tolerance in Drosophila. Alcoholism, clinical and experimental
research 28, 1469–1480.
Berger, K. H., Kong, E. C., Dubnau, J., Tully, T., Moore, M. S., and Heberlein, U.
(2008). Ethanol sensitivity and tolerance in long-term memory mutants of
Drosophila melanogaster. Alcoholism, clinical and experimental research 32, 895–
908.
Bhandari, P., Hill, J. S., Farris, S. P., Costin, B., Martin, I., Chan, C.-L., Alaimo, J. T.,
Bettinger, J. C., Davies, a G., Miles, M. F., et al. (2012). Chloride intracellular
channels modulate acute ethanol behaviors in Drosophila, Caenorhabditis elegans
and mice. Genes, brain, and behavior 11, 387–397.
Bhandari, P., Kendler, K. S., Bettinger, J. C., Davies, A. G., and Grotewiel, M. (2009).
An assay for evoked locomotor behavior in Drosophila reveals a role for integrins in
ethanol sensitivity and rapid ethanol tolerance. Alcoholism, clinical and
experimental research 33, 1794–1805.
Bormann, J. (1991). Electrophysiological characterization of diazepam binding inhibitor
(DBI) on GABAA receptors. Neuropharmacology 30, 1387–1389.

154
Brower, K. J. (2003). Insomnia, alcoholism and relapse. Sleep medicine reviews 7, 523–
539.
Buckingham, S. D., Higashino, Y., and Sattelle, D. B. (2009). Allosteric modulation by
benzodiazepines of GABA-gated chloride channels of an identified insect motor
neurone. Invertebrate neuroscience : IN 9, 85–89.
Cadieu, N., Cadieu, J., El Ghadraoui, L., Grimal, A., and Lamboeuf, Y. (1999).
Conditioning to ethanol in the fruit fly-a study using an inhibitor of ADH. J Insect
Physiol 45, 579–586.
Campbell, J. L., and Nash, H. A. (2001). Volatile general anesthetics reveal a
neurobiological role for the white and brown genes of Drosophila melanogaster.
Journal of neurobiology 49, 339–349.
Casad, M. E., Yu, L., Daniels, J. P., Wolf, M. J., and Rockman, H. a (2012). Deletion of
Siah-interacting protein gene in Drosophila causes cardiomyopathy. Molecular
genetics and genomics : MGG 287, 351–360.
Chen, J., Zhang, Y., and Shen, P. (2008). A protein kinase C activity localized to
neuropeptide Y-like neurons mediates ethanol intoxication in Drosophila
melanogaster. Neuroscience 156, 42–47.
Chen, J., Zhang, Y., and Shen, P. (2010). Protein kinase C deficiency-induced alcohol
insensitivity and underlying cellular targets in Drosophila. Neuroscience 166, 34–39.
Chen, S., Lee, A. Y., Bowens, N. M., Huber, R., and Kravitz, E. A. (2002). Fighting fruit
flies: a model system for the study of aggression. Proc Natl Acad Sci U S A 99,
5664–5668.
Cheng, Y., Endo, K., Wu, K., Rodan, A. R., Heberlein, U., and Davis, R. L. (2001).
Drosophila fasciclinII is required for the formation of odor memories and for normal
sensitivity to alcohol. Cell 105, 757–768.
Chintapalli, V. R., Wang, J., and Dow, J. a T. (2007). Using FlyAtlas to identify better
Drosophila melanogaster models of human disease. Nature genetics 39, 715–720.
Cole, B. J., and Cheshire, D. (1996). Mobile Cellular Automata Models of Ant Behavior:
Movement Activity of Leptothorax allardycei. The American Naturalist 148, 1–15.
Cook, R. K., Christensen, S. J., Deal, J. A., Coburn, R. A., Deal, M. E., Gresens, J. M.,
Kaufman, T. C., and Cook, K. R. (2012). The generation of chromosomal deletions
155
to provide extensive coverage and subdivision of the Drosophila melanogaster
genome. Genome biology 13, R21.
Corl, A. B., Rodan, A. R., and Heberlein, U. (2005). Insulin signaling in the nervous
system regulates ethanol intoxication in Drosophila melanogaster. Nat Neurosci 8,
18–19.
Council, N. R. (1996). Guide for the Care and Use of Laboratory Animals (Washington,
DC: National Research Council).
Cowmeadow, R. B., Krishnan, H. R., and Atkinson, N. S. (2005). The slowpoke gene is
necessary for rapid ethanol tolerance in Drosophila. Alcohol Clin Exp Res 29, 1777–
1786.
Cowmeadow, R. B., Krishnan, H. R., Ghezzi, A., Al-Hasan, Y. M., Wang, Y. Z., and
Atkinson, N. S. (2006). Ethanol tolerance caused by slowpoke induction in
Drosophila. Alcohol Clin Exp Res 30, 745–753.
Devineni, A. V., and Heberlein, U. (2009). Preferential ethanol consumption in
Drosophila models features of addiction. Current biology : CB 19, 2126–2132.
Diagnostic and Statistical Manual of Mental Disorders, Fourth Edition, Text Revision
(DSM-IV-TR) (2000). (Arlington, VA: American Psychiatric Association)
Eddison, M., Guarnieri, D. J., Cheng, L., Liu, C.-H., Moffat, K. G., Davis, G., and
Heberlein, U. (2011). Arouser Reveals a Role for Synapse Number in the Regulation
of Ethanol Sensitivity. Neuron 70, 979–990.
Ehlers, C. L., Gilder, D. A., Harris, L., and Carr, L. (2001). Association of the ADH2*3
allele with a negative family history of alcoholism in African American young
adults. Alcohol Clin Exp Res 25, 1773–1777.
Feany, M. B., and Quinn, W. G. (1995). A neuropeptide gene defined by the Drosophila
memory mutant amnesiac. Science 268, 869–873.
Ffrench-Constant, R. H., Rocheleau, T. A., Steichen, J. C., and Chalmers, A. E. (1993). A
point mutation in a Drosophila GABA receptor confers insecticide resistance.
Nature 363, 449–451.
Follesa, P., Biggio, F., Talani, G., Murru, L., Serra, M., Sanna, E., and Biggio, G. (2006).
Neurosteroids, GABAA receptors, and ethanol dependence. Psychopharmacology
186, 267–280.

156
Geer, B. W., McKechnie, S. W., Bentley, M. M., Oakeshott, J. G., Quinn, E. M., and
Langevin, M. L. (1988). Induction of alcohol dehydrogenase by ethanol in
Drosophila melanogaster. The Journal of nutrition 118, 398–407.
Gelfand, L. J., and McDonald, J. F. (1980). Relationship between ADH activity and
behavioral response to environmental alcohol in Drosophila. Behav Genet 10, 237–
249.
Georgiev, P. G., and Corces, V. G. (1995). The su(Hw) protein bound to gypsy sequences
in one chromosome can repress enhancer-promoter interactions in the paired gene
located in the other homolog. Proceedings of the National Academy of Sciences of
the United States of America 92, 5184–5188.
Ghezzi, A., Al-Hasan, Y. M., Larios, L. E., Bohm, R. A., and Atkinson, N. S. (2004). slo
K+ channel gene regulation mediates rapid drug tolerance. Proc. Natl. Acad. Sci. U.
S. A. 101, 17276–17281.
Gielen, M. C., Lumb, M. J., and Smart, T. G. (2012). Benzodiazepines Modulate
GABAA Receptors by Regulating the Preactivation Step after GABA Binding.
Journal of Neuroscience 32, 5707–5715.
Gisselmann, G., Plonka, J., Pusch, H., and Hatt, H. (2004). Drosophila melanogaster
GRD and LCCH3 subunits form heteromultimeric GABA-gated cation channels.
British journal of pharmacology 142, 409–413.
Godenschwege, T. A., Reisch, D., Diegelmann, S., Eberle, K., Funk, N., Heisenberg, M.,
Hoppe, V., Hoppe, J., Klagges, B. R. E., Martin, J.-R., et al. (2004). Flies lacking all
synapsins are unexpectedly healthy but are impaired in complex behaviour. Eur J
Neurosci 20, 611–622..
Van Goethem, E., Silva, E. a, Xiao, H., and Franc, N. C. (2012). The Drosophila TRPP
cation channel, PKD2 and Dmel/Ced-12 act in genetically distinct pathways during
apoptotic cell clearance. PloS one 7, e31488.
Gottesman, I. I., and Gould, T. D. (2003). The endophenotype concept in psychiatry:
etymology and strategic intentions. The American Journal of Psychiatry 160, 636–
645.
Guidotti, A., Forchetti, C. M., Corda, M. G., Konkel, D., Bennett, C. D., and Costa, E.
(1983). Isolation, characterization, and purification to homogeneity of an
endogenous polypeptide with agonistic action on benzodiazepine receptors.
Proceedings of the National Academy of Sciences of the United States of America
80, 3531–3535.

157
Guidotti, A., Toffano, G., and Costa, E. (1978). An endogenous protein modulates the
affinity of GABA and benzodiazepine receptors in rat brain. Nature 275, 553–555.
Hall, J. C. (1994). The mating of a fly. Science 264, 1702–1714.
Hasegawa, K., Tanakadate, A., and Ishikawa, H. (1988). A method for tracking the
locomotion of an isolated microorganism in real time. Physiol Behav 42, 397–400.
Hendricks, J. C., Finn, S. M., Panckeri, K. A., Chavkin, J., Williams, J. A., Sehgal, A.,
and Pack, A. I. (2000). Rest in Drosophila is a sleep-like state. Neuron 25, 129–138.
Hitchen, J. M., and Wood, R. J. (1975). Linkage of the genes for DDT and dieldrin
resistance in larvae of the mosquito Aedes aegypti. Canadian journal of genetics and
cytology 17, 543–551.
Hosie, a M., and Sattelle, D. B. (1996). Allosteric modulation of an expressed homo-
oligomeric GABA-gated chloride channel of Drosophila melanogaster. British
journal of pharmacology 117, 1229–1237.
Hoy, J. B., Koehler, P. G., and Patterson, R. S. (1996). A microcomputer-based system
for real-time analysis of animal movement. J Neurosci Methods 64, 157–161.
IHGSC (2004). Finishing the euchromatic sequence of the human genome. Nature 431,
931–945.
Ja, W. W., de La Rosa, N. N., Carvalho, G. B., Mak, E. M., Fang, A. Y., Liong, J. C.,
Brummel, T., and Benzer, S. (2007). Prandiology of Drosophila and the CAFE
assay. Proceedings of the National Academy of Sciences of the United States of
America 104, 8253–8256.
Johnston, G. a (1996). GABAA receptor pharmacology. Pharmacology & therapeutics
69, 173–198.
Jones, A. K., Buckingham, S. D., Papadaki, M., Yokota, M., Sattelle, B. M., Matsuda, K.,
and Sattelle, D. B. (2009). Splice-variant- and stage-specific RNA editing of the
Drosophila GABA receptor modulates agonist potency. The Journal of
neuroscience : the official journal of the Society for Neuroscience 29, 4287–4292.
Katsura, M., Hara, A., Higo, A., Tarumi, C., Hibino, Y., and Ohkuma, S. (1998a).
Continuous treatment with morphine increases diazepam binding inhibitor mRNA in
mouse brain. Journal of neurochemistry 71, 2638–2641.

158
Katsura, M., Mohri, Y., Shuto, K., Tsujimura, A., Ukai, M., and Ohkuma, S. (2002).
Psychological stress, but not physical stress, causes increase in diazepam binding
inhibitor (DBI) mRNA expression in mouse brains. Brain research. Molecular brain
research 104, 103–109.
Katsura, M., and Ohkuma, S. (2005). Functional proteins involved in regulation of
intracellular Ca(2+) for drug development: chronic nicotine treatment upregulates L-
type high voltage-gated calcium channels. Journal of pharmacological sciences 97,
344–347.
Katsura, M., Ohkuma, S., Jun, X., Tsujimura, A., and Kuriyama, K. (1995a). Ethanol
stimulates diazepam binding inhibitor (DBI) mRNA expression in primary cultured
neurons. Brain research. Molecular brain research 34, 355–359.
Katsura, M., Ohkuma, S., Tsujimura, a, Xu, J., Hibino, Y., Ishikawa, E., and Kuriyama,
K. (1998b). Functional involvement of benzodiazepine receptors in ethanol-induced
increases of diazepam binding inhibitor (DBI) and its mRNA in the mouse brain.
Brain research. Molecular brain research 54, 124–132.
Katsura, M., Ohkuma, S., Tsujimura, A., and Kuriyama, K. (1995b). Increase of
diazepam binding inhibitor mRNA levels in the brains of chronically ethanol-treated
and -withdrawn mice. The Journal of pharmacology and experimental therapeutics
273, 1529–1533.
Katsura, M., Ohkuma, S., Xu, J., Hibino, Y., Tsujimura, A., and Kuriyama, K. (1998c).
Continuous treatment with nicotine increases diazepam binding inhibitor (DBI) and
its mRNA in the mouse brain. Brain research. Molecular brain research 55, 345–
349.
Katsura, M., Shibasaki, M., Kurokawa, K., Tsujimura, A., and Ohkuma, S. (2007). Up-
regulation of L-type high voltage-gated calcium channel subunits by sustained
exposure to 1,4- and 1,5-benzodiazepines in cerebrocortical neurons. Journal of
neurochemistry 103, 2518–2528.
Katsura, M., Shuto, K., Mohri, Y., Tsujimura, A., and Ohkuma, S. (2001). Withdrawal
from nicotine facilitates diazepam binding inhibitor mRNA expression in mouse
cerebral cortex. Brain research. Molecular brain research 97, 194–198.
Kim, D., Chae, S., Lee, J., Yang, H., and Shin, H. S. (2005). Variations in the behaviors
to novel objects among five inbred strains of mice. Genes Brain Behav 4, 302–306.

159
King, A. C., Houle, T., de Wit, H., Holdstock, L., and Schuster, A. (2002). Biphasic
alcohol response differs in heavy versus light drinkers. Alcohol Clin Exp Res 26,
827–835.
Knipple, D. C., and Soderlund, D. M. (2010). The ligand-gated chloride channel gene
family of Drosophila melanogaster. Pesticide Biochemistry and Physiology 97, 140–
148.
Kolmer, M., Roos, C., Tirronen, M., Myöhänen, S., and Alho, H. (1994). Tissue-specific
expression of the diazepam-binding inhibitor in Drosophila melanogaster: cloning,
structure, and localization of the gene. Mol Cell Biol 14, 6983–6995.
Kong, E. C., Allouche, L., Chapot, P. a, Vranizan, K., Moore, M. S., Heberlein, U., and
Wolf, F. W. (2010). Ethanol-regulated genes that contribute to ethanol sensitivity
and rapid tolerance in Drosophila. Alcoholism, clinical and experimental research
34, 302–316.
Krishnan, H. R., Al-Hasan, Y. M., Pohl, J. B., Ghezzi, A., and Atkinson, N. S. (2012). A
role for dynamin in triggering ethanol tolerance. Alcoholism, clinical and
experimental research 36, 24–34.
Kuhn, E. J., Viering, M. M., Rhodes, K. M., and Geyer, P. K. (2003). A test of insulator
interactions in Drosophila. The EMBO journal 22, 2463–2471.
Lasek, A. W., Giorgetti, F., Berger, K. H., Tayor, S., and Heberlein, U. (2011). Lmo
genes regulate behavioral responses to ethanol in Drosophila melanogaster and the
mouse. Alcoholism, clinical and experimental research 35, 1600–1606.
Le, A. D., Kalant, H., and Khanna, J. M. (1989). Roles of intoxicated practice in the
development of ethanol tolerance. Psychopharmacology 99, 366–370.
Lees, G., Beadle, D. J., Neumann, R., and Benson, J. a (1987). Responses to GABA by
isolated insect neuronal somata: pharmacology and modulation by a benzodiazepine
and a barbiturate. Brain research 401, 267–278.
Leibovitch, B. A., Campbell, D. B., Krishnan, K. S., and Nash, H. A. (1995). Mutations
that affect ion channels change the sensitivity of Drosophila melanogaster to volatile
anesthetics. Journal of neurogenetics 10, 1–13.
Li, T. K., Lumeng, L., McBride, W. J., and Waller, M. B. (1979). Progress toward a
voluntary oral consumption model of alcoholism. Drug and alcohol dependence 4,
45–60.

160
McClung, C. A., and Hirsh, J. (1998). Stereotypic behavioral responses to free-base
cocaine and the development of behavioral sensitization in Drosophila. Current
biology : CB 8, 109–112.
McClung, C. A., Sidiropoulou, K., Vitaterna, M., Takahashi, J. S., White, F. J., Cooper,
D. C., and Nestler, E. J. (2005). Regulation of dopaminergic transmission and
cocaine reward by the Clock gene. Proc Natl Acad Sci U S A 102, 9377–9381.
Milan, N. F., Kacsoh, B. Z., and Schlenke, T. a (2012). Alcohol Consumption as Self-
Medication against Blood-Borne Parasites in the Fruit Fly. Current biology : CB 22,
488–493.
Miller, W. R., Walters, S. T., and Bennett, M. E. (2001). How effective is alcoholism
treatment in the United States? J Stud Alcohol 62, 211–220.
Mohri, Y., Katsura, M., Shuto, K., Tsujimura, A., Ishii, R., and Ohkuma, S. (2003). L-
type high voltage-gated calcium channels cause an increase in diazepam binding
inhibitor mRNA expression after sustained exposure to ethanol in mouse cerebral
cortical neurons. Brain research. Molecular brain research 113, 52–56.
Moore, M. S., DeZazzo, J., Luk, A. Y., Tully, T., Singh, C. M., and Heberlein, U. (1998).
Ethanol intoxication in Drosophila: Genetic and pharmacological evidence for
regulation by the cAMP signaling pathway. Cell 93, 997–1007.
Morozova, T. V., Anholt, R. R. H., and Mackay, T. F. C. (2006). Transcriptional
response to alcohol exposure in Drosophila melanogaster. Genome Biol 7, R95.
Möhler, H. (2006). GABA(A) receptor diversity and pharmacology. Cell and tissue
research 326, 505–516.
Navarro, H. J., Doran, C. M., and Shakeshaft, A. P. (2011). Measuring costs of alcohol
harm to others: a review of the literature. Drug and alcohol dependence 114, 87–99.
Ogueta, M., Cibik, O., Eltrop, R., Schneider, A., and Scholz, H. (2010). The influence of
Adh function on ethanol preference and tolerance in adult Drosophila melanogaster.
Chemical senses 35, 813–822.
Parr, J., Large, A., Wang, X., Fowler, S. C., Ratzlaff, K. L., and Ruden, D. M. (2001).
The inebri-actometer: a device for measuring the locomotor activity of Drosophila
exposed to ethanol vapor. Journal of neuroscience methods 107, 93–99.

161
Paul, J., Zeilhofer, H. U., and Fritschy, J.-M. (2012). Selective distribution of GABA(A)
receptor subtypes in mouse spinal dorsal horn neurons and primary afferents. The
Journal of comparative neurology 520, 3895-3911.
Pohl, J. B., Baldwin, B. A., Dinh, B. L., Rahman, P., Smerek, D., Prado, F. J., Sherazee,
N., and Atkinson, N. S. (2012). Ethanol Preference in Drosophila melanogaster is
Driven by Its Caloric Value. Alcoholism, clinical and experimental research 36,
1903–1912.
Quinn, W. G., and Greenspan, R. J. (1984). Learning and courtship in Drosophila: two
stories with mutants. Annu Rev Neurosci 7, 67–93.
Quinn, W. G., Harris, W. A., and Benzer, S. (1974). Conditioned behavior in Drosophila
melanogaster. Proc Natl Acad Sci U S A 71, 708–712.
Quinn, W. G., Sziber, P. P., and Booker, R. (1979). The Drosophila memory mutant
amnesiac. Nature 277, 212–214.
Ramazani, R. B., Krishnan, H. R., Bergeson, S. E., and Atkinson, N. S. (2007). Computer
automated movement detection for the analysis of behavior. Journal of neuroscience
methods 162, 171–179.
Reiter, L. T., Potocki, L., Chien, S., Gribskov, M., and Bier, E. (2001). A systematic
analysis of human disease-associated gene sequences in Drosophila melanogaster.
Genome Res 11, 1114–1125.
Robinson, T. E., and Berridge, K. C. (2001). Incentive-sensitization and addiction.
Addiction (Abingdon, England) 96, 103–114.
Roseman, R. R., Johnson, E. A., Rodesch, C. K., Bjerke, M., Nagoshi, R. N., and Geyer,
P. K. (1995). A P element containing suppressor of hairy-wing binding regions has
novel properties for mutagenesis in Drosophila melanogaster. Genetics 141, 1061–
1074.
Rothenfluh, A., Threlkeld, R. J., Bainton, R. J., Tsai, L. T.-Y., Lasek, A. W., and
Heberlein, U. (2006). Distinct behavioral responses to ethanol are regulated by
alternate RhoGAP18B isoforms. Cell 127, 199–211.
Roy, A., DeJong, J., Adinoff, B., Barbaccia, M., Costa, E., Guidotti, A., and Linnoila, M.
(1990). CSF diazepam-binding inhibitor in alcoholics and normal controls.
Psychiatry research 31, 261–266.

162
Ryder, E., and Russell, S. (2003). Transposable elements as tools for genomics and
genetics in Drosophila. Brief Funct Genomic Proteomic 2, 57–71.
Scholz, H. (2005). Influence of the biogenic amine tyramine on ethanol-induced
behaviors in Drosophila. J Neurobiol 63, 199–214.
Scholz, H., Franz, M., and Heberlein, U. (2005). The hangover gene defines a stress
pathway required for ethanol tolerance development. Nature 436, 845–847.
Scholz, H., Ramond, J., Singh, C. M., and Heberlein, U. (2000). Functional ethanol
tolerance in Drosophila. Neuron 28, 261–271.
Schuckit, M. A. (1998). Biological, psychological and environmental predictors of the
alcoholism risk: a longitudinal study. Journal of studies on alcohol 59, 485–494.
Shibasaki, M., Katsura, M., Torigoe, F., Honda, T., Sumimoto, A., Tsujimura, A., and
Ohkuma, S. (2007). Increase in diazepam binding inhibitor expression by sustained
morphine exposure is mediated via mu-opioid receptors in primary cultures of
mouse cerebral cortical neurons. Journal of neuroscience research 85, 2971–2980.
Shibasaki, M., Katsura, M., Tsujimura, A., and Ohkuma, S. (2006). Up-regulated L-type
high voltage-gated calcium channels cause increase in diazepam binding inhibitor
induced by sustained morphine exposure in mouse cerebrocortical neurons. Life
sciences 80, 166–172.
Shirai, Y., Hosie, A. M., Buckingham, S. D., Holyoke, C. W., Baylis, H. A., and Sattelle,
D. B. (1995). Actions of picrotoxinin analogues on an expressed, homo-oligomeric
GABA receptor of Drosophila melanogaster. Neuroscience letters 189, 1–4.
Shoyab, M., Gentry, L. E., Marquardt, H., and Todaro, G. J. (1986). Isolation and
characterization of a putative endogenous benzodiazepineoid (endozepine) from
bovine and human brain. The Journal of biological chemistry 261, 11968–11973.
Shuster, L., Yu, G., and Bates, A. (1977). Sensitization to cocaine stimulation in mice.
Psychopharmacology 52, 185–190.
Singh, C. M., and Heberlein, U. (2000). Genetic control of acute ethanol-induced
behaviors in Drosophila. Alcoholism, clinical and experimental research 24, 1127–
1136.
Stilwell, G. E., Rocheleau, T., and ffrench-Constant, R. H. (1995). GABA receptor
minigene rescues insecticide resistance phenotypes in Drosophila. Journal of
molecular biology 253, 223–227.

163
Suzuki, D. T., Grigliatti, T., and Williamson, R. (1971). Temperature-sensitive mutations
in Drosophila melanogaster. VII. A mutation (para-ts) causing reversible adult
paralysis. Proc Natl Acad Sci U S A 68, 890–893.
Thiele, T. E., Marsh, D. J., Ste Marie, L., Bernstein, I. L., and Palmiter, R. D. (1998).
Ethanol consumption and resistance are inversely related to neuropeptide Y levels.
Nature 396, 366–369.
Tsai, L. T.-Y., Bainton, R. J., Blau, J., and Heberlein, U. (2004). Lmo Mutants Reveal a
Novel Role for Circadian Pacemaker Neurons in Cocaine-Induced Behaviors. PLoS
Biol 2, e408.
Urizar, N. L., Yang, Z., Edenberg, H. J., and Davis, R. L. (2007). Drosophila homer is
required in a small set of neurons including the ellipsoid body for normal ethanol
sensitivity and tolerance. The Journal of neuroscience : the official journal of the
Society for Neuroscience 27, 4541–4551.
Vogel, J. R., Beer, B., and Clody, D. E. (1971). A simple and reliable conflict procedure
for testing anti-anxiety agents. Psychopharmacologia 21, 1–7.
WHO (2011). Global status report on alcohol and health (Geneva) Available at:
http://www.who.int/substance_abuse/publications/global_alcohol_report/profiles/usa
.pdf.
Weber, K. E. (1988). An apparatus for measurement of resistance to gas-phase agents.
Dros Info Serv 67, 91–93.
Wen, T., Parrish, C. A., Xu, D., Wu, Q., and Shen, P. (2005). Drosophila neuropeptide F
and its receptor, NPFR1, define a signaling pathway that acutely modulates alcohol
sensitivity. Proceedings of the National Academy of Sciences of the United States of
America 102, 2141–2146.
Wolf, F. W., Rodan, A. R., Tsai, L. T.-Y., and Heberlein, U. (2002). High-resolution
analysis of ethanol-induced locomotor stimulation in Drosophila. J Neurosci 22,
11035–11044.
Xu, S., Chan, T., Shah, V., Zhang, S., Pletcher, S. D., and Roman, G. (2012). The
propensity for consuming ethanol in Drosophila requires rutabaga adenylyl cyclase
expression within mushroom body neurons. Genes, brain, and behavior 11, 727–
739.

164
Vita
Roseanna Beth Robles (née Roseanna Beth Ramazani) was born in Austin, Texas.
She has three younger brothers and one younger sister. She earned Bachelors of Science
degrees in Cell and Molecular Biology and Psychology from Tulane University in 2001.
As an undergraduate, she worked in the lab of Gary Dohanich, studying the effects of
estrogen on working memory in rats. Following graduation, she worked as a Laboratory
Technician in the lab of Richard Harlan, studying the effects of anti-epileptic drugs on
learning. She entered the Institute for Neuroscience graduate program at the University of
Texas at Austin in 2003. She was the recipient of a first year fellowship from the
graduate program, an Alcohol Training Grant from the Waggoner Center for Alcohol and
Addiction Research, and an individual NRSA from the National Institute on Alcohol
Abuse and Alcoholism of the NIH.
Permanent email: [email protected]
This dissertation was typed by Roseanna Beth Robles.