Copyright by Paul Henry Ziehl 1997
223
Copyright by Paul Henry Ziehl 1997
Transcript of Copyright by Paul Henry Ziehl 1997

Copyright
by
Paul Henry Ziehl
1997
MINIMUM MILD REINFORCING REQUIREMENTS
FOR CONCRETE COLUMNS
by
Paul Henry Ziehl, B.S.
Thesis
Presented to the Faculty of the Graduate School
of The University of Texas at Austin
in Partial Fulfillment
of the Requirements
for the Degree of
Master of Science in Engineering
The University of Texas at Austin
December 1997

DEDICATION
This thesis is dedicated to my grandmother, Mrs. Mabel Ziehl.

ACKNOWLEDGMENTS
I would like to thank the following people who have made significant
contributions to the successful completion of this project.
My parents, Mr. R. C. Ziehl, M.D. and Mrs. Arla M. Ziehl, for their
continuing encouragement. They have never questioned my many questionable
decisions. Without their support, this project would not have been possible.
Professor Michael E. Kreger for his input during the project and his
thoughtful review of this thesis. Also for trusting me to do the work in the first place.
Professor Ned H. Burns for his thoughtful review of this thesis.
Professor Michael D. Engelhardt, who provided technical insight in regard to
the loading frames and graciously donated jumbo steel columns which were
subsequently cut to size and used for the top plates.
Professor Timothy J. Fowler for his suggestions in regard to the fiberglass
wrapping of the columns. Also to Ershigs, Inc. for executing the fiberglass wrapping.
Professor John E. Breen for his encouragement and input in regard to
shrinkage effects.
The three Mohammeds. Mohammeds Elmrabet, Najah and Mahed. In
particular, M. Elmrabet for his unceasing emotional support, determination and
kindness and M. Najah for carrying out the work with unparalleled gusto and joy.
Mr. John Reardon and Miss Diana Hun who taught me how to swing a
hammer and then proceeded to construct the humidity enclosures in spite of my
clumsy interference. Also, Mr. Jeff West for loaning their expertise.
Mr. John J. Myers, who graciously donated trial mix designs. The final
results are in no way his fault.
Mr. Brad Shuey, who generously donated his videotape collection.
Mr. Chuck Larosche, whose always optimistic view of the Longhorn football
team in general and coach John Mackovic in particular provided many hours of
amusement.
i

ii
Mr. Shawn Gross, for his insight into creep measurements and for carrying
Willy Ramirez and me to victory in the 1996 Phil M. Ferguson golf tournament. A
heavy and cumbersome load indeed.
Mr. Chuck Barnes, for flaking on this project and thereby allowing other
(though admittedly less qualified) people to step in.
Professor (to be) Guillermo Ramirez, who acted as supervising professor and
confidant throughout the course of the project. His contributions are too numerous to
mention and would only serve to embarrass him. Suffice to say, his input never failed
to be timely, correct and to the point. His unselfishness and undying support through
truly difficult times will always be remembered.
And most important of all, Miss Laura C. Nisby, my snugly domestic
companion and best friend. She has caused me to see the world through new and
slightly rose-tinted eyes. Her undying support of me and complete indifference to the
outcome of this or any other task is forever appreciated.
MINIMUM MILD REINFORCING REQUIREMENTS
FOR CONCRETE COLUMNS
by
Paul Henry Ziehl, M.S.E.
The University of Texas at Austin, 1997
SUPERVISOR: Michael E. Kreger
This on-going investigation involves the response of reinforced concrete
columns under sustained axial load. It is being conducted to establish the feasibility
of reducing the minimum longitudinal reinforcing steel percentage as currently
required by the ACI code. A review and discussion of previous studies is included.
A total of 38 reinforced concrete columns have been fabricated and are being
maintained in reduced-humidity enclosures. Twenty-four of the 38 columns are being
subjected to near-constant axial load. The remaining 14 are unloaded control
specimens. Of the loaded columns, four are loaded with an axial eccentricity of
approximately 10% of the column diameter.
The variables investigated were concrete strength and percentage of
longitudinal reinforcement. It is intended that the columns will be maintained for a
period of at least two years from the time of casting.
Preliminary experimental results were compared to those obtained from
current predictive formulas for creep and shrinkage as outlined by ACI 209.
Reasonable agreement was found.
iii
LIST OF FIGURES
Page
FIGURE 1.1 Schematic of Reinforced Concrete Column .................................. FIGURE 3.1 Elevation of Typical Column .......................................................
FIGURE 3.2 Cross-Sections of Column Specimens ..........................................
FIGURE 3.3 Location of Test Specimens in Enclosure No. 1 ...........................
FIGURE 3.4 Location of Test Specimens in Enclosure No. 2 ...........................
FIGURE 3.5 - 3.8 Temperature and Humidity History for Group No. (1 - 4) Specimens .........................................
FIGURE 3.9 - 3.10 Photograph(s) of Loading Frames ....................................
FIGURE 3.11 Schematic Side and Front Views of Creep Test Setup................
FIGURE 3.12 Vertical Location of Demec Points ...........................................
FIGURE 3.13 Plan Location of Demec Points ................................................
FIGURE 3.14 Location of Electrical Resistance Strain Gages ........................
FIGURE 3.15 Numbering Scheme for Electrical Resistance Strain Gages ......
FIGURE 4.1 - 4.19 Mechanical (and Electrical) Strain Gage Data for 8,000 psi Concentrically Loaded Specimens .................
FIGURE 4.20 - 4.39 Mechanical (and Electrical) Strain Gage Data for 4,000 psi Concentrically Loaded Specimens .................
FIGURE 4.40 - 4.43 Mechanical (and Electrical) Strain Gage Data for 8,000 psi Eccentrically Loaded Specimens ...................
FIGURE 4.44 - 4.47 Mechanical (and Electrical) Strain Gage Data for 4,000 psi Eccentrically Loaded Specimens ...................
FIGURE 4.48 - 4.60 Mechanical (and Electrical) Strain Gage Data for 8,000 psi Unloaded Specimens ....................................
FIGURE 4.61 - 4.73 Mechanical (and Electrical) Strain Gage Data for 4,000 psi Unloaded Specimens ...................................
FIGURE 4.74 Total and Shrinkage Strains for 8 ksi Specimens (Groups 1 and 2) .................................................................
FIGURE 4.75 Total and Shrinkage Strains for 8 ksi Specimens (Group 1) .....
FIGURE 4.76 Total and Shrinkage Strains for 8 ksi Specimens (Group 2) .....
FIGURE 4.77 Total and Shrinkage Strains for 4 ksi Specimens (Groups 3 and 4) .................................................................
FIGURE 4.78 Total and Shrinkage Strains for 4 ksi Specimens (Group 3) ....
FIGURE 4.79 Total and Shrinkage Strains for 4 ksi Specimens (Group 4) ....
FIGURE 4.80 - 4.83 Strength and Modulus Data for Cylinders Cast with Group (1 - 4) Specimens....................................
FIGURE 5.1 - 5.4 Comparison of ACI 209 Predicted Responses with Measured Column Responses (Group 1 - 4) ................
FIGURE 6.1 ACI 209 2-Year Predicted Responses (Selected 8 ksi Specimens) ...................................................
FIGURE 6.2 ACI 209 2-Year Predicted Responses (Selected 4 ksi Specimens) ..................................................
LIST OF TABLES
Page
TABLE 1.1 Minumum % of Longitudinal Reinforcement (for νu = 2.35 and (εsh)u = 800 x 10-6 ) ...............................................................
TABLE 1.2 Minumum % of Longitudinal Reinforcement (for νu = 4.15 and (εsh)u = 1070 x 10-6) .............................................................. TABLE 3.1 Matrix of Test Specimens.............................................................
TABLE 3.2 Concrete Column Details..............................................................
TABLE 3.3 Concrete Mix Proportions.............................................................
TABLE 4.1 Summary of Strain Responses for Concentically Loaded 8 ksi Specimens........................................................................
TABLE 4.2 Summary of Strain Responses for Concentically Loaded 4 ksi Specimens.......................................................................
TABLE 4.3 Strength Data for Cylinders Cast with Column Specimens...........
TABLE 4.4 Modulus Data for Cylinders Cast with Column Specimens..........
TABLE 5.1 ACI 209R-86 Shrinkage Factors................................................
TABLE 5.2 ACI 209R-86 Correction Factors for 8 ksi Specimens................
TABLE 5.3 ACI 209R-86 Correction Factors for 4 ksi Specimens................
TABLE 6.1 Minumum % of Longitudinal Reinforcement (for νu = 2.35 and (εsh)u = 800 x 10-6)..........................................................
TABLE 6.2 Minumum % of Longitudinal Reinforcement (for νu = 4.15 and (εsh)u = 1070 x 10-6)........................................................
Chapter 1. INTRODUCTION
1.1 Background
Since the 1930’s a minimum reinforcement ratio of 1% (based on cross-
sectional area computed using gross-section dimensions) has been required in
reinforced concrete columns and piers. This minimum quantity of reinforcement was
intended to prevent “passive yielding” of the longitudinal reinforcement which occurs
when load is transferred gradually from concrete to steel as the concrete deforms
(creeps) under sustained axial load.
The 1% minimum reinforcement ratio was based on tests conducted during
the 1920’s and 30’s(1-9 ) using low to medium-strength materials; nominal concrete
compressive strengths were in the range of 2,000 to 5,000 psi and the steel yield was
in the range of 39 to 54 ksi. The 1% limit was first published as part of a committee
document by the American Concrete Institute - American Society of Civil Engineers
(ACI-ASCE) Joint Committee 105 in 1933(7), and was adopted in the Building
Code(10) published by ACI in 1935. These documents are discussed in Chapter 2.
Today, structural concrete compressive strengths below 4,000 psi are
uncommon and can easily range up to 10,000 psi. In addition, today’s common
reinforcing steel has a nominal yield strength of 60 ksi. As a result, it is likely that the
tests conducted more than 60 years ago and the code limit for minimum column
longitudinal reinforcement are no longer valid for today’s columns constructed with
modern construction materials.
Recent analysis of the minimum reinforcement ratio in reinforced concrete
columns (ASCE-ACI Committee 441 - Concrete Columns) indicates that it may now
be appropriate to reduce the minimum reinforcement ratio to approximately 0.5%.
However, before such a change is made it would be prudent to verify this limit with a
comprehensive experimental study.
Because a substantial percentage of all bridge piers require less than the
minimum 1% longitudinal reinforcement to satisfy strength demands, use of the
1
current minimum reinforcement requirements may result in nearly twice as much
longitudinal reinforcement in these piers as may really be needed to withstand the
effects of creep. Reduction of the minimum longitudinal reinforcement requirement
would result in economic savings in the form of reduced material and related
transportation costs, savings in labor costs resulting from fewer longitudinal bars to be
placed, and the modest added benefit of less congestion in piers.
1.2 Objective and Scope of This Investigation
The objective of this investigation is to determine the behavior of reinforced
concrete columns which are reinforced below the current code-required minimum
longitudinal reinforcement ratio of 1.0% (ACI 318-95(11) Section 10.9.1). It is hoped
that this lower limit of 1.0% may be reduced for certain cases. The applicable section
is quoted below:
10.9 - Limits for reinforcement of compression members
10.9.1 - Area of longitudinal reinforcement for non-composite compression members shall not be less than 0.01 nor more than 0.08 times gross area Ag of section. The work described herein involves experimental tests that incorporated
variable concrete strengths, reinforcement ratios, concentric versus eccentric
application of axial loads, and comparison of preliminary experimental results with
long-term responses predicted by the analytical method recommended by ACI
Committee 209R-86(12) .
2
a) Experimental
A total of 38 conventionally reinforced concrete columns have been cast and
are currently being tested. Each column has a nominal cross-sectional diameter of 8
inches and is 4 feet long. Of the 38 columns, 24 are subjected to axial load. The
applied axial load is 0.40*fc’*Ag (with one exception). This load is the maximum
service load which can be derived from ACI 318-95(12)( Section 10.3.5.2 (Eqn. 10-2)
for required strength of a tied column (using the approximation Ag*fc’ equal to the
strength of the column). The load is maintained with heavy coil springs. The
columns were cast in cardboard forms, and the forms were stripped five days after
concrete placement. Columns were loaded between 14 and 28 days after casting.
Strain measurements are being made using a mechanical Demec gage and electrical
strain gages. Ambient humidity in the enclosures containing the test specimens has
been reduced as much as was practical and affordable within the budget of the
research project. Details of the experimental program are discussed in greater detail in
Chapter 3.
The following variables were investigated:
1. Concrete Strength
Nominal design strengths (at 28 days) of 4,000 psi and 8,000 psi.
2. Reinforcement percentage
Reinforcement percentages of 0.36%, 0.54%, and 0.72%.
3. Eccentricity
No eccentricity and eccentricity equal to 0.10*column diameter.
To determine material properties, several 4 by 8 inch and 6 by 12 inch
cylinders were cast with each group of columns. Cylinders were tested for modulus of
elasticity and compressive strength evaluation at 7, 14, 28, and 56 days after casting.
Longitudinal steel specimens were tested for yield and ultimate strength.
3
b) Analytical
Concrete exhibits pronounced visco-elastic behavior during loading and
immediately thereafter. This visco-elastic behavior tends to decrease with time, and
after several years the deformation under sustained stress tends to a limiting value(13).
This visco-elastic behavior is commonly referred to as creep. Two types of
creep are generally discussed. The first is referred to as basic creep. This is creep
which occurs without moisture exchange (i.e. the creep that would occur if specimens
were stored in a saturated environment). The second type is drying creep. Drying
creep may be thought of as shrinkage enhanced by applied stress(14).
The following conditions tend to increase creep in concrete(14):
1. Increased water-cement ratio
2. High permeability aggregates
3. Early loading
4. Increased ambient temperature
5. Reduced ambient humidity, and
6. Reduced volume-to-surface area ratio
These same factors (with the exception of early loading) tend to increase
shrinkage.
The report ACI 209R-86(12) entitled “Prediction of Creep, Shrinkage, and
Temperature Effects in Concrete Structures” presents an analytical procedure to
predict creep and shrinkage strains in unreinforced concrete. These predicted values
can then be applied to reinforced concrete members, and ultimate values for creep and
shrinkage strains in the member can be obtained. The ACI 209R-86 method is
described in detail and is applied to the test columns in Chapter 5. It is noted that the
ACI 209 procedure does not distinguish between basic and drying creep.
In the report ACI 92-S26 entitled, “Longitudinal Steel Limits for Concrete
Columns” by C.H. Lin and R. W. Furlong(15), two rationales are proposed for
establishing a lower limit for longitudinal reinforcing steel. The first rationale is
developed on the basis of limiting the size of tension cracks in the concrete column.
4
This rationale does not rely on creep and shrinkage effects and is not considered in
this thesis. The second rationale is based on the prevention of passive yielding of
longitudinal reinforcement. Passive yielding will occur if strains in the concrete
column due to load, creep, and shrinkage surpass the yield strain of the reinforcing
steel. It is with this rationale (prevention of passive yielding) that this thesis is
concerned.
The following is a brief summary of the rationale developed in the report
“Longitudinal Steel Limits for Concrete Columns” for preventing passive yielding of
the reinforcing steel.
As concrete undergoes shrinkage and creep, compressive force is transferred
to the longitudinal reinforcing steel. Total stress in the longitudinal reinforcement is
the sum of the stress under service load and the stresses due to creep and shrinkage.
For the prevention of passive yielding, it is necessary to limit the lower-bound of the
steel ratio.
5
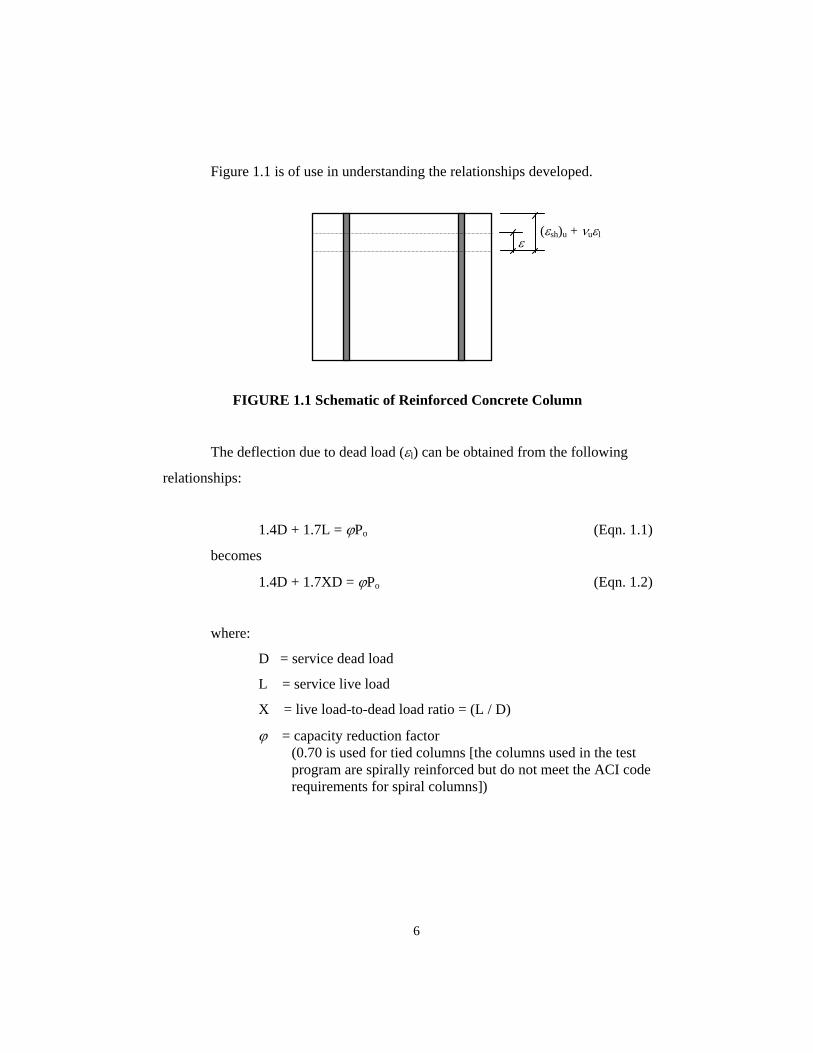
Figure 1.1 is of use in understanding the relationships developed.
(εsh)u + νuεl ε
FIGURE 1.1 Schematic of Reinforced Concrete Column
The deflection due to dead load (εl) can be obtained from the following
relationships:
1.4D + 1.7L = ϕPo (Eqn. 1.1)
becomes
1.4D + 1.7XD = ϕPo (Eqn. 1.2)
where:
D = service dead load
L = service live load
X = live load-to-dead load ratio = (L / D)
ϕ = capacity reduction factor (0.70 is used for tied columns [the columns used in the test program are spirally reinforced but do not meet the ACI code requirements for spiral columns])
6
Po = design axial load strength of column for zero eccentricity
ϕPo = 0.80ϕ [0.85*ƒ’c Ag (1-ρg) + Ag ρg ƒy]
(the factor of 0.80 is included to account for accidental eccentricities and roughly corresponds to the older code requirement of accidental eccentricity = 0.10*h for tied columns) Ag = gross area of reinforced concrete column
ρg = ratio of longitudinal reinforcement = (Ast / Ag)
Ast = total area of longitudinal reinforcement
ƒy = yield stress of longitudinal reinforcement
therefore,
D = ϕPo
(1.4 + 1.7X) (Eqn. 1.3)
The strain due to dead load (εl ) is simply the dead load divided by the
transformed area of the column multiplied by the modulus of concrete at time of
loading:
εl = ( )( )[ ]
DA E ng ci g1 1+ −ρ
(Eqn. 1.4)
where all terms are as defined previously and
Eci = modulus of concrete at time of loading
n = modular ratio at time of loading = (Est / Eci)
Est = modulus of reinforcing steel
7
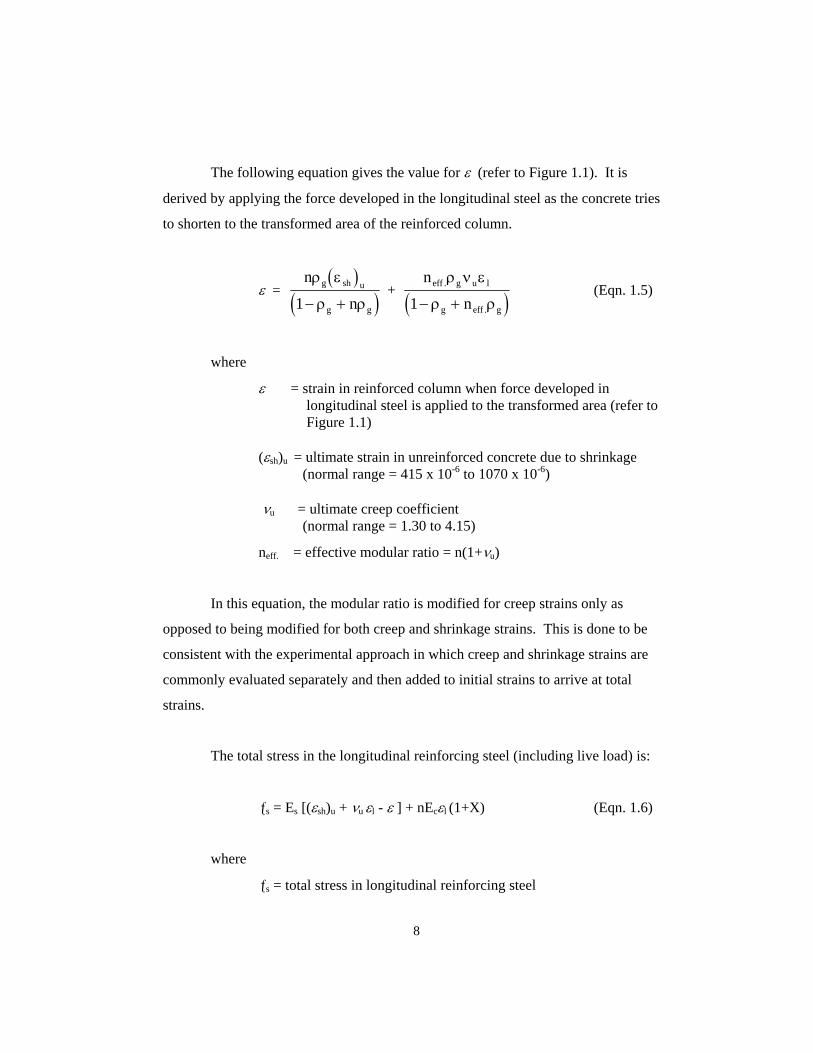
The following equation gives the value for ε (refer to Figure 1.1). It is
derived by applying the force developed in the longitudinal steel as the concrete tries
to shorten to the transformed area of the reinforced column.
ε = ( )
( )n
ng sh u
g g
ρ ε
ρ ρ1− + + ( )
n
neff g u l
g eff g
.
.
ρ ν ε
ρ ρ1− + (Eqn. 1.5)
where
ε = strain in reinforced column when force developed in longitudinal steel is applied to the transformed area (refer to Figure 1.1) (εsh)u = ultimate strain in unreinforced concrete due to shrinkage (normal range = 415 x 10-6 to 1070 x 10-6) νu = ultimate creep coefficient (normal range = 1.30 to 4.15)
neff. = effective modular ratio = n(1+νu)
In this equation, the modular ratio is modified for creep strains only as
opposed to being modified for both creep and shrinkage strains. This is done to be
consistent with the experimental approach in which creep and shrinkage strains are
commonly evaluated separately and then added to initial strains to arrive at total
strains.
The total stress in the longitudinal reinforcing steel (including live load) is:
ƒs = Es [(εsh)u + νu εl - ε ] + nEcεl (1+X) (Eqn. 1.6)
where
ƒs = total stress in longitudinal reinforcing steel
8
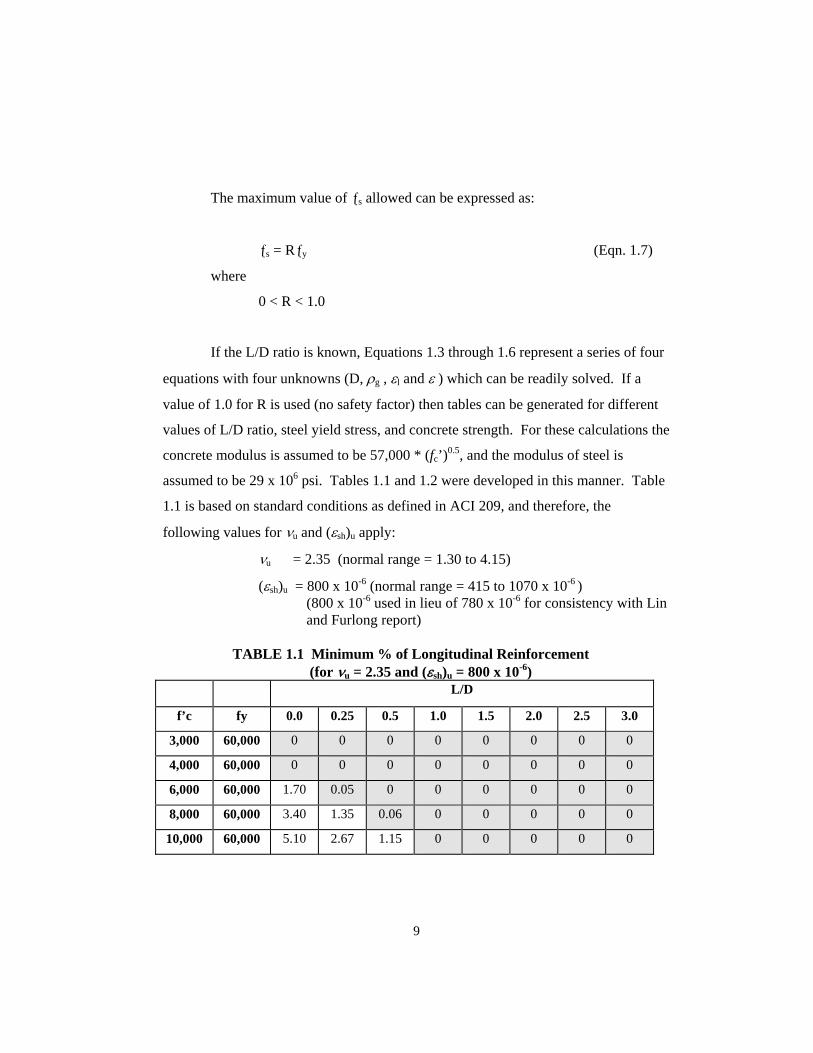
The maximum value of ƒs allowed can be expressed as:
ƒs = Rƒy (Eqn. 1.7)
where
0 < R < 1.0
If the L/D ratio is known, Equations 1.3 through 1.6 represent a series of four
equations with four unknowns (D, ρg , εl and ε ) which can be readily solved. If a
value of 1.0 for R is used (no safety factor) then tables can be generated for different
values of L/D ratio, steel yield stress, and concrete strength. For these calculations the
concrete modulus is assumed to be 57,000 * (fc’)0.5, and the modulus of steel is
assumed to be 29 x 106 psi. Tables 1.1 and 1.2 were developed in this manner. Table
1.1 is based on standard conditions as defined in ACI 209, and therefore, the
following values for νu and (εsh)u apply:
νu = 2.35 (normal range = 1.30 to 4.15)
(εsh)u = 800 x 10-6 (normal range = 415 to 1070 x 10-6 )
(800 x 10-6 used in lieu of 780 x 10-6 for consistency with Lin and Furlong report) TABLE 1.1 Minimum % of Longitudinal Reinforcement (for νu = 2.35 and (εsh)u = 800 x 10-6) L/D
f’c fy 0.0 0.25 0.5 1.0 1.5 2.0 2.5 3.0
3,000 60,000 0 0 0 0 0 0 0 0
4,000 60,000 0 0 0 0 0 0 0 0
6,000 60,000 1.70 0.05 0 0 0 0 0 0
8,000 60,000 3.40 1.35 0.06 0 0 0 0 0
10,000 60,000 5.10 2.67 1.15 0 0 0 0 0
9
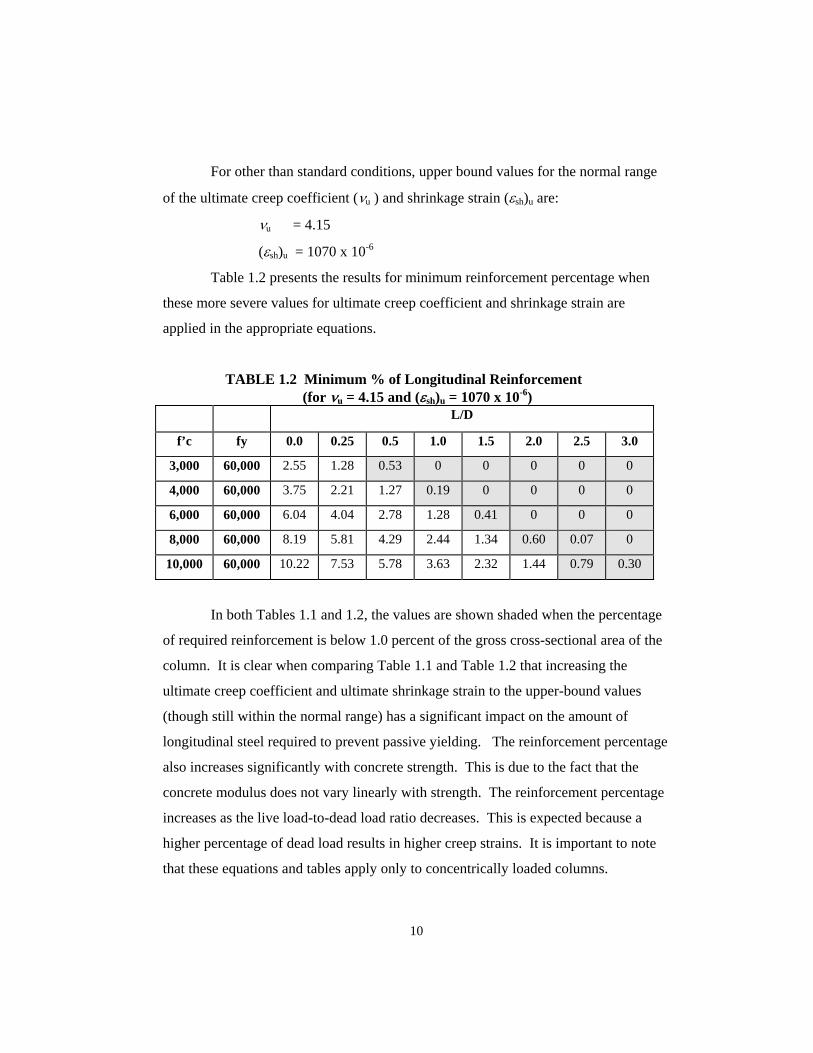
For other than standard conditions, upper bound values for the normal range
of the ultimate creep coefficient (νu ) and shrinkage strain (εsh)u are:
νu = 4.15
(εsh)u = 1070 x 10-6
Table 1.2 presents the results for minimum reinforcement percentage when
these more severe values for ultimate creep coefficient and shrinkage strain are
applied in the appropriate equations.
TABLE 1.2 Minimum % of Longitudinal Reinforcement (for νu = 4.15 and (εsh)u = 1070 x 10-6) L/D
f’c fy 0.0 0.25 0.5 1.0 1.5 2.0 2.5 3.0
3,000 60,000 2.55 1.28 0.53 0 0 0 0 0
4,000 60,000 3.75 2.21 1.27 0.19 0 0 0 0
6,000 60,000 6.04 4.04 2.78 1.28 0.41 0 0 0
8,000 60,000 8.19 5.81 4.29 2.44 1.34 0.60 0.07 0
10,000 60,000 10.22 7.53 5.78 3.63 2.32 1.44 0.79 0.30
In both Tables 1.1 and 1.2, the values are shown shaded when the percentage
of required reinforcement is below 1.0 percent of the gross cross-sectional area of the
column. It is clear when comparing Table 1.1 and Table 1.2 that increasing the
ultimate creep coefficient and ultimate shrinkage strain to the upper-bound values
(though still within the normal range) has a significant impact on the amount of
longitudinal steel required to prevent passive yielding. The reinforcement percentage
also increases significantly with concrete strength. This is due to the fact that the
concrete modulus does not vary linearly with strength. The reinforcement percentage
increases as the live load-to-dead load ratio decreases. This is expected because a
higher percentage of dead load results in higher creep strains. It is important to note
that these equations and tables apply only to concentrically loaded columns.
10
11
Table 1.1 indicates that if conditions exist such that the ultimate creep
coefficient and shrinkage strains are at or below average values, and if little or no
eccentricity is present in the column, then the minimum reinforcement ratio could be
lowered for concrete strengths equal to or less than 8,000 psi and L/D ratios greater
than or equal to 0.5.
Table 1.2 indicates that if the more severe upper-bound conditions for the
creep coefficient and shrinkage strains exist, and little or no eccentricity is present in
the column, then the minimum steel ratio could be lowered for concrete strengths
equal to or less than 8,000 psi provided the L/D ratio is greater than or equal to 2.0.
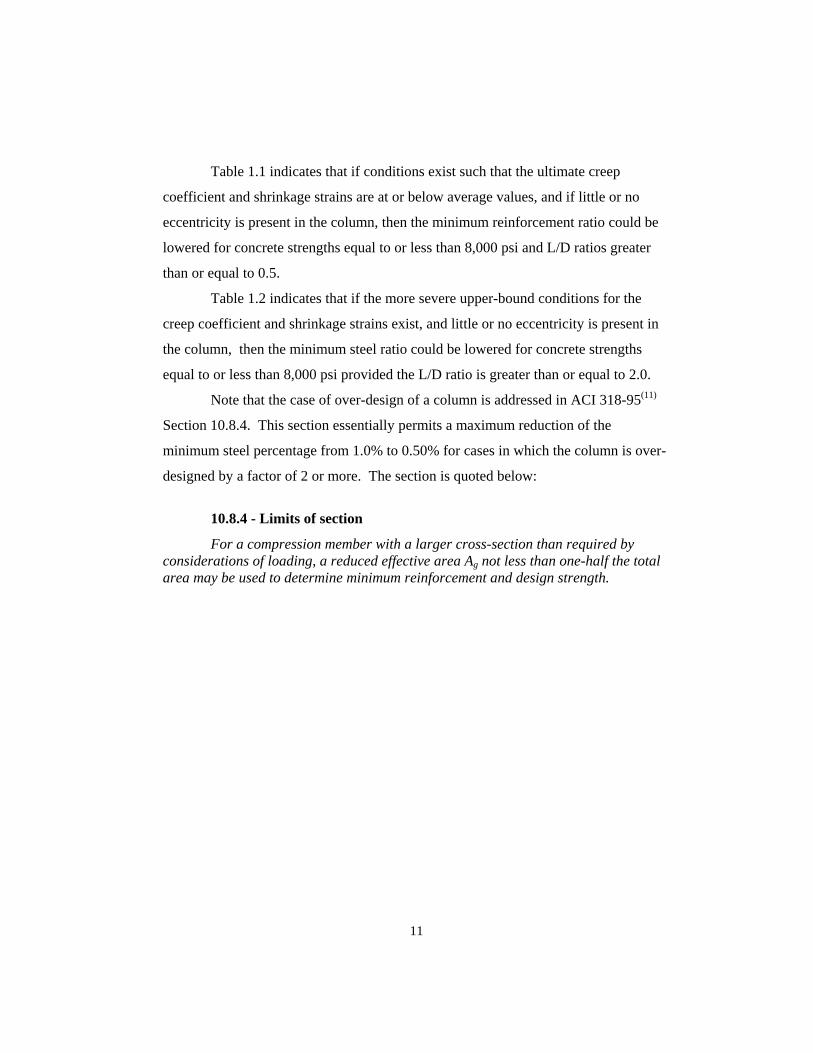
Note that the case of over-design of a column is addressed in ACI 318-95(11)
Section 10.8.4. This section essentially permits a maximum reduction of the
minimum steel percentage from 1.0% to 0.50% for cases in which the column is over-
designed by a factor of 2 or more. The section is quoted below:
10.8.4 - Limits of section
For a compression member with a larger cross-section than required by considerations of loading, a reduced effective area Ag not less than one-half the total area may be used to determine minimum reinforcement and design strength.
Chapter 2. REVIEW OF LITERATURE ON CREEP AND
SHRINKAGE OF REINFORCED CONCRETE COLUMNS
2.1 Introduction
This chapter summarizes the significant series of concrete column
investigations which were carried out in the first half of this century. The summary
begins with early work performed at the University of California. The most significant
investigations, which were conducted during the 1930’s at the University of Illinois and
Lehigh University, are also reviewed here.
2.2 Davis and Davis(1) - (March 1931)
This study is one of the earliest reported investigations of creep and shrinkage
of reinforced concrete columns. Part five of the study is the most applicable. The
stated purpose of this portion of the study was to determine the effect of reinforcement
on creep of concrete, and the effect of creep of concrete on stress in the reinforcement.
Davis and Davis tested a total of 8 reduced scale columns. All columns were
10 inches in diameter and 20 inches tall, and varied in reinforcement ratio and load
condition. Two specimens were unreinforced, two were reinforced with 1.9 percent
longitudinal steel in conjunction with 1.33 percent spiral reinforcement, and four
specimens were control specimens with no applied load.
The columns were axially loaded in a condition of constant stress. This was
achieved with steel plates and car springs. Prior to loading, the columns were stored for
50 days in 100% humidity and ten days in ambient conditions. Sixty days after casting,
axial load producing a stress of 800 psi was applied to the four loaded specimens. The
results presented in the report indicate a loading period of 18 months. The columns
were loaded and stored in a controlled atmosphere in which temperature was held
constant at 70 degrees Fahrenheit (plus or minus 1 degree F) and relative humidity was
maintained at 50 percent (plus or minus 1 percent). No mention was made of load
adjustment to compensate for creep and shrinkage of the columns.
12
One-half inch square internally threaded brass plugs were mounted in the forms
prior to casting. Stainless steel inserts were screwed into the brass plugs after the
concrete hardened. Three such inserts were installed around the circumference. In
addition, three sets of gage holes were made in the longitudinal reinforcing bars. Strain
measurements were made with a ten inch fulcrum type mechanical gage.
Significant conclusions were as follows:
1. For the unreinforced columns, combined creep and shrinkage after 18 months was
approximately six times greater than the instantaneous deformation that occurred after
load application.
2. For the reinforced columns, combined creep and shrinkage after 18 months was
approximately four times the instantaneous deformation.
3. Stress in the longitudinal steel was reported as follows:
Stress due to instantaneous deformation 5,700 psi
Stress due to creep 11,400 psi
Stress due to shrinkage 13,200 psi
Total change in steel stress 30,300 psi
4. Assuming the load not carried by longitudinal steel was uniformly distributed over
the full concrete cross-section, sustained stress in the concrete was reduced from 775
psi to 300 psi over the 18 month period.
5. The yield point of the steel should be a design consideration when columns are
subjected primarily to dead load and conditions which cause significant shrinkage.
The conclusions from this investigation assumed that creep and shrinkage can
be treated separately. Therefore, whatever change in length was not attributed to
shrinkage was assumed to be due to creep under sustained load.
A literature summary included with this investigation referenced a study
conducted by F.R. MacMillan(16). This study involved the instrumentation of columns
in an actual building on the University of Minnesota campus. The results indicated a
change in steel stress in the range of 36,000 to 45,000 psi.
13
2.3 Richart and Staehle( 2) - Second Progress Report - University of Illinois (March 1931) This study was part of the very significant concrete column investigations
carried out in tandem at the University of Illinois and Lehigh University. Series 3 of
this study concerned columns under sustained load. This second progress report dealt
with a loading period of 20 weeks.
Richart and Staehle tested 108 reinforced concrete columns in this series. All
columns had an outside diameter of 8-1/4 inches. The columns varied in reinforcement
ratio and load condition. Of the 108 columns, 60 were loaded and 48 were without
load. Forty-five unreinforced columns were added to the study. Of these 45 columns,
six were subjected to sustained load. Longitudinal steel ratios of approximately 1.5, 4
and 6 percent, and spiral steel ratios of 1.24 and 2 percent were investigated.
Longitudinal steel percentages were based on the core area of the column. The
reinforcement details are as follows:
Type of longitudinal bars Reinf. ratio Yield stress
(4) 1/2-inch dia. round 1.57 percent 45,600 psi
(8) 1/2-inch square 3.98 percent 53,400 psi
(4) 5/8-inch dia. round 5.98 percent 39,300 psi and (4) 3/4-inch dia. round 51,100 psi
14
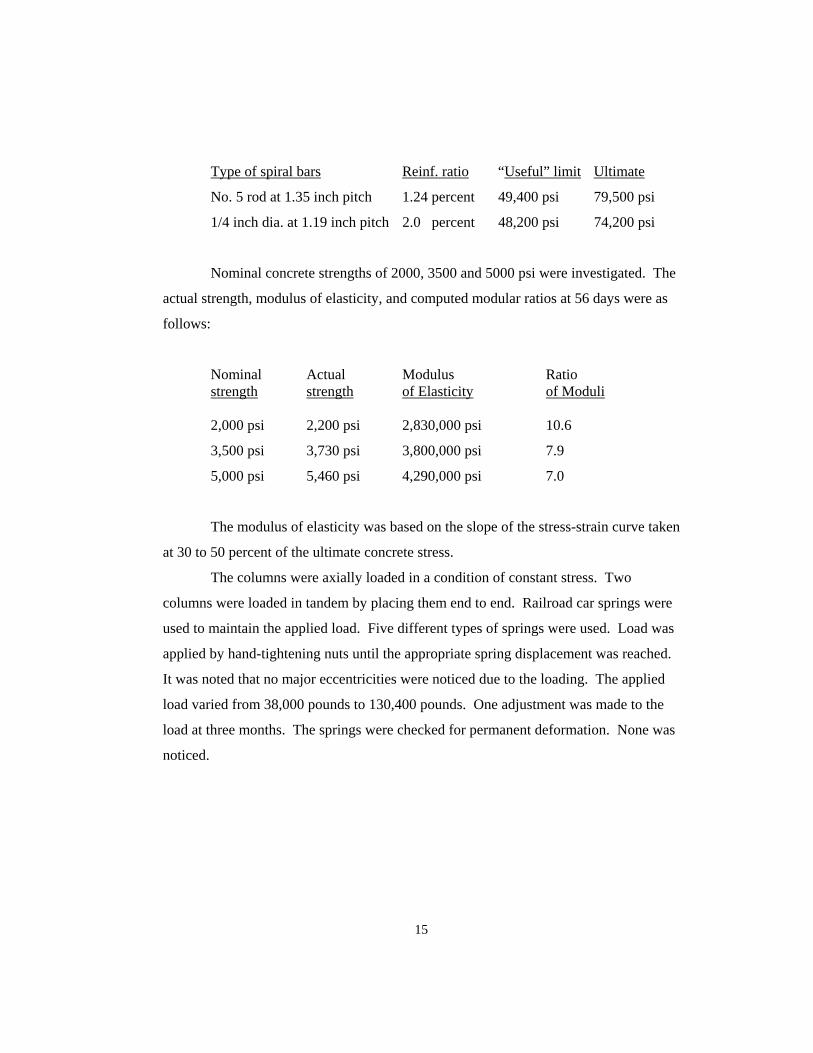
Type of spiral bars Reinf. ratio “Useful” limit Ultimate
No. 5 rod at 1.35 inch pitch 1.24 percent 49,400 psi 79,500 psi
1/4 inch dia. at 1.19 inch pitch 2.0 percent 48,200 psi 74,200 psi
Nominal concrete strengths of 2000, 3500 and 5000 psi were investigated. The
actual strength, modulus of elasticity, and computed modular ratios at 56 days were as
follows:
Nominal Actual Modulus Ratio strength strength of Elasticity of Moduli 2,000 psi 2,200 psi 2,830,000 psi 10.6
3,500 psi 3,730 psi 3,800,000 psi 7.9
5,000 psi 5,460 psi 4,290,000 psi 7.0
The modulus of elasticity was based on the slope of the stress-strain curve taken
at 30 to 50 percent of the ultimate concrete stress.
The columns were axially loaded in a condition of constant stress. Two
columns were loaded in tandem by placing them end to end. Railroad car springs were
used to maintain the applied load. Five different types of springs were used. Load was
applied by hand-tightening nuts until the appropriate spring displacement was reached.
It was noted that no major eccentricities were noticed due to the loading. The applied
load varied from 38,000 pounds to 130,400 pounds. One adjustment was made to the
load at three months. The springs were checked for permanent deformation. None was
noticed.
15
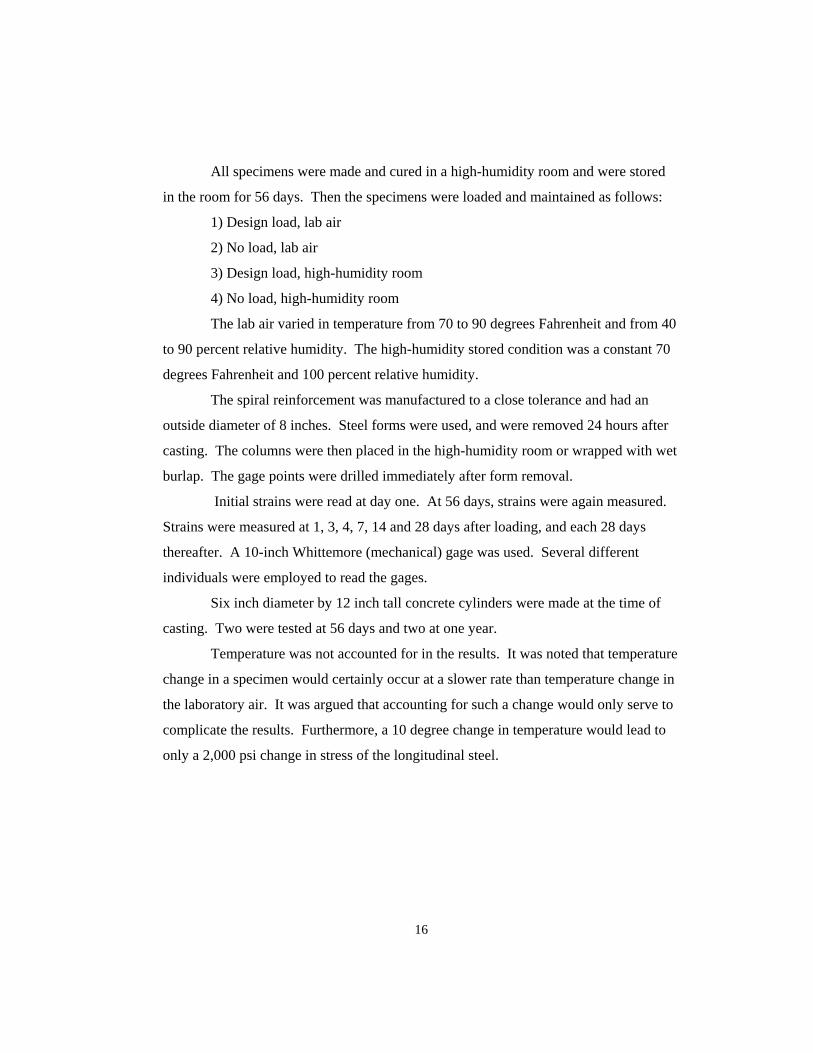
All specimens were made and cured in a high-humidity room and were stored
in the room for 56 days. Then the specimens were loaded and maintained as follows:
1) Design load, lab air
2) No load, lab air
3) Design load, high-humidity room
4) No load, high-humidity room
The lab air varied in temperature from 70 to 90 degrees Fahrenheit and from 40
to 90 percent relative humidity. The high-humidity stored condition was a constant 70
degrees Fahrenheit and 100 percent relative humidity.
The spiral reinforcement was manufactured to a close tolerance and had an
outside diameter of 8 inches. Steel forms were used, and were removed 24 hours after
casting. The columns were then placed in the high-humidity room or wrapped with wet
burlap. The gage points were drilled immediately after form removal.
Initial strains were read at day one. At 56 days, strains were again measured.
Strains were measured at 1, 3, 4, 7, 14 and 28 days after loading, and each 28 days
thereafter. A 10-inch Whittemore (mechanical) gage was used. Several different
individuals were employed to read the gages.
Six inch diameter by 12 inch tall concrete cylinders were made at the time of
casting. Two were tested at 56 days and two at one year.
Temperature was not accounted for in the results. It was noted that temperature
change in a specimen would certainly occur at a slower rate than temperature change in
the laboratory air. It was argued that accounting for such a change would only serve to
complicate the results. Furthermore, a 10 degree change in temperature would lead to
only a 2,000 psi change in stress of the longitudinal steel.
16
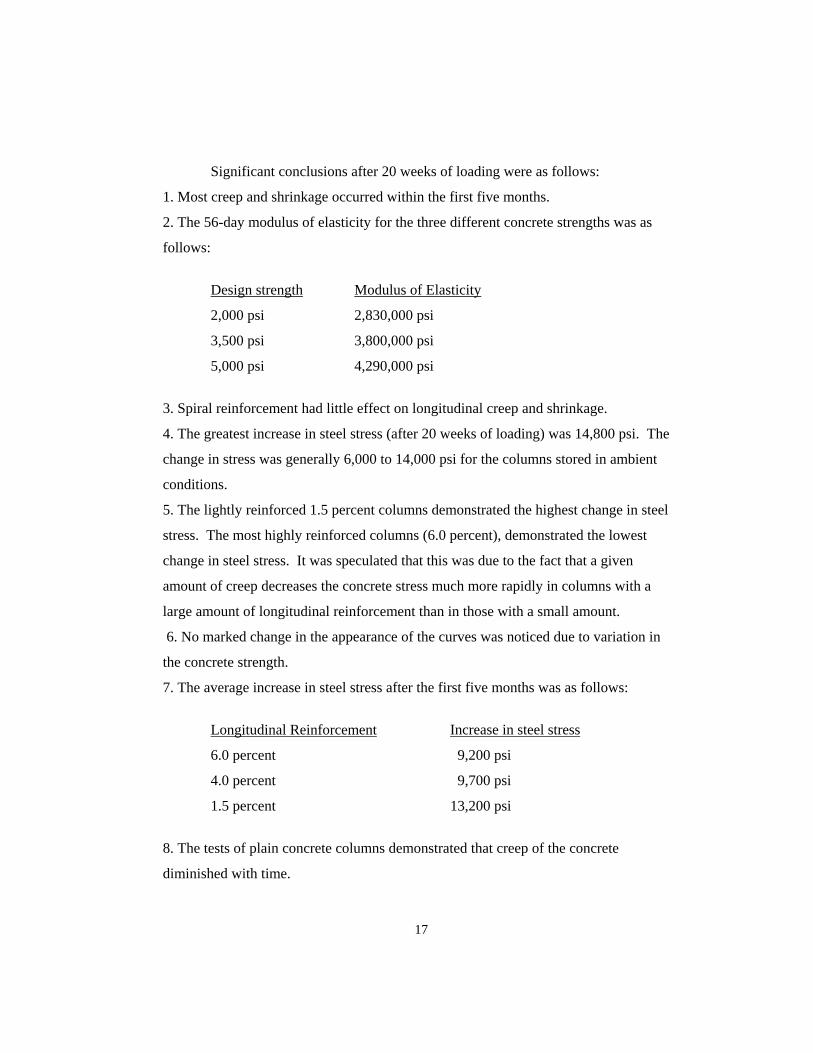
Significant conclusions after 20 weeks of loading were as follows:
1. Most creep and shrinkage occurred within the first five months.
2. The 56-day modulus of elasticity for the three different concrete strengths was as
follows:
Design strength Modulus of Elasticity
2,000 psi 2,830,000 psi
3,500 psi 3,800,000 psi
5,000 psi 4,290,000 psi
3. Spiral reinforcement had little effect on longitudinal creep and shrinkage.
4. The greatest increase in steel stress (after 20 weeks of loading) was 14,800 psi. The
change in stress was generally 6,000 to 14,000 psi for the columns stored in ambient
conditions.
5. The lightly reinforced 1.5 percent columns demonstrated the highest change in steel
stress. The most highly reinforced columns (6.0 percent), demonstrated the lowest
change in steel stress. It was speculated that this was due to the fact that a given
amount of creep decreases the concrete stress much more rapidly in columns with a
large amount of longitudinal reinforcement than in those with a small amount.
6. No marked change in the appearance of the curves was noticed due to variation in
the concrete strength.
7. The average increase in steel stress after the first five months was as follows:
Longitudinal Reinforcement Increase in steel stress
6.0 percent 9,200 psi
4.0 percent 9,700 psi
1.5 percent 13,200 psi
8. The tests of plain concrete columns demonstrated that creep of the concrete
diminished with time.
17
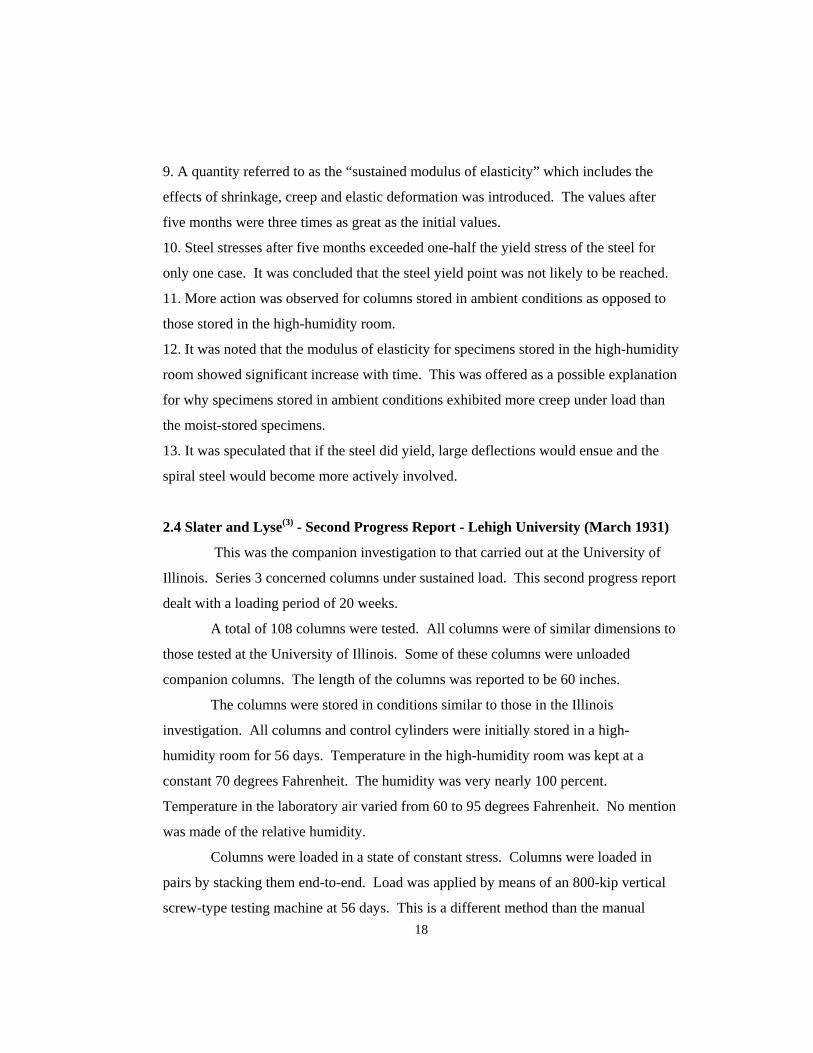
9. A quantity referred to as the “sustained modulus of elasticity” which includes the
effects of shrinkage, creep and elastic deformation was introduced. The values after
five months were three times as great as the initial values.
10. Steel stresses after five months exceeded one-half the yield stress of the steel for
only one case. It was concluded that the steel yield point was not likely to be reached.
11. More action was observed for columns stored in ambient conditions as opposed to
those stored in the high-humidity room.
12. It was noted that the modulus of elasticity for specimens stored in the high-humidity
room showed significant increase with time. This was offered as a possible explanation
for why specimens stored in ambient conditions exhibited more creep under load than
the moist-stored specimens.
13. It was speculated that if the steel did yield, large deflections would ensue and the
spiral steel would become more actively involved.
2.4 Slater and Lyse(3) - Second Progress Report - Lehigh University (March 1931)
This was the companion investigation to that carried out at the University of
Illinois. Series 3 concerned columns under sustained load. This second progress report
dealt with a loading period of 20 weeks.
A total of 108 columns were tested. All columns were of similar dimensions to
those tested at the University of Illinois. Some of these columns were unloaded
companion columns. The length of the columns was reported to be 60 inches.
The columns were stored in conditions similar to those in the Illinois
investigation. All columns and control cylinders were initially stored in a high-
humidity room for 56 days. Temperature in the high-humidity room was kept at a
constant 70 degrees Fahrenheit. The humidity was very nearly 100 percent.
Temperature in the laboratory air varied from 60 to 95 degrees Fahrenheit. No mention
was made of the relative humidity.
Columns were loaded in a state of constant stress. Columns were loaded in
pairs by stacking them end-to-end. Load was applied by means of an 800-kip vertical
screw-type testing machine at 56 days. This is a different method than the manual 18
tightening of nuts that was used at Illinois. A small excess load was applied to
compensate for the elongation of the rods and bending of plates that was expected upon
raising the loading head. The columns were then stored in laboratory air or moist cured
according to schedule.
Load on the columns stored in ambient laboratory conditions was readjusted
after three months. The entire loading rig was placed back in the loading machine and
the initial loading procedure was again carried out. At this time, the average decrease in
load was found to be seven percent. Four percent was attributed to the deformation of
the columns, and three percent to permanent set of the springs. Columns stored in the
high-humidity room did not require readjustment.
Nominal concrete strengths of 2000, 3500 and 5000 psi were investigated. The
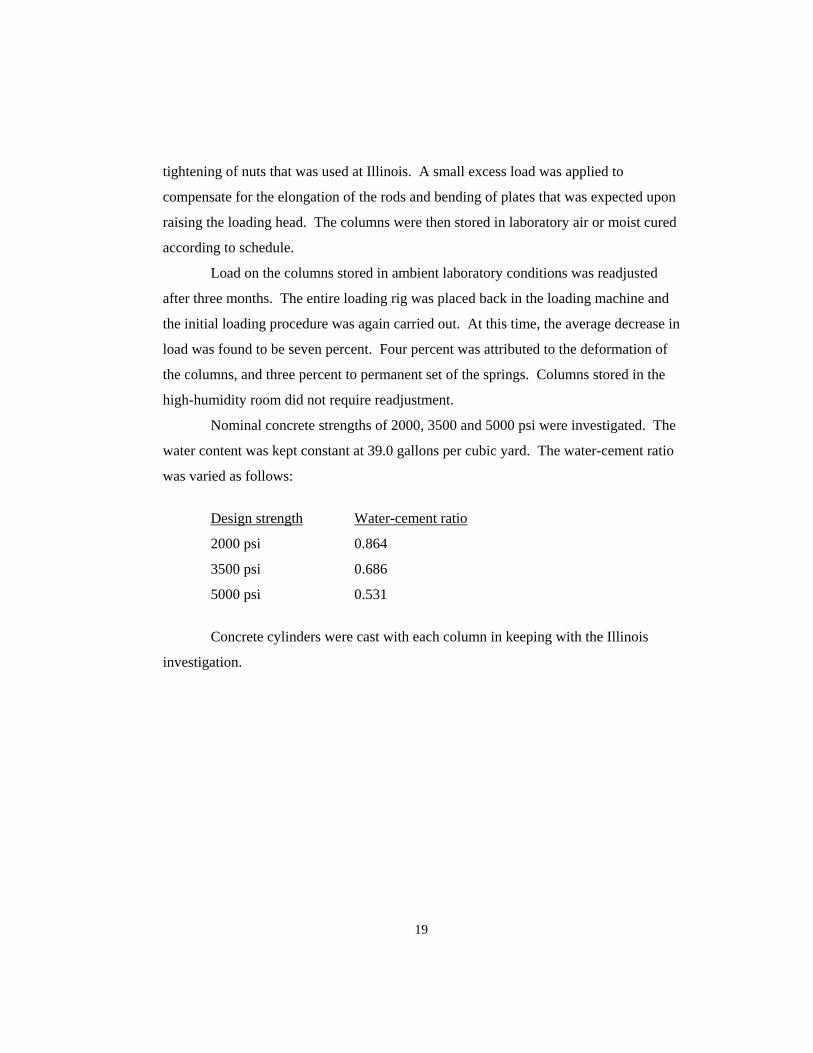
water content was kept constant at 39.0 gallons per cubic yard. The water-cement ratio
was varied as follows:
Design strength Water-cement ratio
2000 psi 0.864
3500 psi 0.686
5000 psi 0.531
Concrete cylinders were cast with each column in keeping with the Illinois
investigation.
19
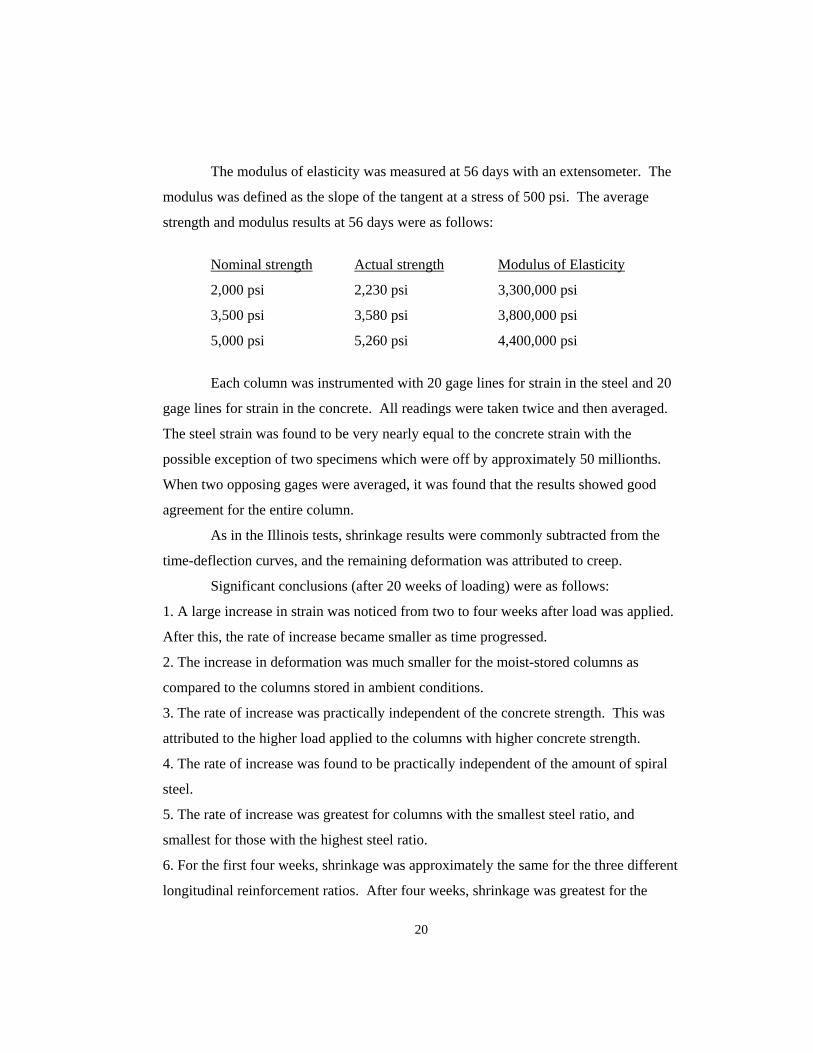
The modulus of elasticity was measured at 56 days with an extensometer. The
modulus was defined as the slope of the tangent at a stress of 500 psi. The average
strength and modulus results at 56 days were as follows:
Nominal strength Actual strength Modulus of Elasticity
2,000 psi 2,230 psi 3,300,000 psi
3,500 psi 3,580 psi 3,800,000 psi
5,000 psi 5,260 psi 4,400,000 psi
Each column was instrumented with 20 gage lines for strain in the steel and 20
gage lines for strain in the concrete. All readings were taken twice and then averaged.
The steel strain was found to be very nearly equal to the concrete strain with the
possible exception of two specimens which were off by approximately 50 millionths.
When two opposing gages were averaged, it was found that the results showed good
agreement for the entire column.
As in the Illinois tests, shrinkage results were commonly subtracted from the
time-deflection curves, and the remaining deformation was attributed to creep.
Significant conclusions (after 20 weeks of loading) were as follows:
1. A large increase in strain was noticed from two to four weeks after load was applied.
After this, the rate of increase became smaller as time progressed.
2. The increase in deformation was much smaller for the moist-stored columns as
compared to the columns stored in ambient conditions.
3. The rate of increase was practically independent of the concrete strength. This was
attributed to the higher load applied to the columns with higher concrete strength.
4. The rate of increase was found to be practically independent of the amount of spiral
steel.
5. The rate of increase was greatest for columns with the smallest steel ratio, and
smallest for those with the highest steel ratio.
6. For the first four weeks, shrinkage was approximately the same for the three different
longitudinal reinforcement ratios. After four weeks, shrinkage was greatest for the
20
columns with the smallest steel ratio and least for those with the largest steel ratio.
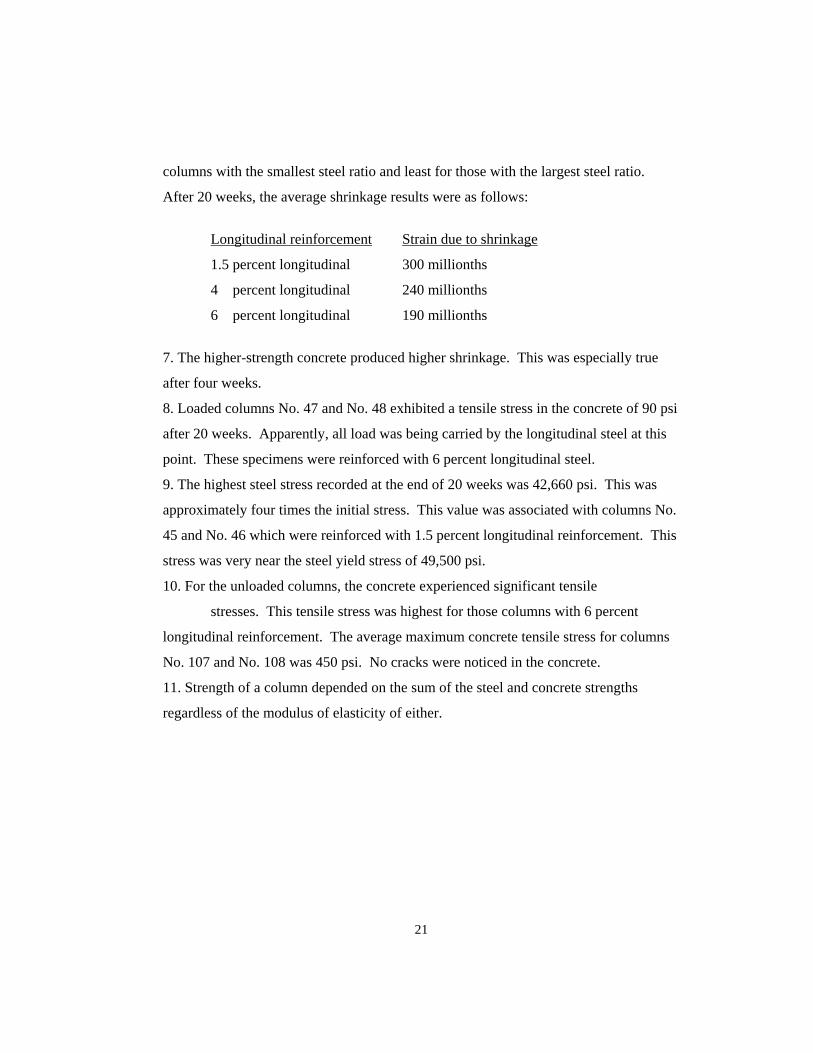
After 20 weeks, the average shrinkage results were as follows:
Longitudinal reinforcement Strain due to shrinkage
1.5 percent longitudinal 300 millionths
4 percent longitudinal 240 millionths
6 percent longitudinal 190 millionths
7. The higher-strength concrete produced higher shrinkage. This was especially true
after four weeks.
8. Loaded columns No. 47 and No. 48 exhibited a tensile stress in the concrete of 90 psi
after 20 weeks. Apparently, all load was being carried by the longitudinal steel at this
point. These specimens were reinforced with 6 percent longitudinal steel.
9. The highest steel stress recorded at the end of 20 weeks was 42,660 psi. This was
approximately four times the initial stress. This value was associated with columns No.
45 and No. 46 which were reinforced with 1.5 percent longitudinal reinforcement. This
stress was very near the steel yield stress of 49,500 psi.
10. For the unloaded columns, the concrete experienced significant tensile
stresses. This tensile stress was highest for those columns with 6 percent
longitudinal reinforcement. The average maximum concrete tensile stress for columns
No. 107 and No. 108 was 450 psi. No cracks were noticed in the concrete.
11. Strength of a column depended on the sum of the steel and concrete strengths
regardless of the modulus of elasticity of either.
21
The question was raised as to whether the capacity of a column will be reduced
when longitudinal steel is stressed (by time-dependent deformations) beyond its yield
point. Also, questions of the effects of eccentricity, redistribution of moment in
indeterminate structures, and deflections under indefinite periods of loading were
raised.
This investigation concluded with theoretical formulations by W. H.
Glanville(17) for the prediction of creep, shrinkage and initial elastic deformations.
Other early investigations were also discussed.
The F. R. MacMillan study was again mentioned. The MacMillan study was
said to have begun two months after casting and to have been monitored for six years
by the time this second progress report was produced. One column (column No. 19)
exhibited a steel stress of 45,000 psi by this time. It is probable that the steel had
reached its yield stress. No physical signs of distress were noticed in the column.
2. 5 Richart and Staehle(4) - Fourth Progress Report - University of Illinois (January 1932) This report presented further results for the columns under sustained load
discussed previously. The second progress report dealt with a loading period of 20
weeks. This fourth report dealt with a loading period of 52 weeks. The strength and
deformations when tested to failure were also discussed.
Eighteen plain and 26 reinforced columns were not tested to failure, but rather
were retained for further observation during a second year.
22
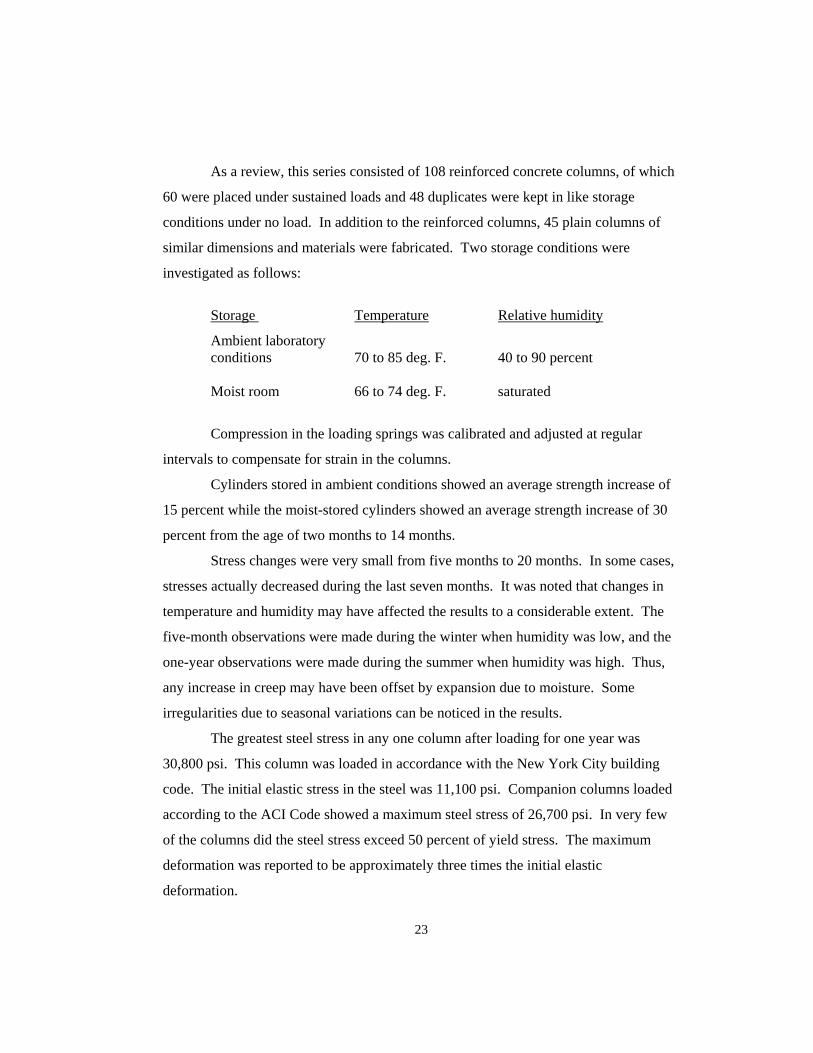
As a review, this series consisted of 108 reinforced concrete columns, of which
60 were placed under sustained loads and 48 duplicates were kept in like storage
conditions under no load. In addition to the reinforced columns, 45 plain columns of
similar dimensions and materials were fabricated. Two storage conditions were
investigated as follows:
Storage Temperature Relative humidity
Ambient laboratory conditions 70 to 85 deg. F. 40 to 90 percent Moist room 66 to 74 deg. F. saturated
Compression in the loading springs was calibrated and adjusted at regular
intervals to compensate for strain in the columns.
Cylinders stored in ambient conditions showed an average strength increase of
15 percent while the moist-stored cylinders showed an average strength increase of 30
percent from the age of two months to 14 months.
Stress changes were very small from five months to 20 months. In some cases,
stresses actually decreased during the last seven months. It was noted that changes in
temperature and humidity may have affected the results to a considerable extent. The
five-month observations were made during the winter when humidity was low, and the
one-year observations were made during the summer when humidity was high. Thus,
any increase in creep may have been offset by expansion due to moisture. Some
irregularities due to seasonal variations can be noticed in the results.
The greatest steel stress in any one column after loading for one year was
30,800 psi. This column was loaded in accordance with the New York City building
code. The initial elastic stress in the steel was 11,100 psi. Companion columns loaded
according to the ACI Code showed a maximum steel stress of 26,700 psi. In very few
of the columns did the steel stress exceed 50 percent of yield stress. The maximum
deformation was reported to be approximately three times the initial elastic
deformation.
23
Regarding the effect of concrete strength and longitudinal reinforcement ratio,
results were similar to those stated in the second progress report. Deformation versus
time curves were observed to flatten as time progressed but exhibited enough increase
to warrant retaining certain specimens for at least another year.
The unreinforced columns were loaded to 500, 875, and 1250 psi, or one-fourth
the nominal 56-day concrete strengths. This was considerably less than the concrete
stresses in the reinforced specimens when initially loaded, and slightly greater than
concrete stresses in the reinforced specimens after one year of sustained loading. The
greatest total deformation was found to be 0.0012 for the 3500 psi concrete. If the
effects of shrinkage were deducted, the net creep was essentially the same for the 3,500
psi and 5,000 psi columns. Shrinkage for all three grades of concrete was nearly
constant and equal to 0.0004 at eight or nine months.
24
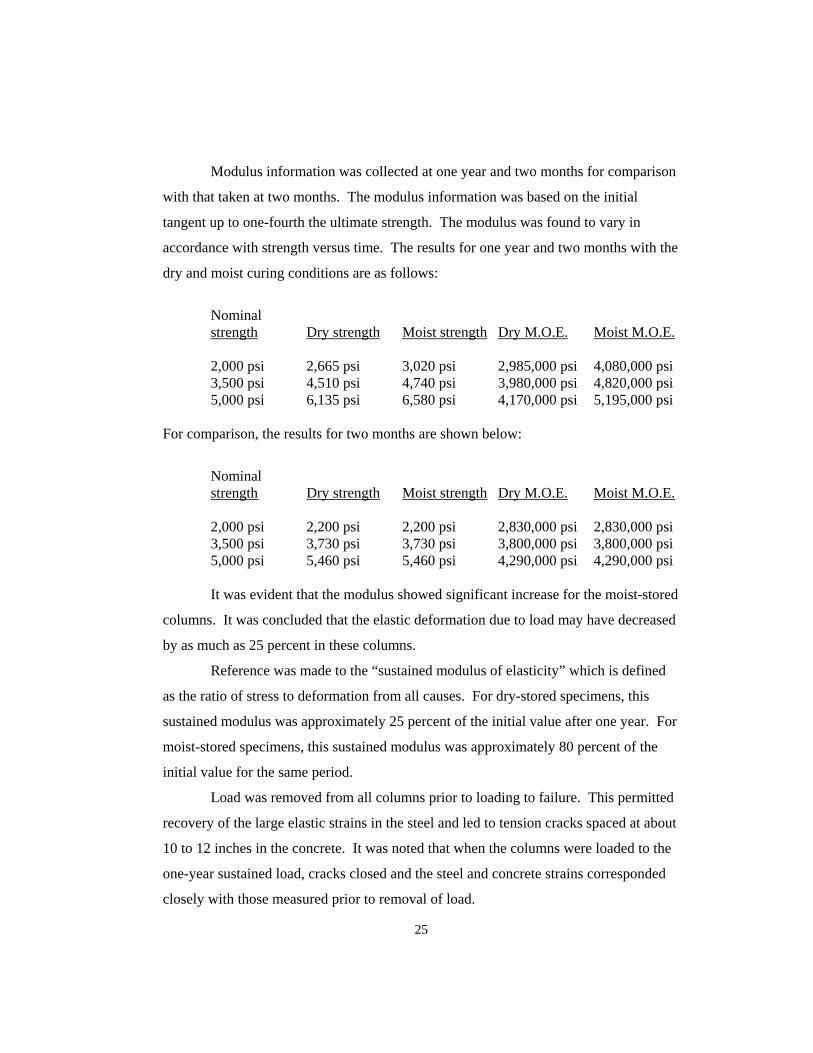
Modulus information was collected at one year and two months for comparison
with that taken at two months. The modulus information was based on the initial
tangent up to one-fourth the ultimate strength. The modulus was found to vary in
accordance with strength versus time. The results for one year and two months with the
dry and moist curing conditions are as follows:
Nominal strength Dry strength Moist strength Dry M.O.E. Moist M.O.E. 2,000 psi 2,665 psi 3,020 psi 2,985,000 psi 4,080,000 psi 3,500 psi 4,510 psi 4,740 psi 3,980,000 psi 4,820,000 psi 5,000 psi 6,135 psi 6,580 psi 4,170,000 psi 5,195,000 psi For comparison, the results for two months are shown below:
Nominal strength Dry strength Moist strength Dry M.O.E. Moist M.O.E. 2,000 psi 2,200 psi 2,200 psi 2,830,000 psi 2,830,000 psi 3,500 psi 3,730 psi 3,730 psi 3,800,000 psi 3,800,000 psi 5,000 psi 5,460 psi 5,460 psi 4,290,000 psi 4,290,000 psi It was evident that the modulus showed significant increase for the moist-stored
columns. It was concluded that the elastic deformation due to load may have decreased
by as much as 25 percent in these columns.
Reference was made to the “sustained modulus of elasticity” which is defined
as the ratio of stress to deformation from all causes. For dry-stored specimens, this
sustained modulus was approximately 25 percent of the initial value after one year. For
moist-stored specimens, this sustained modulus was approximately 80 percent of the
initial value for the same period.
Load was removed from all columns prior to loading to failure. This permitted
recovery of the large elastic strains in the steel and led to tension cracks spaced at about
10 to 12 inches in the concrete. It was noted that when the columns were loaded to the
one-year sustained load, cracks closed and the steel and concrete strains corresponded
closely with those measured prior to removal of load.
25
For the unloaded companion columns, no shrinkage cracks were observed. It
was noted that the difference in strains between the plain and reinforced columns was in
excess of 0.0002, which is an amount of strain generally considered to cause tensile
cracking under rapidly applied load. It was concluded that a considerable amount of
tensile creep occurred to inhibit the formation of cracks.
Strength of the columns which had been subjected to load for one year was
compared to strength of the unloaded companion columns. No significant difference in
strength was observed.
The ratio of column strength (dimensions 8-1/4 inch diameter by 60 inch long)
to cylinder strength (dimensions 6 inch diameter by 12 inch long) was found to be 0.86
for air-stored columns and 0.71 for moist-stored columns.
It was noted that the ultimate strength values for similar columns at Lehigh
University were somewhat lower in most cases due to the use of a spherical head at one
end of the column, whereas strength tests performed at the University of Illinois were
made using flat test heads on the columns.
Significant conclusions (after 52 weeks of loading) were as follows:
1. The largest stress noted in the longitudinal steel occurred in a column constructed
with 3,500 psi concrete and 1.5 percent longitudinal reinforcement. The steel stress
reached a value of 30,800 psi. This column was loaded in accordance with the New
York City building code. A similar column loaded in accordance with the ACI Code
reached a stress of 26,700 psi. These stresses were still well below the yield point of
45,600 psi for the steel in these columns.
2. The ultimate strength of columns under sustained load was the same as the ultimate
strength of unloaded companion columns.
3. The increase in strength of control cylinders was about 15 percent for dry-stored and
about 30 percent for moist-stored cylinders at one year and 2 months. The modulus of
elasticity increased 30 percent over the same period for the moist-stored cylinders but
there was no consistent increase for the dry-stored cylinders.
4. The ratio of the strength of 8-1/4 inch by 60 inch plain columns to that of 6 by 12
inch cylinders was 86 percent for one year dry-stored columns and 71 percent for one 26
year moist-stored columns. This relative strength was apparently obtained for the
reinforced columns as well.
This progress report concluded with series 5 and series 6 which were ultimate
strength tests of large diameter columns. These series had some applicability and will
be briefly discussed.
The purpose of series 5 was to ensure that actual-size columns, as used in
building construction, would behave similarly to the model-size columns used in the
majority of the test program. Series 5 consisted of 20 columns of 12, 20, and 28-inch
core diameters. No cover was used with these columns. Each column had a height of
7-1/2 times the core diameter. The nominal concrete strength was 2,000 or 3,500 psi
and the longitudinal reinforcement ratio was 1.5 or 4 percent of the core area. The
spiral was always 1 percent of the core volume. It was generally concluded that there
seemed to be no variation in strength with the size of the column.
The purpose of series 6 was to investigate the effect of the concrete shell.
Fourteen columns having core diameters of 8, 12, 20, and 28 inches were investigated.
The height was again 7-1/2 times the diameter. The longitudinal steel ratio was 4
percent for all columns. The columns with shells were, in general, found to be as strong
as those without. For the smaller 8 inch diameter columns, in which the strength of the
shell was greater than the margin of strength produced by the spiral, the columns with
shells were considerably stronger than those without.
27
2.6 Lyse and Kreidler(5) - Fourth Progress Report - Lehigh University (January 1932) This report presented further results for the columns under sustained load at
Lehigh which were discussed previously. In similar fashion to the Illinois test program,
the second progress report dealt with a loading period of 20 weeks. This fourth report
dealt with a loading period of 52 weeks. The strength and deformations for columns
tested to failure were also discussed.
Twelve dry-stored columns were retained for further tests. Eight were under
sustained load and four were companion columns. These columns were loaded for 52
additional weeks.
The strength of the dry-stored columns was found to be slightly higher at 60
weeks than at eight weeks. In contrast, the moist-stored concrete showed a significant
strength increase of 14 percent after being stored for 60 weeks. The modulus increased
similarly. The 60 week results with dry and moist curing conditions are as follows:
Nominal strength Dry strength Moist strength Dry M.O.E. Moist M.O.E. 2,000 psi 2,240 psi 2,530 psi 2,700,000 psi 4,000,000 psi 3,500 psi 3,590 psi 4,030 psi 4,100,000 psi 4,500,000 psi 5,000 psi 5,520 psi 6,110 psi 3,800,000 psi 4,900,000 psi Load was adjusted at regular intervals to compensate for deformation of the
columns. The permanent set in the springs was found to be four percent for both dry
and moist-stored specimens.
After 52 weeks under load, the load was released in intervals and the strains
measured. When the load was released, the dry-stored columns developed transverse
cracks while the moist-stored columns did not.
At 52 weeks, still very little difference in creep was noticed for different spiral
reinforcement percentages. In contradiction to the results of 20 weeks, the results at 52
weeks exhibited a slight increase in creep with increase in the concrete strength.
28
The higher-strength concrete experienced the greatest shrinkage. The higher
the percentage of longitudinal steel, the less shrinkage occurred. The shrinkage was
greatest in the dry-stored columns at 20 weeks when air temperature and humidity were
at a minimum.
After 52 weeks, the average steel stresses for different concrete strengths were
as follows:
Nominal strength Steel stress 2,000 psi 30,000 psi
5,000 psi 37,000 psi
The rate of increase of stress in the steel was much higher for columns having
1.5 percent longitudinal steel than for columns having 6 percent. It was noted that no
stress existed in the concrete after 52 weeks for the columns with 2,000 psi concrete and
6 percent longitudinal reinforcement. The longitudinal steel was assumed to carry all
the load.
Every dry-stored column showed transverse cracking upon release of the load.
The columns with the highest percentages of reinforcement had the largest crack
widths. The moist-stored columns were carefully inspected visually and strain
measurements were made. None of the moist-stored columns exhibited cracking.
When tested to failure, transverse cracks in the dry-stored columns did not
close completely. The longitudinal steel buckled in the columns without spiral
reinforcement. For columns having no spiral reinforcement, the strength of the concrete
had little effect on the load carried by the concrete.
29
The average stress in the steel for dry-stored columns was found to increase
under sustained load as follows:
Longitudinal reinforcement Initial elastic 52 weeks 1.5 percent 6,000 psi 37,000 psi
6 percent 16,000 psi 30,000 psi
The average stress in the steel for moist-stored columns was found to be
significantly less than for the dry-stored columns. It increased under sustained load as
follows:
Longitudinal reinf. Initial elastic 52 weeks
Averaged 12,000 psi 19,000 psi
When tested to failure, it was found that the strength of the loaded columns
varied between 95 and 112 percent of the strength of the unloaded companion columns.
It was concluded that sustained loading had no effect upon the strength of the columns.
The strength of the column varied directly with the amount of longitudinal
reinforcement and with the yield stress of the longitudinal steel. The rate of variation
was nearly the same for the three different strengths of concrete used. The strength of
the columns increased quite regularly with an increase in the percentage of spiral
reinforcement.
Significant conclusions (after 52 weeks of loading) were as follows:
1. The deformation due to creep under sustained load was slightly greater for columns
with higher-strength concrete.
2. The deformation due to creep was greatest for columns having no spiral
reinforcement. No substantial difference could be found for columns with 1.2 and 2.0
percent spiral reinforcement.
3. The rate of creep was greatest for columns with the smallest percentages of
longitudinal reinforcement.
30
4. For columns with the same percentage of longitudinal steel, shrinkage was greatest
for those with the higher strength concrete.
5. For columns with the same strength concrete, the least amount of longitudinal steel
resulted in the greatest shrinkage.
6. The stress-strain curve for any column showed no definite yield point.
7. None of the unloaded columns cracked during the storage period.
8. Stress in the steel of dry-stored columns subjected to ACI working loads for 52
weeks increased from 6,000 to 37,000 psi for columns having 1.5 percent longitudinal
reinforcement, and from 16,000 to 30,000 psi for columns having 6 percent longitudinal
reinforcement. For moist-stored columns the average stress in the steel increased from
approximately 12,000 to approximately 19,000 psi.
9. Sustaining an applied working load for 52 weeks had no appreciable effect on
ultimate strength of the columns.
10. Strength of columns having concrete of the same strength and the same total yield
strength for longitudinal reinforcement increased with increase in spiral reinforcement.
11. Ultimate strength of a concrete column having no spiral reinforcement was
considered to equal 75 percent of the cylinder strength times the net core area plus the
yield strength of the steel. If a spiral was included, the yield strength of the spiral times
its effectiveness ratio was to be added.
2.7 Lyse(6) - Fifth Progress Report - Lehigh University (June 1933)
The intent of this series of tests was to investigate the maximum load that a
concrete column could sustain indefinitely. Therefore, all columns in this investigation
were loaded to very high percentages of the calculated ultimate load. Twenty-eight
columns were loaded from between 70 and 100 percent of the calculated ultimate load.
All columns had an outside diameter of 8-1/4 inches and were 60 inches long. All
columns had either 4 or 6 percent longitudinal reinforcement and 0, 1.2 or 2 percent
spiral reinforcement. The nominal strength of the concrete was 3,500 psi in all cases.
The columns were in most cases loaded at 56 days.
The material properties of the reinforcing steel were as follows: 31
Reinforcement Yield stress Ultimate stress
4 percent long. 44,000 psi 64,400 psi
6 percent long. 44,700 psi 70,000 psi
1.2 percent spiral none 85,500 psi
2.0 percent spiral none 74,700 psi
In each case, three identical columns were failed by a “fast” loading procedure
to determine the ultimate strength of the column. Then companion columns were
loaded to significant percentages of this ultimate load and observed until failure
occurred.
The loading rigs were similar to those used in previous tests at Lehigh
University. Helical springs were again used to maintain load, and initial load was again
applied in an 800 kip testing machine. The distance between the outside of the column
and the vertical rods was 1/2 inch. Load was measured and adjusted by measuring
strain in the steel rods with a mechanical strain gage. Adjustments were made to the
load by hand-tightening the nuts.
Column 7 (4 percent longitudinal, 0 percent spiral) was loaded at 56 days to 80
percent of ultimate load for 115 days, then it was removed from the loading rig. The
longitudinal steel had been stressed well beyond yield but the column still failed 17
percent higher than the calculated ultimate load.
Column 6 (4 percent longitudinal, 0 percent spiral) was loaded at 56 days to 80
percent of ultimate for a period of 700 days. It was noted that for the first year a large
increase in deformation was observed. After the first year, the deformation increased
very slowly but did not stop entirely. Total deformation of the column was
approximately four times the yield strain of the longitudinal reinforcement. It was
noted that, with the exception of a few vertical cracks near the ends of the column
(which developed shortly after the time of loading), no signs of distress were present. It
was concluded that this column could carry 80 percent of ultimate load indefinitely.
32
Column 11 (4 percent longitudinal, 1.2 percent spiral) was loaded at 112 days
to 95 percent of ultimate load. This column failed after 45 minutes.
Column 12 (4 percent longitudinal, 1.2 percent spiral) was loaded at 112 days
to
90 percent of ultimate load. It sustained this load for 65 hours but deflected laterally so
much that it rested against the vertical rods of the loading rig. It was removed and
loaded to failure.
Column 13 (4 percent longitudinal, 1.2 percent spiral) was also loaded at 112
days to 90 percent of ultimate load. At the time of the report, the column had sustained
the load for 500 days. The strain at 500 days was approximately ten times the yield
strain of the longitudinal reinforcement. It was noted that column 13 did not appear to
be in danger of failure. The cover had spalled off in several places.
Column 14 was stored as a control column for column 13. This column was
left unloaded to determine temperature and shrinkage strains. These strains were found
to correspond to a stress of 7,500 psi in the longitudinal reinforcement.
Column 18 (4 percent longitudinal, 1.2 percent spiral) was loaded at 56 days to
95 percent of ultimate load. The column sustained this load for one day but buckled so
badly the test was discontinued.
Column 19 was similar except it was loaded to 90 percent of ultimate. This
column also buckled after one day.
Column 20 (4 percent longitudinal, 1.2 percent spiral) was loaded at 56 days to
85 percent of ultimate. At the time of the report, it had sustained this load for more than
300 days. The strain in the longitudinal steel was approximately 7 times the yield
strain. This column had also buckled and was resting on the vertical rods of the loading
rig.
Column 21 (4 percent longitudinal, 1.2 percent spiral) was loaded at 56 days to
80 percent of ultimate. At the time of the report, it had sustained this load for more than
300 days. The strain in the longitudinal steel was approximately 5-1/2 times the yield
strain. This column also buckled and was nearly resting on the vertical rods of the
loading rig. The concrete outside the spiral had begun to spall. 33

Column 25 (6 percent longitudinal, 2.0 percent spiral) was loaded at 56 days to
90 percent of ultimate. At the time of the report, it had sustained this load for nearly 300
days. Strain in the longitudinal steel was approximately 7-1/2 times yield strain. This
column had buckled and was resting on the vertical rods of the loading rig. Concrete
outside the spiral had begun to spall.
Significant conclusions are as follows:
1. The longitudinal reinforcement will carry its full yield stress at strains far in excess of
yield strain.
2. The strength of the column was not decreased by being strained far beyond the yield
point of its steel before loading to failure.
3. A reinforced concrete column will probably carry 80 percent of ultimate load for an
indefinite period of time.
4. A column having no spiral or a small amount of spiral reinforcement will carry 80
percent of ultimate load at less deformation and with fewer signs of distress than will a
column having a larger amount of spiral reinforcement.
2.8 Richart(7) - Tentative Final Report of Committee 105 (February 1933)
This report summarized the majority of the work carried out at Illinois and
Lehigh.
One formula was presented for the ultimate strength of reinforced concrete
columns. It was noted that this equation applied to concrete strengths from 2,000 to
8,000 psi and for longitudinal reinforcement of 1.5, 4.0, and 6.0 percent and
longitudinal steel yield stresses of 39,000 to 68,000 psi. Other formulas were given for
the yield point of all columns and the ultimate strength of tied columns.
It was noted that in extreme cases the steel stresses had reached 30,000 to
42,000 psi after five months of load application. The average increase in steel stress
was approximately 12,000 psi in the Illinois tests and about 20,000 psi in the Lehigh
tests. From five months to one year the increase was only about 2,000 psi more, and
from one year to two years another 2,000 psi was measured.
34
Design formulas were presented for the maximum permissible load on spirally
reinforced columns, and for tied columns. A design formula for the spiral ratio was also
given.
A minimum reinforcement ratio of 0.010 was set for spirally reinforced
columns and a minimum reinforcement ratio of 0.005 was set tied columns. The
minimum number of bars was set as four for both cases. Little or no justification was
given for the two different minimum reinforcement ratios.
A minority recommendation for design formulas was given by Bertin and Lyse.
They also suggested a minimum ratio of 0.010 for spirally reinforced and 0.005 for tied
columns. Again no justification was given for the difference between spiral and tied
columns.
2.9 Logeman, Mensch, DiStasio(8) - Discussion of Report of Committee 105 - (Sept.- Oct. 1933) These discussions were primarily concerned with the split in the committee
over the proposed design formulas. In particular, to what extent the spiral could be
counted on for ultimate and working loads was discussed by several contributors. The
concepts of elastic versus plastic design formulas and behavior was discussed.
DiStasio pointed out the lack of support given for a minimum limit on
longitudinal reinforcement of 0.010 for spiral columns as opposed to 0.005 for tied
columns. He also called for further testing of the effects of bending prior to the
acceptance of formulas for design.
2.10 Richart(9) - Discussion of Report of Committee 105, Closure by Chairman, Committee 105 - (Nov.-Dec. 1933)
This discussion again focused on the division among the committee. The
majority report allowed for a smaller contribution of the spiral reinforcement as
opposed to the minority report. This was justified by the fact that the spiral did not
contribute significantly until very large deformations had taken place.
35
No discussion was given to the recommended minimum longitudinal
reinforcement ratios presented in previous reports.
2.11 Conclusions
In series 3 of the investigations carried out at Illinois and Lehigh in the 1930’s
a total of 261 column specimens were fabricated. Of these columns, 126 were loaded in
a state of near constant stress for at least 52 weeks. Columns were maintained in both
an approximately 100%-humidity environment and in ambient conditions in the
laboratories.
The columns were loaded in accordance with either the New York City
Building Code or the ACI Code. Nominal concrete strengths of 2,000, 3,500 and 5,000
psi were investigated. Longitudinal reinforcing steel varied from 45,600 psi to 51,100
psi yield strength. Reinforcement ratios investigated were 1.5, 4 and 6 percent of the
cross-sectional core area of the column.
Regarding columns loaded in accordance with the ACI code, after 52 weeks the
largest stress in the longitudinal reinforcement at Illinois was 26,700 psi and that at
Lehigh was 37,000 psi. These values were well below the 45,600 psi yield stress of the
steel. The specimens at Lehigh had an initial elastic steel stress of 6,000 psi. These
stresses were recorded in dry-stored specimens with 1.5 percent longitudinal
reinforcement.
It was noted that for columns having 6 percent longitudinal reinforcement the
stress increased from an initial stress of 16,000 psi to 30,000 psi after 52 weeks. This
increase was reported in the Lehigh results.
When the columns were unloaded and then re-loaded to failure, it was found
that the sustained period of loading had no effect on ultimate strength of the columns.
To lend some insight into the behavior of columns when the longitudinal steel
is stressed beyond the yield point, a separate series of tests was carried out at Lehigh.
These tests were discussed in the fifth progress report from Lehigh. In these tests,
columns were loaded from 80 to 100 percent of their ultimate load and held until
failure. Some of these specimens exhibited strains as high as ten times the steel yield 36
37
strain without failing. Stability was a problem however and several of the specimens
buckled to such an extent that they were resting on vertical bars of the loading rig. One
of the conclusions of this series was that a column will probably carry 80 percent of its
ultimate load indefinitely.
As an outcome of these investigations, a minimum reinforcement limit of 0.010
for spiral and 0.005 for tied columns was recommended. It is assumed that the intent
was to prevent passive yielding of the longitudinal steel. Little justification for the
recommended ratios was given.
Chapter 3. EXPERIMENTAL PROGRAM
3.1 Introduction
This chapter describes the experimental program currently underway in an
investigation designed to re-evaluate the minimum 1% longitudinal reinforcement ratio
required for columns. A total of 38 concrete columns have been fabricated and are
being maintained under various levels of axial load or no load. Twenty-four of the 38
columns are being subjected to near-constant axial load. The remaining 14 are
unloaded control specimens. Of the loaded columns, four are loaded with the axial load
having an eccentricity of approximately 10% of the column diameter. All columns
have a nominal 8-inch outside diameter and are 4 feet 0 inches long. All columns (with
the exception of four unloaded control specimens) are spirally reinforced. Material
control tests have also been conducted and are continuing as appropriate.
The variables investigated are concrete strength and percentage of longitudinal
reinforcement. All columns are stored in an environment where the relative humidity
has been generally kept between 30 to 60 percent, and the temperature has been allowed
to vary from approximately 50 to 110 degrees Fahrenheit. It is intended that the
columns will be maintained and observed for a period of approximately two years from
the time of casting.
3.2 Column Details
Details of the longitudinal reinforcement and column cross-sections are shown
in Figures 3.1 and 3.2. The average measured outside circumference at mid-height of
the columns was 25.25 inches prior to loading. This resulted in an average measured
diameter of 8.04 inches and an average “as-built” cross-sectional area of 50.77 square
inches.
The longitudinal reinforcing steel consisted of either 0, 4, 6 or 8 No. 2
deformed bars. The No. 2 deformed bars have a measured cross-sectional area of 0.046
square
38

39

40
inches. The resulting longitudinal reinforcement ratios were 0, 0.0036, 0.0054, and
0.0072. All columns (with the exception of four unloaded control specimens) were
confined with a number 9 annealed wire spiral. The wire was hand fed around a
spinning 6-inch diameter steel mandrel. A pitch of approximately 2 inches (plus or
minus 1/4 inch) was achieved in this way. The spiral relaxed upon removal from the
mandrel. The final outside diameter of the spiral was approximately 7-1/2 inches,
which led to a clear cover over the spiral of approximately 3/8 inch. All spirals were
stored outside and moistened for a minimum of ten days to achieve a thin layer of
corrosion.
Because some end cracking was observed for columns in Groups 1 and 2, all
columns in Groups 2 and 4 were wrapped with fiber-reinforced plastic. This was done
to preclude development and growth of any cracks in the end regions during the lengthy
period that column specimens are under load.
The nomenclature used to describe each specimen includes a single letter to
describe the loading type, a digit to indicate the nominal compressive strength of the
concrete, a five-digit number to represent the reinforcement ratio, and a single digit to
indicate the number of the specimen if more than one of a particular combination was
studied. For example, the specimen name C8-0.0036-1 represents a concentrically
loaded specimen (other options are E for eccentrically applied load or U for no load),
with a nominal concrete compressive strength of 8000 psi (4 is used for fc’ of 4000 psi),
a reinforcement ratio of 0.0036 (other reinforcement ratios are 0.0000, 0.00NS {no
spiral}, 0.0054, and 0.0072), and the first of more than one specimen with these
properties.
Table 3.1 lists the nominal concrete strengths, reinforcement ratios, whether
spiral reinforcement was used, and the number of each combination investigated.
41
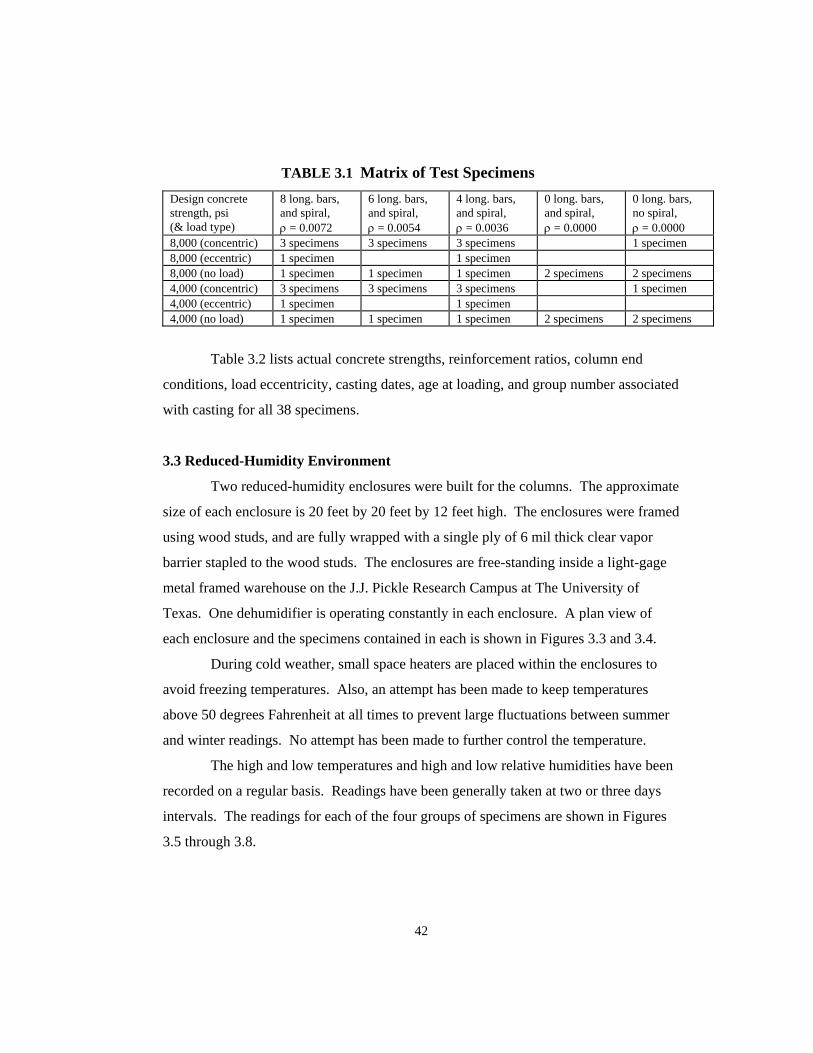
TABLE 3.1 Matrix of Test Specimens
Design concrete strength, psi (& load type)
8 long. bars, and spiral, ρ = 0.0072
6 long. bars, and spiral, ρ = 0.0054
4 long. bars, and spiral, ρ = 0.0036
0 long. bars, and spiral, ρ = 0.0000
0 long. bars, no spiral, ρ = 0.0000
8,000 (concentric) 3 specimens 3 specimens 3 specimens 1 specimen 8,000 (eccentric) 1 specimen 1 specimen 8,000 (no load) 1 specimen 1 specimen 1 specimen 2 specimens 2 specimens 4,000 (concentric) 3 specimens 3 specimens 3 specimens 1 specimen 4,000 (eccentric) 1 specimen 1 specimen 4,000 (no load) 1 specimen 1 specimen 1 specimen 2 specimens 2 specimens
Table 3.2 lists actual concrete strengths, reinforcement ratios, column end
conditions, load eccentricity, casting dates, age at loading, and group number associated
with casting for all 38 specimens.
3.3 Reduced-Humidity Environment
Two reduced-humidity enclosures were built for the columns. The approximate
size of each enclosure is 20 feet by 20 feet by 12 feet high. The enclosures were framed
using wood studs, and are fully wrapped with a single ply of 6 mil thick clear vapor
barrier stapled to the wood studs. The enclosures are free-standing inside a light-gage
metal framed warehouse on the J.J. Pickle Research Campus at The University of
Texas. One dehumidifier is operating constantly in each enclosure. A plan view of
each enclosure and the specimens contained in each is shown in Figures 3.3 and 3.4.
During cold weather, small space heaters are placed within the enclosures to
avoid freezing temperatures. Also, an attempt has been made to keep temperatures
above 50 degrees Fahrenheit at all times to prevent large fluctuations between summer
and winter readings. No attempt has been made to further control the temperature.
The high and low temperatures and high and low relative humidities have been
recorded on a regular basis. Readings have been generally taken at two or three days
intervals. The readings for each of the four groups of specimens are shown in Figures
3.5 through 3.8.
42

43

44

45

46

47

48

49

50
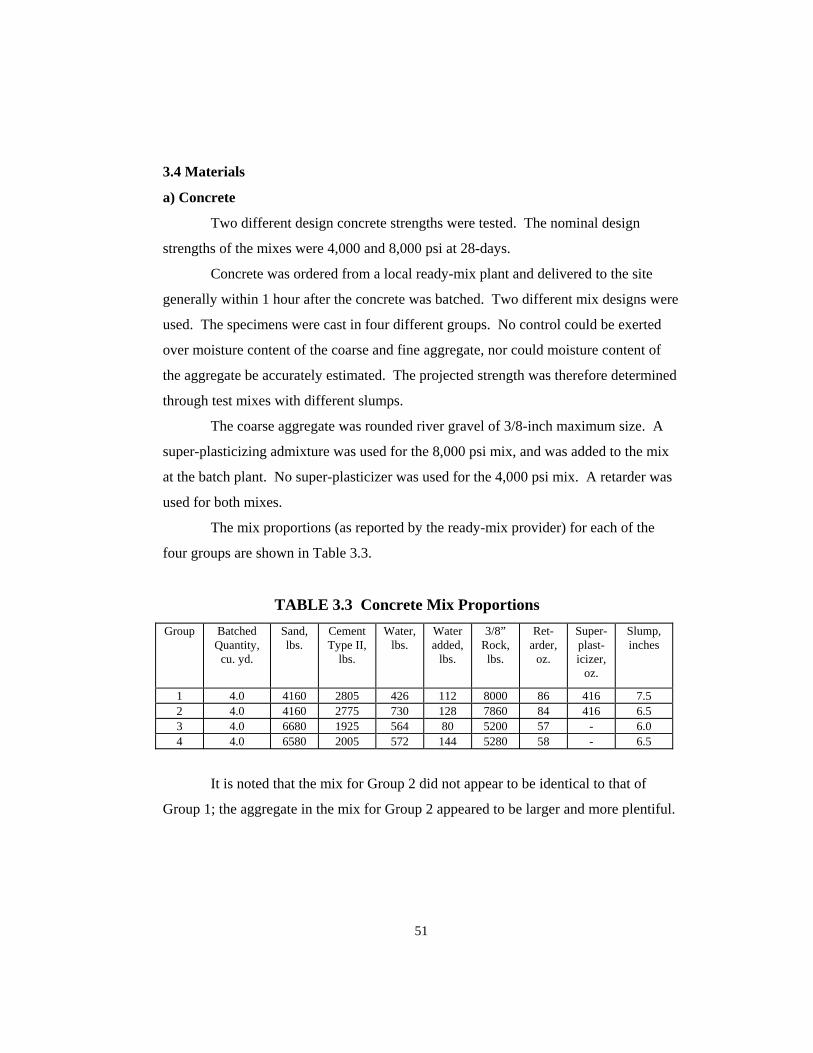
3.4 Materials
a) Concrete
Two different design concrete strengths were tested. The nominal design
strengths of the mixes were 4,000 and 8,000 psi at 28-days.
Concrete was ordered from a local ready-mix plant and delivered to the site
generally within 1 hour after the concrete was batched. Two different mix designs were
used. The specimens were cast in four different groups. No control could be exerted
over moisture content of the coarse and fine aggregate, nor could moisture content of
the aggregate be accurately estimated. The projected strength was therefore determined
through test mixes with different slumps.
The coarse aggregate was rounded river gravel of 3/8-inch maximum size. A
super-plasticizing admixture was used for the 8,000 psi mix, and was added to the mix
at the batch plant. No super-plasticizer was used for the 4,000 psi mix. A retarder was
used for both mixes.
The mix proportions (as reported by the ready-mix provider) for each of the
four groups are shown in Table 3.3.
TABLE 3.3 Concrete Mix Proportions
Group
Batched Quantity,
cu. yd.
Sand, lbs.
Cement Type II,
lbs.
Water, lbs.
Water added,
lbs.
3/8” Rock, lbs.
Ret- arder,
oz.
Super-plast-icizer,
oz.
Slump, inches
1 4.0 4160 2805 426 112 8000 86 416 7.5 2 4.0 4160 2775 730 128 7860 84 416 6.5 3 4.0 6680 1925 564 80 5200 57 - 6.0 4 4.0 6580 2005 572 144 5280 58 - 6.5
It is noted that the mix for Group 2 did not appear to be identical to that of
Group 1; the aggregate in the mix for Group 2 appeared to be larger and more plentiful.
51
b) Reinforcing Steel
The longitudinal reinforcing steel used in all cases was deformed with a
nominal size of 6 mm (approximately 2/8 in.) and will hereafter be referred to as No. 2
bar. The actual cross-sectional area of a bar was determined by cutting a 44 inch long
piece into 11 approximately equal segments and measuring the amount of water
displaced in a graduated cylinder. This method was verified by weighing the same bar
segments. The cross-sectional area of the bar determined in this manner was 0.046
square inches.
c) Fiberglass Reinforced Plastic
Some longitudinal cracking was noted near the tops and bottoms of the loaded
specimens in Group 1 and 3. In order to prevent any such cracks from forming and
propagating in the specimens of Groups 2 and 4, it was decided to confine the top and
bottom of these specimens with a fiberglass wrap.
The wrap consisted of five layers of woven-roving, with properties similar to E-
glass, and a thin resin matrix. The fiberglass wrap was applied by hand prior to
loading. It was applied to all specimens in Group 2 and Group 4 including the unloaded
control specimens. The height of the wrap is approximately 6 inches.
3.5 Manufacture of Test Specimens
a) Columns
i.) Formwork
Cardboard tubes (EZ Pour) with a nominal inside diameter of 8 inches were
used to form all columns. The insides of the tubes were pre-coated with wax for ease of
removal. The tubes were saw-cut to 4 foot lengths with a band saw. Care was taken to
ensure that the ends were cut as square as possible.
The reinforcing cages were pre-assembled outside the forms and tied with
plastic ties. The cages were then placed into the cardboard tubes. Three-sixteenth inch
diameter steel rods were used as horizontal spacers at the top and bottom of the cages to
maintain the desired concrete cover. 52
ii.) Casting
The columns were cast in four separate groups. The first through fourth groups
consisted of 11, 11, 8, and 8 columns, respectively. Each group included six loaded
columns. The remaining columns of each group were control specimens for
determining shrinkage and temperature effects. Groups 1 and 2 had a 28-day design
strength of 8,000 psi. Groups 3 and 4 had a 28-day design strength of 4,000 psi. The
four groups were cast in the following order:
Design Group Strength Date
1 8,000 psi February 7, 1996
3 4,000 psi April 4, 1996
2 8,000 psi May 15, 1996
4 4,000 psi May 15, 1996 (same day as Group 2)
All columns were cast in the vertical position. A wooden platform was
fabricated with twelve 9 inch by 9 inch by 1-1/2 inch deep forms to create level
pedestals for casting the column specimens. Hydro-stone was cast into the forms, and a
6 mil sheet of vapor barrier was secured on top of the hydro-stone to provide a smooth
surface for forming the bottom of the columns. The cardboard tubes (with the
reinforcing cages inside) were secured in place with small steel clip angles and screws.
Concrete was placed in the cardboard tubes with a long-handled scoop. The
tubes were held in place during this process. A small diameter mechanical vibrator was
used to consolidate the concrete.
All columns were cast within the reduced-humidity enclosures. The
approximate time required to cast each group of columns was one hour.
iii.) Curing
Immediately after casting, the tops of all columns were covered with a 6 mil
vapor barrier and 1 inch thick steel plate to minimize moisture loss through the top end 53
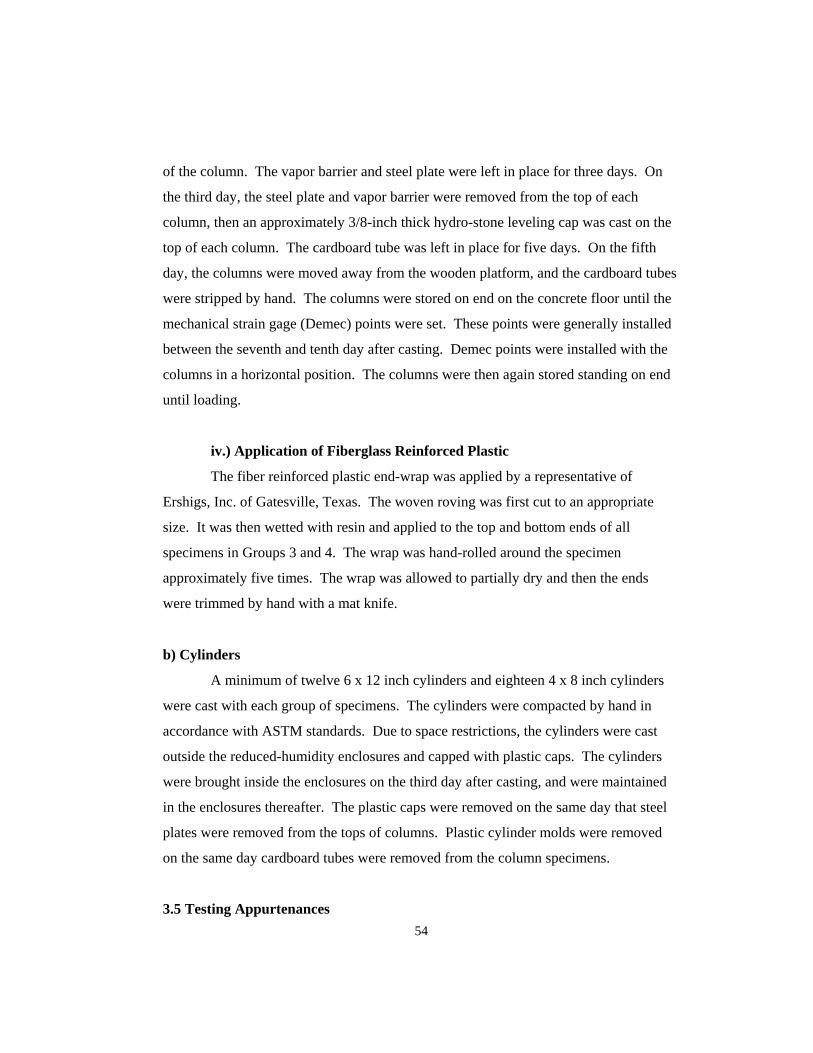
of the column. The vapor barrier and steel plate were left in place for three days. On
the third day, the steel plate and vapor barrier were removed from the top of each
column, then an approximately 3/8-inch thick hydro-stone leveling cap was cast on the
top of each column. The cardboard tube was left in place for five days. On the fifth
day, the columns were moved away from the wooden platform, and the cardboard tubes
were stripped by hand. The columns were stored on end on the concrete floor until the
mechanical strain gage (Demec) points were set. These points were generally installed
between the seventh and tenth day after casting. Demec points were installed with the
columns in a horizontal position. The columns were then again stored standing on end
until loading.
iv.) Application of Fiberglass Reinforced Plastic
The fiber reinforced plastic end-wrap was applied by a representative of
Ershigs, Inc. of Gatesville, Texas. The woven roving was first cut to an appropriate
size. It was then wetted with resin and applied to the top and bottom ends of all
specimens in Groups 3 and 4. The wrap was hand-rolled around the specimen
approximately five times. The wrap was allowed to partially dry and then the ends
were trimmed by hand with a mat knife.
b) Cylinders
A minimum of twelve 6 x 12 inch cylinders and eighteen 4 x 8 inch cylinders
were cast with each group of specimens. The cylinders were compacted by hand in
accordance with ASTM standards. Due to space restrictions, the cylinders were cast
outside the reduced-humidity enclosures and capped with plastic caps. The cylinders
were brought inside the enclosures on the third day after casting, and were maintained
in the enclosures thereafter. The plastic caps were removed on the same day that steel
plates were removed from the tops of columns. Plastic cylinder molds were removed
on the same day cardboard tubes were removed from the column specimens.
3.5 Testing Appurtenances 54
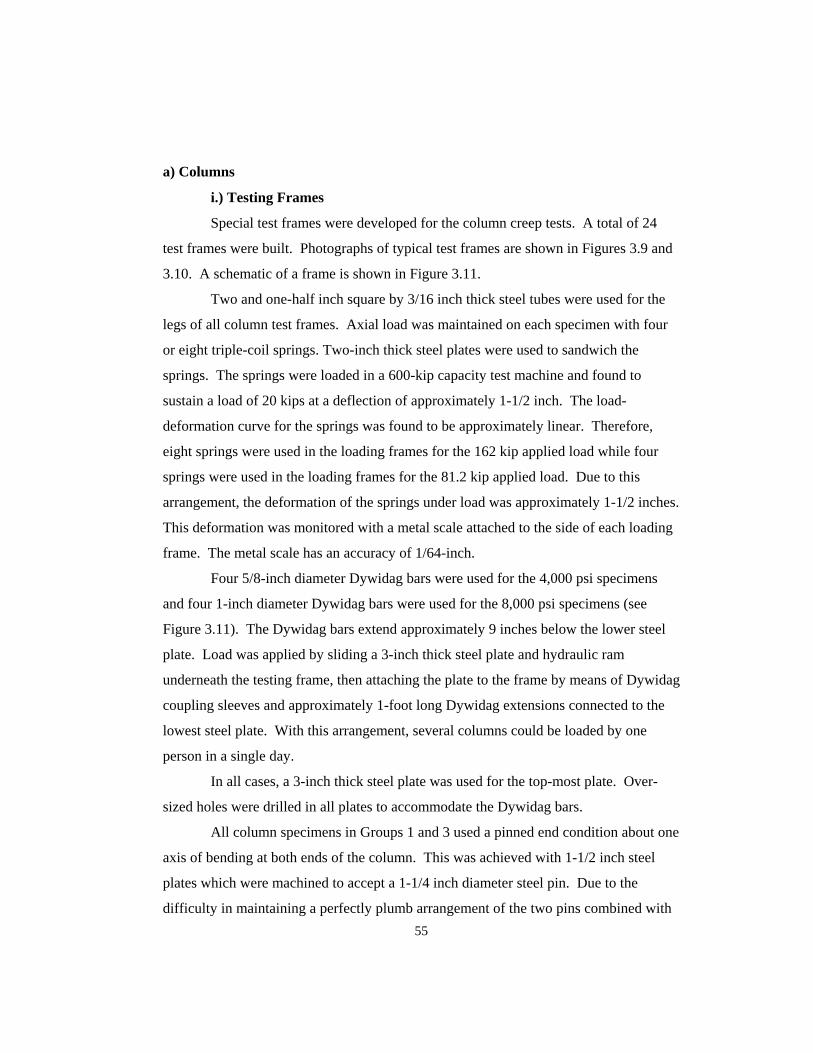
a) Columns
i.) Testing Frames
Special test frames were developed for the column creep tests. A total of 24
test frames were built. Photographs of typical test frames are shown in Figures 3.9 and
3.10. A schematic of a frame is shown in Figure 3.11.
Two and one-half inch square by 3/16 inch thick steel tubes were used for the
legs of all column test frames. Axial load was maintained on each specimen with four
or eight triple-coil springs. Two-inch thick steel plates were used to sandwich the
springs. The springs were loaded in a 600-kip capacity test machine and found to
sustain a load of 20 kips at a deflection of approximately 1-1/2 inch. The load-
deformation curve for the springs was found to be approximately linear. Therefore,
eight springs were used in the loading frames for the 162 kip applied load while four
springs were used in the loading frames for the 81.2 kip applied load. Due to this
arrangement, the deformation of the springs under load was approximately 1-1/2 inches.
This deformation was monitored with a metal scale attached to the side of each loading
frame. The metal scale has an accuracy of 1/64-inch.
Four 5/8-inch diameter Dywidag bars were used for the 4,000 psi specimens
and four 1-inch diameter Dywidag bars were used for the 8,000 psi specimens (see
Figure 3.11). The Dywidag bars extend approximately 9 inches below the lower steel
plate. Load was applied by sliding a 3-inch thick steel plate and hydraulic ram
underneath the testing frame, then attaching the plate to the frame by means of Dywidag
coupling sleeves and approximately 1-foot long Dywidag extensions connected to the
lowest steel plate. With this arrangement, several columns could be loaded by one
person in a single day.
In all cases, a 3-inch thick steel plate was used for the top-most plate. Over-
sized holes were drilled in all plates to accommodate the Dywidag bars.
All column specimens in Groups 1 and 3 used a pinned end condition about one
axis of bending at both ends of the column. This was achieved with 1-1/2 inch steel
plates which were machined to accept a 1-1/4 inch diameter steel pin. Due to the
difficulty in maintaining a perfectly plumb arrangement of the two pins combined with 55
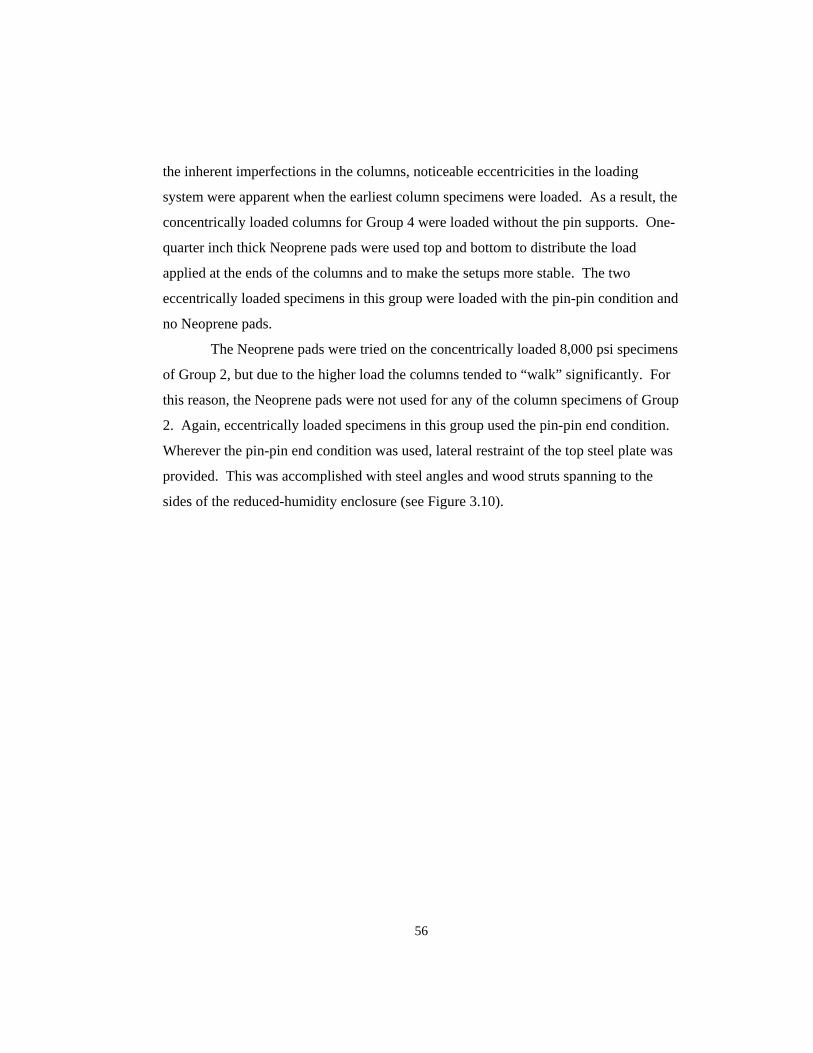
the inherent imperfections in the columns, noticeable eccentricities in the loading
system were apparent when the earliest column specimens were loaded. As a result, the
concentrically loaded columns for Group 4 were loaded without the pin supports. One-
quarter inch thick Neoprene pads were used top and bottom to distribute the load
applied at the ends of the columns and to make the setups more stable. The two
eccentrically loaded specimens in this group were loaded with the pin-pin condition and
no Neoprene pads.
The Neoprene pads were tried on the concentrically loaded 8,000 psi specimens
of Group 2, but due to the higher load the columns tended to “walk” significantly. For
this reason, the Neoprene pads were not used for any of the column specimens of Group
2. Again, eccentrically loaded specimens in this group used the pin-pin end condition.
Wherever the pin-pin end condition was used, lateral restraint of the top steel plate was
provided. This was accomplished with steel angles and wood struts spanning to the
sides of the reduced-humidity enclosure (see Figure 3.10).
56

57

58

59
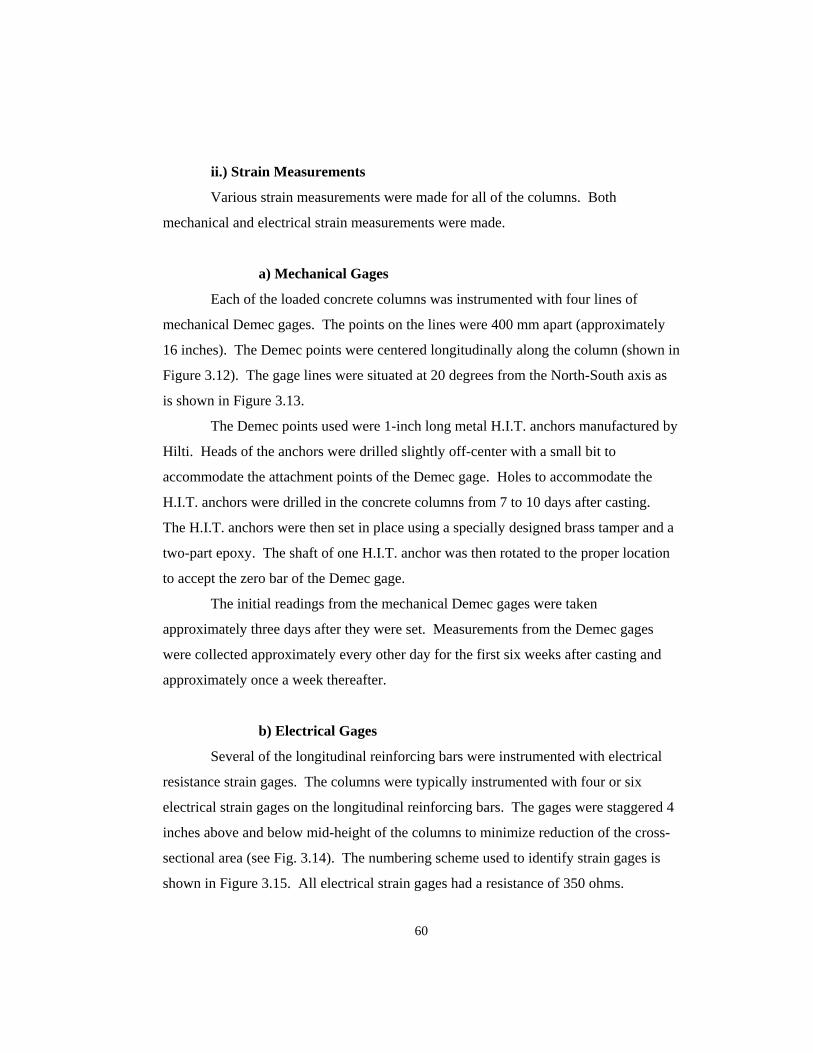
ii.) Strain Measurements
Various strain measurements were made for all of the columns. Both
mechanical and electrical strain measurements were made.
a) Mechanical Gages
Each of the loaded concrete columns was instrumented with four lines of
mechanical Demec gages. The points on the lines were 400 mm apart (approximately
16 inches). The Demec points were centered longitudinally along the column (shown in
Figure 3.12). The gage lines were situated at 20 degrees from the North-South axis as
is shown in Figure 3.13.
The Demec points used were 1-inch long metal H.I.T. anchors manufactured by
Hilti. Heads of the anchors were drilled slightly off-center with a small bit to
accommodate the attachment points of the Demec gage. Holes to accommodate the
H.I.T. anchors were drilled in the concrete columns from 7 to 10 days after casting.
The H.I.T. anchors were then set in place using a specially designed brass tamper and a
two-part epoxy. The shaft of one H.I.T. anchor was then rotated to the proper location
to accept the zero bar of the Demec gage.
The initial readings from the mechanical Demec gages were taken
approximately three days after they were set. Measurements from the Demec gages
were collected approximately every other day for the first six weeks after casting and
approximately once a week thereafter.
b) Electrical Gages
Several of the longitudinal reinforcing bars were instrumented with electrical
resistance strain gages. The columns were typically instrumented with four or six
electrical strain gages on the longitudinal reinforcing bars. The gages were staggered 4
inches above and below mid-height of the columns to minimize reduction of the cross-
sectional area (see Fig. 3.14). The numbering scheme used to identify strain gages is
shown in Figure 3.15. All electrical strain gages had a resistance of 350 ohms.
60
In addition, each column was instrumented with a “floating” electrical strain
gage. This device consisted of a 3/16-inch diameter hot-rolled A36 steel rod
approximately 10 inches long with threaded ends. An electrical strain gage was
attached to the center of the 3/16 inch diameter rod, then shrink-wrap tubing was placed
over the rod before washers were locked onto each end with nuts. The resulting
assembly was effectively an 8 in. strain gage. The floating gage was held in place with
3/16-inch diameter horizontal steel rods tied to the gage and reinforcement cage. These
floating gages were located 8 inches from the bottom of each column and in the center
of the cross-section. The location of these electrical strain gage assemblies is shown in
Figures 3.14 and 3.15.
Electrical strain gages were zeroed prior to casting the concrete. Readings were
taken approximately 10 minutes after the concrete was placed. The gages were then re-
zeroed approximately 20 minutes after the concrete was placed. Electrical strain gage
measurements were made approximately every three days after casting for a period of
four weeks. After four weeks, measurements were generally made weekly.
61

62

63

64

65
iii.) Testing Procedure
All loaded columns (with the exception of SPECIMEN E8-0.0036 which was
subjected to load equal to 0.30*Ag*fc’) were subjected to axial load equivalent to
0.40*Ag*fc’. SPECIMEN E8-0.0036 was not loaded as highly due to noticeable
cracking on the compression side of the column. This cracking was the result of
drilling for the Demec instrumentation points and existed prior to application of load.
The resulting applied loads were 81.2 kips for the 4,000 psi specimens and 162 kips for
the 8,000 psi specimens. The four eccentrically loaded columns all had eccentricities of
0.80 inches (equivalent to 10% of the nominal column diameter).
Load was initially applied to the specimens with a 300 kip-capacity hydraulic
ram. After the load was applied with the ram it was locked in place by hand-tightening
the Dywidag nuts beneath the plate under the column specimen (see Fig. 3.11).
Pressure in the ram was monitored with a dial gage accurate to 200 psi. A small
additional load was initially applied to account for anticipated seating of the nuts on the
Dywidag bars. This seating loss was less than 2 percent of the applied load in all cases.
No attempt was made to alter the applied load during testing to compensate for
temperature effects.
Load was applied to the columns from 14 to 28 days after casting. The exact
day in which load was applied to each specimen is shown in Table 3.2.
Change in load (as indicated by the spring relaxation) was monitored every few
days. The load could be monitored both with the metal scale attached to the loading
frame and also with deformation of the column. When the metal scales indicated 3/64
inch relaxation of the springs (approximately equal to a 3 percent reduction in load) or
strain in the column indicated a similar change in load, the initial load was re-
established using the hydraulic ram. Again, a slight overload was imposed to account
for the anticipated seating of the Dywidag nuts. This re-loading procedure was carried
out approximately 60 days after initial loading for all columns.
66
67
c) Concrete Cylinders
Small cylinders and large cylinders were tested at 7, 14, 21, 28, 42, and 56
days. At least two cylinders were tested and the results averaged on each testing day.
For the 28-day tests, three cylinders were used and the results averaged. At least two
large and three small cylinders are being maintained with each group of specimens to
obtain strength and modulus information when creep tests are discontinued. On each
test day, ultimate strength and modulus of elasticity information was recorded. Strength
and modulus tests were conducted in accordance with ASTM C39-61(5) and ASTM C
469-94, respectively.
d) Reinforcing Steel
The yield and ultimate stress of the No. 2 bars was determined through four
tensile tests conducted in a 60-kip capacity Tinius-Olson universal test machine.
Chapter 4. PRELIMINARY EXPERIMENTAL TEST RESULTS 4.1 Introduction
The preliminary test results for individual column specimens are shown in
Figures 4.1 through 4.73. For purposes of comparison, preliminary test results for all
concentrically loaded column specimens are shown with results for the unloaded
specimens in Figures 4.74 through 4.79.
The specimens are currently being maintained in the reduced-humidity
enclosures described in Chapter 3 and data are being gathered on a regular basis. For
the purposes of this thesis, only data collected before July 24, 1996, will be
considered. The ages of the different groups of specimens as of July 24, 1996, is as
follows:
Last reading Group Casting date considered Age of specimens 1 Feb. 7, 1996 July 24, 1996 167 days
2 May 15, 1996 July 24, 1996 70 days
3 April 4, 1996 July 24, 1996 142 days
4 May 15, 1996 July 24, 1996 70 days
Because temperature changes result in measurable strains in the specimens,
strain data for all column specimens have been adjusted for temperature effects. A
temperature coefficient of 6.5 micro-strain per degree Fahrenheit was used. The
largest temperature differential for the period considered was 39 degrees Fahrenheit.
This results in a maximum temperature-induced strain of 246 micro-strain.
The restraint offered by the coil-springs used to maintain load on the column
specimens is not significant when compared to the temperature-induced strain. For
the worst-case scenario of the stiffest spring group and the most flexible concrete
column, the calculated difference between restrained expansion (by springs) and
unrestrained expansion for a temperature differential of 40 degrees Fahrenheit was
68
determined to be less than 10 micro-strain. This is less than would be imposed by a
temperature differential of only 2 degrees Fahrenheit. Therefore, the restraint offered
by the springs was neglected when adjusting strain data from loaded specimens for
temperature effects.
In almost all cases, temperature was recorded at the time strain-measuring
devices (whether mechanical or electrical) were read. In the event that no temperature
reading was available, an average of the high and low temperature readings for the
day in question was used. Note that the temperature readings used were ambient
temperature readings, as opposed to internal readings in the concrete specimens.
For review, the nomenclature used for each column specimen is illustrated
below. For example;
C8-0.0036-1 C = load condition (C = concentric, E = eccentric, U = unloaded) 8 = design strength at 28 days in ksi (4 or 8) 0.0036 = number of longitudinal reinforcing bars (0.0000, 0.00NS {no spiral}, 0.0036, 0.0054, or 0.0072) 1 = Number of specimen if more than one such specimen exists (nothing, 1, 2 or 3)
69
4.2 Individual Column Specimens The Demec (mechanical) gage data versus time for each column specimen is
presented first and is followed by an average of all the Demec gage readings for each
specimen. These two plots are shown on a single page. The Demec data for each
column specimen are followed by plots of electrical strain gage data versus time for
the same column specimen. The electrical gage data are presented for each gage and
then an average of the electrical gage data is presented. Again, the two electrical gage
plots for each individual specimen are presented on a single page.
Data for the concentrically-loaded specimens are presented first, the
eccentrically loaded specimens are presented next, and the unloaded specimens are
presented last. Results for the 8,000 psi and 4,000 psi specimens are presented
separately. The most lightly-reinforced specimens are presented before the more
highly-reinforced specimens.
Some discussion is offered with each set of specimens when appropriate to
clarify the results or to point out and explain irregularities in the data.
70
a) Concentrically Loaded Specimens
i.) 8,000 psi specimens
Strain data for the 8,000 psi concentrically loaded specimens are presented
in the following figures:
Reinf. ratio Figures
0.0000 4.1
0.0036 4.2 - 4.7
0.0054 4.8 - 4.13
0.0072 4.14 - 4.19
The following is a brief description of the data collected for each specimen.
Demec gage 1 of Specimen C8-0.0000 (Fig. 4.1) was set incorrectly and is
unreadable. Gage 2 yielded larger strains than gages 3 and 4. Some eccentricity
relative to the north-south axis likely exists in the loading set-up. Therefore gage 1
would be expected to yield strains similar to gage 2, and the average strain would
therefore be higher. Only one electrical “floating” gage was cast in this specimen and
it failed to operate properly.
Demec gage 1 of Specimen C8-0.0036-1 (Fig. 4.2) was set incorrectly and is
unreadable. The three readable gages yielded data with little scatter. Of the electrical
gages, only 4 and 5 provided plausible data (Fig. 4.3). The electrical gages measured
significantly smaller strains than the mechanical gages (approximately 40% less). As
will be demonstrated for practically all electrical strain gage data, this is typical.
Demec gage 2 of Specimen C8-0.0036-2 (Fig. 4.4) was set incorrectly and is
unreadable. Some eccentricity relative to the north-south axis likely exists in the
loading set-up. Therefore gage 1 would be expected to produce strains similar to gage
2, and the average strain would therefore be higher. With the exception of gage 2, the
electrical gages measured significantly smaller strains than the mechanical gages (Fig.
4.5).
71
The Demec gage measurements for Specimen C8-0.0036-3 (Fig. 4.6) show
significant scatter and indicate load being applied eccentrically by the loading
apparatus about a skewed axis. The electrical gage data (Fig. 4.7) demonstrates
similar scatter but lower strains when compared to the mechanical gage data.
Demec gage 2 of Specimen C8-0.0054-1 (Fig. 4.8) exceeded the range of the
mechanical device used to read the gage points approximately 60 days after casting.
Demec gage 4 provided significantly higher readings than the other three gages and
went out-of-range approximately 100 days after casting. It is not possible for one
gage (such as gage 4) to yield substantially higher strains when the other three show
good agreement. The initial zero for gage 4 may have been read incorrectly.
Therefore, gage 4 was not used in the averaged results.
Demec gages 1 and 3 of Specimen C8-0.0054-2 were set improperly and
were therefore unreadable. The data from gages 2 and 4 (Fig. 4.10) tend to indicate a
small eccentricity about the north-south axis. All five electrical gages provided
plausible data (Fig. 4.11). The electrical gages again measured lower strains than the
mechanical gages.
The Demec measurements for Specimen C8-0.0054-3 (Fig. 4.12) show
relatively little scatter. All four Demec gages were readable. Only three of the seven
electrical gages (Fig. 4.13) provided plausible data. All but one of the electrical gages
again measured lower strains than the mechanical gages.
Demec gage 3 of Specimen C8-0.0072-1 was set improperly and was
therefore unreadable. The remaining three Demec gages (Fig. 4.14) yield strain data
with very little scatter. Three of the five electrical gages provided plausible data (Fig.
4.15) and the data also show little scatter. The electrical gages again yielded lower
strains than the mechanical gages.
Demec gage 1 of Specimen C8-0.0072-2 went out-of-range and could no
longer be read approximately 70 days after casting. This gage produced significantly
higher readings than the other three gages (Fig. 4.16). As was mentioned previously,
it is not possible for one gage (such as gage 1) to measure substantially higher strains
72
when the other three gages show good agreement. Therefore, gage 1 data was not
used in the averaged results. Three of the five electrical gages provided plausible data
(Fig. 4.17) and this data also showed little scatter. The electrical gages again yielded
lower strains than the mechanical gages.
The Demec gage readings for Specimen C8-0.0072-3 (Fig. 4.18) yielded
strains with significant scatter, indicative of eccentricity in the loading apparatus. The
electrical gage data (Fig. 4.19) demonstrate similar scatter and slightly lower strains
when compared to the mechanical gage data. In this case, the mechanical and
electrical readings showed relatively good agreement. Only two of the seven
electrical gages provided plausible data.
73

74

75

76

77

78

79

80

81

82

83

84

85

86

87

88

89

90

91

92
ii.) 4,000 psi specimens
Strain data for the 4,000 psi concentrically loaded specimens are presented
in the following figures:
Reinf. ratio Figures
0.0000 4.20 - 4.21
0.0036 4.22 - 4.27
0.0054 4.28 - 4.33
0.0072 4.34 - 4.39
The following is a brief description of the data collected for each specimen.
Demec gage 2 of Specimen C4-0.0000 was set incorrectly and is unreadable.
Data from the remaining three gages (Fig. 4.20) show good agreement. Only one
electrical “floating” gage was cast into this specimen. This gage measured smaller
strains than the mechanical gages (Fig. 4.21).
Strain data from Demec gages of Specimen C4-0.0036-1 (Fig. 4.22) show
little scatter. Of the electrical strain gages, three of the five provided plausible data
(Fig. 4.23). Electrical gages 3 and 4 measured strains similar to those measured by
the mechanical gages.
Strain data from Demec gages of Specimen C4-0.0036-2 (Fig. 4.24) show
little scatter. Three of the five electrical gages provided plausible data. With the
exception of gage 2, the electrical gages yield slightly smaller strains than the
mechanical gages (Fig. 4.25). Electrical gage 2 provided strain readings very similar
to those from the mechanical gages. The three readable electrical gages provided
strains with relatively little scatter.
The Demec strain gage data for Specimen C4-0.0036-3 indicate some
separation between gages 1 and 2 and gages 3 and 4. This indicates eccentricity about
the north-south axis in the load applied by the testing apparatus. The electrical gage
data indicate a large amount of scatter. Electrical strain gage data collected by strain
gage 4 (Fig. 4.27) is similar to the mechanical gage data.
93
Strain data measured by Demec gages of Specimen C4-0.0054-1 show some
scatter. The pattern suggests eccentricity of the applied load about both axes (Fig.
4.28). Three of the five electrical gages provided plausible data. The electrical strain
gage data (Fig. 4.29) exhibited similar scatter, and were typically somewhat smaller
than strains measured with mechanical gages.
With the exception of strains measured by Demec gage 2 of Specimen C4-
0.0054-2, the Demec gage data exhibited little scatter (Fig. 4.30). Three of the five
electrical gages provided plausible data until day 60 (Fig. 4.31). At day 60, gages 2
and 3 ceased to provide data. Strains from the remaining electrical gage (gage 4) were
lower than strains measured by the mechanical gages.
Demec strain readings from Specimen C4-0.0054-3 (Fig. 4.32) show
significant scatter, indicative of eccentricity in the applied load. Only two of the
seven electrical strain gages provided plausible data (Fig. 4.33). Electrical gage 2
measured strains similar to those measured with mechanical gages.
The Demec readings for Specimen C4-0.0072-1 (Fig. 4.34) indicate
significant eccentricity about the north-south axis. Three of the five electrical gages
provided plausible data, but with significant scatter (Fig. 4.35). The electrical gages
yielded lower strains than the mechanical gages.
Demec gage 1 of Specimen C4-0.0072-2 went out-of-range and could no
longer be read approximately 45 days after casting. This gage provided strain
readings similar to gage 2 prior to going out-of-range (Fig. 4.36). The remaining
three gages provided data with little scatter. Two of the five electrical gages provided
plausible data (Fig. 4.37). Electrical gage 4 measured strains similar to those
measured by the mechanical gages.
Demec gage 4 of Specimen C4-0.0072-3 was placed incorrectly and was
therefore unreadable. The three remaining Demec gages measured strains with some
scatter, which is indicative of eccentricity in the applied axial load (Fig. 4.38). The
electrical gages provided little or no meaningful data (Fig. 4.39).
94

95

96

97

98

99

100

101

102

103

104

105

106

107

108

109

110

111

112

113

114
iii.) General discussion
The Demec gages appear to provide reliable data. When eccentricity of
applied load has been apparent in the Demec strain readings, the loading apparatus has
been visually inspected and, in most cases, the eccentricity has been visually
confirmed.
The electrical gage data is not nearly as reliable as the Demec strain gage
data. In some cases, the strain versus time data measured with electrical gages
exhibited a significant “dip” in the strain readings prior to loading. This may be due
to thermal expansion of the specimens prior to loading. However, not all of the gages
measured this same “dip” in strain response. The gages which measured this behavior
often became unstable at a later date.
In most cases, the electrical gages measured lower strains than the Demec
gages. This may be because the electrical gages are not perfectly aligned with the axis
of the reinforcing bars. A very large number of electrical strain gages were applied
and some error in the installation process was to be expected. The Demec gages by
contrast have a much larger gage length, and therefore, were more easily set in vertical
position. The reinforcing bars also may not have been positioned vertically. Both of
these factors would tend to produce strain readings which are lower than if the
longitudinal bars and strain gages were aligned vertically. However, the most
plausible explanation for reduced strain readings by electrical resistance gages is
deterioration of the protective sealant over the gage and the connections between the
strain gage and electrical leads.
The electrical strain gages of Groups 2 and 4 provided noticeably poorer
results when compared to the strain readings made with electrical gages of Groups 1
and 3. This may be attributed to two separate problems. The first is the possibility of
poorer workmanship with respect to water-proofing of the gages at the time of
application. The second is the possibility that the gages were contaminated in some
way when they were allowed to sit for several months after having been applied to the
reinforcing bars prior to casting the concrete specimens. All strain gages were applied
115

prior to January, 1996. Specimens in Groups 2 and 4 were not cast until May 15,
1996. It is possible that humidity adversely affected the gages prior to casting.
116
b) Eccentrically Loaded Specimens
i.) 8,000 psi specimens
Strain measurements for the 8,000 psi eccentrically loaded specimens are
presented in the following figures:
Reinf. ratio Figures
0.0036 4.40 - 4.41
0.0072 4.42 - 4.43
The following is a brief description of the data collected for each specimen.
The Demec gage readings for Specimen E8-0.0036 reflect the intentionally-
imposed eccentricity of 0.80 inches about the north-south axis (Fig. 4.40). The strain
readings exhibit relatively little scatter. Gages on the east face (gages 1 and 2)
measured very small compressive strains. Three of the five electrical gages provided
plausible data (Fig. 4.41). Gages 2 and 4 were mounted on longitudinal bars nearest
the east and west face, respectively. As would be expected, gage 2 measured slight
tensile strains, and gage 4 measured compressive strains. Gage 4 ceased to operate
approximately 25 days after casting. It is important to note that this specimen was
loaded to 0.30*fc’*(gross area) as opposed to the other eccentrically-loaded specimens
which were loaded to 0.40*fc’*(gross area). As mentioned in Chapter 3, this was done
because drilling for the H.I.T. anchors used for Demec points had caused noticeable
damage to the compressive face of the specimen. It was feared that rapid deterioration
or failure might occur if the specimen was fully loaded.
The Demec strain readings for Specimen E8-0.0072 also clearly reflect the
imposed eccentricity of 0.80 inches about the north-south axis (Fig. 4.42). The strain
readings exhibited little scatter. Gages on the east face (gages 1 and 2) measured very
small tensile strains. Six of the seven electrical gages provided meaningful data (Fig.
4.43). These electrical gages measured strains that qualitatively reflected what would
be expected as a result of the eccentric loading. Gages 2 and 5 were mounted on the
longitudinal bars nearest the east and west face, respectively. As would be expected,
117

gage 2 measured slight tensile strains and gage 5 measured compressive strains.
These strains are similar to those obtained from the Demec gage data.
118

119

120

121

122
ii.) 4,000 psi specimens
Strain data for the 4,000 psi eccentrically loaded specimens are presented in
the following figures:
Reinf. ratio Figures
0.0036 4.44 - 4.45
0.0072 4.46 - 4.47
The following is a brief description of the data collected for each specimen.
The Demec strain readings for Specimen E4-0.0036 illustrate the effect of the
intentionally-imposed eccentricity of 0.80 inches about the north-south axis (Fig.
4.44). The strain readings exhibit little scatter. Gages on the east face measured very
small tensile strains. Only one of the five electrical gages (the central “floating” gage)
provided plausible data (Fig. 4.45). This gage measured strains that are between the
Demec readings on the east and west faces, as would be expected due to the central
location of this “floating” electrical gage.
The Demec strain readings for Specimen E4-0.0072 illustrate the effect of the
imposed eccentricity of 0.80 inches about the north-south axis (Fig. 4.46). The gage
readings exhibit some scatter that is indicative of a slight unintentional eccentricity
about the east-west axis. Gage measurements on the east face show very small
compressive strains. As for Specimen E4-0.0036, only one of the five electrical gages
(the central “floating” gage) provided plausible data (Fig. 4.47). Once again, this
gage indicated strains between the values measured by the Demec gages on the east
and west face, as would be expected due to the central location of this “floating”
electrical gage.
123

124

125

126

127
iii.) General discussion
The Demec gages provided what appears to be reliable data. In all four
eccentrically-loaded specimens, the intentional eccentricity is clearly noted in the
strain data.
In cases where the electrical gages provided useful data, these readings were
consistent with Demec readings and what would be expected due to the eccentric-
loading condition.
128
c) Unloaded Specimens
i.) 8,000 psi specimens
Strain data for the 8,000 psi unloaded specimens are presented in the
following figures:
Reinf. ratio Figures
0.00NS 4.48 - 4.50
0.0000 4.51 - 4.54
0.0036 4.55 - 4.56
0.0054 4.57 - 4.58
0.0072 4.59 - 4.60
The following is a brief description of the data collected for each specimen.
The Demec gages for Specimen U8-0.00NS-1 measured strains with little
scatter (Fig. 4.48). Only Demec gages 1 and 4 were installed in the unloaded
specimens. Only one electrical gage (the central “floating” type) was cast into this
specimen. This gage provided data that is reasonably compatible with data measured
by the mechanical gages (Fig. 4.49).
The Demec gages for Specimen U8-0.00NS-2 measured unusual scatter in
strain data from day 18 to day 30 after casting (Fig. 4.50). This scatter is unexplained.
Only the floating electrical gage was cast into this specimen, and provided no reliable
data.
The Demec gage readings for Specimen U8-0.0000-1 measured strains with
little scatter (Fig. 4.51). Electrical gage 1, which is of the “floating” type, provided
strain data which is similar to that from the Demec gages. Electrical gage 2 was
placed on the spiral reinforcement. This gage indicated slight compressive strains.
This is consistent with shrinkage of the concrete (Fig. 4.52).
The Demec strain gage readings for Specimen U8-0.0000-2 exhibit significant
scatter (Fig. 4.53). Electrical gage 1, the “floating” type, indicated strains in excess of
129
those data provided by the mechanical gages (Fig. 4.54). Electrical gage 2, which was
placed on the spiral reinforcement, provided no meaningful data.
The Demec strain gage readings for Specimen U8-0.0036 exhibit some scatter
(Fig. 4.55). There is a slight “dip” in the Demec reading for gage 1 at 58 days after
casting. This is likely due to an error in reading the instrument. Four of the five
electrical gages provided plausible data (Fig. 4.56). Electrical gages 1 and 5 measured
slightly smaller strains that those recorded by the Demec gages.
The Demec strain gage readings for Specimen U8-0.0054 exhibit significant
scatter from day 21 to day 110 (Fig. 4.57). After day 110, the readings are fairly
stable. All five electrical gages provided meaningful data (Fig. 4.58). The average of
these electrical-gage strain readings provided strains similar to those recorded by the
Demec gages.
The Demec strain gage readings for Specimen U8-0.0072 exhibited relatively
little scatter (Fig. 4.59). Four of the five electrical gages provided meaningful data,
and the average of these electrical-gage readings was similar to strains recorded by the
Demec gages (Fig. 4.60).
130

131

132

133

134

135

136

137

138

139

140

141

142

143
ii.) 4,000 psi specimens
Strain data from the 4,000 psi unloaded specimens are presented in the
following figures:
Reinf. ratio Figures
0.00NS 4.61 - 4.63
0.0000 4.64 - 4.67
0.0036 4.68 - 4.69
0.0054 4.70 - 4.71
0.0072 4.72 - 4.73
The following is a brief description of the data collected for each specimen.
The Demec strain gages for Specimen U4-0.00NS-1 measured strains with
reasonably little scatter (Fig. 4.61). Only one electrical gage, the central “floating”
type was cast into this specimen, and it provided no reliable data.
Only Demec gage 4 was readable for Specimen U4-0.00NS-2 (Fig. 4.62).
Only one electrical gage ,the “floating” type, was cast into this specimen. This gage
measured slightly higher strains than the readable Demec gage (Fig. 4.63).
The Demec strain gage readings for Specimen U4-0.0000-1 exhibited some
scatter (Fig. 4.64). Electrical gage 1, which is the “floating” type, provided strain data
similar to strains measured with the Demec gages (Fig. 4.65). Electrical gage 2 was
placed on the spiral reinforcement. This gage indicated slight tensile strains. This
contradicts what is expected to occur due to shrinkage in the specimen.
The Demec strain gage readings for Specimen U4-0.0000-2 exhibited
relatively little scatter (Fig. 4.66). Electrical gage 1, which is the “floating” type,
provided unreliable data (Fig. 4.67). Electrical gage 2 was placed on the spiral
reinforcement and indicated slight tensile strains. Again, this was not expected.
The Demec strain gage readings for Specimen U4-0.0036 exhibited little
scatter (Fig. 4.68). There is a significant “dip” in the Demec readings for gage 1 at 58
days after casting. This is likely due to an error in reading the instrument. Two of the
144
five electrical gages provided plausible data (Fig. 4.69). Electrical gage 4 measured
strains similar to those recorded by the Demec gages. Electrical gage 1 is of the
“floating” type and it measured somewhat smaller strains.
The Demec gage readings for Specimen U4-0.0054 exhibit very little scatter
(Fig. 4.70). Three of the five electrical gages provided reliable data (Fig. 4.71). The
average of these electrical gages produced strains similar to those recorded by the
Demec gages.
The Demec strain gage readings for Specimen U4-0.0072 exhibited very little
scatter (Fig. 4.72). Two of the five electrical gages provided plausible data (Fig.
4.73). Electrical gage 1, which is the “floating” type, provided readings similar to
those of the Demec gages. Electrical gage 3 provided readings that were substantially
smaller than those from gage 1 and also exhibited erratic measurements during the
first 40 days after casting.
145

146

147

148

149

150

151

152

153

154

155

156

157

158
iii.) General discussion
The Demec gages provided what appear to be reliable data. Considering the
small changes in strain which are being recorded, relatively little scatter is apparent in
the results.
In the cases where the electrical gages provided useful data, these readings
were generally in agreement with the strains recorded by the mechanical gages.
Because the strain gages have been recording data since casting was performed, and
measurements with the mechanical gages generally began approximately 15 days after
casting, measured strains for the electrical gages were typically higher. When the
electrical strain data from the first 15 days is subtracted, the electrical and mechanical
gages show reasonable correlation.
Again, the electrical gages were significantly more reliable in Groups 1 and 3
than they were in Groups 2 and 4. The possible reasons for this have been discussed
previously.
159
3. Comparison of Concentrically Loaded and Unloaded Specimens
For purposes of comparison, the preliminary results for the concentrically
loaded and unloaded specimens are shown in Figures 4.74 through 4.79. The
unloaded specimens without spiral reinforcement are not presented here because they
have no loaded companion specimens. The data are presented as follows:
Design Concrete Strength Group Figure 8,000 psi 1 & 2 4.74
8,000 psi 1 4.75
8,000 psi 2 4.76
4,000 psi 3 & 4 4.77
4,000 psi 3 4.78
4,000 psi 4 4.79
The data have been plotted with the loading day of each specimen adjusted to
correspond with day 0. This was done for both the loaded and unloaded specimens.
The specimens of Groups 1 and 3 were cast prior to those of Groups 2 and 4, and
therefore, significantly more data is available for Groups 1 and 3. The plots for
Groups 2 and 4 are shown with dashed lines. As was mentioned previously, the data
for all specimens have been adjusted for temperature effects.
The data plotted for each specimen are the averaged Demec data. These data
appear to be substantially more reliable than the electrical strain gage data.
160
a) 8,000 psi Specimens
Figure 4.74 shows the preliminary test results for all of the 8,000 psi
specimens. Most specimens in Group 1 were loaded for approximately 150 days, and
most specimens of Group 2 were loaded for approximately 50 days. Much less scatter
is apparent for the Group 1 results than for the Group 2 results. Differences in
concrete used for the Group 2 specimens is manifested in the higher strains observed
for every specimen of Group 2 compared to comparable specimens in Group 1.
Figure 4.75 presents the results for Group 1 specimens only. With the
exception of Specimen C8-0.0072-2, the more lightly reinforced specimens exhibit
slightly higher strains as expected. This is true for both the loaded and unloaded
specimens.
Figure 4.76 presents the results for Group 2 specimens only. A significant
amount of scatter in the results is noted. When examining the data, it is apparent that
the initial elastic strain for the unreinforced specimen (C8-0.0000) is smaller than for
the reinforced specimens in Group 2. This suggests that either the load was
incorrectly applied or that an insufficient number of Demec gage readings are
available for a reliable average. It is likely that the latter is largely responsible
because Demec gage 1 was not set properly, and therefore, was not readable. It is
likely that this gage would have increased the elastic strain average because it is
located on the same side of the specimen as Demec gage 2. As evident in Figure 4.1,
Demec gage 2 measured significantly higher strains than Demec gages 3 and 4. This
is likely due to unintended eccentricity about the north-south axis in the loading
frame.
In regard to the three reinforced concentrically loaded specimens of Group 2
(C8-0.0036-3, C8-0.0054-3 and C8-0.0072-3), the results are also not entirely as
expected. The total strain for the specimen with a reinforcement ratio of 0.0054 is
larger than that for the specimen with a reinforcement ratio of 0.0036. The specimen
with a reinforcement ratio of 0.0072 experienced lower total strain than the more
lightly reinforced specimens, as expected.
161
The unloaded specimen for Group 2 exhibited very little shrinkage strain
compared to strains measured in the companion specimen in Group 1. This is
possibly due to the higher humidity in the enclosure for the Group 2 specimens as
compared to Group 1.
General information regarding the concentrically loaded 8,000 psi specimens
is presented in Table 4.1. The table presents total strains for 40, 80 and 120 days after
loading. When data were not available for the day indicated, linear interpolation was
used between the data from adjacent dates on which data were recorded.
162

163

164

165

166
b) 4,000 psi Specimens
Figure 4.77 presents the preliminary results for all the 4,000 psi specimens.
Most specimens in Group 3 were loaded for approximately 120 days, and most
specimens of Group 4 were loaded for approximately 50 days. A reasonable scatter is
evident in the results. Concrete material differences for Group 4 are manifested in the
slightly higher strains for the Group 4 specimens than for Group 3.
Figure 4.78 presents the results for Group 3 specimens only. A limited
amount of scatter is apparent in the measured strain data. With the exception of
Specimen C4-0.0072-1 and U4-0.0054, the more lightly reinforced specimens
exhibited slightly higher strains as expected.
Figure 4.79 presents the results for Group 4 specimens only. A limited
amount of scatter is noticed in the strain data. The amount appears comparable to that
observed for the Group 3 specimens at the same stage of response. The strain data for
Specimens C4-0.0000, C4-0.0036-3 and C4-0.0054-3 are tightly grouped. The
specimen with the highest reinforcement ratio (C4-0.0072-3) experienced slightly
higher strains than the other specimens. This may be due to over-application of load
or an inadequate number of Demec readings (one Demec gage was unreadable).
General information regarding the concentrically loaded 4,000 psi specimens
is presented in Table 4.2. As for Table 4.1, results for 40, 80 and 120 days after
loading are presented. As for Table 4.1, linear interpolation was used where
necessary.
167

168

169

170

171
c) General Discussion
The differences in the concrete strength and resulting differences in concrete
modulii for the different groups of specimens are noticeable in the test results.
Shrinkage strains are higher for the 4,000 psi specimens than for the 8,000 psi
specimens.
Elastic strains are lower for the 4,000 psi specimens than for the 8,000 psi
specimens. This is due to the magnitude of load applied, which is a function of the
design compressive strength of the specimen.
Groups 1, 3 and 4 exhibited relatively little scatter in the strain results
compared to Group 2. This may be due to a number of reasons, which include an
inadequate number of readable Demec gages for a reliable average, incorrect
application of the load, and incorrect Demec readings.
It was initially feared that certain specimens of Groups 2 and 4 may have been
mislabeled. This was found to be unlikely due to the following reasons: specimens
with reinforcement ratios of 0.0000 and 0.0036 have one and five embedded electrical
gages, respectively. The specimens with reinforcement ratios of 0.0054 and 0.0072
both have seven embedded electrical gages. Because wires attached to the gages are
exposed, it is possible to confuse the specimens with reinforcement ratios of 0.0054
and 0.0072, but it is not possible to confuse these specimens with those that have
reinforcement ratios of 0.0000 or 0.0036. Furthermore, the specimens with ratios of
0.0000 and 0.0036 have a unique number of gages (and lead wires) and therefore
cannot be confused with each other.
Groups 2 and 4 have been loaded for a brief period of time (approximately 50
days). As more data are collected, the general trends may shed more light on what
now appear to be anomalies in the data.
172
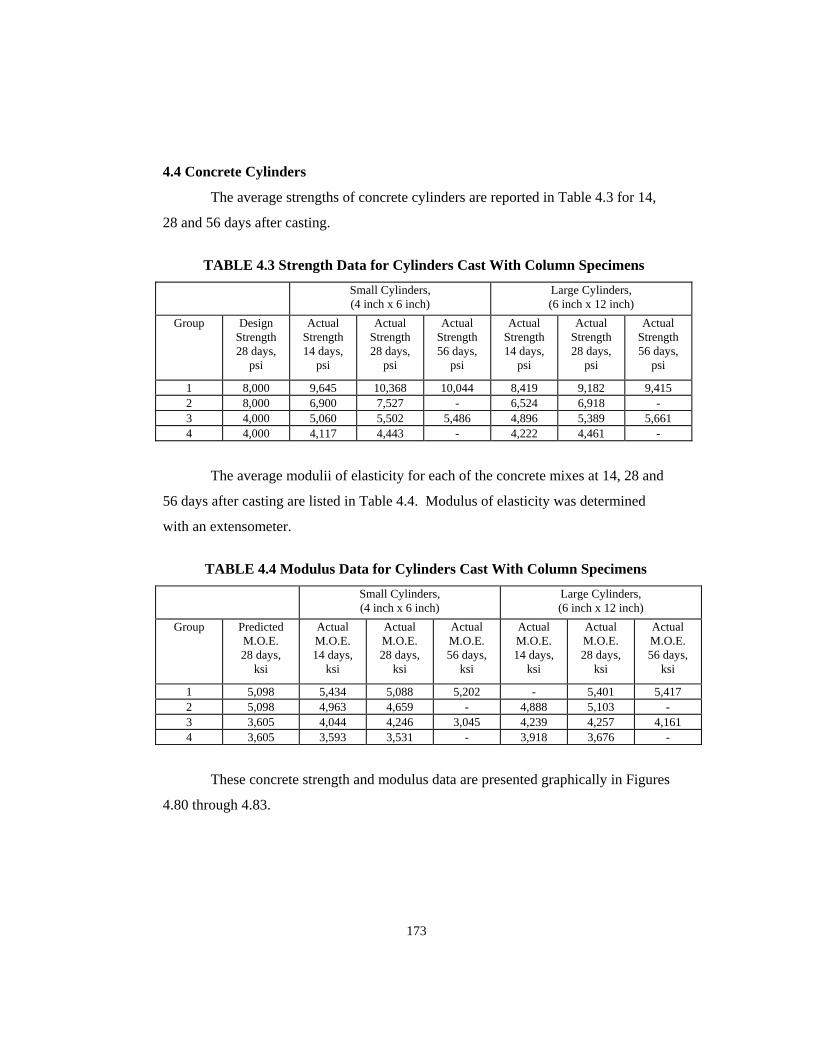
4.4 Concrete Cylinders
The average strengths of concrete cylinders are reported in Table 4.3 for 14,
28 and 56 days after casting.
TABLE 4.3 Strength Data for Cylinders Cast With Column Specimens
Small Cylinders, (4 inch x 6 inch)
Large Cylinders, (6 inch x 12 inch)
Group Design Strength 28 days,
psi
Actual Strength 14 days,
psi
Actual Strength 28 days,
psi
Actual Strength 56 days,
psi
Actual Strength 14 days,
psi
Actual Strength 28 days,
psi
Actual Strength 56 days,
psi
1 8,000 9,645 10,368 10,044 8,419 9,182 9,415 2 8,000 6,900 7,527 - 6,524 6,918 - 3 4,000 5,060 5,502 5,486 4,896 5,389 5,661 4 4,000 4,117 4,443 - 4,222 4,461 -
The average modulii of elasticity for each of the concrete mixes at 14, 28 and
56 days after casting are listed in Table 4.4. Modulus of elasticity was determined
with an extensometer.
TABLE 4.4 Modulus Data for Cylinders Cast With Column Specimens
Small Cylinders, (4 inch x 6 inch)
Large Cylinders, (6 inch x 12 inch)
Group Predicted M.O.E. 28 days,
ksi
Actual M.O.E. 14 days,
ksi
Actual M.O.E. 28 days,
ksi
Actual M.O.E. 56 days,
ksi
Actual M.O.E. 14 days,
ksi
Actual M.O.E. 28 days,
ksi
Actual M.O.E. 56 days,
ksi
1 5,098 5,434 5,088 5,202 - 5,401 5,417 2 5,098 4,963 4,659 - 4,888 5,103 - 3 3,605 4,044 4,246 3,045 4,239 4,257 4,161 4 3,605 3,593 3,531 - 3,918 3,676 -
These concrete strength and modulus data are presented graphically in Figures
4.80 through 4.83.
173

174

175

176

177
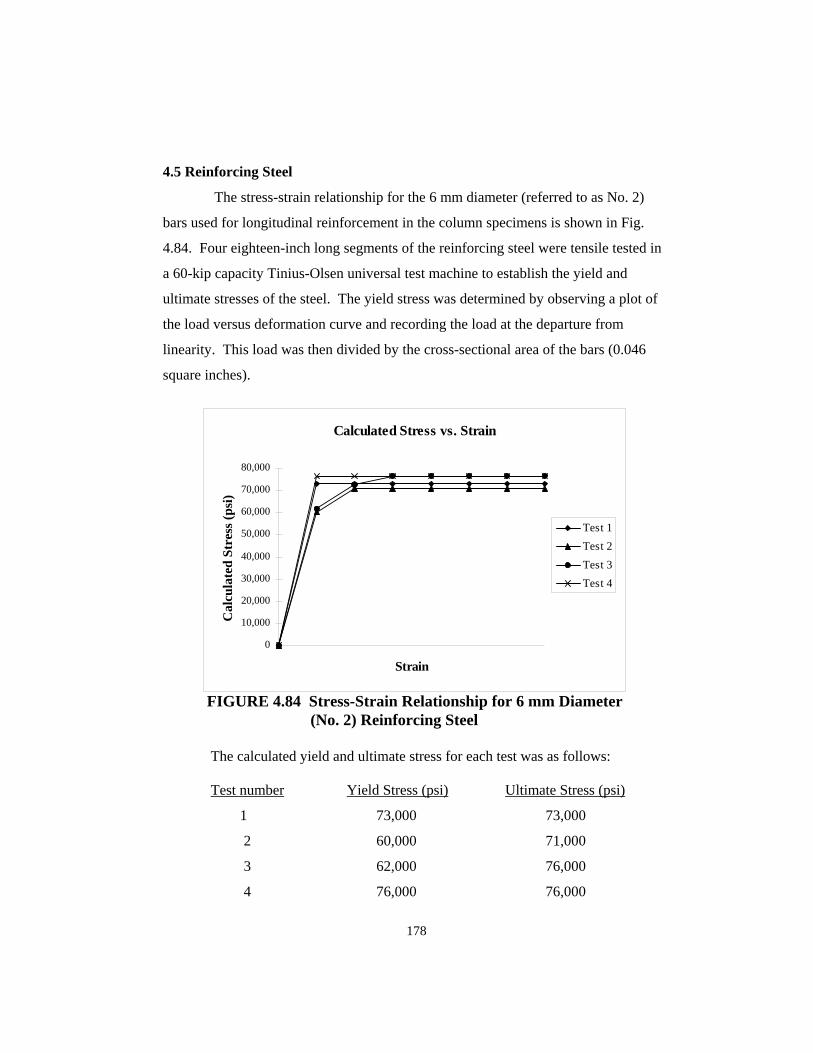
4.5 Reinforcing Steel
The stress-strain relationship for the 6 mm diameter (referred to as No. 2)
bars used for longitudinal reinforcement in the column specimens is shown in Fig.
4.84. Four eighteen-inch long segments of the reinforcing steel were tensile tested in
a 60-kip capacity Tinius-Olsen universal test machine to establish the yield and
ultimate stresses of the steel. The yield stress was determined by observing a plot of
the load versus deformation curve and recording the load at the departure from
linearity. This load was then divided by the cross-sectional area of the bars (0.046
square inches).
Calculated Stress vs. Strain
0
10,000
20,000
30,000
40,000
50,000
60,000
70,000
80,000
Strain
Cal
cula
ted
Stre
ss (p
si)
Test 1Test 2Test 3Test 4
FIGURE 4.84 Stress-Strain Relationship for 6 mm Diameter (No. 2) Reinforcing Steel The calculated yield and ultimate stress for each test was as follows: Test number Yield Stress (psi) Ultimate Stress (psi)
1 73,000 73,000
2 60,000 71,000
3 62,000 76,000
4 76,000 76,000
178

179
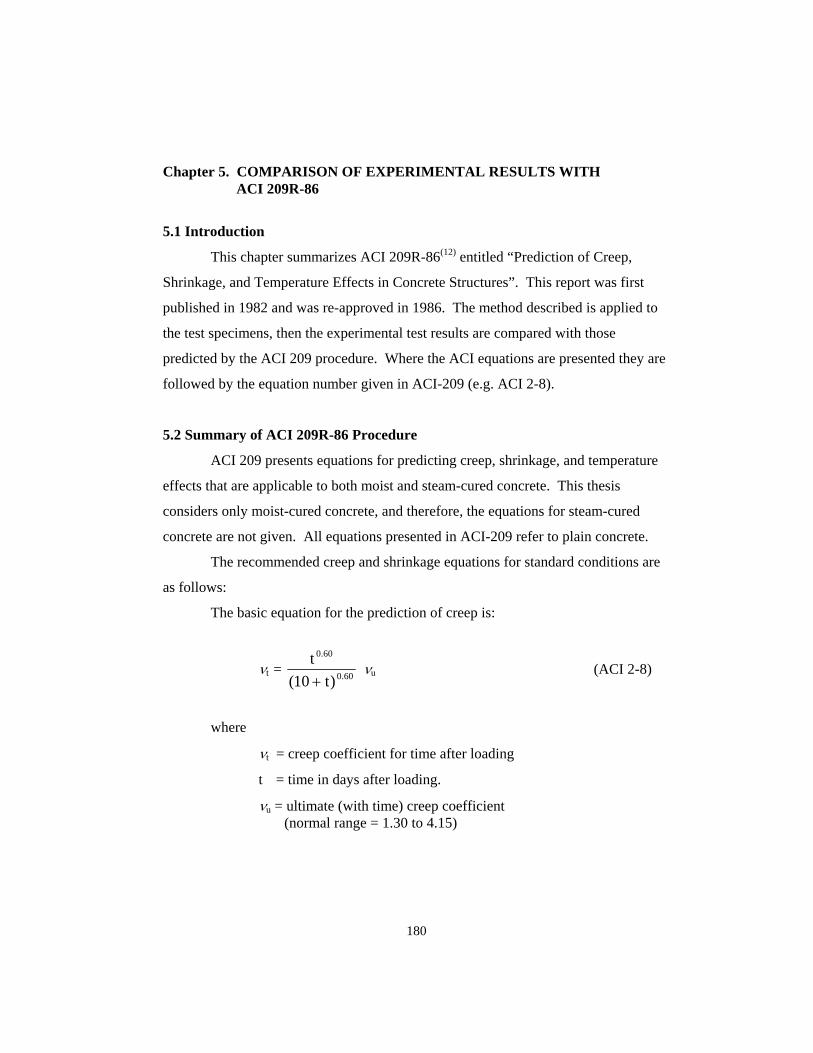
Chapter 5. COMPARISON OF EXPERIMENTAL RESULTS WITH ACI 209R-86
5.1 Introduction
This chapter summarizes ACI 209R-86(12) entitled “Prediction of Creep,
Shrinkage, and Temperature Effects in Concrete Structures”. This report was first
published in 1982 and was re-approved in 1986. The method described is applied to
the test specimens, then the experimental test results are compared with those
predicted by the ACI 209 procedure. Where the ACI equations are presented they are
followed by the equation number given in ACI-209 (e.g. ACI 2-8).
5.2 Summary of ACI 209R-86 Procedure
ACI 209 presents equations for predicting creep, shrinkage, and temperature
effects that are applicable to both moist and steam-cured concrete. This thesis
considers only moist-cured concrete, and therefore, the equations for steam-cured
concrete are not given. All equations presented in ACI-209 refer to plain concrete.
The recommended creep and shrinkage equations for standard conditions are
as follows:
The basic equation for the prediction of creep is:
νt = t
t
0 60
0 6010
.
.( )+ νu (ACI 2-8)
where
νt = creep coefficient for time after loading
t = time in days after loading. νu = ultimate (with time) creep coefficient (normal range = 1.30 to 4.15)
180
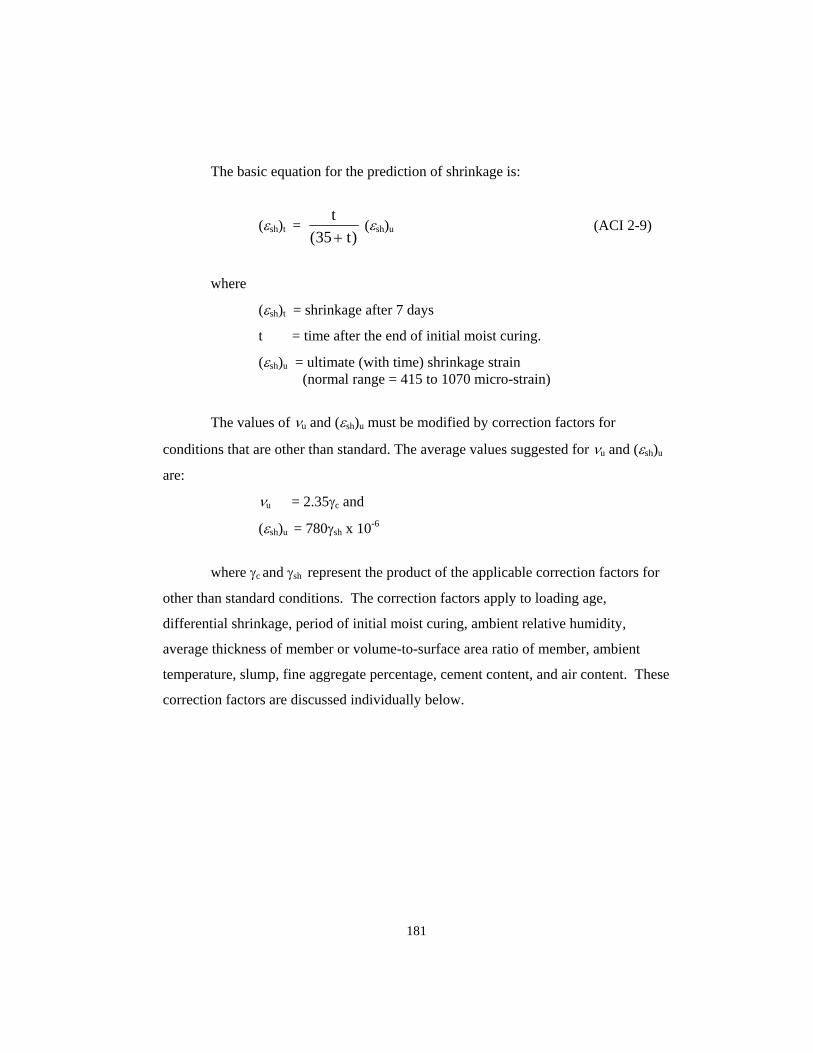
The basic equation for the prediction of shrinkage is:
(εsh)t = t
t( )35+ (εsh)u (ACI 2-9)
where
(εsh)t = shrinkage after 7 days
t = time after the end of initial moist curing.
(εsh)u = ultimate (with time) shrinkage strain (normal range = 415 to 1070 micro-strain)
The values of νu and (εsh)u must be modified by correction factors for
conditions that are other than standard. The average values suggested for νu and (εsh)u
are:
νu = 2.35γc and
(εsh)u = 780γsh x 10-6
where γc and γsh represent the product of the applicable correction factors for
other than standard conditions. The correction factors apply to loading age,
differential shrinkage, period of initial moist curing, ambient relative humidity,
average thickness of member or volume-to-surface area ratio of member, ambient
temperature, slump, fine aggregate percentage, cement content, and air content. These
correction factors are discussed individually below.
181
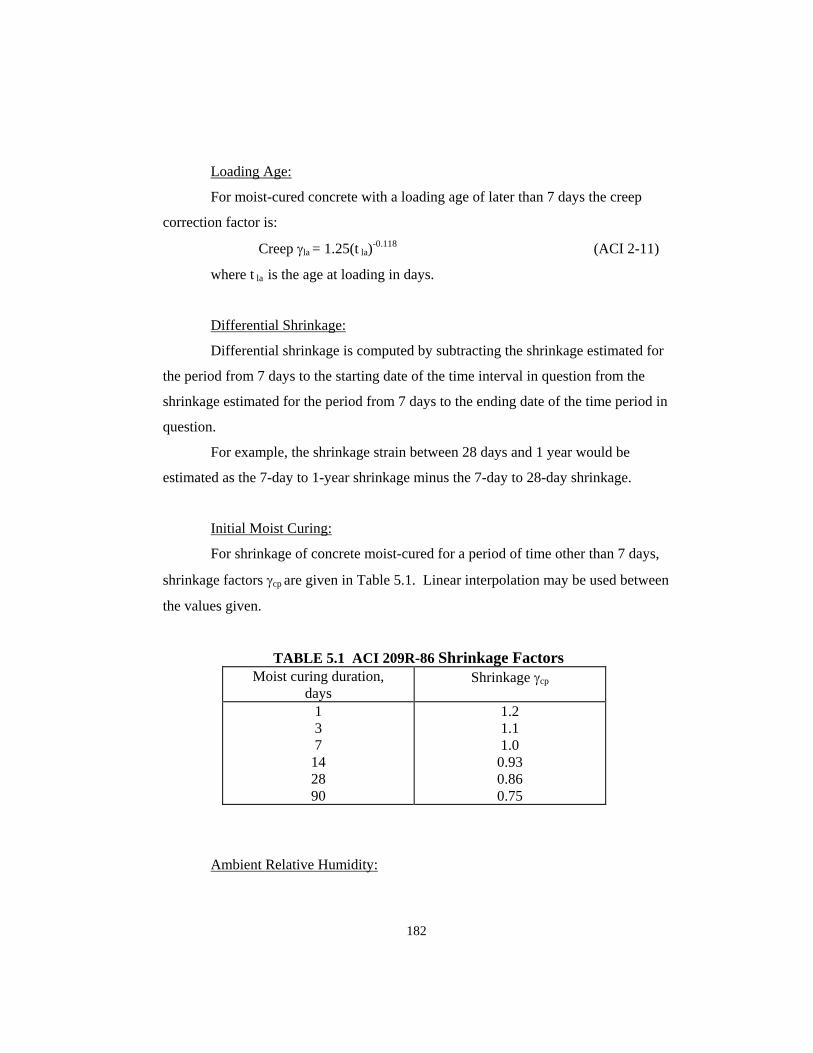
Loading Age:
For moist-cured concrete with a loading age of later than 7 days the creep
correction factor is:
Creep γla = 1.25(t la)-0.118 (ACI 2-11)
where t la is the age at loading in days.
Differential Shrinkage:
Differential shrinkage is computed by subtracting the shrinkage estimated for
the period from 7 days to the starting date of the time interval in question from the
shrinkage estimated for the period from 7 days to the ending date of the time period in
question.
For example, the shrinkage strain between 28 days and 1 year would be
estimated as the 7-day to 1-year shrinkage minus the 7-day to 28-day shrinkage.
Initial Moist Curing:
For shrinkage of concrete moist-cured for a period of time other than 7 days,
shrinkage factors γcp are given in Table 5.1. Linear interpolation may be used between
the values given.
TABLE 5.1 ACI 209R-86 Shrinkage Factors Moist curing duration,
days Shrinkage γcp
1 3 7
14 28 90
1.2 1.1 1.0
0.93 0.86 0.75
Ambient Relative Humidity:
182
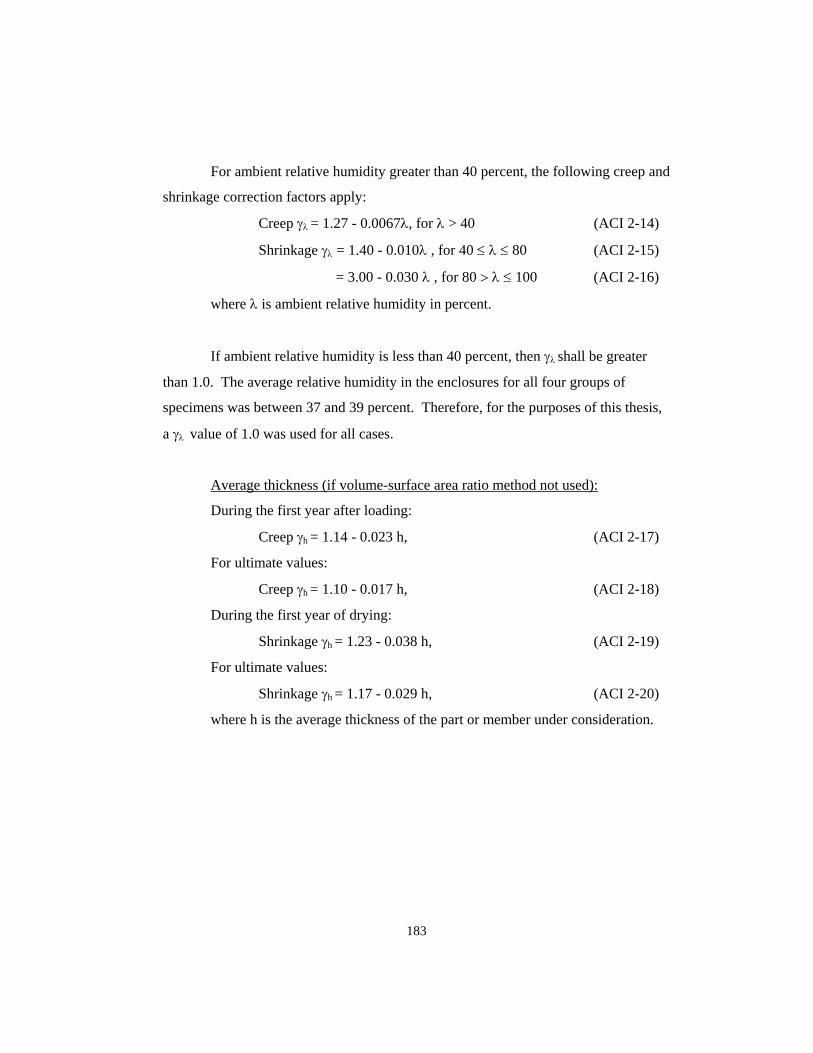
For ambient relative humidity greater than 40 percent, the following creep and
shrinkage correction factors apply:
Creep γλ = 1.27 - 0.0067λ, for λ > 40 (ACI 2-14)
Shrinkage γλ = 1.40 - 0.010λ , for 40 ≤ λ ≤ 80 (ACI 2-15)
= 3.00 - 0.030 λ , for 80 > λ ≤ 100 (ACI 2-16)
where λ is ambient relative humidity in percent.
If ambient relative humidity is less than 40 percent, then γλ shall be greater
than 1.0. The average relative humidity in the enclosures for all four groups of
specimens was between 37 and 39 percent. Therefore, for the purposes of this thesis,
a γλ value of 1.0 was used for all cases.
Average thickness (if volume-surface area ratio method not used):
During the first year after loading:
Creep γh = 1.14 - 0.023 h, (ACI 2-17)
For ultimate values:
Creep γh = 1.10 - 0.017 h, (ACI 2-18)
During the first year of drying:
Shrinkage γh = 1.23 - 0.038 h, (ACI 2-19)
For ultimate values:
Shrinkage γh = 1.17 - 0.029 h, (ACI 2-20)
where h is the average thickness of the part or member under consideration.
183
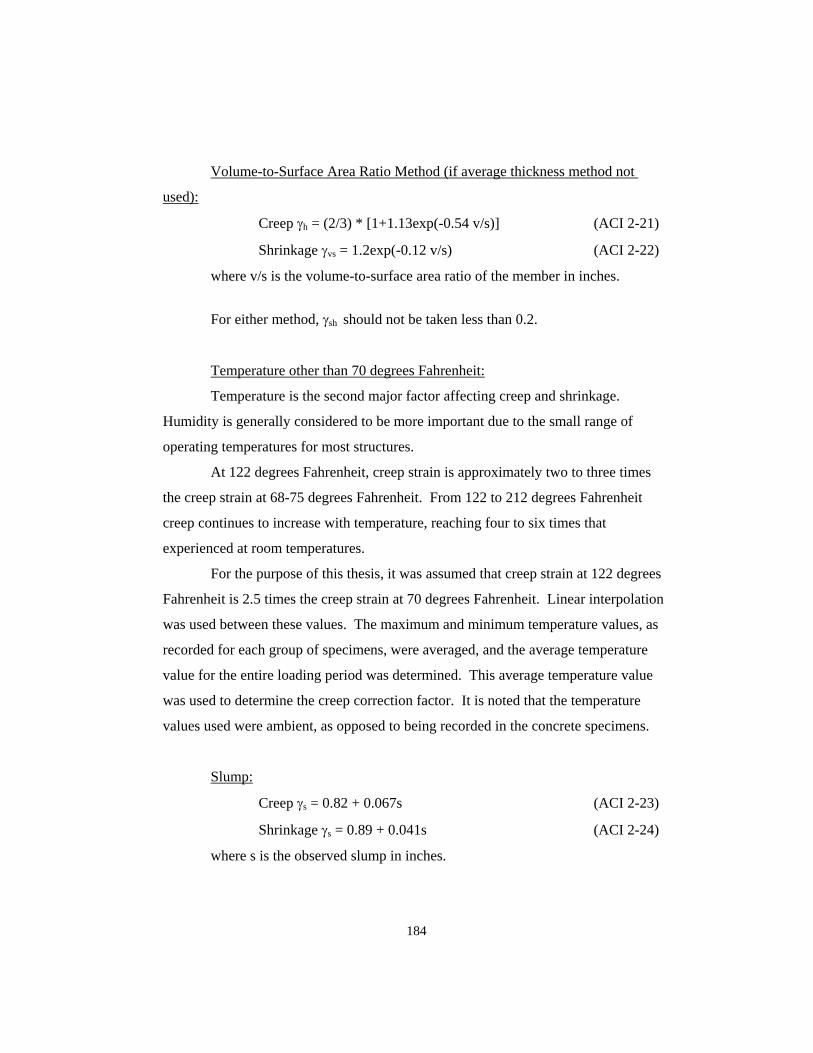
Volume-to-Surface Area Ratio Method (if average thickness method not
used):
Creep γh = (2/3) * [1+1.13exp(-0.54 v/s)] (ACI 2-21)
Shrinkage γvs = 1.2exp(-0.12 v/s) (ACI 2-22)
where v/s is the volume-to-surface area ratio of the member in inches.
For either method, γsh should not be taken less than 0.2.
Temperature other than 70 degrees Fahrenheit:
Temperature is the second major factor affecting creep and shrinkage.
Humidity is generally considered to be more important due to the small range of
operating temperatures for most structures.
At 122 degrees Fahrenheit, creep strain is approximately two to three times
the creep strain at 68-75 degrees Fahrenheit. From 122 to 212 degrees Fahrenheit
creep continues to increase with temperature, reaching four to six times that
experienced at room temperatures.
For the purpose of this thesis, it was assumed that creep strain at 122 degrees
Fahrenheit is 2.5 times the creep strain at 70 degrees Fahrenheit. Linear interpolation
was used between these values. The maximum and minimum temperature values, as
recorded for each group of specimens, were averaged, and the average temperature
value for the entire loading period was determined. This average temperature value
was used to determine the creep correction factor. It is noted that the temperature
values used were ambient, as opposed to being recorded in the concrete specimens.
Slump:
Creep γs = 0.82 + 0.067s (ACI 2-23)
Shrinkage γs = 0.89 + 0.041s (ACI 2-24)
where s is the observed slump in inches.
184
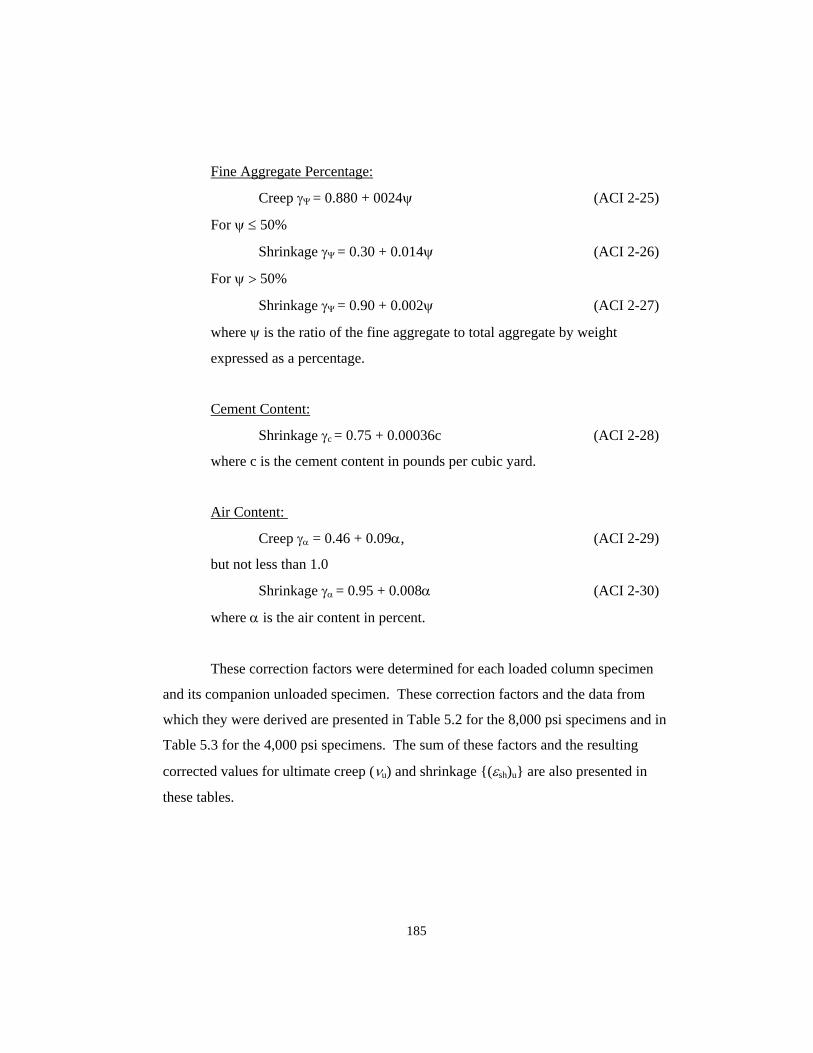
Fine Aggregate Percentage:
Creep γΨ = 0.880 + 0024ψ (ACI 2-25)
For ψ ≤ 50%
Shrinkage γΨ = 0.30 + 0.014ψ (ACI 2-26)
For ψ > 50%
Shrinkage γΨ = 0.90 + 0.002ψ (ACI 2-27)
where ψ is the ratio of the fine aggregate to total aggregate by weight
expressed as a percentage.
Cement Content:
Shrinkage γc = 0.75 + 0.00036c (ACI 2-28)
where c is the cement content in pounds per cubic yard.
Air Content:
Creep γα = 0.46 + 0.09α, (ACI 2-29)
but not less than 1.0
Shrinkage γα = 0.95 + 0.008α (ACI 2-30)
where α is the air content in percent.
These correction factors were determined for each loaded column specimen
and its companion unloaded specimen. These correction factors and the data from
which they were derived are presented in Table 5.2 for the 8,000 psi specimens and in
Table 5.3 for the 4,000 psi specimens. The sum of these factors and the resulting
corrected values for ultimate creep (νu) and shrinkage {(εsh)u} are also presented in
these tables.
185

186

187

188

189
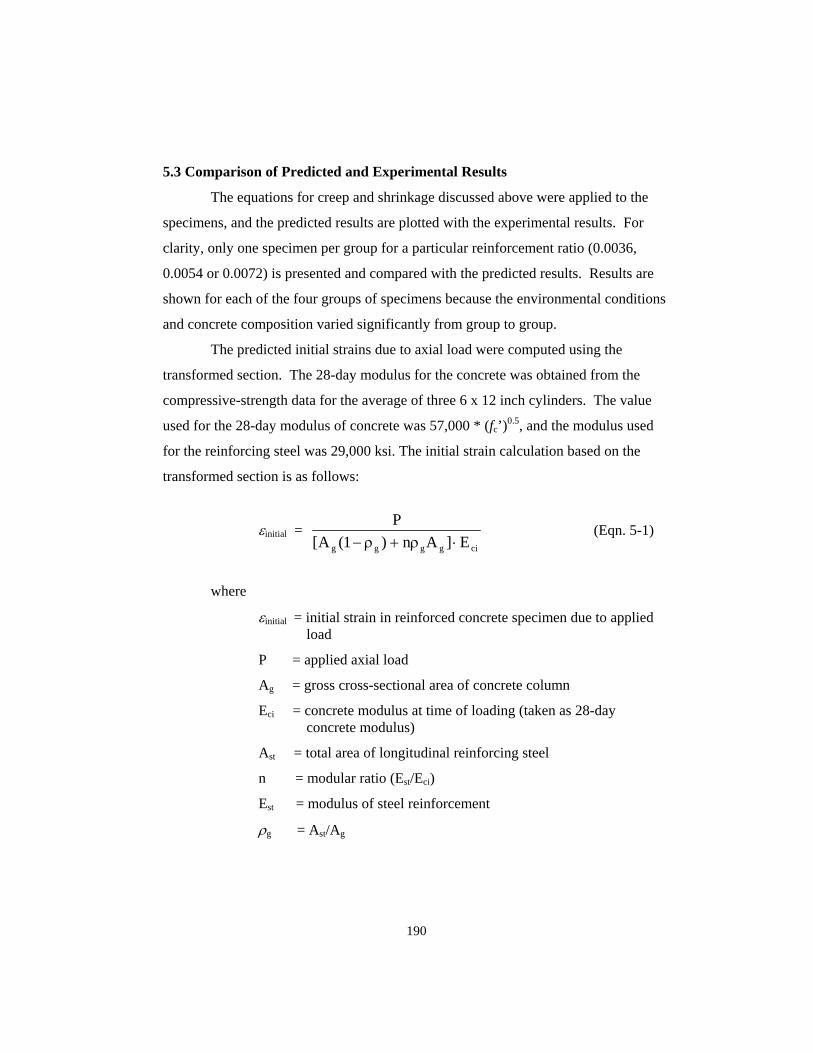
5.3 Comparison of Predicted and Experimental Results
The equations for creep and shrinkage discussed above were applied to the
specimens, and the predicted results are plotted with the experimental results. For
clarity, only one specimen per group for a particular reinforcement ratio (0.0036,
0.0054 or 0.0072) is presented and compared with the predicted results. Results are
shown for each of the four groups of specimens because the environmental conditions
and concrete composition varied significantly from group to group.
The predicted initial strains due to axial load were computed using the
transformed section. The 28-day modulus for the concrete was obtained from the
compressive-strength data for the average of three 6 x 12 inch cylinders. The value
used for the 28-day modulus of concrete was 57,000 * (fc’)0.5, and the modulus used
for the reinforcing steel was 29,000 ksi. The initial strain calculation based on the
transformed section is as follows:
εinitial = P
A n Ag g g g[ ( ) ]1− + ⋅ρ ρ Eci
(Eqn. 5-1)
where
εinitial = initial strain in reinforced concrete specimen due to applied load P = applied axial load
Ag = gross cross-sectional area of concrete column
Eci = concrete modulus at time of loading (taken as 28-day concrete modulus) Ast = total area of longitudinal reinforcing steel
n = modular ratio (Est/Eci)
Est = modulus of steel reinforcement
ρg = Ast/Ag
190
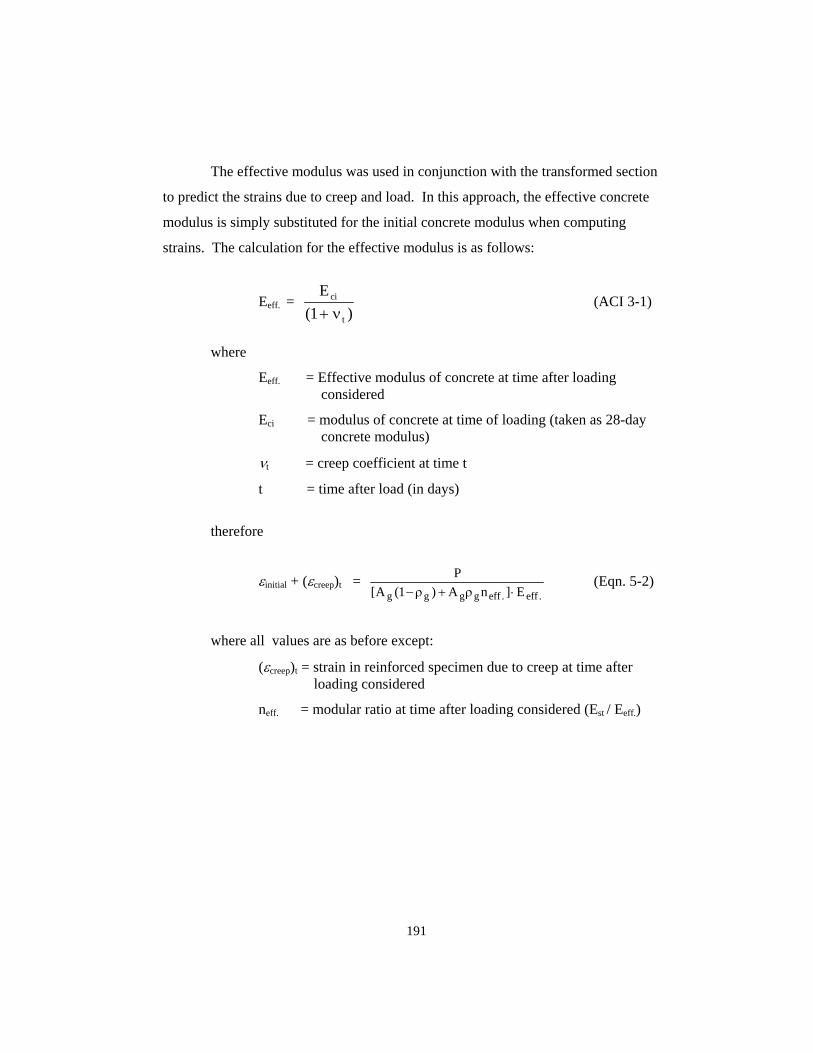
The effective modulus was used in conjunction with the transformed section
to predict the strains due to creep and load. In this approach, the effective concrete
modulus is simply substituted for the initial concrete modulus when computing
strains. The calculation for the effective modulus is as follows:
Eeff. = Eci
t( )1+ ν (ACI 3-1)
where
Eeff. = Effective modulus of concrete at time after loading considered
Eci = modulus of concrete at time of loading (taken as 28-day
concrete modulus) νt = creep coefficient at time t
t = time after load (in days)
therefore
εinitial + (εcreep)t = PA A ng g g g eff ef[ ( ) ]. .1− + ⋅ρ ρ E f
(Eqn. 5-2)
where all values are as before except:
(εcreep)t = strain in reinforced specimen due to creep at time after loading considered
neff. = modular ratio at time after loading considered (Est / Eeff.)
191
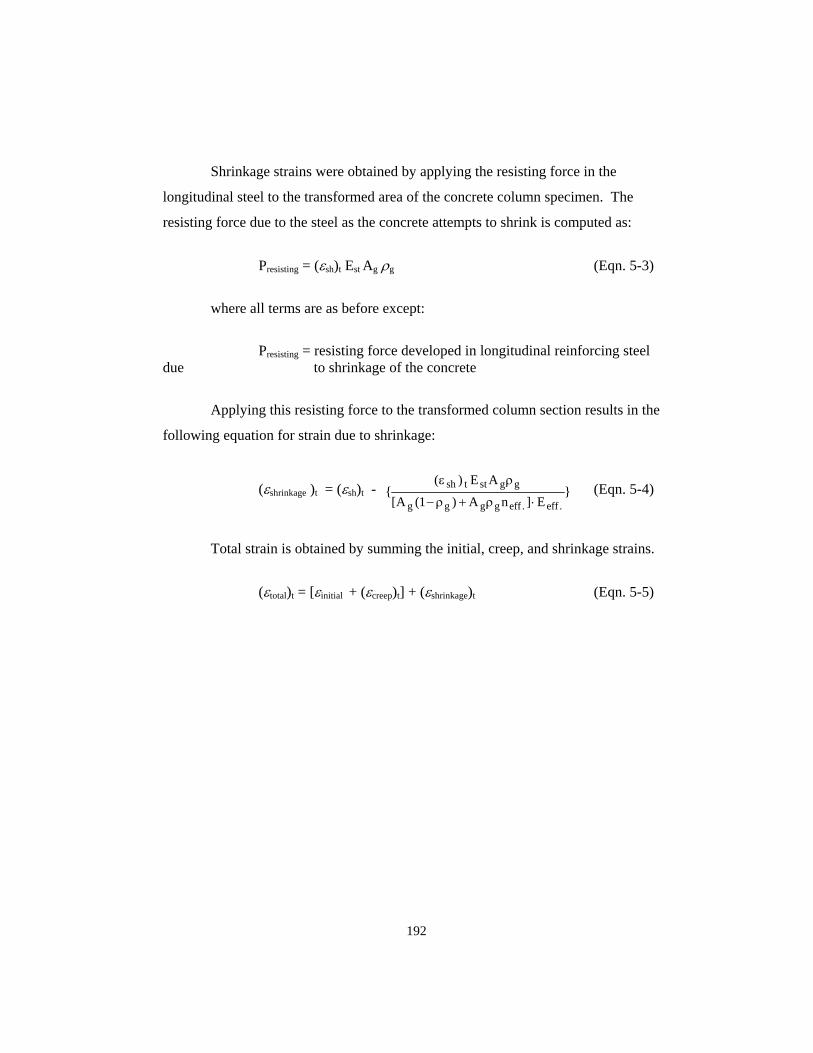
Shrinkage strains were obtained by applying the resisting force in the
longitudinal steel to the transformed area of the concrete column specimen. The
resisting force due to the steel as the concrete attempts to shrink is computed as:
Presisting = (εsh)t Est Ag ρg (Eqn. 5-3)
where all terms are as before except:
Presisting = resisting force developed in longitudinal reinforcing steel due to shrinkage of the concrete
Applying this resisting force to the transformed column section results in the
following equation for strain due to shrinkage:
(εshrinkage )t = (εsh)t - { (Eqn. 5-4) ( )
[ ( ) ]}
. .
ε ρ
ρ ρsh t st g g
g g g g eff eff
E A
A A n E1− + ⋅
Total strain is obtained by summing the initial, creep, and shrinkage strains.
(εtotal)t = [εinitial + (εcreep)t] + (εshrinkage)t (Eqn. 5-5)
192
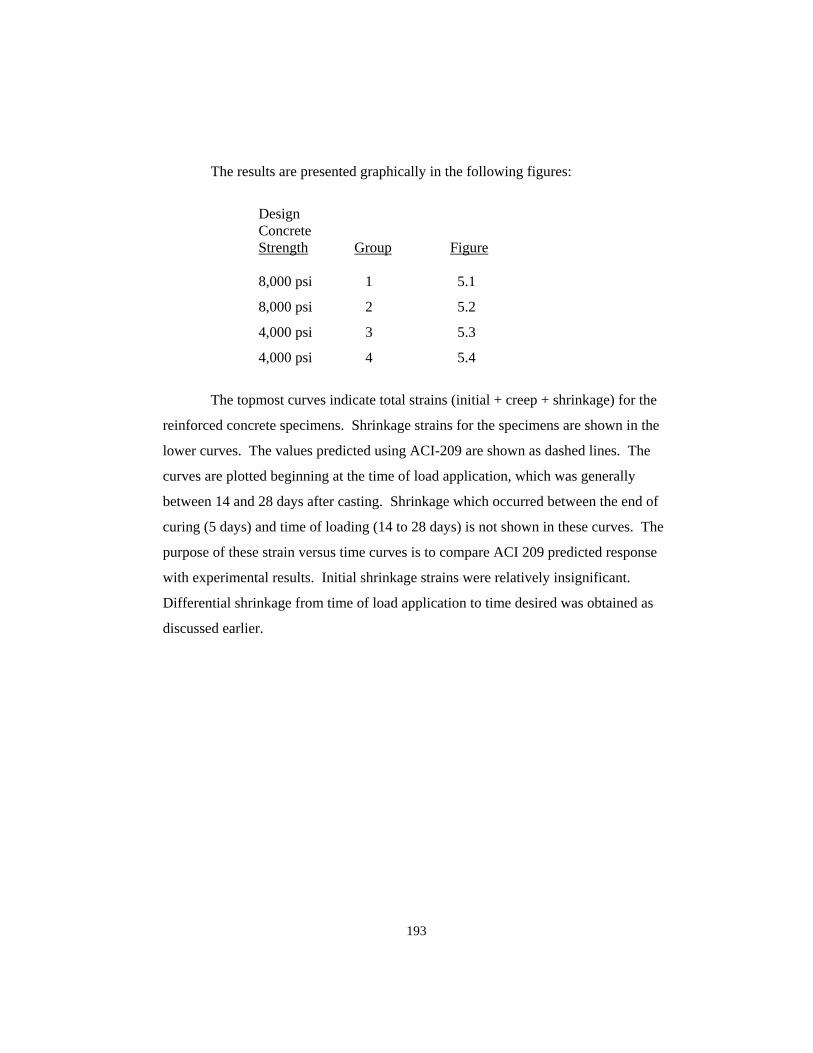
The results are presented graphically in the following figures:
Design Concrete Strength Group Figure 8,000 psi 1 5.1
8,000 psi 2 5.2
4,000 psi 3 5.3
4,000 psi 4 5.4
The topmost curves indicate total strains (initial + creep + shrinkage) for the
reinforced concrete specimens. Shrinkage strains for the specimens are shown in the
lower curves. The values predicted using ACI-209 are shown as dashed lines. The
curves are plotted beginning at the time of load application, which was generally
between 14 and 28 days after casting. Shrinkage which occurred between the end of
curing (5 days) and time of loading (14 to 28 days) is not shown in these curves. The
purpose of these strain versus time curves is to compare ACI 209 predicted response
with experimental results. Initial shrinkage strains were relatively insignificant.
Differential shrinkage from time of load application to time desired was obtained as
discussed earlier.
193
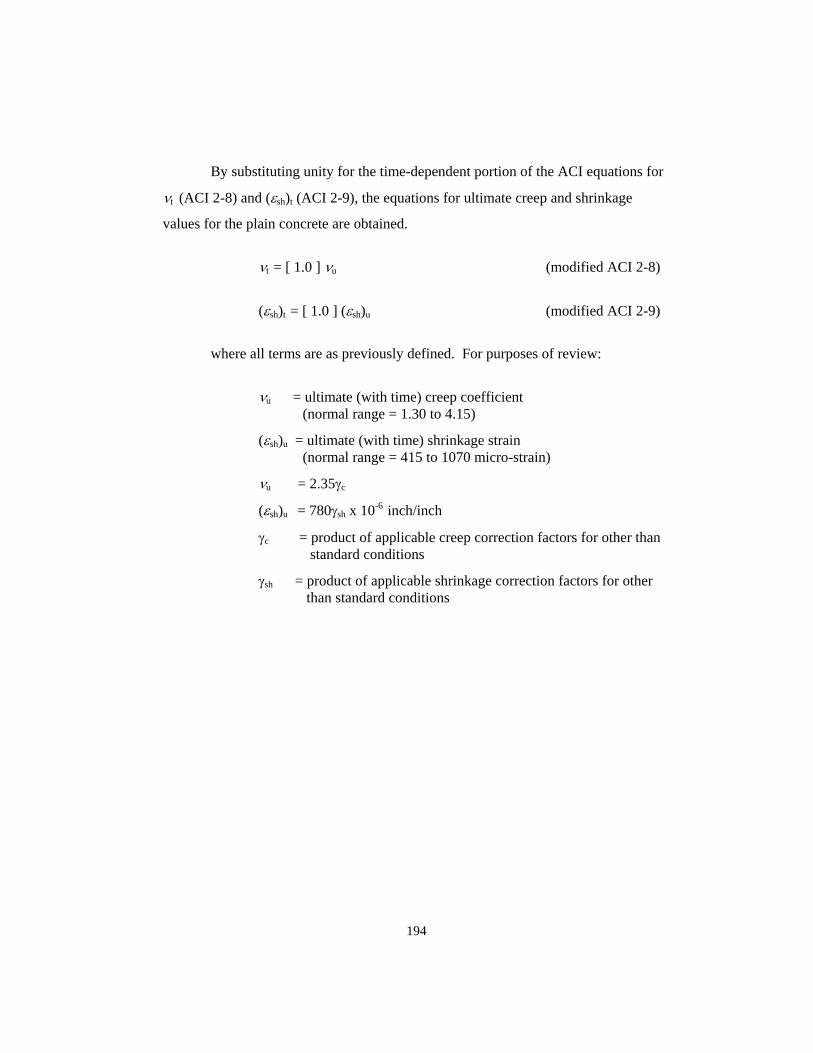
By substituting unity for the time-dependent portion of the ACI equations for
νt (ACI 2-8) and (εsh)t (ACI 2-9), the equations for ultimate creep and shrinkage
values for the plain concrete are obtained.
νt = [ 1.0 ] νu (modified ACI 2-8)
(εsh)t = [ 1.0 ] (εsh)u (modified ACI 2-9)
where all terms are as previously defined. For purposes of review:
νu = ultimate (with time) creep coefficient
(normal range = 1.30 to 4.15)
(εsh)u = ultimate (with time) shrinkage strain (normal range = 415 to 1070 micro-strain) νu = 2.35γc
(εsh)u = 780γsh x 10-6 inch/inch
γc = product of applicable creep correction factors for other than standard conditions γsh = product of applicable shrinkage correction factors for other than standard conditions
194
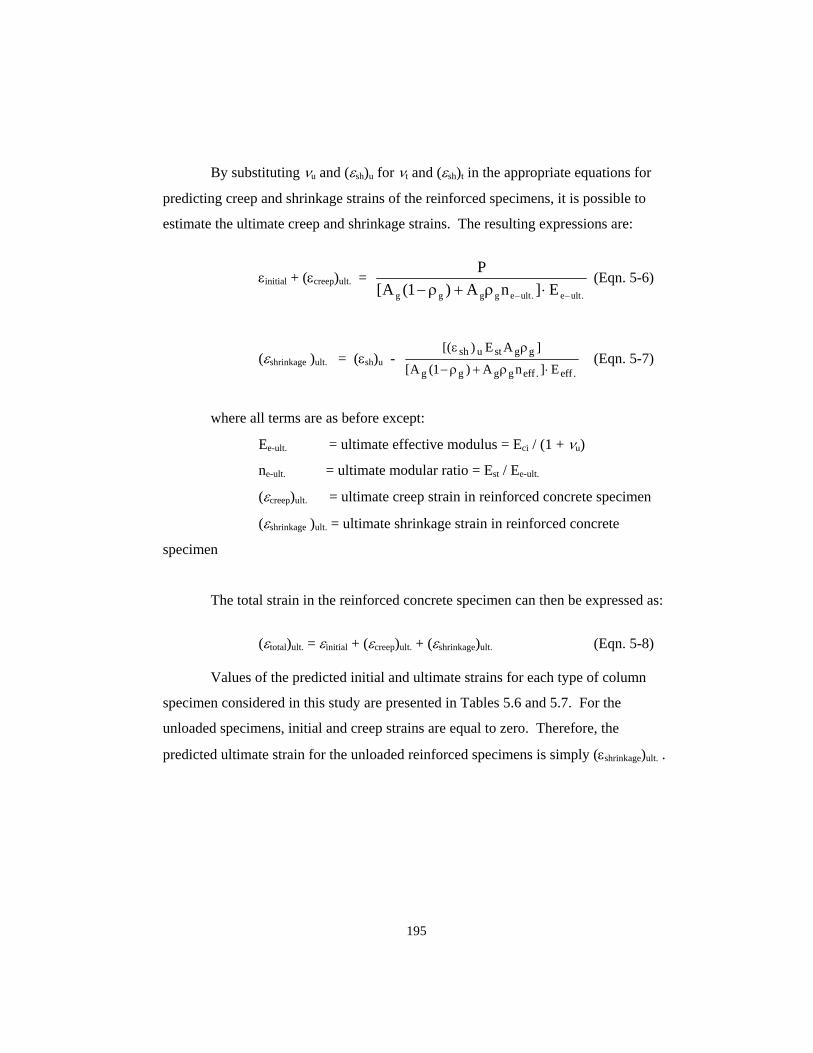
By substituting νu and (εsh)u for νt and (εsh)t in the appropriate equations for
predicting creep and shrinkage strains of the reinforced specimens, it is possible to
estimate the ultimate creep and shrinkage strains. The resulting expressions are:
εinitial + (εcreep)ult. = P
A A n Eg g g g e ult e[ ( ) ]. .1− + ⋅− −ρ ρ ult
(Eqn. 5-6)
(εshrinkage )ult. = (εsh)u - [( ) ]
[ ( ) ]. .
ε ρ
ρ ρsh u st g g
g g g g eff eff
E A
A A n E1− + ⋅ (Eqn. 5-7)
where all terms are as before except:
Ee-ult. = ultimate effective modulus = Eci / (1 + νu)
ne-ult. = ultimate modular ratio = Est / Ee-ult.
(εcreep)ult. = ultimate creep strain in reinforced concrete specimen
(εshrinkage )ult. = ultimate shrinkage strain in reinforced concrete
specimen
The total strain in the reinforced concrete specimen can then be expressed as:
(εtotal)ult. = εinitial + (εcreep)ult. + (εshrinkage)ult. (Eqn. 5-8) Values of the predicted initial and ultimate strains for each type of column
specimen considered in this study are presented in Tables 5.6 and 5.7. For the
unloaded specimens, initial and creep strains are equal to zero. Therefore, the
predicted ultimate strain for the unloaded reinforced specimens is simply (εshrinkage)ult. .
195
5.4 General Discussion
a) 8,000 psi Specimens
The total strains obtained experimentally for select Group 1 specimens
(Figure 5.1) are in reasonable agreement with the total strains predicted by ACI-209.
The predicted shrinkage strains are only slightly higher than the highest strains
obtained experimentally. The predicted total strains are initially slightly higher than
the experimental strains and are slightly lower than the maximum experimental total
strains at the end of the data collected thus far. A noticeable jump is apparent in the
total strain results for Specimen C8-0.0036-1. This jump corresponds with the day on
which the Demec gage was dropped. Subsequent readings for all specimens were
adjusted for a new zero reading, and only minor differences in readings were noted for
most specimens. However, note that the response of Specimen C8-0.0036-1 would be
closer to the predicted response if the measured response after the jump was shifted
downward by the amount of the jump. Furthermore, load in the specimens in this
group was adjusted upward at approximately 62 days after initial loading. This is
evident as a slight “upturn” in strain response at that time. Additionally, the
experimental results were adjusted for the average ambient temperature recorded on
the day the gages were read. The ambient temperature was likely higher than the
actual temperature in the concrete specimen, which likely resulted in slight under-
estimation of the total strains.
The total strains obtained experimentally for Group 2 (Figure 5.2) exhibit
significant scatter, but are in general agreement with the total strains predicted by
ACI-209. The predicted shrinkage strains are only slightly higher than those obtained
experimentally from 0 to 20 days after loading. Beyond 20 days, however, the
shrinkage strains for Specimen U8-0.0000-2 (which is the only unloaded, spirally-
reinforced specimen in this group) are well below the predicted values. It is
speculated that this may be due to the higher average relative humidity during this
period. The reduction in shrinkage strain appears to be reflected in the total strain
results for the loaded specimens. Load in these specimens was adjusted at
196

approximately 44 days after initial loading. The effect of reloading is noticeable to
varying degrees in the results.
197

198

199
b) 4,000 psi Specimens
The total strains obtained experimentally for Group 3 (Figure 5.3) exhibit
reasonable agreement with the total strains predicted by ACI-209. The predicted
shrinkage strains are only slightly higher than those obtained experimentally. The
specimens in this group were generally reloaded at 59 days after initial loading. The
effects of reloading are evident in the measured strain responses as a significant
increase in strains for all loaded specimens. A positive temperature differential of 14
degrees Fahrenheit exists between the readings taken at 41 days and those taken at 59
days after initial loading. As mentioned earlier, the adjustment made for temperature
differentials likely resulted in a slight under-estimation of total strains.
Total strains obtained experimentally for Group 4 (Figure 5.4) are less than
the total strains predicted by ACI-209. Predicted shrinkage strains are higher than
those obtained experimentally from 0 to 20 days after initial loading. Beyond 20 days
the shrinkage strains for Specimen U4-0.0000-2 (which is the only unloaded and
spirally-reinforced specimen in this group) fall well below the predicted values.
Again, it is speculated this may be due to the increase in average relative humidity
during this time period. The reduction in shrinkage strain appears to be reflected in
the total strain results for the loaded specimens. It is significant that the unloaded
specimen in this group demonstrated a very similar strain history to the unloaded
specimen of Group 2. These groups (Groups 2 and 4) were cast on the same date
(May 15, 1996). Specimens in this group were generally reloaded 37 days after initial
loading. Effects of reloading are discernible in some instances.
200

201

202
Chapter 6. SUMMARY AND CONCLUSIONS
6.1 Introduction
The objective of this investigation is to study the long-term response of
concrete columns reinforced with less than the code-required minimum reinforcement
percentage of 1.0% of the gross concrete area. Columns in this study have been
loaded for less than nine months, and therefore, the results presented and any
accompanying discussion should be viewed as preliminary. An experimental
investigation has been underway and the preliminary results of this investigation were
compared to responses predicted by the analytical method reported by ACI Committee
209R-86(12).
6.2 Experimental Investigation
A total of 38 concrete columns were cast and are currently being investigated.
Each column has a nominal cross-sectional diameter of 8 inches and is 4 feet 0 inches
long. Of the 38 columns, 24 are under sustained load equal to 0.40*fc’*Ag (with one
exception). The load is being maintained with heavy coil springs. All columns were
loaded between 14 and 28 days after casting. Ambient humidity has been reduced as
much as practical. The following variables are being investigated:
1. Concrete Strength
Concrete design strengths (at 28 days) of 4,000 psi and 8,000 psi.
2. Reinforcement Ratio
Reinforcement percentages of 0.36%, 0.54% and 0.72%.
3. Eccentricity
No eccentricity and eccentricity equal to 0.10*column diameter.
203
6.3 Comparison of Experimental Results with Predicted Analytical Results
In Chapter 5, results obtained experimentally were plotted with the results
predicted by the ACI 209 analytical procedure. This was done for the majority of the
specimens. The loading age, average amibient humidity, average ambient
temperature, concrete strength and other important parameters were considered for
each specimen, and appropriate factors were used in the ACI 209 procedure. In most
cases, good agreement was found between the results predicted by ACI 209 and the
experimental results.
The effect of temperature is apparent in the experimental and analytical
results. Specimens which were cast in the summer months (Groups 2 and 4) exhibit
higher rates of creep than specimens which were cast in the winter and spring months
(Groups 1 and 3). Temperature effects are considered in the ACI 209 procedure. ACI
209 notes that creep strains at 122 degrees Fahrenheit are roughly two to three times
those at 68-75 degrees Fahrenheit. However, no creep coefficient is directly
suggested for temperatures exceeding 70 degrees Fahrenheit. Because temperature
had an apparent impact in the experimental results, it was accounted for in the
application of the ACI 209 procedure. For purposes of this thesis, it was assumed that
creep strains are 2.5 times as great at 122 degrees Fahrenheit as at 70 degrees
Fahrenheit, and that linear interpolation can be used between these temperature
values. As mentioned earlier, good correlation between the experimental and
analytical results was observed.
6.4 Predictions of Future Behavior
As mentioned in Chapter 1, values of the ultimate creep coefficient (νu) and
ultimate shrinkage strain [(εsh)u ] have upper-bounds of 4.35 and 1070, respectively,
for other than standard conditions (as defined in ACI 209). These upper-bound values
for creep and shrinkage are applied to an 8,000 psi specimen with a reinforcement
percentage of 0.72%. A loading age of 14 days after casting is assumed. In Figure
6.1, the predicted total strains for this specimen over a loading period of two years are
204
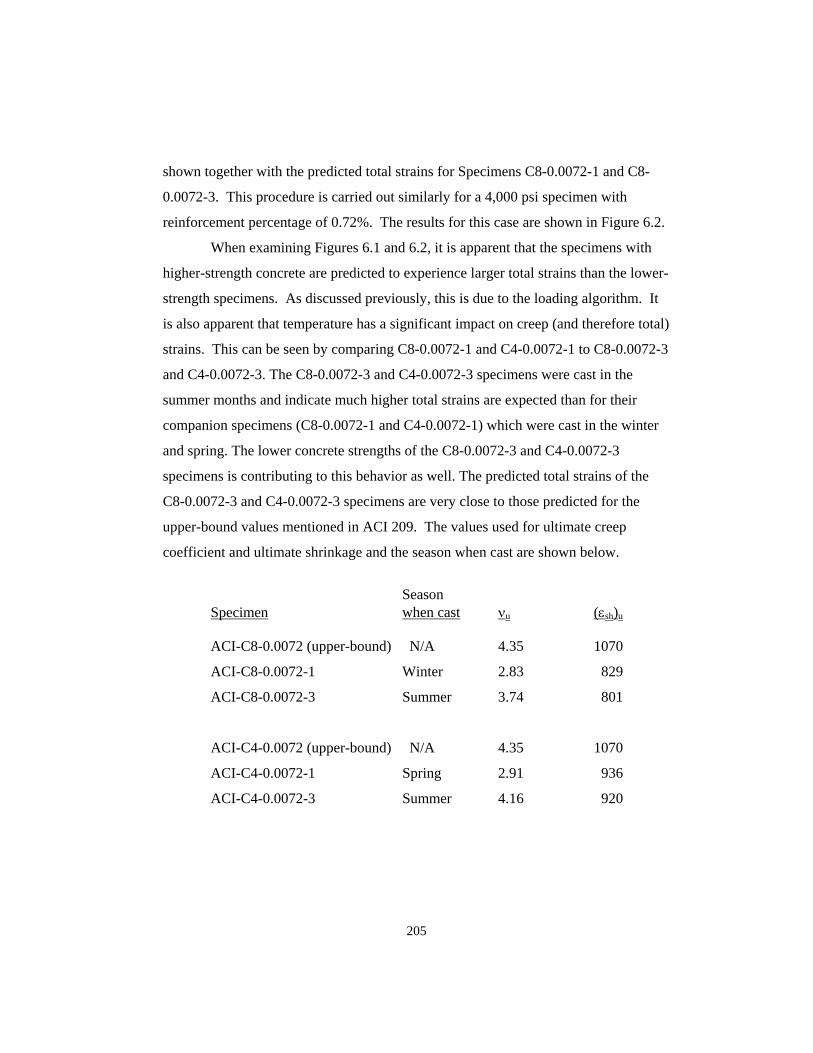
shown together with the predicted total strains for Specimens C8-0.0072-1 and C8-
0.0072-3. This procedure is carried out similarly for a 4,000 psi specimen with
reinforcement percentage of 0.72%. The results for this case are shown in Figure 6.2.
When examining Figures 6.1 and 6.2, it is apparent that the specimens with
higher-strength concrete are predicted to experience larger total strains than the lower-
strength specimens. As discussed previously, this is due to the loading algorithm. It
is also apparent that temperature has a significant impact on creep (and therefore total)
strains. This can be seen by comparing C8-0.0072-1 and C4-0.0072-1 to C8-0.0072-3
and C4-0.0072-3. The C8-0.0072-3 and C4-0.0072-3 specimens were cast in the
summer months and indicate much higher total strains are expected than for their
companion specimens (C8-0.0072-1 and C4-0.0072-1) which were cast in the winter
and spring. The lower concrete strengths of the C8-0.0072-3 and C4-0.0072-3
specimens is contributing to this behavior as well. The predicted total strains of the
C8-0.0072-3 and C4-0.0072-3 specimens are very close to those predicted for the
upper-bound values mentioned in ACI 209. The values used for ultimate creep
coefficient and ultimate shrinkage and the season when cast are shown below.
Season Specimen when cast νu (εsh)u ACI-C8-0.0072 (upper-bound) N/A 4.35 1070
ACI-C8-0.0072-1 Winter 2.83 829
ACI-C8-0.0072-3 Summer 3.74 801
ACI-C4-0.0072 (upper-bound) N/A 4.35 1070
ACI-C4-0.0072-1 Spring 2.91 936
ACI-C4-0.0072-3 Summer 4.16 920
205

206

207
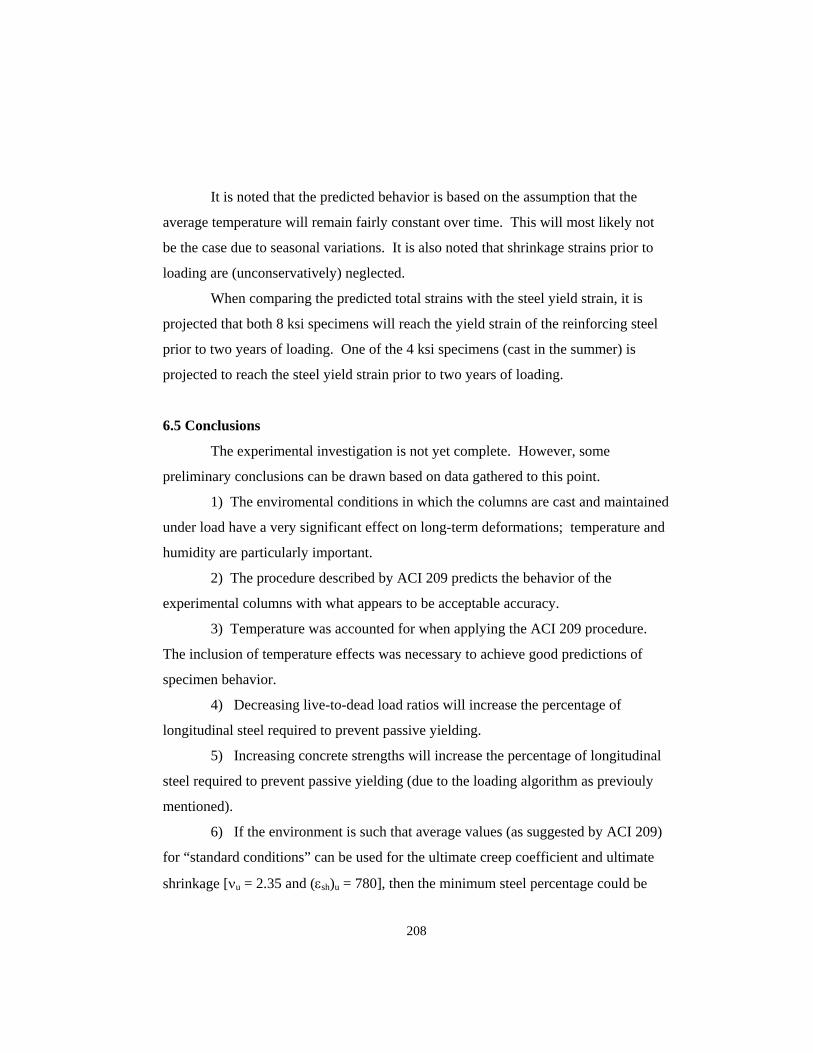
It is noted that the predicted behavior is based on the assumption that the
average temperature will remain fairly constant over time. This will most likely not
be the case due to seasonal variations. It is also noted that shrinkage strains prior to
loading are (unconservatively) neglected.
When comparing the predicted total strains with the steel yield strain, it is
projected that both 8 ksi specimens will reach the yield strain of the reinforcing steel
prior to two years of loading. One of the 4 ksi specimens (cast in the summer) is
projected to reach the steel yield strain prior to two years of loading.
6.5 Conclusions
The experimental investigation is not yet complete. However, some
preliminary conclusions can be drawn based on data gathered to this point.
1) The enviromental conditions in which the columns are cast and maintained
under load have a very significant effect on long-term deformations; temperature and
humidity are particularly important.
2) The procedure described by ACI 209 predicts the behavior of the
experimental columns with what appears to be acceptable accuracy.
3) Temperature was accounted for when applying the ACI 209 procedure.
The inclusion of temperature effects was necessary to achieve good predictions of
specimen behavior.
4) Decreasing live-to-dead load ratios will increase the percentage of
longitudinal steel required to prevent passive yielding.
5) Increasing concrete strengths will increase the percentage of longitudinal
steel required to prevent passive yielding (due to the loading algorithm as previouly
mentioned).
6) If the environment is such that average values (as suggested by ACI 209)
for “standard conditions” can be used for the ultimate creep coefficient and ultimate
shrinkage [νu = 2.35 and (εsh)u = 780], then the minimum steel percentage could be
208
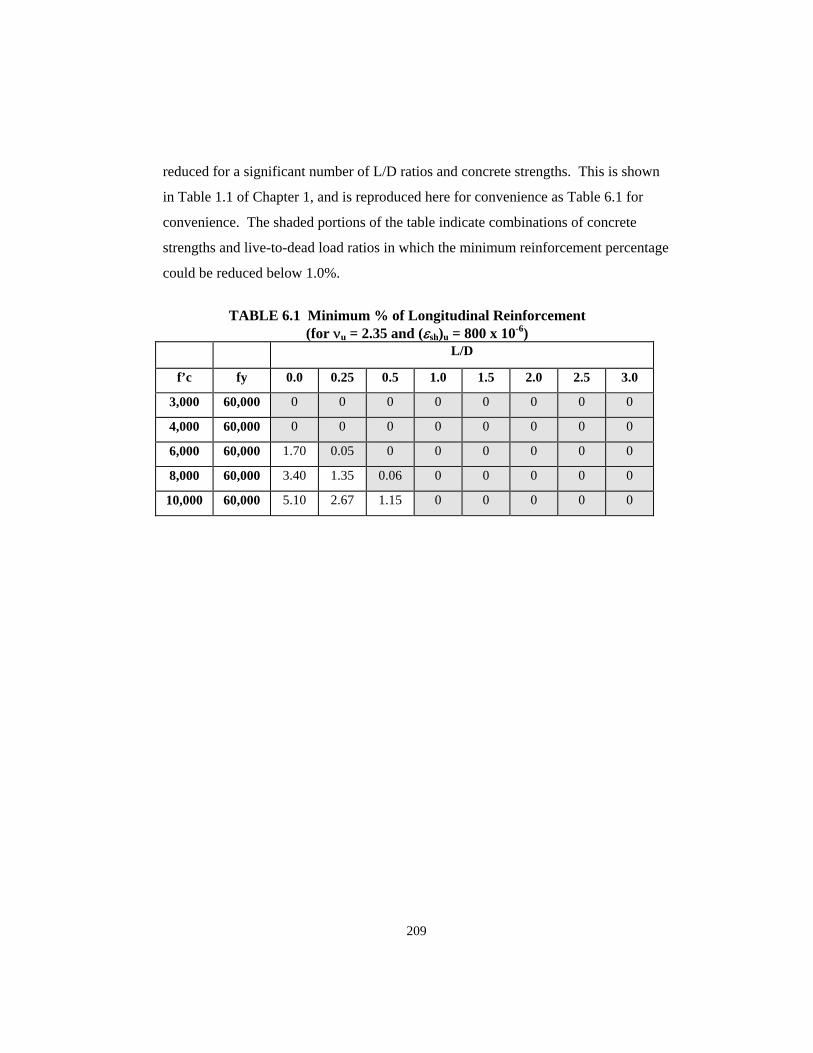
reduced for a significant number of L/D ratios and concrete strengths. This is shown
in Table 1.1 of Chapter 1, and is reproduced here for convenience as Table 6.1 for
convenience. The shaded portions of the table indicate combinations of concrete
strengths and live-to-dead load ratios in which the minimum reinforcement percentage
could be reduced below 1.0%.
TABLE 6.1 Minimum % of Longitudinal Reinforcement (for νu = 2.35 and (εsh)u = 800 x 10-6) L/D
f’c fy 0.0 0.25 0.5 1.0 1.5 2.0 2.5 3.0
3,000 60,000 0 0 0 0 0 0 0 0
4,000 60,000 0 0 0 0 0 0 0 0
6,000 60,000 1.70 0.05 0 0 0 0 0 0
8,000 60,000 3.40 1.35 0.06 0 0 0 0 0
10,000 60,000 5.10 2.67 1.15 0 0 0 0 0
209
7) If the environment is such that upper-bound values (as suggested by ACI
209) for “other than standard conditions” must be used for the ultimate creep
coefficient and ultimate shrinkage [νu = 4.15 and (εsh)u = 1070], then the number of
cases in which the required percentage of reinforcing steel is below 1.0% is
significantly reduced. This is shown in Table 1.2 of Chapter 1 and is reproduced here
for convenience as Table 6.2. The shaded portions of the table indicate instances in
which the minimum reinforcement percentage could be reduced below 1.0%.
TABLE 6.2 Minimum % of Longitudinal Reinforcement (for νu = 4.15 and (εsh)u = 1070 x 10-6) L/D
f’c fy 0.0 0.25 0.5 1.0 1.5 2.0 2.5 3.0
3,000 60,000 2.55 1.28 0.53 0 0 0 0 0
4,000 60,000 3.75 2.21 1.27 0.19 0 0 0 0
6,000 60,000 6.04 4.04 2.78 1.28 0.41 0 0 0
8,000 60,000 8.19 5.81 4.29 2.44 1.34 0.60 0.07 0
10,000 60,000 10.22 7.53 5.78 3.63 2.32 1.44 0.79 0.30
8) Due to conclusions 6 and 7, it appears that a straight-forward reduction in
percentage of longitudinal reinforcing steel is not warranted. Rather, an equation (or
other method like a step-function) could be developed which incorporates the ultimate
creep coefficient, ultimate shrinkage, L/D ratio, and concrete strength.
9) As of July 24, 1996 (the last reading considered for this thesis), the
compression steel in all four eccentrically-loaded specimens had either reached or
very nearly reached strains corresponding to nominal yield of the reinforcement. At
the time this thesis was completed, strains in the compression steel were beyond actual
yield strain. The columns have not failed, but significant curvature deformations are
obvious.
6.6 Further Research
210
211
1) A function (or other method) for minimum reinforcing steel could be
developed. This equation would most likely be based on the expected ultimate creep
coefficient, ultimate shrinkage, L/D ratio, and concrete strength.
2) A method other than ACI 209 for predicting creep and shrinkage effects
should also be applied to the specimens to evaluate the accuracy of the method.
Ideally, the alternate method would include temperature effects directly and would
account for changes in humidity and temperature over time.
3) The analytical portion of this thesis has focused almost exclusively on the
concentrically-loaded specimens. The eccentrically-loaded specimens could be
investigated further through additional experimental work and/or analytical methods.
BIBLIOGRAPHY
1. Raymond E. Davis and Harmer E. Davis, “Flow of Concrete Under the Action of Sustained Loads”, Journal of the American Concrete Institute, Vol. 2 - No. 7, Proceedings Vol. 27, p. 837, March 1931. 2. F. E. Richart and G. C. Staehle, “Second Progress Report on Column Tests at the University of Illinois”, Journal of the ACI, Vol. 2 - No. 7, Proceedings Vol. 27, p. 761, March 1931. 3. W. A. Slater and Inge Lyse, “Second Progress Report on Column Tests Made at Lehigh University”, Journal of the ACI, Vol. 2 - No. 7, Proceedings Vol. 27, p. 791, March 1931. 4. F. E. Richart and G. C. Staehle, “Fourth Progress Report on Column Tests at the University of Illinois”, Journal of the ACI, Vol. 3 - No. 5, Proceedings Vol. 28, p. 279, January 1932. 5. Inge Lyse and C. L. Kreidler, “Fourth Progress Report on Column Tests Made at Lehigh University”, Journal of the ACI, Vol. 3 - No. 5, Proceedings Vol. 28, p. 317, January 1932. 6. Inge Lyse, “Fifth Progress Report on Column Tests Made at Lehigh University”, Journal of the ACI, Vol. 4 - No. 9, Proceedings Vol. 29, p. 433, June 1933. 7. F. E. Richart (Chairman), R. L. Bertin and Inge Lyse, “ ‘Reinforced Concrete Column Investigation’ - Tentative Final Report of Committee 105, and Minority Recommendations for Design Formula of Reinforced Concrete Columns”, Journal of the ACI, Vol. 4 - No. 6, Proceedings Vol. 29, February 1933. 8. R. T. Logeman, Walter H. Wheeler, L. J. Mensch and J. Di Stasio, “Discussion of Report of Committee 105: ‘Reinforced Concrete Column Investigation’- Tentative Final Report of Committee 105 and Minority Recomendations for Design Formulas of Reinforced Concrete Columns”, Journal of the ACI, Proceedings Vol. 30, p. 78, Sept. - Oct. 1933. 9. F. E. Richart (Chairman), “Discussion of Report of Committee 105: ‘Reinforced Concrete Column Investigation’ - Closure by Chairman, Committee 105”, Journal of the ACI, Proceedings Vol. 30, p. 153, Nov. - Dec. 1933.
212
213
10. ACI 318-35, Committee 318, “Building Code Requirements for Reinforced Concrete and Commentary”, (ACI 318-35), ACI, Detroit, Michigan, 1935. 11. ACI Committe 318, “Building Code Requirements for Reinforced Concrete and Commentary”, (ACI 318-95), ACI, Detroit, Michigan, 1995. 12. ACI 209-R86, “Prediction of Creep, Shrinkage, and Temperature Effects in Concrete Structures”, ACI, Detroit, Michigan, 1986. 13. S. Mindess and J. F. Young, “Concrete”, Prentice-Hall, Inc., Englewood Cliffs, New Jersey, 1981. 14. R. Green, “Behavior of Unrestrained Reinforced concrete columns Under Sustained Load”, Dissertation, The University of Texas at Austin, January 1966. 15. C. H. Lin and R. W. Furlong, “Longitudinal Steel Limits for Concrete Columns”, ACI Structural Journal, Vol. 92 - No. 3, p. 282, May - June 1995. 16. F. R. McMillan, “A Study of Column Test Data”, Journal of the American Concrete Institute, Proceedings Vol. 17, p. 150, 1921. 17. W. H. Glanville, “Shrinkage Stresses” and “The Creep or Flow of Concrete Under Load”, Technical Papers No. 11 and 12, Building Research Technical Papers, Dept. of Industrial Research, England.