Copyright 2011 Pearson Canada Inc. 6 - 1 Chapter 6 The Risk and Term Structure of Interest Rates.
49
Copyright 2011 Pearson Canada Inc. 6 - 1 Chapter 6 The Risk and Term Structure of Interest Rates
-
Upload
david-stevenson -
Category
Documents
-
view
220 -
download
0
Transcript of Copyright 2011 Pearson Canada Inc. 6 - 1 Chapter 6 The Risk and Term Structure of Interest Rates.
Copyright 2011 Pearson Canada Inc. 6 - 1
Chapter 6
The Risk and Term Structure of Interest Rates
Copyright 2011 Pearson Canada Inc. 6 - 2
Risk and Term Structure of Interest Rates
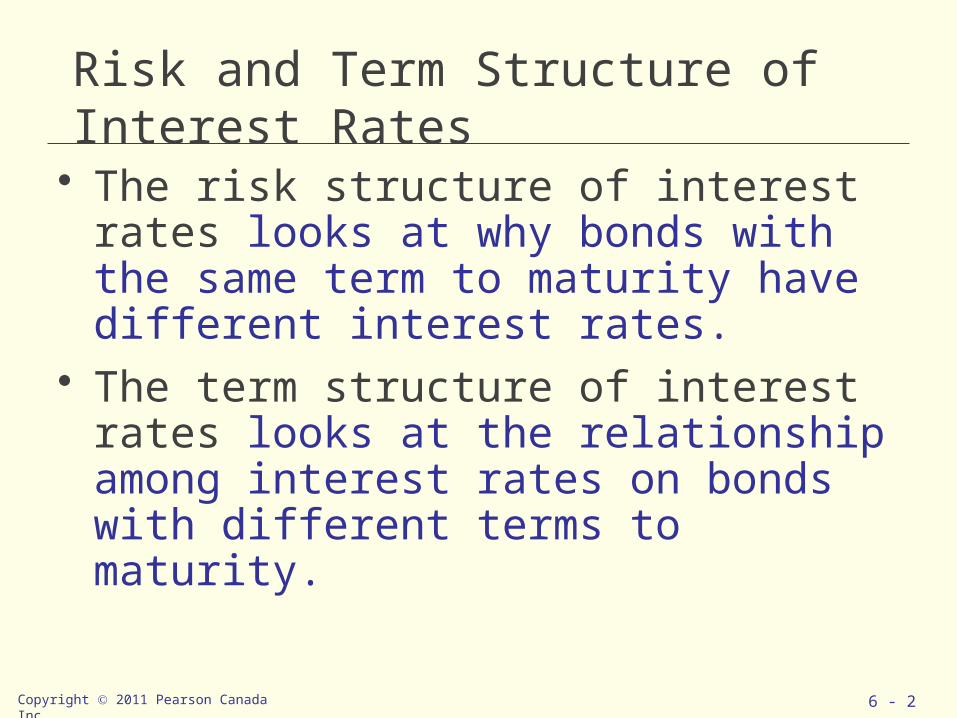
• The risk structure of interest rates looks at why bonds with the same term to maturity have different interest rates.
• The term structure of interest rates looks at the relationship among interest rates on bonds with different terms to maturity.
Copyright 2011 Pearson Canada Inc. 6 - 3
Default Risk
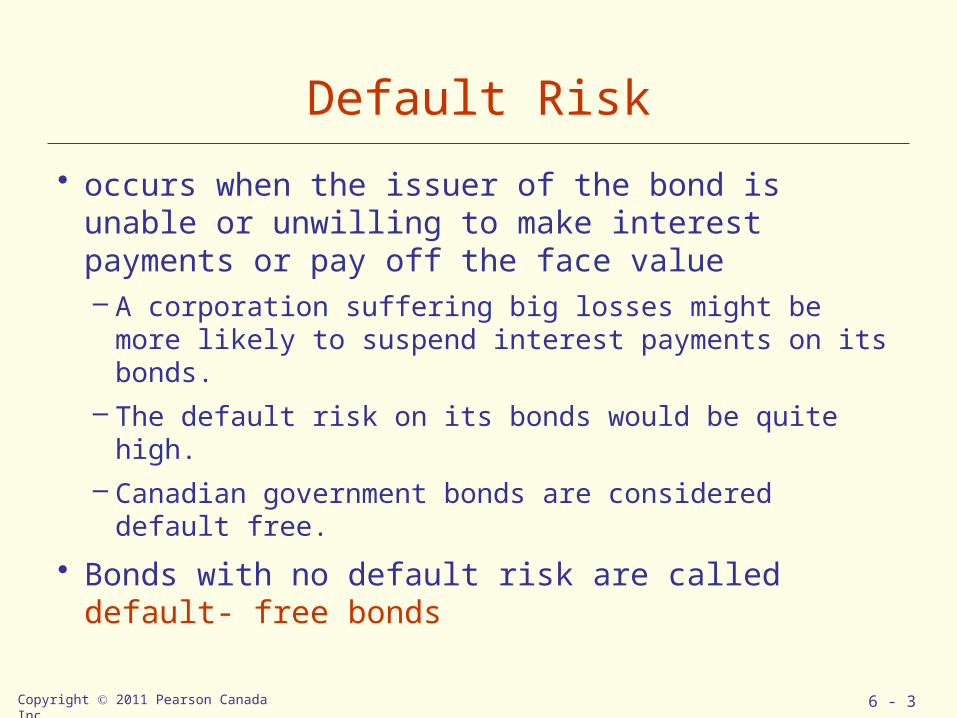
• occurs when the issuer of the bond is unable or unwilling to make interest payments or pay off the face value– A corporation suffering big losses might be more likely
to suspend interest payments on its bonds. – The default risk on its bonds would be quite high. – Canadian government bonds are considered default
free.
• Bonds with no default risk are called default- free bonds

Risk premium
• the spread between the interest rates on bonds with default risk and bonds without default risk
• indicates how much additional interest people must earn in order to be willing to hold that risky bond.
• A bond with default risk always has a positive risk premium
• the higher the default risk is, the larger the risk premium will be.
Copyright 2011 Pearson Canada Inc. 6 - 4

Risk premium
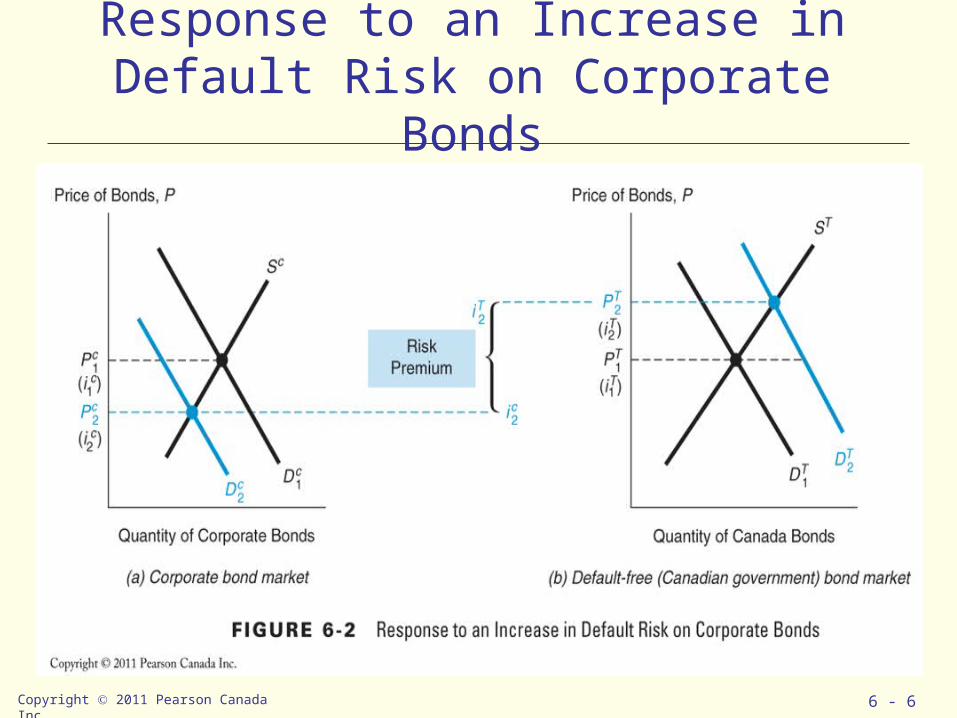
• Figure 6-2: assume that initially corporate bonds have the same default risk as Canada bonds.
• If the possibility of a default increases, the default risk on corporate bonds will increase, and the expected return on these bonds will decrease. – the corporate bond’s return will be more uncertain as
well. • Investors would want to hold ( demand) a smaller
amount of corporate bonds. • The demand curve for corporate bonds shifts to the
left. Copyright 2011 Pearson Canada Inc. 6 - 5
Copyright 2011 Pearson Canada Inc. 6 - 6
Response to an Increase in Default Risk on Corporate Bonds

Risk premium• At the same time, the expected return on default- free Canada
bonds increases relative to the expected return on corporate bonds while their relative riskiness declines.
• The Canada bonds thus become more desirable (demand rises).• The equilibrium price for corporate bonds falls. • the equilibrium interest rate on corporate bonds rises. (the bond
price is negatively related to the interest rate)• At the same time, the equilibrium price for the Canada bonds
rises, and the equilibrium interest rate falls. • The spread between the interest rates on corporate and default-
free bonds— the risk premium on corporate bonds— has risen from zero to
• A bond with default risk will always have a positive risk premium, and an increase in its default risk will raise the risk premium.
Copyright 2011 Pearson Canada Inc. 6 - 7
credit- rating agencies
• investment advisory firms that rate the quality of corporate and municipal bonds in terms of the probability of default.
• Bonds with relatively low risk of default are called investment- grade securities and have a rating of BBB and above.
• Bonds with ratings below BBB have higher default risk– speculative- grade or junk bonds. – Because these bonds always have higher interest rates than
investment- grade securities, they are also referred to as high- yield bonds.
• Investment- grade securities whose rating has fallen to junk levels are referred to as fallen angels.
Copyright 2011 Pearson Canada Inc. 6 - 8

Copyright 2011 Pearson Canada Inc. 6 - 9
Credit Ratings Agencies

the relationship between interest rates on corporate and Canada bonds.
• Corporate bonds always have higher interest rates than Canada bonds – they always have some risk of default, whereas Canada bonds do not. – their risk premium is greater, and the corporate bond rate therefore
always exceeds the Canada bond rate. • explain the huge jump in the risk premium on corporate bond
rates during the 1980– 1982, 1990– 1991, and 2000 recessions ( Figure 6- 3).– The recession periods saw a very high rate of business failures and
defaults. – led to a substantial increase in default risk for bonds issued by
vulnerable corporations, – the risk premium for corporate bonds reached high levels.
Copyright 2011 Pearson Canada Inc. 6 - 10

Copyright 2011 Pearson Canada Inc. 6 - 11
Corporate-Canada Bond Spread 1978 - 2005

Copyright 2011 Pearson Canada Inc. 6 - 12
Other Factors influencing the Risk Structure
• Liquidity – how quickly and cheaply a bond can be converted to cash– The more liquid an asset is, the more desirable it is – Canada bonds are the most liquid of all long- term
bonds – Corporate bonds are not as liquid
• fewer bonds for any one corporation are traded; • thus it can be costly to sell these bonds in an emergency
because it may be hard to find buyers quickly.
Liquidity
• the lower liquidity of corporate bonds relative to Canada bonds increases the spread between the interest rates on these two bonds.
• the differences between interest rates on corporate bonds and Canada bonds ( the risk premiums) reflect not only the corporate bond’s default risk but its liquidity too.
• This is why a risk premium is more accurately a “risk and liquidity premium”.
Copyright 2011 Pearson Canada Inc. 6 - 13

Income tax considerations
• in some countries certain government bonds are not taxable.– In Canada coupon payments on fixed-income securities are
taxed.• How does taxation affect the interest rate on bonds?• imagine that you are in the 40% income tax bracket, • If you own a $ 1000- face- value taxable bond that sells for
$ 1000 and has a coupon payment of $ 100, you get to keep only $ 60 of the payment after taxes.
• Although the bond has a 10% interest rate, you actually earn only 6% after taxes.
Copyright 2011 Pearson Canada Inc. 6 - 14

Income tax considerations
• Suppose, you put your savings into a $ 1000- face- value tax-exempt bond that sells for $ 1000 and pays only $ 80 in coupon payments.
• You pay no taxes on the $ 80 coupon payment, so you earn 8% after taxes.
• You are willing to hold the bond even though it has a lower interest rate than the taxable bond.
• Notice that the tax- exempt status of a bond becomes a significant advantage when income tax rates are very high.
Copyright 2011 Pearson Canada Inc. 6 - 15

Summary
• The risk structure of interest rates is explained by three factors:
1. default risk, 2. liquidity, 3. the income tax treatment of the bond’s interest payments. • As a bond’s default risk increases, the risk premium on
that bond rises. • The greater liquidity of Canada bonds also explains why
their interest rates are lower than interest rates on less liquid bonds.
• If a bond has a favourable tax treatment, as do municipal bonds in the United States, its interest rate will be lower.
Copyright 2011 Pearson Canada Inc. 6 - 16

Copyright 2011 Pearson Canada Inc. 6 - 17
Term Structure of Interest Rates
• Bonds with identical risk, liquidity, and tax characteristics may have different interest rates because the time remaining to maturity is different.
• Yield curve - a plot of the yield on bonds with differing terms to maturity but the same risk, liquidity and tax considerations– describes the term structure of interest rates for particular types of
bonds, such as government bonds.
1. Upward-sloping : long-term rates are above short-term rates
2. Flat: short- and long-term rates are the same
3. Inverted (downward sloping): long-term rates are below short-term rates
Copyright 2011 Pearson Canada Inc. 6 - 18
3 Empirical Facts To Be Explained by the Term Structure of Interest Rates
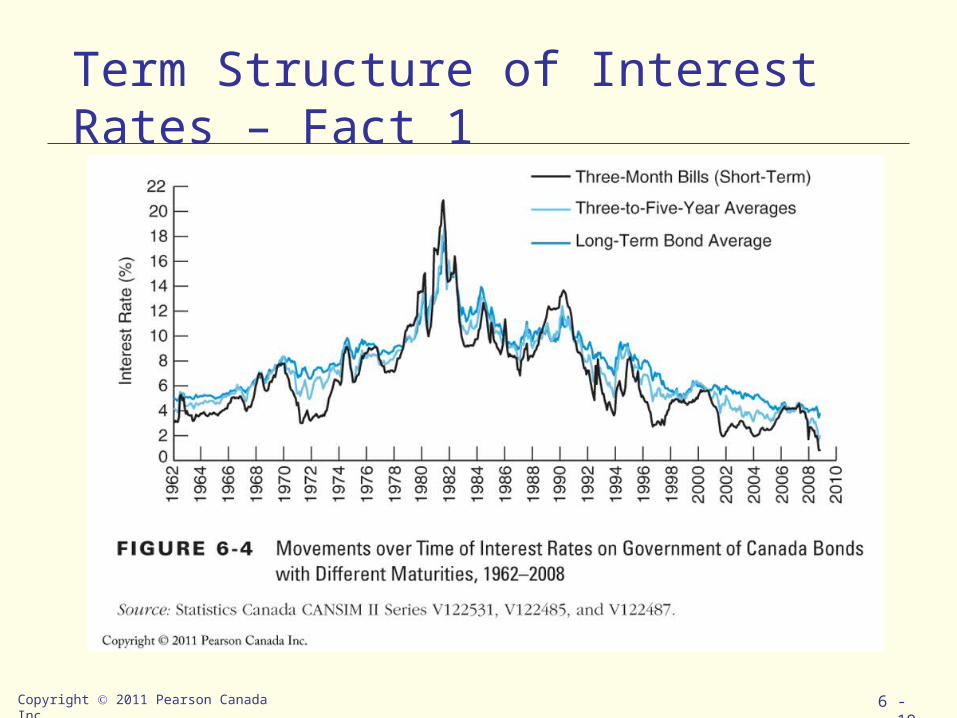
1. Interest rates on bonds of different maturities move together over time. See next figure…
2. When short-term interest rates are low, yield curves are more likely to have an upward slope; when short-term rates are high, yield curves are more likely to slope downward and be inverted.
3. Yield curves almost always slope upward.
Copyright 2011 Pearson Canada Inc. 6 - 19
Term Structure of Interest Rates – Fact 1

Copyright 2011 Pearson Canada Inc. 6 - 20
4 Theories to Explain the Three Facts
1. Expectations theory explains the first two facts but not the third.
2. Segmented markets theory explains fact three but not the first two.
3. Liquidity premium theory combines the two theories to explain all three facts.
4. Preferred Habitat Theory also explains all three facts.

Copyright 2011 Pearson Canada Inc. 6 - 21
Expectations Theory• The interest rate on a long-term bond will equal an
average of the short-term interest rates that people expect to occur over the life of the long-term bond.
• Example: Let the current rate on one-year bond be 6%. You expect the interest rate on a one-year bond to be 8% next year.– Then the expected return for buying two one-year bonds
averages (6% + 8%)/2 = 7%.
– The interest rate on a two-year bond must be 7% for you to be willing to purchase it.

Copyright 2011 Pearson Canada Inc. 6 - 22
Expectations Theory
• Perfect substitute bonds:– Buyers of bonds do not prefer bonds of one maturity over
another; they will not hold any quantity of a bond if its expected return is less than that of another bond with a different maturity.
– Then the expected return on these bonds must be equal.
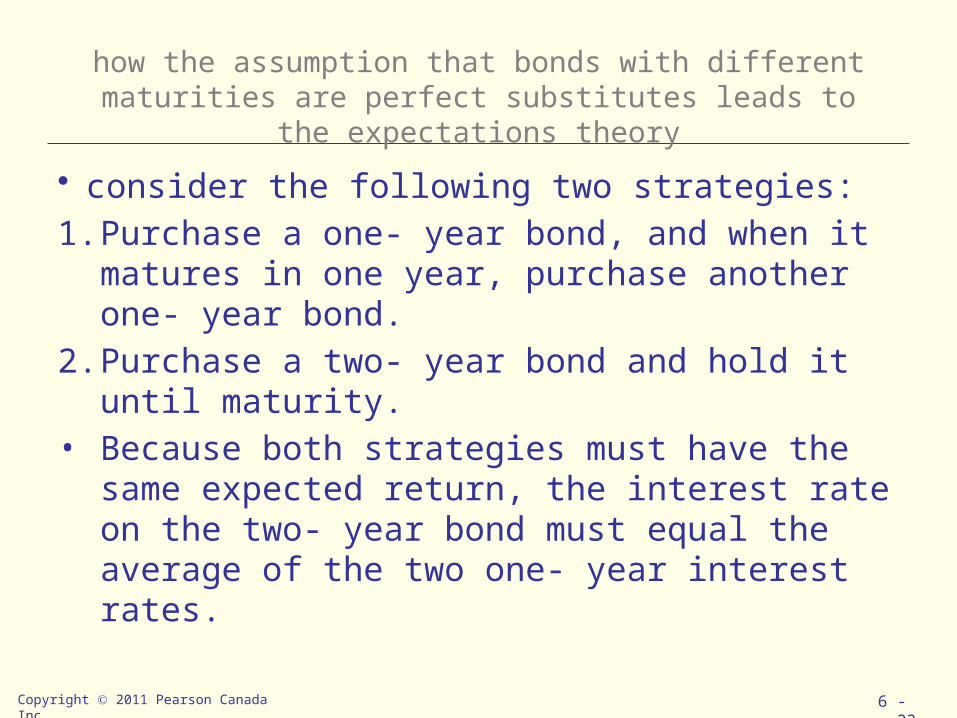
how the assumption that bonds with different maturities are perfect substitutes leads to the expectations theory
• consider the following two strategies: 1. Purchase a one- year bond, and when it matures
in one year, purchase another one- year bond. 2. Purchase a two- year bond and hold it until
maturity. • Because both strategies must have the same
expected return, the interest rate on the two- year bond must equal the average of the two one- year interest rates.
Copyright 2011 Pearson Canada Inc. 6 - 23

Copyright 2011 Pearson Canada Inc. 6 - 24
Expectations Theory—In General
For an investment of $1 consider the choice of holding (for two periods) a two- period bond or two one- period bonds.
it = today’s interest rate on a one-period bond
iet+1 = interest rate on a one-period bond
expected for next period
i2t = today’s interest rate on the two-period bond
Copyright 2011 Pearson Canada Inc. 6 - 25
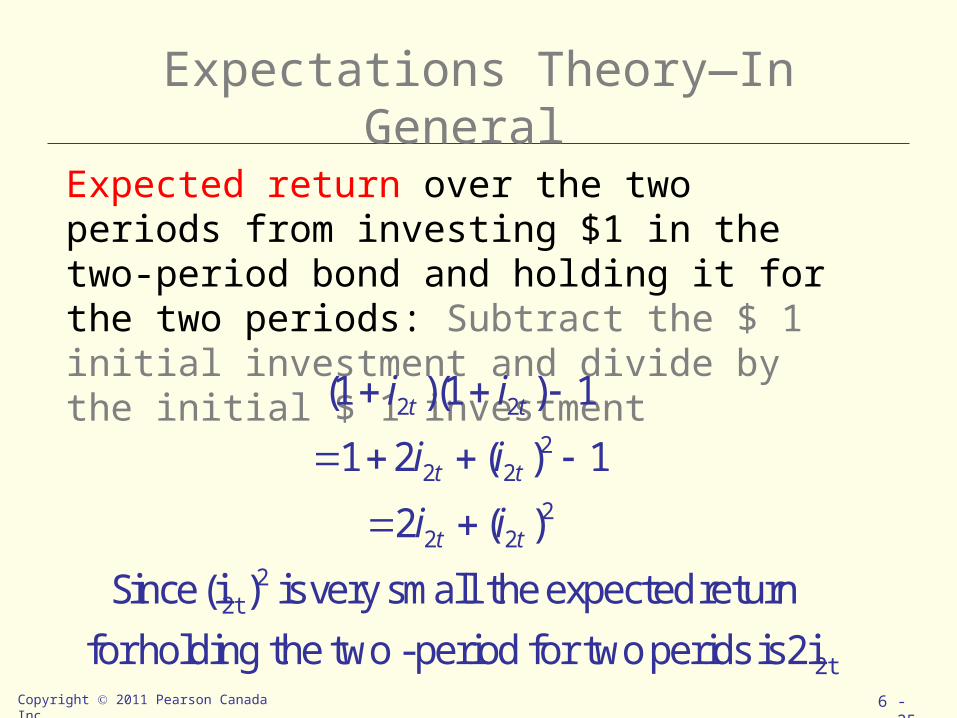
Expectations Theory—In General
Expected return over the two periods from investing $1 in the two-period bond and holding it for the two periods: Subtract the $ 1 initial investment and divide by the initial $ 1 investment
2t
22t
222
222
22
2i is perids two for period-two the holding for return expected the small very is )(i Since
)(2
1)(21
1)1)(1(
tt
tt
tt
ii
ii
ii

Copyright 2011 Pearson Canada Inc. 6 - 26
Expectations Theory—In General
et
ett
ett
ett
ett
ett
et
i
ii
iiii
iiii
i
1t
1
11
11
1t
i
get we gSimplifyinsmall extremely is )(
)(
1)(1
1)1)(i(1
investment $1 the with bought are bonds period-one twoIf
Copyright 2011 Pearson Canada Inc. 6 - 27
Expectations Theory—In General
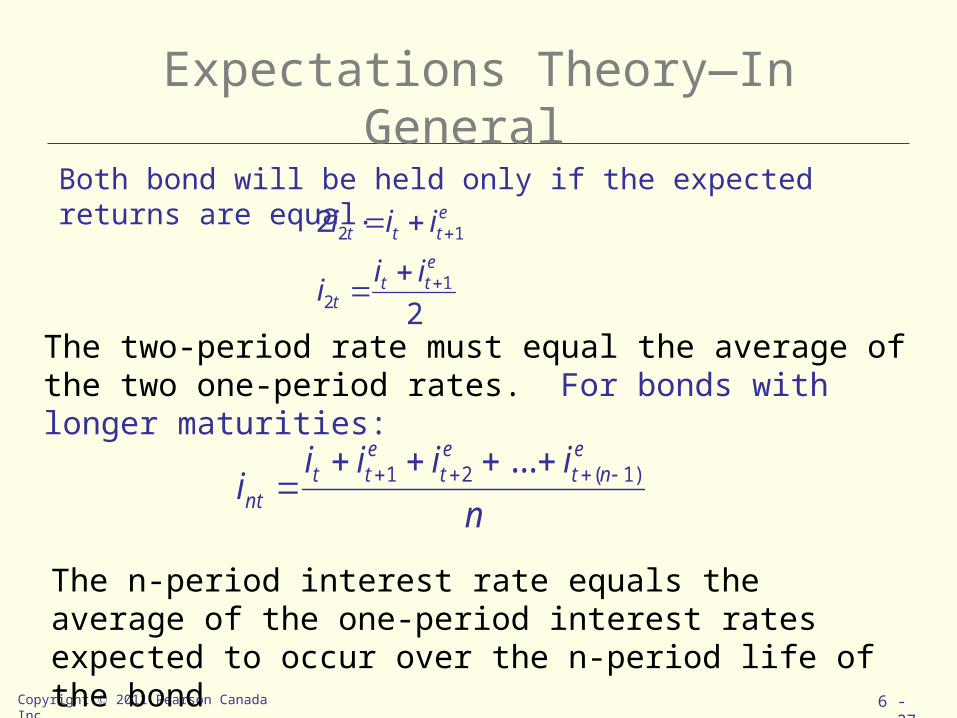
Both bond will be held only if the expected returns are equal.
2
2
12
12
ett
t
ettt
iii
iii
The two-period rate must equal the average of the two one-period rates. For bonds with longer maturities:
niiii
ie
ntet
ett
nt)1(21 ...
The n-period interest rate equals the average of the one-period interest rates expected to occur over the n-period life of the bond
Copyright 2011 Pearson Canada Inc. 6 - 28
Expectations Theory• Explains why the term structure of interest rates changes at
different times.– When the yield curve is upward- sloping, the expectations theory
suggests that short- term interest rates are expected to rise in the future. • The long- term rate is currently above the short- term rate, the average of future
short- term rates is expected to be higher than the current short- term rate, which can occur only if short- term interest rates are expected to rise.
– When the yield curve slopes downward, the average of future short- term interest rates is expected to be below the current short- term rate,
• short- term interest rates are expected to fall, on average, in the future.
– When the yield curve is flat, the expectations theory suggests that short- term interest rates are not expected to change, on average, in the future.
Expectations Theory
• Explains why interest rates on bonds with different maturities move together over time (fact 1).– Historically, if short- term interest rates increase today,
they will tend to be higher in the future.– Hence, a rise in short- term rates will raise people’s
expectations of future short- term rates. – Because long- term rates are the average of expected
future short- term rates, a rise in short- term rates will also raise long- term rates, causing short- and long- term rates to move together.
Copyright 2011 Pearson Canada Inc. 6 - 29
Expectations Theory
• Explains why yield curves tend to slope up when short-term rates are low and slope down when short-term rates are high (fact 2).– When short- term rates are low, people generally expect them to rise
to some normal level in the future, – the average of future expected short- term rates is high relative to the
current short- term rate. – Therefore, long-term interest rates will be substantially above current
short- term rates, and the yield curve would then have an upward slope.
– Conversely, if short- term rates are high, people usually expect them to come back down.
– Long- term rates would then drop below short- term rates and the yield curve would slope downward and become inverted.
Copyright 2011 Pearson Canada Inc. 6 - 30

Expectations Theory
• Major shortcoming:• Cannot explain why yield curves usually slope
upward (fact 3).– The typical upward slope of yield curves implies that
short- term interest rates are usually expected to rise in the future.
– In practice, short- term interest rates are just as likely to fall as they are to rise,
– So the expectations theory suggests that the typical yield curve should be flat rather than upward- sloping.
Copyright 2011 Pearson Canada Inc. 6 - 31

Copyright 2011 Pearson Canada Inc. 6 - 32
Segmented Markets Theory• sees markets for different maturity bonds as completely separate and
segmented.
• Bonds of different maturities are not substitutes.
• the expected return from holding a bond of one maturity has no effect on the demand for a bond of another maturity. – at the opposite extreme to the expectations theory
• investors have very strong preferences for bonds of one maturity but not for another, so they will be concerned with the expected returns only for bonds of the maturity they prefer. – because they have a particular holding period in mind, and if they match the
maturity of the bond to the desired holding period, they can obtain a certain return with no risk at all.
– remember: if the term to maturity equals the holding period, the return is known for certain because it equals the yield exactly, and there is no interest- rate risk.
Segmented Markets Theory
• the segmented markets theory can explain why yield curves usually tend to slope upward– investors have short desired holding periods and
generally prefer bonds with shorter maturities that have less interest-rate risk
– In the typical situation the demand for long- term bonds is relatively lower than that for short- term bonds,
– long- term bonds will have lower prices and higher interest rates,
– hence the yield curve will typically slope upward.
Copyright 2011 Pearson Canada Inc. 6 - 33

Segmented Markets Theory
• Major flaws:• cannot explain why interest rates on bonds of different
maturities tend to move together (fact 1)– Because it views the market for bonds of different maturities as
completely segmented, there is no reason for a rise in interest rates on a bond of one maturity to affect the interest rate on a bond of another maturity.
• cannot explain why yield curves tend to slope upward when short- term interest rates are low and to be inverted when short- term interest rates are high (fact 2)– Because it is not clear how demand and supply for short- versus
long- term bonds change with the level of short- term interest rates
Copyright 2011 Pearson Canada Inc. 6 - 34

Copyright 2011 Pearson Canada Inc. 6 - 35
Liquidity Premium Theory
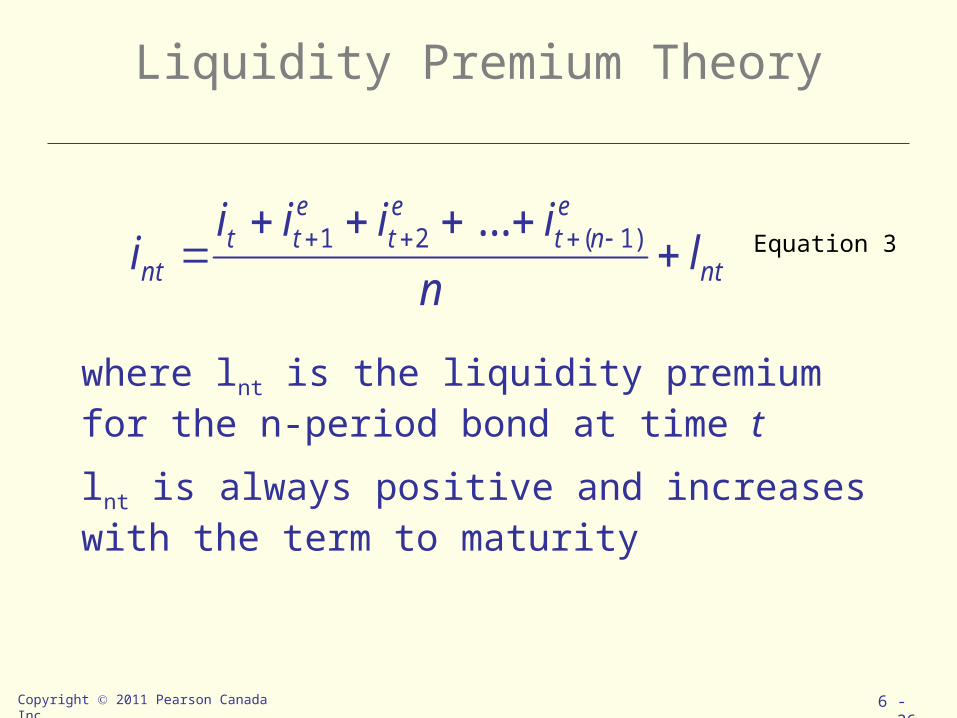
• The interest rate on a long-term bond will equal an average of short-term interest rates expected to occur over the life of the long-term bond plus a liquidity premium that responds to supply and demand conditions for that bond.
• Bonds of different maturities are substitutes but not perfect substitutes.– the expected return on one bond does influence the expected return
on a bond of a different maturity, but it allows investors to prefer one bond maturity over another.
• Investors tend to prefer shorter- term bonds because these bonds bear less interest- rate risk.
• For these reasons, investors must be offered a positive liquidity premium to induce them to hold longer- term bonds.
Copyright 2011 Pearson Canada Inc. 6 - 36
Liquidity Premium Theory
nt
ent
et
ett
nt ln
iiiii
)1(21 ...
where lnt is the liquidity premium for the n-period bond at time t
lnt is always positive and increases with the term to maturity
Equation 3

Copyright 2011 Pearson Canada Inc. 6 - 37
Preferred Habitat Theory
• Investors have a preference for bonds of one maturity over another, a particular bond maturity ( preferred habitat) in which they prefer to invest.
• they will be willing to buy bonds that do not have the preferred maturity ( habitat) only if they earn a somewhat higher expected return.
• Because investors are likely to prefer the habitat of short- term bonds to that of longer- term bonds, they are willing to hold long- term bonds only if they have higher expected returns.
Liquidity Premium & Preferred Habitat Theories
• Next figure• for simplicity assume that the expectations
theory yield curve is flat• the yield curve implied by the liquidity premium
and preferred habitat theories is always above the yield curve implied by the expectations theory and has a steeper slope – because the liquidity premium is always positive and
typically grows as the term to maturity increases
Copyright 2011 Pearson Canada Inc. 6 - 38

Copyright 2011 Pearson Canada Inc. 6 - 39
The Relationship Between Theories
Copyright 2011 Pearson Canada Inc. 6 - 40
• Fact 1: Interest rates on different maturity bonds move together over time; – a rise in short- term interest rates indicates that
short- term interest rates will, on average, be higher in the future,
– the first term in Equation 3 then implies that long- term interest rates will rise along with them.
Liquidity Premium & Preferred Habitat Theories

Liquidity Premium & Preferred Habitat Theories
• Fact 2: Yield curves tend to slope upward when short-term rates are low and to be inverted when short-term rates are high; – Because investors generally expect short- term interest rates to rise to some
normal level when they are low, the average of future expected short- term rates will be high relative to the current short- term rate.
– With the additional boost of a positive liquidity premium, long- term interest rates will be substantially above current short- term rates, as a result the yield curve would have a steep upward slope
– Conversely, if short- term rates are high, people usually expect them to come back down.
– Long- term rates would then drop below short- term rates because the average of expected future short- term rates would be so far below current short- term rates
– despite positive liquidity premiums, the yield curve would slope downward.
Copyright 2011 Pearson Canada Inc. 6 - 41

Liquidity Premium & Preferred Habitat Theories
• Fact 3: Yield curves typically slope upward; – the liquidity premium rises with a bond’s maturity
because of investors’ preferences for short- term bonds.
– Even if short- term interest rates are expected to stay the same on average in the future, long- term interest rates will be above short- term interest rates, and yield curves will typically slope upward.
Copyright 2011 Pearson Canada Inc. 6 - 42

• How can the liquidity premium and preferred habitat theories explain the occasional appearance of inverted yield curves if the liquidity premium is positive? – at times short- term interest rates are expected to fall so
much in the future that the average of the expected short- term rates is well below the current short- term rate.
– Even when the positive liquidity premium is added to this average, the resulting long- term rate will still be below the current short- term interest rate.
Copyright 2011 Pearson Canada Inc. 6 - 43
Liquidity Premium & Preferred Habitat Theories

• what is the market predicting about future short- term interest rates just from the slope of the yield curve?– A steeply rising yield curve, as in panel (a) of next Figure,
indicates that short- term interest rates are expected to rise in the future.
– A moderately steep yield curve, panel ( b), indicates that short- term interest rates are not expected to rise or fall much in the future.
– A flat yield curve, panel ( c), indicates that short- term rates are expected to fall moderately in the future.
– an inverted yield curve, panel ( d), indicates that short- term interest rates are expected to fall sharply in the future.
Copyright 2011 Pearson Canada Inc. 6 - 44
Predictive Power of the Yield Curve

Copyright 2011 Pearson Canada Inc. 6 - 45
Predictive Power of the Yield Curve
Predictive Power of the Yield Curve
• When can the slope of the yield curve be used to forecast future short- term interest rates?– The yield curve has this practical use only if it is deter-
mined by the expectations theory of the term structure that views long- term interest rates as equaling the average of future short- term interest rates.
– If, however, there are liquidity ( term) premiums in the term structure, then it will be difficult to extract a reliable forecast of future short- term interest rates without good measures of these premiums.
Copyright 2011 Pearson Canada Inc. 6 - 46
Predictive Power of the Yield Curve
• the spread between long- and short- term interest rates does not always help predict future short- term interest rates,– a finding that may stem from substantial
fluctuations in the liquidity ( term) premium for long- term bonds.
Copyright 2011 Pearson Canada Inc. 6 - 47
Copyright 2011 Pearson Canada Inc. 6 - 48
Interpreting Yield Curves 1996 -2006
• Inverted yield curves Jan 1990: – short-term rates were expected to decrease in the future.– By March 1991, 3 month Treasury bills rates had fallen
from 12% to less than 9%.• Upward sloping yield curve in Jan 2009:
– indicated short term rates would increase.• The moderately upward- sloping yield curve in
September 1986 indicates that short- term interest rates were expected neither to rise nor to fall in the near future.

Copyright 2011 Pearson Canada Inc. 6 - 49
Interpreting Yield Curves