
Coordinated Highways Action Response Team -Performance and Benefits- Dr. Gang-Len Chang Department...
46
C oordinated H ighways A ction R esponse T eam -Performance and Benefits- Dr. Gang-Len Chang Department of Civil Engineering University of Maryland February, 2012
-
Upload
delphia-strickland -
Category
Documents
-
view
215 -
download
2
Transcript of Coordinated Highways Action Response Team -Performance and Benefits- Dr. Gang-Len Chang Department...

Coordinated Highways Action Response Team-Performance and Benefits-
Dr. Gang-Len ChangDepartment of Civil Engineering
University of Maryland
February, 2012

CHART Evaluation History Data points
Incidents Total Records
2003 10,068 38,523
2004 19,127 40,538
2005 20,515 41,196
2006 21,055 44,043
2007 21,236 42,321
2008 21,586 56,200
2009 23,585 55,563

Performance Evaluation & Benefit Estimation Part A: Performance
Detection/Response Clearance Incident Duration

Time of System Operations
Arrival Partialclearance
Completeclearance
T0 T1 T2 T3 T4
T1 – T0 = Detection time (not available)T3 – T1 = Response timeT4 – T3 = Clearance timeT4 – T1 = Incident duration
Arrival Partialclearance
Completeclearance
T0 T1 T2 T3 T4
Arrival Partialclearance
Completeclearance
T0 T1 T2 T3 T4
T1 – T0 = Detection time (not available)T3 – T1 = Response timeT4 – T3 = Clearance timeT4 – T1 = Incident duration

Data Recorded by TMC Operations Detection sources Location Incident nature Lane-blockage

No Info., 0.0% [0.2]
Other, 2% [1.8]CCTV, 1% [1.2]
System Alarm, 0.0% [0.0]
SHA, 3% [2.8]
MDTA, 36% [34.5]
State Police, 17% [14.7]Local Police, 4% [4.3]
CHART, 36% [39]
Citizen, 1% [0.7]
MCTMC, 1% [0.3]
Media, 0% [0.65]
Distribution of Incident/Disabled Vehicles by Detection Sources in Year 2009 [2008]

Data Recorded by TMC Operations Detection sources Location Incident nature Lane-blockage

Distribution of Incidents/Disabled Vehicles by Road in Year 2009
1 & 4 4 & 5 5 & 6 6 & 8 8 & 9 9 & 10
10 & 11
11 & 13
13 & 15
15 & 16
16 & 18
18 & 22
0
20
40
60
80
100
120
140
160
180
7466
61
100
59
91
43
107
20
4032
57
120 127
86
121
79
130
41
161
5950
6157
Incidents Disabled Vehicles

Data Recorded by TMC Operations Detection sources Location Incident nature Lane-blockage

Distribution of Incidents by Nature in Year 2009
Vehicle Fire
Debris in
Roadway
Colli-sion,
Personal Injury
Colli-sion,
Property Damage
Colli-sion, Fa-
tality
Disabled on Road
Emergency Roadwork
Police Activity
Off Road
Activity
Other No Info.0
1000
2000
3000
4000
5000
6000
7000
8000
423
4613
3902
6791
210
4610
470205 88 0
1717

Data Recorded by TMC Operations Detection sources Location Incident nature Lane-blockage

Distribution of Lane Blockages by Major Freeways in Year 2009
I-495/95 I-95 I-2700
100
200
300
400
500
600
700
800
900
1,000
558
875
200229
651
41
831
728
170
330261
73
259233
89
Shoulder 1 Lane 2 Lanes**3 Lanes** >=4 Lanes**

Performance Evaluation & Benefit Estimation Part A: Performance
Detection/Response Clearance Incident Duration

Distribution of Response Time
TOC3 TOC4 TOC5 TOC6 TOC7 SOC AOC Other Av-erage
0
2
4
6
8
10
12
14
16
11.41
14.41
3.50
7.87
12.83
6.04 5.814.60
9.9111.44
14.56
5.724.25
11.99
9.11
5.19
7.36 9.99
2009 2008
Response Time (min)

Performance Evaluation & Benefit Estimation Part A: Performance
Detection/Response Clearance Incident Duration

Comparison of Clearance time in 2008-2009
Clearance TimeYear 2009 (2008)
(minutes)
With CHART Without CHART
Incident Disabled Vehicle
Total Incident Disabled Vehicle
Total
All Cases with Clearance Time<=2h
19.51(19.32)
6.99(7.05)
12.01(12.01)
24.68(21.53)
1.31(2.26)
8.70(8.77)
Cases with Clearance Time>=30s and <=2h
22.07(21.98)
10.17(10.24)
15.69(15.25)
28.24(23.87)
5.19(9.8)
19.84(19.27)
Cases with Clearance Time >=60s and <=2h
23.28(23.22)
11.42(11.33)
17.12(16.56)
29.33(24.89)
8.14(11.73)
23.73(21.01)
Cases with Clearance Time >=90s and <=2h
24.03(24.08)
12.34(12.15)
18.12(17.51)
29.92(25.48)
10.65(12.61)
25.83(21.83)

Performance Evaluation & Benefit Estimation Part A: Performance
Detection/Response Clearance Incident Duration

Distribution of Incident Durations
2006 2007 2008 20090
5
10
15
20
25
30
35
40
45
2325 25
28
3235 35
41
w/ CHART w/o CHART
Dur
atio
n( m
inut
es)

Performance Evaluation & Benefit Estimation (cont’d) Part B: Benefits Evaluation Methodology
Direct Benefits in year 2009 (2008)Reduction due to CHART Amount Unit rate Dollars
(million)
Delay (M veh-hrs)Truck 1.68
(2.09)
$20.68/hr truck drivers' cost34.80
(43.12)
$45.40/hr (cargo's cost) 76.41(94.66)
Car 30.75(29.57) $27.37/hr (car driver's cost) 841.56
(786.06)
Fuel Consumption (M gallons) 6.23(6.392)
$2.32/gal (gasoline)$2.50/gal (diesel)
20.98(20.98)
Emission(tons)
HC 424.00(413.87) $6,700/ton
37.06(36.24)
CO 4,762.25(4,648.42) $6,360/ton
NO 203.07(198.21) $12,875/ton
CO257,098.97
(58,939.31) $23/metric ton3
Total (M dollars) 1,006.50 (981.06)

Benefit Estimation
Reduction in Incident Duration
Delay reduction
Fuel consumption
Emissions
Secondary incidents
Risks at primary incident sites
Frequency
Impacts

Performance Evaluation& Benefit Estimation (cont’d) Delay Fuel consumption Emission Secondary incidents Risks at primary incident sites Driver assistance

The Methodology for Delay Reduction
Duration 2006 2007 2008 2009
With SHA Patrol ( minute) 23 25 25 28
Without SHA Patrol ( minute) 32 35 35 41
Duration 2006 2007 2008 2009
With SHA Patrol ( minute) 23 23 23 23
Without SHA Patrol ( minute) 29 30 30 25
Comparison of incident duration from 2006-2009
One-lane average

The Methodology for Delay Reduction(cont’d) Step 1: distribution of incidents by location
1 & 4 4 & 5 5 & 6 6 & 8 8 & 9 9 & 10
10 & 11
11 & 13
13 & 15
15 & 16
16 & 18
18 & 22
0
20
40
60
80
100
120
140
160
180
7466 61
100
59
91
43
107
20
4032
57
120 127
86
121
79
130
41
161
59 50 61 57
Incidents Disabled Vehicles Exits
Fre
quen
cy
I-270Year 2009

The Methodology for Delay Reduction (cont’d) Step 2: distribution of incidents by lane blockage
I-495/I-95 I-95 I-270 I-6950
10 20 30 40 50 60 70 80 90
100 18
.2
27.9
17.7
21.3
22.6
21.4
27.4
42.5
24.5
38.9
25.9
37.3
47.1
58.8
44.5
44.1
61.3
83.9
62.3
91.6
Shoulder 1 Lane 2 Lanes* 3 Lanes* >=4 Lanes*
Min

The Methodology for Delay Reduction Step 3: select sample incidents for each category
I-495/95 I-95 I-2700
2,000
4,000
6,000
8,000
10,000
12,000
14,000
4,556
12,922
1,890
229 65141
831 728170330 261 73259 233 89
Year 2009
Shoulder 1 Lane 2 Lanes**3 Lanes** >=4 Lanes**
Fre
quen
cy

The Methodology for Delay Reduction Step 3: for each sample incident, simulate the
entire highway segment Total delay without the sample incident Total delay with the sample incident

The Methodology for Delay Reduction Step 4: Compute the excessive delay due to the
sample incidents
Delay due to the sample incident (I-Delay)
= (T-Delay)w/ – (T-Delay)w/o

The Methodology of Delay Reduction Step 5: with sufficient samples, one can establish
the Delay function
(I-Delay) = f(Incident duration, traffic volume, No. of lane blockage, total No. of lanes, etc.)

The Methodology of Delay Reduction Step 6: Compute the delay reduction due to
CHART operations
Current total I-delay
Total I-delay without CHART
25% reduction in theaverage incident duration
X-million hours 1/3 X-millionhours

Benefit Estimation (cont’d) Delay Reduction
Total by CHART
2006 2007 2008 2009
Delay Deduction
( M veh-hour)35.09 33.32 29.57 30.75

Performance Evaluation & Benefit Estimation (cont’d) Delay Fuel consumption Emission Secondary incidents Risks at primary incident sites Driver assistance

Benefit Estimation (cont’d) Reduction in fuel consumption
Method 1: from the results of simulation Method 2: conversion from the total delay reduction

Method 1 From the results of simulation
Method 2 Conversion from the total delay reduction
69.19.0
27.277.10
) (*) .
(*
) (*
DurationIncidentLanesofNoTotal
BlockedeNo. of Lan
VolumeTrafficeFuel
BE: 2. Fuel Consumption

Performance Evaluation& Benefit Estimation (cont’d) Delay Fuel consumption Emission Secondary incidents Risks at primary incident sites Driver assistance

Benefit Estimation (cont’d)
Total Delay Reduction
HC: 13.073 grams per hour of delay
CO: 146.831 grams per hour of delay
NO: 6.261 grams per hour of delay
Note: The parameters were provided by MDOT in Year 2000

Method 1 From the results of simulation
Method 2 Conversion from the total delay reduction
69.19.0
27.277.10
) (*) .
(*
) (*
DurationIncidentLanesofNoTotal
BlockedeNo. of Lan
VolumeTrafficeFuel
BE: 2. Fuel Consumption
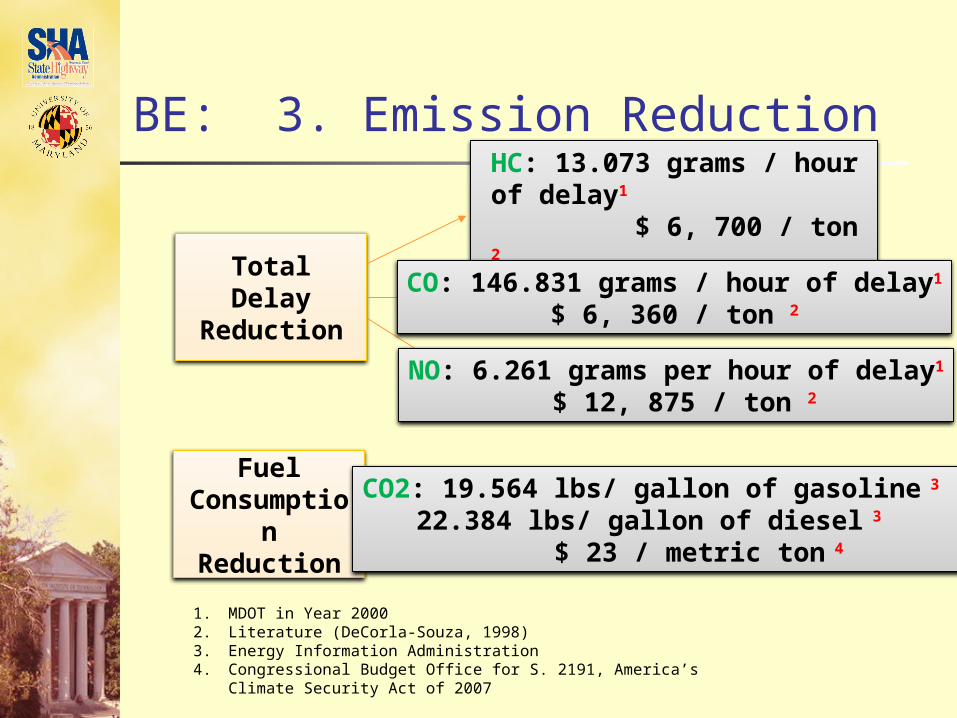
BE: 3. Emission Reduction
1. MDOT in Year 20002. Literature (DeCorla-Souza, 1998)3. Energy Information Administration4. Congressional Budget Office for S. 2191, America’s Climate Security Act of 2007
Total Delay Reduction
HC: 13.073 grams / hour of delay1
$ 6, 700 / ton 2
CO: 146.831 grams / hour of delay1
$ 6, 360 / ton 2
NO: 6.261 grams per hour of delay1
$ 12, 875 / ton 2
Fuel Consumption
Reduction
CO2: 19.564 lbs/ gallon of gasoline 3
22.384 lbs/ gallon of diesel 3
$ 23 / metric ton 4

Performance Evaluation& Benefit Estimation (cont’d) Delay Fuel consumption Emission Secondary incidents Risks at primary incident sites Driver assistance

Benefit Estimation (cont’d) Secondary incidents (2008)
0.5 Hr 1 Hr 1.5 Hr 2 Hr0
100
200
300
400
500
600
700
157
237
327382
175
277
382447
196
323
444523
228
378
512605
0.5 Mile 1 Mile 1.5 Miles 2 Miles
Duration After the Primary Incident (Hour)
Cum
ulat
ive
Num
ber
of S
econ
dary
Inc
iden
ts

Computation of Reduction on Secondary Incidents -Year 2008
Reported number of secondary incidents: 605 The estimated number of secondary incidents
without CHART/MSHA response units (that has resulted in a 27.81% reduction on the average incident duration):605/(1-0.2781) = 838
The number of potentially reduced secondary incidents due to the operations of CHART:838 – 605 = 233

Performance Evaluation& Benefit Estimation (cont’d) Delay Fuel consumption Emission Secondary incidents Risks at primary incident sites Driver assistance

Benefit Estimation (cont’d)
Δ BlockageDurationw/ & w/oCHART
No. of laneChanges within
peak period
Number of
lane changes at
Incident scene
Daily
Peak-volumes
Length
of a segment
No. ofincidents
duringpeak period
Lane changes to
incident Ratio
No.& Typeof blockages
per peak-hoursPer day
Number of potential incidentsreduced by CHART operations
due to effective removal ofvehicles
Risks at primary incident sites

Reduction of Potential Incidentsdue to CHART Operations
Road NameI-
495/95I-95 I-270 I-695 I-70 I-83
MD-295
US-50 Total
Mileage 41 63 32 44 13 34 30 42
No. Potential Incident
Reduction
2009 127 211 40 76 43 21 13 40 571
2008 129 181 27 98 33 25 14 43 550
2007 100 140 21 76 25 19 11 33 425
2006 158 142 21 118 29 35 10 31 544
2005 139 97 15 116 22 26 5 32 452

Performance Evaluation & Benefit Estimation (cont’d) Delay Fuel consumption Emission Secondary incidents Risks at primary incident sites Driver assistance

Assistance to Drivers
Aba
ndon
ed V
ehic
le
Tir
e C
hang
e
Hot
Sho
t
Wat
er
Gas
Dir
ectio
ns
Ow
n D
ispo
sitio
n
Cal
l for
Ser
vice
Rel
ay O
pera
tor
Gon
e on
Arr
ival
Oth
er
0
2000
4000
6000
8000
10000
12000
1773
7729
803 671
2606
530
8486
1299
116
1011
10199
1935
8398
814 748
3310
575
9364
1355
143 924
9952
2009 2008
Frequency