Conversion Oxides as Candidate Anode Materials for Li-Ion ... · The Role of Electrode Formulation...
78
Conversion Oxides as Candidate Anode Materials for Li-Ion Batteries. The Role of Electrode Formulation on Electrochemical Performances. Gilberto Carbonari Dissertação para obtenção do Grau de Mestre em Química Orientadores Orientadores: Prof. Maria de Fàtima Grilo da Costa Montemor Dr. Francesco Nobili Júri Presidente: Prof. Maria Matilde Soares Duarte Marques Prof. Maria de Fàtima Grilo da Costa Montemor Vogais: Dr. Sònia Cristina da Conceição de Matos Eugènio Dr. Corrado Bacciocchi Janeiro de 2015
Transcript of Conversion Oxides as Candidate Anode Materials for Li-Ion ... · The Role of Electrode Formulation...

Conversion Oxides as Candidate Anode Materials for
Li-Ion Batteries. The Role of Electrode Formulation on
Electrochemical Performances.
Gilberto Carbonari
Dissertação para obtenção do Grau de Mestre em
Química
Orientadores
Orientadores: Prof. Maria de Fàtima Grilo da Costa Montemor
Dr. Francesco Nobili
Júri
Presidente: Prof. Maria Matilde Soares Duarte Marques
Prof. Maria de Fàtima Grilo da Costa Montemor
Vogais: Dr. Sònia Cristina da Conceição de Matos Eugènio
Dr. Corrado Bacciocchi
Janeiro de 2015

ABSTRACT
The limited capacity of insertion materials due to their structure, as well as the decohesion
phenomena of the Li-alloying materials due to the huge volume changes, have attracted the
attention toward a new type of electrochemical reactivity, which emerged in these last few
years: the so-called conversion mechanism. Conversion metal oxides are good candidates as
anode materials for Li-Ion batteries, because of their reversible lithium uptake/release behavior,
low cost, and low environmental impact features. Among these transition metal oxides, MnO
was chosen as potential candidate. Manganese (II) Oxide particles (theoretical specific capacity
of 755 mAhg-1) were characterized and analysed through several techniques. The influence of
binder, pressure and working potential range were evaluated and optimized, in order to improve
electrochemical performances.
Keywords: Conversion material, Electrode Formulation, Li-Ion battery, Manganese (II) oxide,
Polyacrylic Acid

RESUMO
A capacidade limitada dos materiais de inserção, devido à sua estrutura, bem como os
fenómenos de descoesão que ocorrem em ligas contendo lítio devido às grandes variações de
volume, têm despertado a atenção para um novo tipo de reatividade, cujo reconhecimento
emergiu nos últimos anos: o designado mecanismo de conversão. Neste contexto, há óxidos
metálicos que são bons candidatos à utilização como materiais anódicos para baterias de lítio
devido ao seu comportamento reversível em termos de consumo/libertação de lítio, baixo custo
e baixo impacto ambiental. De entre estes óxidos de metais de transição, escolheu-se o MnO
como potencial candidato. Partículas de óxido de manganês(II) (capacidade específica teórica
de 755 mAhg-1) foram analisadas e caracterizadas usando várias técnicas. A influência do
agente de ligação, da pressão e da gama de potenciais de trabalho foi avaliada e otimizada, de
modo a melhorar o desempenho eletroquímico.
Palavras-chave: Ácido poliacrílico, Bateria de lítio, Formulação do Elétrodo, Material de
conversão, Óxido de manganês(II)

Index
1. Introduction ......................................................................................................................... 1
1.1. What is a Battery? ....................................................................................................... 2
2. Lithium Ion Batteries (LIBs) ............................................................................................... 6
2.1. Cathode Materials ....................................................................................................... 8
2.1.1. Layered oxides – LiCoO2 .................................................................................... 8
2.1.2. Spinel Phase – LiMn2O4 ...................................................................................... 9
2.1.3. Olivine Phase – LiFePO4 ................................................................................... 10
2.2. Electrolyte and Additives ......................................................................................... 11
2.3. Binders ....................................................................................................................... 12
2.4. Separator Materials ................................................................................................... 15
2.5. Anode Materials ......................................................................................................... 16
2.5.1. Carbonaceous Materials ................................................................................... 16
2.5.2. Intercalation/Deintercalation processes in Carbonaceous Materials .......... 20
2.5.3. Solid Electrolyte Interphase (SEI) Formation ................................................. 21
2.5.4. Alloy-based Materials ....................................................................................... 22
2.5.5. Conversion Materials ........................................................................................ 23
3. Experimental Techniques ................................................................................................. 26
3.1. X-Ray Diffraction (XRD) ............................................................................................ 26
3.2. Thermogravimetric Analysis (TGA) ......................................................................... 27
3.3. Electrochemical Techniques .................................................................................... 29
3.3.1. Cyclic Voltammetry (CV) ................................................................................... 29
3.3.2. Galvanostatic Cycling ....................................................................................... 30
3.3.3. Electrochemical Impedance Spectroscopy (EIS) ........................................... 32
4. Synthesis, Characterization and Optimization of Manganese (II) Oxide-based anodes
for Li-Ion Batteries. ................................................................................................................... 36
4.1. Introduction ............................................................................................................... 36
4.2. Experimental .............................................................................................................. 37
4.2.1. Electrode processing procedure ......................................................................... 37
4.2.2. Surface Gold Coating process ......................................................................... 39
4.2.3. Synthesis of Carbon coated MnO (MnO/C) ..................................................... 39
4.3. Discussion ................................................................................................................. 41
4.3.1. 80:10:10 Electrode formulation ........................................................................ 42
4.3.2. Au-coating .......................................................................................................... 49
4.3.3. Carbon coating .................................................................................................. 49
4.3.4. 70:20:10 Electrode formulation ........................................................................ 55
4.4. Conclusions ............................................................................................................... 66
4.5. Future work ................................................................................................................ 67
5. References ......................................................................................................................... 69

Index of Figure
Figure 1 Different types of batteries. ............................................................................................. 1
Figure 2 Ragone Plot for various electrochemical energy conversion system. ............................ 2
Figure 3 Energy storage capability of some primary batteries. ..................................................... 3
Figure 4 energy storage capability of some Secondary batteries. ................................................ 4
Figure 5 Li-Ion battery example. ................................................................................................... 7
Figure 6 LiCoO2 structure. ............................................................................................................. 9
Figure 7 LiMn2O4 structure. ........................................................................................................... 9
Figure 8 LiFePO4 structure. ......................................................................................................... 10
Figure 9 Common solvents. ........................................................................................................ 11
Figure 10 Vynilene Carbonate structure. .................................................................................... 11
Figure 11 Polyvinylidene Fluoride (at left) and N-methylpyrrolidone (at right) structures. .......... 12
Figure 12 Na-CMC structure. ...................................................................................................... 13
Figure 13 Polyacrylic acid structure. ........................................................................................... 13
Figure 14 PVdF (a) and PAA (b) behavior during intercalation/de-intercalation processes. ...... 14
Figure 15 Try-layered separator, used as a fuse. ....................................................................... 15
Figure 16 Crystal structure of hexagonal graphite (Bernal or 2H Graphite). .............................. 17
Figure 17 Crystal structure of rhombohedral graphite (3R Graphite). ........................................ 17
Figure 18 Franklin model for Hard (at left) and Soft (at right) carbons. ...................................... 18
Figure 19 Li2C6 Structure. ........................................................................................................... 19
Figure 20 Graphene Oxide (GO) structure. ................................................................................ 19
Figure 21 LiC6 structure, i.e. completely discharged battery. ..................................................... 20
Figure 22 Schematic galvanostatic curve (at left) and schematic voltammetric curve (at right). 21
Figure 23 SEI microphases structure. ......................................................................................... 22
Figure 24 Silicon nanowire anode structure before and after cycling. ........................................ 23
Figure 25 Voltage vs. Composition profile of the first cycles in a conversion electrode 25. ........ 24
Figure 26 Specific capacities of some TM conversion compounds 25. ....................................... 25
Figure 27 Representation of the geometry involved in Bragg’s Law. ......................................... 26
Figure 28 Example of diffractogram. ........................................................................................... 27
Figure 29 Thermogravimetric balance (Perkin Elmer “Pyris 1 TGA” Model). ............................. 28
Figure 30 TGA/DSC thermogram. ............................................................................................... 28
Figure 31 Potential variation with time in CV. ............................................................................. 29
Figure 32 Cyclic voltammogram example. .................................................................................. 29
Figure 33 Ewe vs. Time plot. ....................................................................................................... 31
Figure 34 Specific capacity vs. Cycle number plot. .................................................................... 31
Figure 35 dQ/dE (mAhg-1V-1) vs. Potential (Li+/Li) plot. ........................................................... 32
Figure 36 Circuit element definition. ............................................................................................ 33
Figure 37 Properties of in series (above) and parallel circuit element (below). .......................... 33
Figure 38 Nyquist plot of an ideal parallel RC circuit. ................................................................. 34
Figure 39 a) RC, b) R1(RC) and c) (R1C)(R2C) equivalent circuits. .......................................... 35

Figure 40 MnO crystal structure [Halite (cubic) cf8]. ................................................................... 36
Figure 41 Scheme of a “T Cell” section....................................................................................... 38
Figure 42 Glove box. ................................................................................................................... 38
Figure 43 Sputtering diagram for Gold. ....................................................................................... 39
Figure 44 Slurry treated with ultrasound (left) and obtained MnO/C after annealing (right). ...... 40
Figure 45 MnO Cyclic Voltammetry at 50µV/s. ........................................................................... 41
Figure 46 MnO-PVdF_#1 electrochemical performances. .......................................................... 42
Figure 47 MnO-CMC_#1 (a) and MnO-PAA_#2 (b) electrochemical performances. ................. 44
Figure 48 Electrochemical performances at different pressure of MnO-PVdF_#1_HP3 (a), MnO-
CMC_#1_HP3 (b), MnO-PAA_#3_HP3 (c) and MnO-PAA_#3_HP5 (d). ................................... 45
Figure 49 Galvanostatic profiles (a) and the Differential analysis (b) of MnO-
PAA_#3_9mm_10_HP5 electrode. ............................................................................................. 47
Figure 50 MnO-PAA_#3_HP5 electrochemical performances. .................................................. 48
Figure 51 MnO-PAA_#4_HP5_GoldCoated. .............................................................................. 49
Figure 52 MnO/C capillary XRD. ................................................................................................. 50
Figure 53 MnO/C TGA. ............................................................................................................... 50
Figure 54 Electrochemical performances of MnO/C with PVDF (a) and PAA (b) as binders. .... 51
Figure 55 Galvanostatic profiles at 755 mAg-1 of MnO/C-PAA_#1_HP5 electrode. .................. 52
Figure 56 Differential analysis of MnO/PAA_#1¬_HP5 electrode............................................... 53
Figure 57 Rate capability of MnO/C-PVdF (a) and MnO/C-PAA (b). .......................................... 54
Figure 58 Improved contact between the active material (white dot) and the carbon black (black
dot) conductive additive. ............................................................................................................. 55
Figure 59 Electrochemical performances of MnO-PAA_#5_HP5 electrode. .............................. 56
Figure 60 Galvanostatic (a) and Differential (b) profiles of MnO-PAA-#5¬_HP5. ....................... 57
Figure 61 Common MnO-PAA layer with bubbles and aggregation of active material. .............. 58
Figure 62 Triton X-100® structure............................................................................................... 58
Figure 63 MnO-PAA_#6_Triton layer. ........................................................................................ 59
Figure 64 Electrochemical performances of MnO-PAA_#6_Triton_HP5 electrode. ................... 60
Figure 65 Electrochemical performances of MnO-PAA_#6_Triton_HP5 electrode using a VC
(2%) as electrolyte additive ......................................................................................................... 61
Figure 66 Long-Term protocol of MnO-PAA_#6_Triton_HP5 electrode. .................................... 61
Figure 67 Galvanostatic (a) and Differential (b) profiles of MnO-PAA-#6_Triton¬_HP5. ........... 62
Figure 68 Rate capability of MnO-PAA_#6_Triton_HP5 electrode. ............................................ 63
Figure 69 Nyquist plot of MnO-PAA_#6_Triton_9mm_#2_HP5 (a) and MnO-
PAA_#6_Triton_9mm_#4_HP5 (b). ............................................................................................ 65
Figure 70 Specific Capacities comparison between bibliography, non-optimized and optimized
electrodes. ................................................................................................................................... 67

Index of Tables
Table 1 Common Primary batteries. ............................................................................................. 3
Table 2 Common Secondary batteries.......................................................................................... 4
Table 3 Advantages and disadvantages of Li-ion batteries .......................................................... 7
Table 4 requirements for Li-Ion cathode materials. ...................................................................... 8
Table 5 PVdF characteristics. ..................................................................................................... 12
Table 6 Requirements for Li-Ion separators. .............................................................................. 15
Table 7 Requirements for anode material.. ................................................................................. 16
Table 8 Electrochemical properties of some anodic materials. .................................................. 22
Table 9 Plateau potential values for binary TM compounds in conversion reactions 25. ............ 24
Table 10 Drying condition for several binders. ........................................................................... 37
Table 11 Slurry composition. ....................................................................................................... 39
Table 12 Annealing condition. ..................................................................................................... 40
Table 13 MnO-PVdF_#1 composition. ........................................................................................ 42
Table 14 Percentage composition of layers with Na-CMC and PAA as binders. ....................... 43
Table 15 Summary of electrochemical performances on MnO-PVdF_#1_HP3, MnO-
CMC_#1_HP3, MnO-PAA_#3_HP3 and MnO-PAA_#3_HP5 electrodes. .................................. 46
Table 16 MnO-PAA_#5 composition. .......................................................................................... 55
Table 17 Percentage composition of MnO-PAA_#6_Triton layer. .............................................. 59
Table 18 MnO current density associated to different C-Rate. ................................................... 63
Table 19 Rate capability values of MnO-PAA_#6_Triton_HP5 electrode. .................................. 63
Table 20 MnO-PAA_#6_Triton electrodes specifications. .......................................................... 64
Abbreviation List
SOC – State Of Charge
SOH – State Of Health
LIB – Lithium Ion Battery
PC – Propylene Carbonate
EC – Ethylene Carbonate
DMC – Dimethyl Carbonate
DME – Dimethoxy Ethane
DEC – Diethyl Carbonate
SEI – Solid Electrolyte Interphase
PVdF – Polyvinylidene Fluoride

NMP – N-Methylpyrrolidone
Na-CMC – Sodium Carboxymethyl Cellulose
PAA – Polyacrylic Acid
PE - Polyethylene
PP – Polypropylene
SHE – Standard Electrode Hydrogen
BSU – Basic Structural Unit
GO – Graphene Oxide
RGO – Reduced Graphene Oxide
Li-GICs – Lithium-Graphite Intercalation Compounds
ICL – Irreversible Capacity Loss
TM – Transition Metal
XRD – X-Ray Diffraction
TGA – Thermogravimetric Analysis
CV – Cyclic Voltammetry
GCPL – Galvanostatic Cycle with Potential Limitation
EIS – Electrochemical Impedance Spectroscopy
CPE – Constant Phase Element
SC65 – Super C65
WE – Working Electrode
CE – Counter Electrode
RE – Reference Electrode
PVD – Physical Vapor Deposition
OCV – Open Circuit Voltage
C-Rate – Charge Rate
VC – Vynilene Carbonate

1
1. Introduction
In recent years, there has been an exponential growth of portable electronic devices such as
laptop computers and mobile phones, which have led the industry to look for compact,
lightweight and high energy density batteries. In addition to this, we must also take into account
the environmental impact: so we need batteries, which besides having the above characteristics
are also rechargeable. Generally, the performance of each device depend on the properties of
the materials with which it was made, and this applies for Li-ion battery, as well. It is clear, that
future improvements are to be searched in the optimization of the chemistry of the battery.
In batteries (Figure 1), electrical energy is generated by conversion of chemical energy via
redox reactions at the anode and cathode, where oxidation and reduction respectively occur.
Referring to potential, the more negative electrode is the anode and the more positive is the
cathode. The energy content of a system like a battery can be visualized by Ragone Plots
(Figure 2), which use terms as specific energy (WhKg-1) and specific power (WKg-1).
Figure 1 Different types of batteries.
In this plot, fuel cells are High-Energy Systems, thanks to their high-energy availability, whereas
Supercapacitors are High-Power Systems, thanks to their high-rate of energy deliverance.
Batteries have intermediate power and energy characteristics, and for this reason, they are the
most common and versatile electrochemical power system in portable devices, in comparison to
Supercapacitors and fuel cells, thanks to their small size as well. Usually, Supercapacitors are
used for pulse power applications, while fuel cells are used in primary and backup power for
buildings.

2
Figure 2 Ragone Plot for various electrochemical energy conversion system.
High power and high-energy devices could be achieved combining different electrochemical
energy conversion system in hybrid electrochemical power schemes [1].
1.1. What is a Battery?
A battery is a device capable of converting electrical energy into chemical energy and vice-
versa. It consists of one or more cells connected together in series or parallel, whereas each
cell consists of three major components: anode, cathode and electrolyte.
- Anode: the reducing electrode which is oxidized during the battery discharge;
- Cathode: the oxidizing electrode which is reduced during the battery charge;
- Electrolyte: the ionic conductor, which provides the medium for transfer of charge
within the cell between anode and cathode. It is typically liquid, but could be used in
solid and gel-like forms.
During the discharge, take place the anode half-reaction of oxidation and the cathode half-
reaction of reduction. By oxidation of the anode, a current of electrons is developed which,
through an external circuit, reaches the cathode on which the reduction takes place. The result
of this redox is that a potential difference between the two electrodes is created: the anode
acquires a negative electric potential (-), the cathode acquires a positive electric potential (+),
and between the two a flow of electrons is produced, namely an electric current. The electrical
circuit is closed, thanks to the electrolyte, which allows a flow of ions between the electrodes.
Batteries are mainly identified as Primary or Secondary, depending on their ability to be
recharged. The primary batteries are not capable of being recharged, then once discharged

3
they are discarded. Many of them are called also “dry cells” because the electrolyte are
confined in an absorbent; hence, there is not free liquid electrolyte in the cell. In Table 1, we can
find some of the most common primary batteries on the market.
Battery
Nominal
Voltage
(V)
Anode
Cathode
Electrolyte
Energy
Density
(WhL-1)
Carbon-Zinc 1.5 Zn foil MnO2 aq ZnCl2-NH4Cl 165
Alkaline 1.5 Zn powder MnO2 aq KOH 400
Zn-Air 1.2 Zn powder Carbon (air) aq KOH 1000
Li-MnO2 3.0 Li foil MnO2 LiCF3SO3 or LiClO4 535
Li-FeS2 1.6 Li foil FeS2 LiCF3SO3 or LiClO4 500
Table 1 Common Primary batteries.
The main advantages of these batteries are a good shelf life, high-energy density, little
maintenance, and ease of use. The most used shapes are cylindrical, flat button or multicell
batteries using the component cells. In Figure 3, the energy storage capability of the main types
of primary batteries are reported.
Figure 3 Energy storage capability of some primary batteries.
The secondary batteries, instead, can be recharged electrically, applying a current through them
in the opposite direction to that of discharge current. These batteries are also known as storage

4
batteries or accumulators, and are mainly used in portable consumer electronics, power tools,
electric and hybrid vehicles and uninterruptible power supply (UPS).
The most common commercial secondary batteries are listed in Table 2.
Battery
Nominal
Voltage
(V)
Anode
Cathode
Electrolyte
Energy
Density
(WhL-1)
Lead Acid 2.0 Pb PbO2 aq H2SO4 70
Ni-Cd 1.2 Cd NiOOH aq KOH 100
Ni-Zn 1.7 Zn NiOOH aq KOH 100
Ni-Metal Hydride 1.2 M-H NiOOH aq KOH 240
Li-Ion 4.0 LiXC6 Li(1-X)CoO2 LiPF6 in nonaqueous solvent 400
Table 2 Common Secondary batteries.
The latter are characterized by high power density, high discharge rates, flat discharge curves
and good low temperature performances. Their energy densities are generally lower than those
of primary batteries. In Figure 4, it is possible compare the energy storage capability of main
types of secondary batteries on the market.
Figure 4 energy storage capability of some Secondary batteries.

5
Below, there are some typical physical quantities, which describe the characteristics of a
battery:
- Theoretical Capacity (Q): is the amount of electric charge stored in the battery. It is
expressed in Coulomb (C) or Ampere*hours (Ah) and its value is given by:
Q = x × n × F
Where n is the number of electrons exchanged in the redox process, x is the number of
moles of active material, and F is the Faraday constant (96,494 C per mole of
electrons). Much more useful is the specific capacity, i.e. the theoretical capacity based
on the weight or volume of the electrode material, expressed in AhKg-1 or AhL-1.
- Theoretical energy (E): is related to the capacity and the voltage of the cell, and is
expressed in Joules (J) or more commonly Watt*hours (Wh).
E = Q x V
Also for this quantity, it has sense to relate it to a reference quantity: we will speak of
energy specification or energy density expressed in WhKg-1 or WhL-1.
- Power (P): is given by the product of the current produced by the potential, and is
expressed in Watts (W).
P = I x V = (Q × V) / t = E / t
In addition, here we speak of specific power and power density expressed in WKg-1 and
WL-1.
- Maximum Current (I): is the maximum current obtained during the discharge phase,
and is expressed in Amperes (A).
- Coulombic Efficiency %: indicates the percentage of returned charge during the
discharge phase, compared to that stored in the charging phase.
- Voltage (V): is the potential difference between the cathode and the anode, and is
expressed in volts (V).
- Cyclic Life: is the number of cycles performed by a battery under specific conditions,
before performance decay to below predetermined values is observed (a secondary cell
is considered depleted when its actual capacity becomes less than 80% of that Rated)
- State of Charge (SOC): is the amount of charge in a battery, expressed as a
percentage fraction of the total capacity.
- State of Health (SOH): is the physical condition of a battery.

6
Parameters like the Initial Coulombic Efficiency % and the Capacity Retention % were
calculated in the following way:
𝐼𝑛𝑖𝑡𝑖𝑎𝑙 𝐶𝑜𝑢𝑙𝑜𝑚𝑏𝑖𝑐 𝐸𝑓𝑓𝑖𝑐𝑖𝑒𝑛𝑐𝑦 % = 𝐷𝑖𝑠𝑐ℎ𝑎𝑟𝑔𝑒 𝑐𝑎𝑝𝑎𝑐𝑖𝑡𝑦 𝑎𝑡 2𝑛𝑑𝑐𝑦𝑐𝑙𝑒
𝐷𝑖𝑠𝑐ℎ𝑎𝑟𝑔𝑒 𝑐𝑎𝑝𝑎𝑐𝑖𝑡𝑦 𝑎𝑡 1𝑠𝑡 𝑐𝑦𝑐𝑙𝑒∙ 100
𝐶𝑎𝑝𝑎𝑐𝑖𝑡𝑦 𝑅𝑒𝑡𝑒𝑛𝑡𝑖𝑜𝑛 𝑎𝑡 𝑛𝑡ℎ 𝑐𝑦𝑐𝑙𝑒 =𝐷𝑖𝑠𝑐ℎ𝑎𝑟𝑔𝑒 𝑐𝑎𝑝𝑎𝑐𝑖𝑡𝑦 𝑎𝑡 𝑛𝑡ℎ 𝑐𝑦𝑐𝑙𝑒
𝐷𝑖𝑠𝑐ℎ𝑎𝑟𝑔𝑒 𝑐𝑎𝑝𝑎𝑐𝑖𝑡𝑦 𝑎𝑡 2𝑛𝑑 𝑐𝑦𝑐𝑙𝑒∙ 100
The Capacity Retention value is calculated taking into account the specific capacity value of the
2nd (or 3rd) cycle, i.e. when the electrode is stable (in the 1st cycle the specific capacity value is
greatly reduced by some degradation processes).
2. Lithium Ion Batteries (LIBs)
The Lithium-Ion (Li-Ion) cells have become one of the most promising and diffused
electrochemical energy storage devices [2, 3]. From the electrochemical point of view, the Li-Ion
battery is an electrochemical device that converts electrical energy to chemical energy and vice-
versa. The chemical reactions occur spontaneously between a positive electrode (cathode) and
a negative electrode (anode) separated by a fiberglass collector and immersed in an electrolyte
solution, producing an electrical current.
The development of these batteries is due to the fact that the Lithium is the lightest and
electropositive metal, which therefore allows the production of batteries with high charge
density, although keeping very low weights. They can be built in many shapes and sizes and
they do not suffer from memory effect and have a low self-discharge rate per month
(approximately 5% compared to 20% of the Ni-Cd). They have a high voltage of about 4 V and
have a specific energy that ranges from 100 to 150 WhKg-1. The main drawbacks concern the
shelf life. Regardless of charge and discharge cycles, there is a gradual degradation of about
20% per year, compared to its initial capacity. This percentage greatly increases with increasing
temperature. In addition, a factor to be reckoned with, the lithium is a very expensive material,
because of its limited natural abundancy and subsequent expensive processes. Moreover, its
marketing is in the hands of a few producers such as SQM, FMC and Rockwood Lithium.
For the construction of electrodes for a Lithium Battery, Intercalation Compounds are mainly
used. This term it is referred to the insertion process (reversible) of mobile ions in a crystal
lattice (host) that contains an interconnected system of empty lattice sites of appropriate size. In
the most common Li-ion battery, the following electrochemical process is involved:
𝐿𝑖𝑀𝑂2 + 𝑦𝐶 ↔ 𝐿𝑖(1−𝑥)𝑀𝑂2 + 𝐿𝑖𝑥𝐶𝑌

7
M is commonly a transition metal. The procedure, therefore, is based on the reversible process
of insertion and extraction of Lithium ions (Li+) between the two electrodes. When a battery is
charged, the positive electrode is oxidized and the negative electrode is reduced. In this
process, lithium ions are de-intercalated from the positive material and intercalated into the
negative material (Figure 5).
Figure 5 Li-Ion battery example.
The major advantages and disadvantages of Li-Ion batteries, relative to other types of batteries,
are summarized in Table 3.
Advantages Disadvantages
- High Energy Density (400 WhL-1).
- High Coulombic Efficiency %.
- Long Cycle Life (up to 1000 cycles).
- No Memory Effect.
- Low Self-discharge Rate (2% to 8% per month).
- Broad Temperature Range (-20°C to 60°C)
- High initial cost.
- Degradation at high temperatures
(above 65°C).
- Thermal runaway when overcharged or crushed.
Table 3 Advantages and disadvantages of Li-ion batteries

8
2.1. Cathode Materials
They have been the first material to be examined in the early years of Lithium Battery
technology. The cathode is the positive electrode of a Li-Ion cell, and is usually a lithiated form
of a metal oxide, which during cycling acts as Li+ source (because the cell is assembled in a
discharged state). A cathode material must exhibit the following characteristics:
Requirements for Li-Ion Cathode Materials
- Stable, cheap, and non-toxic
- High discharge potential
- High free energy of reaction with lithium
- High lithium ion diffusivity
- Host structure must have a huge lithium intercalation capacity
- Volume variation between lithiated and de-lithiated form must be as small as possible
Table 4 requirements for Li-Ion cathode materials.
Over the years, a variety of positive electrode materials has been studied and developed and
they can be mainly grouped into three categories:
- Layered oxides, such as LiCoO2.
- Spinel Phase, such as LiMn2O4.
- Olivine Phase, such as LiFePO4.
2.1.1. Layered oxides – LiCoO2
It is one of the most attractive materials, thanks to the high voltage of 4.5 V. It has a rock-salt
structure made of alternating layers of CoO6 and LiO6. You cannot get the complete extraction
of lithium from the structure, because of the high instability of CoO2. Therefore, they usually
cycle Li(1-x)CoO2 only until to x ≈ 0.5, which corresponds to a theoretical capacity is 137 mAhg-1.
During the extraction of lithium, due to a structural transition from hexagonal to monoclinic, the
lattice expands along z-axis instead of shrinking: this determines an increase of the diffusion
coefficient of lithium.

9
Figure 6 LiCoO2 structure.
The disadvantages of this material are the high cost, toxicity resulting from Cobalt and a high
oxidizing power, which ruins the collector and the electrolyte. To prevent excessive oxidation of
the cathode, one can apply a cut-off potential at about 3.9 V ~ 4.0 V, which preserves the
crystallinity of the structure.
2.1.2. Spinel Phase – LiMn2O4
LiMn2O4 presents a spinel structure characterized by a high energy and a low cost. Despite its
high theoretical capacity of 148 mAhg-1 and high voltage of 4.0 V, it has the problems of a slow
charging speed and a deterioration, which worsen with the progress of charge/discharge cycles.
Lithium insertion/de-insertion from the tetrahedral sites is allowed by the presence of octahedral
array of Mn2O4, which prevents collapse of the 3D structure during the processes. The structure
of LiMn2O4 is shown in Figure 7.
Figure 7 LiMn2O4 structure.

10
From an electrochemical point of view, this material can be used in two ranges of potential,
where we can have a cubic LiMnO4 phase or a tetragonal lithiated phase. This transition is due
to a Jahn Teller Distortion, where the electronic configuration of manganese goes from +4 to
high-spin +3 [4].
The first process (0 < x < 1 in LixMn2O4) occurs for potential values around 4.0 V vs. Li+/Li,
whereas the second (1 <x <2 in LixMn2O4) occurs at potentials around 3.0 V. To obtain a high
voltage battery with high specific energy, it is preferable to work only on the 4.0 V plateau, due
to distortions of the crystal lattice at 3.0 V, which decrease the cyclability. Over the past year,
mixed oxides as LiMn1.5Ni0.5O4, have been synthesized in the attempt to overcome this problem.
They have a high voltage of 4.8 V, but a real capacity of 135 mAhg-1. The capacity can be
increased by using nanoparticles during the synthesis of this cathodic material [5].
2.1.3. Olivine Phase – LiFePO4
The Lithium Iron Phosphate has an orthorhombic structure in which the Iron atoms occupy the
octahedral sites and the Phosphorus the tetrahedral ones. This material has a very low price
and toxicity, thus it has become a commonly used cathode material for battery application. Its
structure is shown in Figure 8.
Figure 8 LiFePO4 structure.
It has advantages such as the stability of the structure during the extraction of the lithium ions,
the low cost, and the better environmental compatibility, since iron is not toxic. The main
drawbacks are the low real capacity of 150 mAhg-1 (which however is very close to the
theoretical value of 170 mAhg-1), the low density, the low electronic conductivity, which could be
improved by carbon coating [6], and the low working potential of 3.4 V.
11
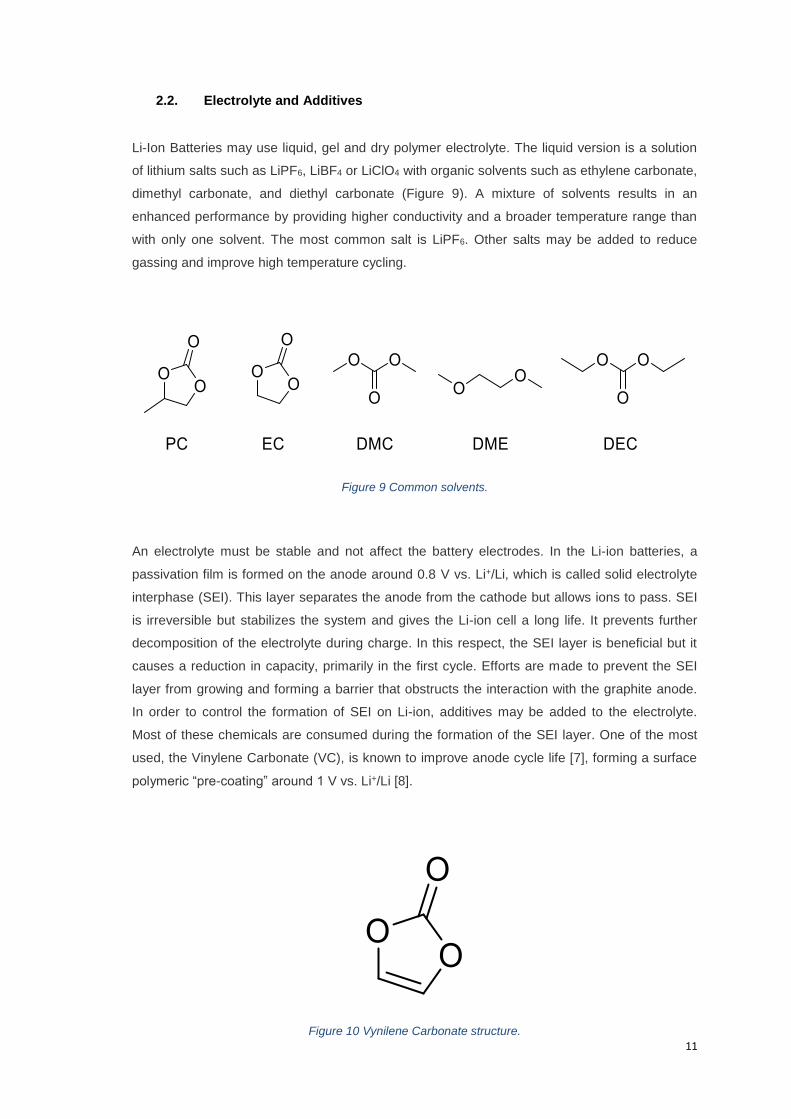
2.2. Electrolyte and Additives
Li-Ion Batteries may use liquid, gel and dry polymer electrolyte. The liquid version is a solution
of lithium salts such as LiPF6, LiBF4 or LiClO4 with organic solvents such as ethylene carbonate,
dimethyl carbonate, and diethyl carbonate (Figure 9). A mixture of solvents results in an
enhanced performance by providing higher conductivity and a broader temperature range than
with only one solvent. The most common salt is LiPF6. Other salts may be added to reduce
gassing and improve high temperature cycling.
Figure 9 Common solvents.
An electrolyte must be stable and not affect the battery electrodes. In the Li-ion batteries, a
passivation film is formed on the anode around 0.8 V vs. Li+/Li, which is called solid electrolyte
interphase (SEI). This layer separates the anode from the cathode but allows ions to pass. SEI
is irreversible but stabilizes the system and gives the Li-ion cell a long life. It prevents further
decomposition of the electrolyte during charge. In this respect, the SEI layer is beneficial but it
causes a reduction in capacity, primarily in the first cycle. Efforts are made to prevent the SEI
layer from growing and forming a barrier that obstructs the interaction with the graphite anode.
In order to control the formation of SEI on Li-ion, additives may be added to the electrolyte.
Most of these chemicals are consumed during the formation of the SEI layer. One of the most
used, the Vinylene Carbonate (VC), is known to improve anode cycle life [7], forming a surface
polymeric “pre-coating” around 1 V vs. Li+/Li [8].
Figure 10 Vynilene Carbonate structure.

12
2.3. Binders
A binder is a polymeric compound used in the battery industries in order to hold together the
active material and the conductive agent, and stick them to the current collector surface
(Aluminium and Copper, respectively for Cathode and Anode).
The standard industry binder is the Polyvinylidene Fluoride (PVdF), a homopolymer of
vinylidene fluoride, belonging to the family of Polifluorolefins, which are very stable
macromolecular compounds, because of the great strength of the C-F bond compared to the C-
H bond. In Table 5, the main characteristics of PVdF are listed.
PVdF Characteristics
- Good mechanical and abrasion resistance.
- Almost inert to strong acids and oxidizers.
- High solubility in polar solvent.
- UV resistance.
- Thermal stability from - 40°C to + 150°C.
Table 5 PVdF characteristics.
Figure 11 Polyvinylidene Fluoride (at left) and N-methylpyrrolidone (at right) structures.
The main drawbacks of PVdF is its solvent that has to be used to prepare the electrode slurries:
the N-methylpyrrolidone, also known as NMP (Figure 11), which is toxic and expensive.
Moreover, PVdF can react at high temperatures with Lithium and with the graphite lithiated form
(LiC6), giving LiF and [C=F]. This reaction, in addition to consuming the Lithium, is also highly
exothermic, and thus is potentially dangerous.
In the last few years, in order to avoid toxic solvent as NMP, and use environmentally friendly
solvents, different binder have been proposed. One of these is the Sodium salt of
Carboxymethylcellulose (Na-CMC), a cellulose derivative, in which some –OH groups are
substituted with -CH2COOH groups (Carboxymethyl) by esterification.
13
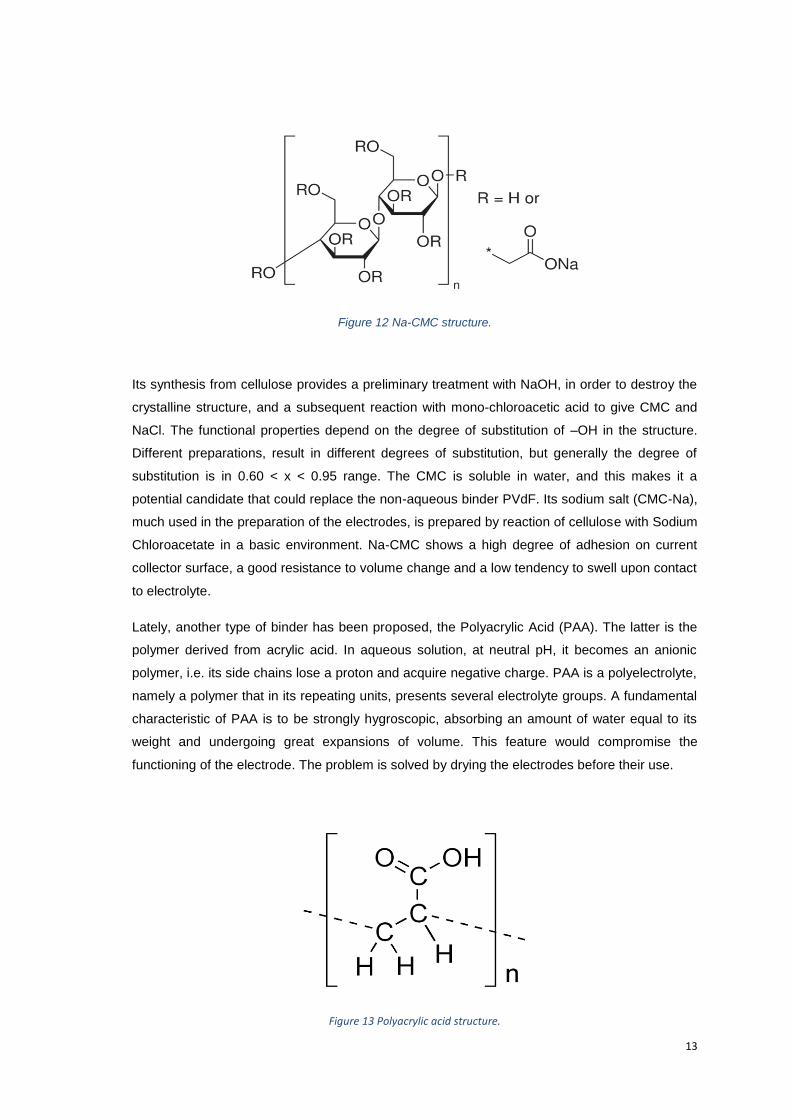
Figure 12 Na-CMC structure.
Its synthesis from cellulose provides a preliminary treatment with NaOH, in order to destroy the
crystalline structure, and a subsequent reaction with mono-chloroacetic acid to give CMC and
NaCl. The functional properties depend on the degree of substitution of –OH in the structure.
Different preparations, result in different degrees of substitution, but generally the degree of
substitution is in 0.60 < x < 0.95 range. The CMC is soluble in water, and this makes it a
potential candidate that could replace the non-aqueous binder PVdF. Its sodium salt (CMC-Na),
much used in the preparation of the electrodes, is prepared by reaction of cellulose with Sodium
Chloroacetate in a basic environment. Na-CMC shows a high degree of adhesion on current
collector surface, a good resistance to volume change and a low tendency to swell upon contact
to electrolyte.
Lately, another type of binder has been proposed, the Polyacrylic Acid (PAA). The latter is the
polymer derived from acrylic acid. In aqueous solution, at neutral pH, it becomes an anionic
polymer, i.e. its side chains lose a proton and acquire negative charge. PAA is a polyelectrolyte,
namely a polymer that in its repeating units, presents several electrolyte groups. A fundamental
characteristic of PAA is to be strongly hygroscopic, absorbing an amount of water equal to its
weight and undergoing great expansions of volume. This feature would compromise the
functioning of the electrode. The problem is solved by drying the electrodes before their use.
Figure 13 Polyacrylic acid structure.

14
From the electrochemical point of view, instead, we can recall that the performances of a binder
in an anode depend on three fundamental factors:
- Adhesion between the electrode and the collector.
- Interface between binder and active material.
- Interaction between binder and electrolyte [9].
For what concerns the interface between the binder and the active material, we can say that the
PAA, with respect to PVdF, presents better characteristics due to the presence of carboxyl
groups that can form hydrogen bonds, with the particles of active material and with the collector
surface. As the NA-CMC, also PAA shows a low tendency to swell upon contact with electrolyte
(increase its weight by only 8%, as opposed to the PVdF that instead it increases by 43%). This
suggests a minimal interaction with the solvent, which does not compromise any of its
mechanical properties [10].
Figure 14 PVdF (a) and PAA (b) behavior during intercalation/de-intercalation processes.
Hence, active electrode materials that show a high tendency to volume change during the
charge/discharge cycles, could improve their performance and stability using elastic binders
such as Na-CMC or PAA [11].

15
2.4. Separator Materials
They are microporous films that isolate electrically the two electrodes, while letting flow the
electrolyte through them. They are usually made of polyolefin materials (PE or PP), with a
porosity which goes from 30 to 50% [12]. The main features that they have to possess are:
Requirements for Li-Ion Separators
- Chemical stability with electrolyte and electrode material.
- Good mechanical properties.
- Pore size (0.03 to 0.1 µm).
- Easy wettability.
- Thickness (10 to 30 µm).
Table 6 Requirements for Li-Ion separators.
Separator may serve as fuses in Li-ion cell, as well. Recently, larger industrial batteries are
equipped with a tri-layered separator that provides this protection. Figure 15 illustrates the
PP/PE/PP tri-layer separator consisting of polyethylene in the middle that is sandwiched by
outer polypropylene (PP) layers. While the inner PE layer shuts down at 130°C by closing the
pores, the outer PP layers stay solid and do not melt until reaching 155°C. This stops the
transport of ion, effectively shutting the cell down. Without this provision, heat in the failing cell
could rise to the thermal runaway threshold.
Figure 15 Try-layered separator, used as a fuse.

16
2.5. Anode Materials
The first lithium batteries, had a cathode made of a material, which could intercalate Li+ ions,
and an anode composed of only metallic lithium. With the proceeds of charge/discharge cycles,
formation of dendritic accumulations could pierce the separator and create conductive bridges
with the positive charge, coming to constitute real short circuits inside the accumulator. For this
reason, we have sought new electrode materials to replace the metallic lithium to the negative
electrode. Nowadays, the most used anode active materials are the carbonaceous materials,
because they have a redox potential more negative than the other anode materials such as
metal oxides. These materials have taken over on the metallic Lithium, despite its potential (-
3.045 V vs. SHE) and its high specific capacity of 3860 mAhg-1 [13, 14]. Carbonaceous
materials have a redox potential similar to that of lithium, but less than that of the cathode to
have a high cell voltage, and capable of maintaining the customary exchange kinetics, such as
the intercalation. For these reasons, the carbon materials have taken so much foot. In addition,
they are stable, readily available, cheap and with good electrochemical performance. An anode
active material in Li-Ion Batteries should have the following features:
Requirements for anode active material
- Low working potential respect Li+/Li.
- Low atomic number and density.
- Inert and insoluble in electrolytes.
- With fast insertion/de-insertion kinetics.
- Cheap and environmentally friendly.
Table 7 Requirements for anode material..
In addition to carbonaceous ones, several material types have been developed and studied
over the years, like alloy-based and conversion materials.
2.5.1. Carbonaceous Materials
Between the several allotropes of carbon, graphite is without any doubt the most used anodic
material for Li-Ion batteries, because of its stability, low operating voltage and relatively high
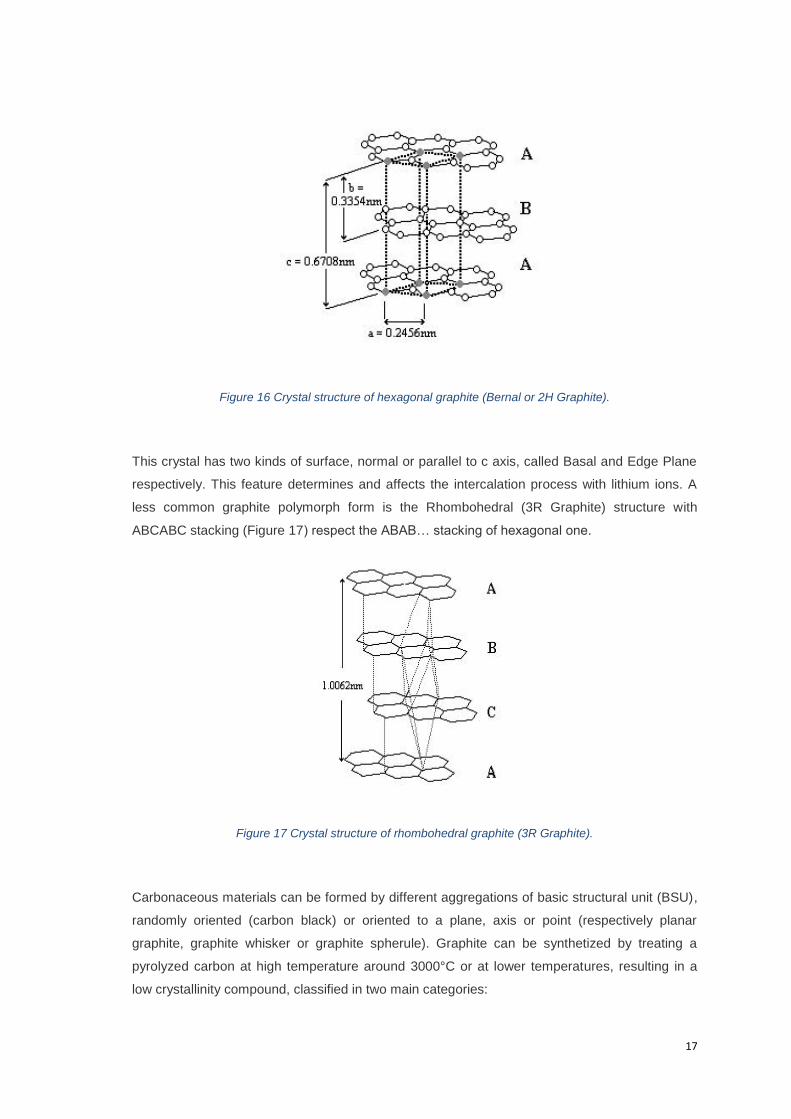
specific capacity of 372 mAhg-1 [15, 16]. Graphite is a layered compound consisting of
hexagonal graphene sheets of sp2 carbon atoms, bonded together with Van Der Waals forces
as shown in Figure 16.
17
Figure 16 Crystal structure of hexagonal graphite (Bernal or 2H Graphite).
This crystal has two kinds of surface, normal or parallel to c axis, called Basal and Edge Plane
respectively. This feature determines and affects the intercalation process with lithium ions. A
less common graphite polymorph form is the Rhombohedral (3R Graphite) structure with
ABCABC stacking (Figure 17) respect the ABAB… stacking of hexagonal one.
Figure 17 Crystal structure of rhombohedral graphite (3R Graphite).
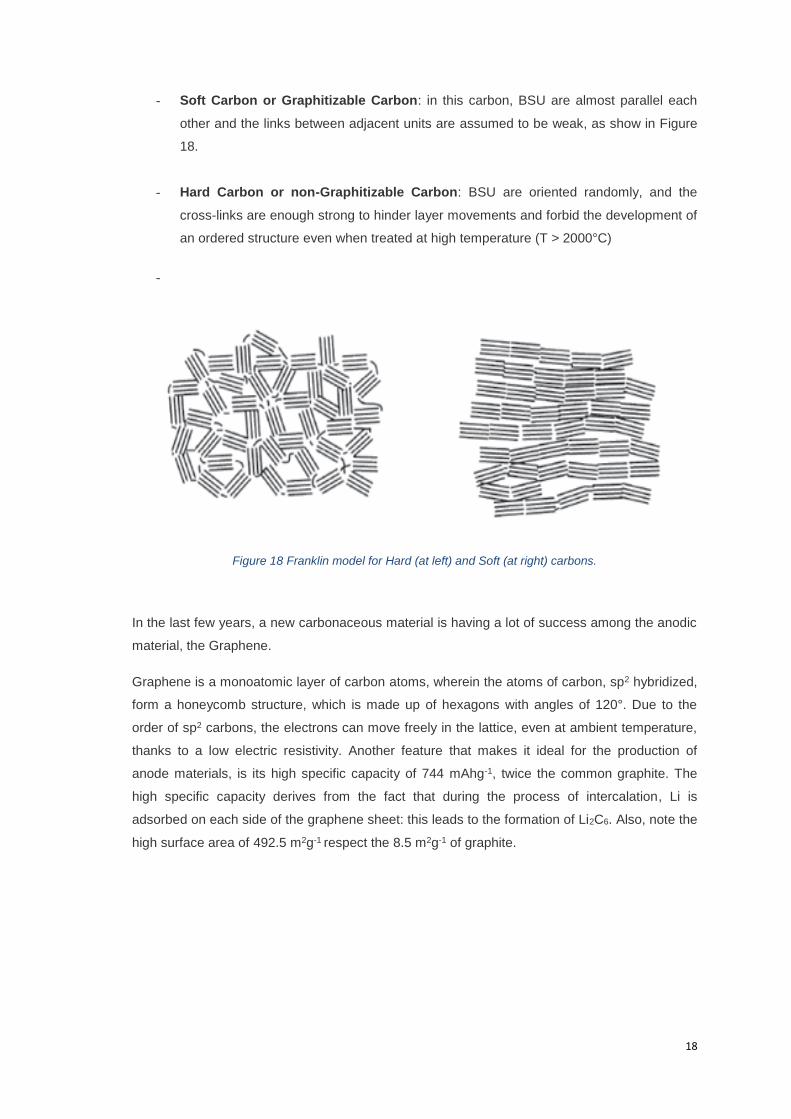
Carbonaceous materials can be formed by different aggregations of basic structural unit (BSU),
randomly oriented (carbon black) or oriented to a plane, axis or point (respectively planar
graphite, graphite whisker or graphite spherule). Graphite can be synthetized by treating a
pyrolyzed carbon at high temperature around 3000°C or at lower temperatures, resulting in a
low crystallinity compound, classified in two main categories:
18
- Soft Carbon or Graphitizable Carbon: in this carbon, BSU are almost parallel each
other and the links between adjacent units are assumed to be weak, as show in Figure
18.
- Hard Carbon or non-Graphitizable Carbon: BSU are oriented randomly, and the
cross-links are enough strong to hinder layer movements and forbid the development of
an ordered structure even when treated at high temperature (T > 2000°C)
-
Figure 18 Franklin model for Hard (at left) and Soft (at right) carbons.
In the last few years, a new carbonaceous material is having a lot of success among the anodic
material, the Graphene.
Graphene is a monoatomic layer of carbon atoms, wherein the atoms of carbon, sp2 hybridized,
form a honeycomb structure, which is made up of hexagons with angles of 120°. Due to the
order of sp2 carbons, the electrons can move freely in the lattice, even at ambient temperature,
thanks to a low electric resistivity. Another feature that makes it ideal for the production of
anode materials, is its high specific capacity of 744 mAhg-1, twice the common graphite. The
high specific capacity derives from the fact that during the process of intercalation, Li is
adsorbed on each side of the graphene sheet: this leads to the formation of Li2C6. Also, note the
high surface area of 492.5 m2g-1 respect the 8.5 m2g-1 of graphite.
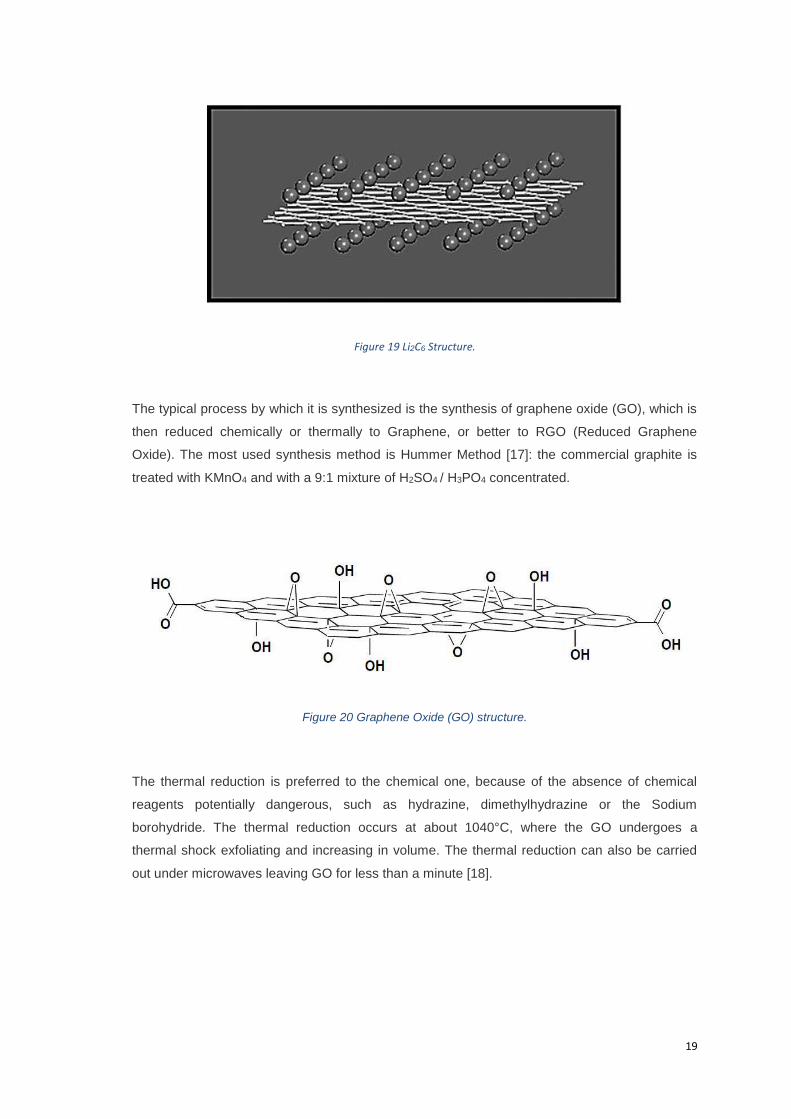
19
Figure 19 Li2C6 Structure.
The typical process by which it is synthesized is the synthesis of graphene oxide (GO), which is
then reduced chemically or thermally to Graphene, or better to RGO (Reduced Graphene
Oxide). The most used synthesis method is Hummer Method [17]: the commercial graphite is
treated with KMnO4 and with a 9:1 mixture of H2SO4 / H3PO4 concentrated.
Figure 20 Graphene Oxide (GO) structure.
The thermal reduction is preferred to the chemical one, because of the absence of chemical
reagents potentially dangerous, such as hydrazine, dimethylhydrazine or the Sodium
borohydride. The thermal reduction occurs at about 1040°C, where the GO undergoes a
thermal shock exfoliating and increasing in volume. The thermal reduction can also be carried
out under microwaves leaving GO for less than a minute [18].

20
2.5.2. Intercalation/Deintercalation processes in Carbonaceous Materials
The electrochemical insertion of Li+ ions into Graphite lead to the formation of Lithium-Graphite
Intercalation Compounds (Li-GICs) through a mechanism called Intercalation. In this reversible
process there is a progressively insertion of Li+ among the graphite layers up to LiC6, which
correspond to the maximum theoretical specific capacity of 372 mAhg-1, according with the
following reaction:
Figure 21 LiC6 structure, i.e. completely discharged battery.
During intercalation, stacking order of graphene sheets shifts to AAA order, and the interlayer
distance slightly increase (about 10.3 %). The mechanism of the electrochemical intercalation
into graphite is called Staging, and it is a stepwise process active in 0.1 V - 0.25 V potential
range (vs. Li+/Li), that can be described by the Stage Index “s”. Stage formation can be viewed
in the potential/composition curve for galvanostatic reduction of graphite to LiC6 in Figure 22.
21
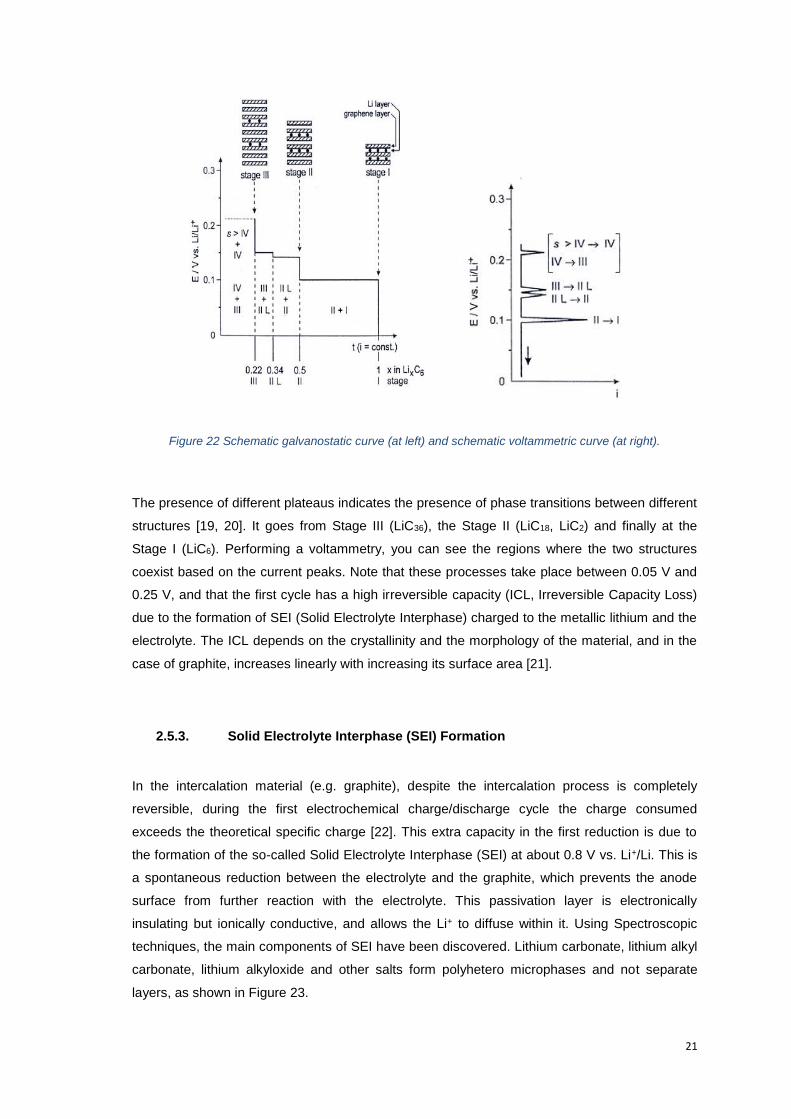
Figure 22 Schematic galvanostatic curve (at left) and schematic voltammetric curve (at right).
The presence of different plateaus indicates the presence of phase transitions between different
structures [19, 20]. It goes from Stage III (LiC36), the Stage II (LiC18, LiC2) and finally at the
Stage I (LiC6). Performing a voltammetry, you can see the regions where the two structures
coexist based on the current peaks. Note that these processes take place between 0.05 V and
0.25 V, and that the first cycle has a high irreversible capacity (ICL, Irreversible Capacity Loss)
due to the formation of SEI (Solid Electrolyte Interphase) charged to the metallic lithium and the
electrolyte. The ICL depends on the crystallinity and the morphology of the material, and in the
case of graphite, increases linearly with increasing its surface area [21].
2.5.3. Solid Electrolyte Interphase (SEI) Formation
In the intercalation material (e.g. graphite), despite the intercalation process is completely
reversible, during the first electrochemical charge/discharge cycle the charge consumed
exceeds the theoretical specific charge [22]. This extra capacity in the first reduction is due to
the formation of the so-called Solid Electrolyte Interphase (SEI) at about 0.8 V vs. Li+/Li. This is
a spontaneous reduction between the electrolyte and the graphite, which prevents the anode
surface from further reaction with the electrolyte. This passivation layer is electronically
insulating but ionically conductive, and allows the Li+ to diffuse within it. Using Spectroscopic
techniques, the main components of SEI have been discovered. Lithium carbonate, lithium alkyl
carbonate, lithium alkyloxide and other salts form polyhetero microphases and not separate
layers, as shown in Figure 23.

22
Figure 23 SEI microphases structure.
Thus, SEI formation leads to a certain amount of Irreversible capacity at first cycle, which can
increase, if during cycling the SEI breaks, because the electrolyte reacts again, giving rise to a
renewed SEI layer [22].
2.5.4. Alloy-based Materials
The continue demand for ever more powerful batteries for portable devices, and more recently
for electric vehicles, has required the study and development of anode materials with a specific
capacity greater than that of simple graphite (372 mAhg-1). Metals such as silicon (Si),
aluminium (Al), tin (Sn), antimony (Sb), germanium (Ge), and silver (Ag) showed an operation
mechanism different from that of the classic intercalation anodic materials, by reacting with
lithium and forming alloys [23].
In Table 8, the more important electrochemical characteristics of metals as silicon and tin,
respect to metallic lithium (mostly used as anode in primary batteries) and graphite, are shown
.
Materials Li C Si Sn
Density (gcm-3) 0,53 2,25 2,33 7,29
Lithiated phase Li LiC6 Li4.4Si Li4.4Sn
Specific capacity (mAhg-1) 3862 372 4200 994
Charge density (mAhcm-3) 2047 837 9786 7246
Volume change (%) 100 12 320 260
Potential vs. Li+/Li (V) 0 0,05 0,4 0,6
Table 8 Electrochemical properties of some anodic materials.

23
In the following reaction, the general reaction mechanism of an alloying material is shown.
Despite high specific capacity, these materials have big drawbacks: the huge volume change
(up to 300%), together with the formation of different phases at different potentials during
alloying/dealloying cycles, cause the cracking and the pulverization of active material and the
subsequent loss of electrical contact with the metallic collector.
Several strategies have been developed in order to avoid these stability problems, like the use
of an alternative binder like Polyacrylic Acid (PAA), which can better support these volume
change, some morphological optimization like carbon coating or the dispersion in carbonaceous
matrix as Graphene [11], or the synthesis of nanomaterials (nanoparticles and nanowires) [24].
Figure 24 Silicon nanowire anode structure before and after cycling.
2.5.5. Conversion Materials
The advent of the 21st century brought interest onto a new reactivity concept with the reversible
electrochemical reaction of lithium with transition metal oxides, according to what is
conventionally referred to as “conversion reaction”, generalized as follows:
In the previous reaction, M is a Transition Metal (TM), and X can be O, F, P, S, and N. In
conversion materials, there is a complete reduction of MaXb, to metallic nanoparticles, which
thanks to them large surface, are active in the decomposition of the LinX matrix, which keeps

24
them together [25]. The nanometric size of these particles seems to be maintained also after
several cycles.
Figure 25 Voltage vs. Composition profile of the first cycles in a conversion electrode 25.
Unfortunately, these materials present several issues. The most relevant are:
- The structural re-organization induces, as for the alloy-based materials, big volume
changes, resulting in particles de-cohesion and subsequent cell failure.
- Unacceptable large voltage hysteresis between discharge and charge steps.
- Large Coulombic inefficiency observed in the first cycle.
- Low conductivity.
The reduction/conversion (lithium uptake) reaction will always occur on battery discharge, while
the reverse will occur during charge (lithium release). In Table 9, some experimental potential
values for the plateaus associated with the conversion reactions in binary TM compounds MaXb
are reported.
Table 9 Plateau potential values for binary TM compounds in conversion reactions 25.

25
Hence, despite the progress made with these materials, several issues persist in the way to
making them a viable alternative [25]. In Figure 25, the theoretical (black bars), first discharge
(dark grey bars), and charge (light grey bars) specific capacities of different compounds that
react with lithium through a conversion reaction are reported.
Figure 26 Specific capacities of some TM conversion compounds 25.

26
3. Experimental Techniques
Below the techniques used for the characterization of the materials tested during the research
work are listed and described.
3.1. X-Ray Diffraction (XRD)
X-ray diffraction (XRD) is an analytical technique in which the diffracted X-ray of crystalline
materials, i.e. materials that are characterized by a long-range order of basic cell units repeated
regularly (ordered structure) are recorded. Each structure produces a diffraction pattern that
constitutes a "fingerprint", making possible the identification of an unknown material for
comparison with the database of pattern of known substances. The XRD technique is among
the most powerful in the recognition of the structure of unknown substances. While not
providing direct information on the elemental composition, it allows to define the crystalline
phases present in an unknown sample, and their 3D structures it is applicable to any type of
material, organic or inorganic, monomeric or polymeric material, only if it is crystalline, which
comprises approximately 95% of all solid materials. When an X-ray strikes the face of a crystal
with a certain angle of incidence θ, it is in part diffused from the layer of atoms of the surface,
and in part penetrates towards the underlying layer of atoms, which is again partially diffused.
The total effect is the diffraction of the light beam, which is obtained if the spacing between
atomic planes is if of the order of magnitude of the radiation, and if the hit atoms are regular
distributed in the space, as in crystalline materials.
Figure 27 Representation of the geometry involved in Bragg’s Law.
In practice, a crystal may be considered as a lattice, where the diffusion centres are the atoms.
The distances “d” between the lattice positions, repeated regularly in the crystal, make it
generate an image of diffraction that contains the memory of the periodic atomic structure of the
crystal.

27
Figure 28 Example of diffractogram.
The signal strength is measured as a function of the angle θ. There will be some values of θ to
satisfy Bragg's law and give a signal intensity different than zero. The intensity of the signals
can be evaluated based on the peaks height. Each peak corresponds to an interplanar distance,
which is constantly repeated through the whole crystal. From the analysis of the positions of the
peaks, the interplanar distances can be calculated, and the crystalline phases present in the
sample identified.
3.2. Thermogravimetric Analysis (TGA)
The technique consists in the measurement of the weight variation, in time, of a sample
subjected to a programmed temperature scan, recording the mass change as a function of
temperature, which is derived from the release or by the absorption of gases. The
instrumentation includes a thermobalance, which is a precision electronic balance coupled with
a furnace with a temperature programmer.

28
Figure 29 Thermogravimetric balance (Perkin Elmer “Pyris 1 TGA” Model).
The sample is placed in a crucible and weighed. The crucible may be of Alumina (Al2O3),
Sapphire or Platinum depending on the temperature and on the sample. The sample at this
point, is heated or cooled according to a linear or complex temperature ramp, and at the same
time, its weight variation is measured. Balance and furnace are in a closed system where the
atmosphere is controlled: it can be static or under flow, reactive (air, O2 or H2) or inert (N2, Ar,
He). One of the advantages of a non-static inert flow is to carry away any corrosive gases or
pollutants that may compromise the life of the instrument. The result of this type of analysis is a
thermogram (TG), a graph that shows the temperature (or time) in the x-axis, and the mass
variation, as an absolute value or as a percentage, in the y-axis.
Figure 30 TGA/DSC thermogram.

29
From this graph, we can also note the presence of another curve (DTG) from the DTA
(Differential Thermal Analysis). It is the first derivative of the TG, which identifies the slope of
the TG curve, or more generally the rate of weight change. This curve allows to reveal
phenomena not associated with weight loss such as melting, crystallization, or phase
transitions.
3.3. Electrochemical Techniques
3.3.1. Cyclic Voltammetry (CV)
Cyclic Voltammetry (CV) is a technique used for the acquisition of qualitative information about
electrochemical reactions of tested material. CV is a controlled linear potential scanning (Vs-1) of
a stationary electrode using a triangular potential waveform from E1 to E2 and then from E2 from
E1.
Figure 31 Potential variation with time in CV.
The current response, results in an E vs. I plot, in which peaks, at certain potential, indicate the
presence of a redox process as shown in Figure 32.
Figure 32 Cyclic voltammogram example.
30
Peak currents are described by the Randles-Sevcik equation, valid for semi-infinite linear
diffusion:
𝑖𝑝 = 0,4463𝑛𝐹𝐴𝐶0 ∗ (𝑛𝐹
𝑅𝑇)1/2𝑣1/2𝐷1/2
Where:
- ip, is the peak current in ampere (A).
- n, are the electrons involved in redox process.
- F, is the Faraday Constant (Cmol-1).
- R, is the gas constant.
- T, is the temperature.
- A, is the electrode surface (cm2).
- C, is the concentration of active species (molcm-3).
- v, is the scan rate (Vs-1).
- D, is the diffusion coefficient (cm2s-1).
3.3.2. Galvanostatic Cycling
It is a potentiometric electrochemical technique, where we apply a constant current and a
potential response, concentration dependent, is recorded. The working potential limits are fixed
previously. Indeed, defining the Cut Off potential, we can measure the performance of the
electrode within a certain range of potential, in order to avoid degradation of the electrolyte and
the electrode. In fact, high values of potential, often determine the oxidation of organic solvents
of the electrolyte. These techniques are based on Nernst equation, which expresses the
equilibrium potential assumed by an electrode in a given system:
E = E ° + (RT/nF) ln ([Ox]/[Red])
Where:
R, is the universal gas constant (8.31 J / mol K).
T, is the temperature in K.
n, is the number of electrons transferred.
F, is Faraday's constant (96494 C).
With this technique, it is possible to evaluate the charge/discharge behavior of an electrode
material as well as its cycle life. When we connect the cell to the instrument, first we measure
the typical equilibrium potential of the cell, then providing current, we measure and record the
potential of the cell, which will provide an Ewe Vs. time plot (Figure 3.7), allowing us to
determine the capacity and stability of the cell. Very important is also the processing of the
obtained data: by plotting a graph Specific Capacity (mAhg-1) vs. Cycle number, we can observe
how the capacity of the electrode evolves with the number of cycles. Thanks to this, we can

31
determine the Irreversible capacity, which is, the capacity usually lost during the first cycle,
because of some cell activation processes.
Figure 33 Ewe vs. Time plot.
Figure 34 Specific capacity vs. Cycle number plot.
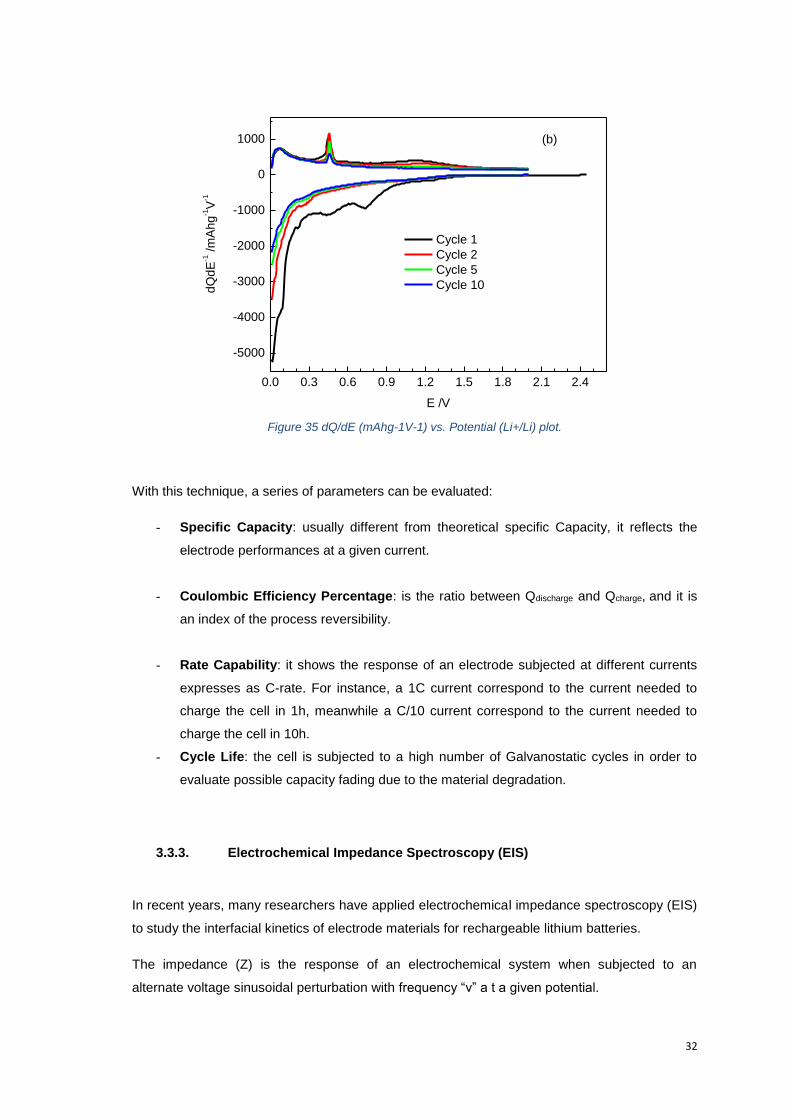
The Differential analysis of the Galvanostatic profile curves (dQ/dE vs. E), instead, allows to
observe in detail the processes occurring on the electrode. Each peak has a particular position,
shape and intensity, and indicates a particular process that has taken place on the electrode.
For example, in the graphite anodes, as mentioned earlier, it is possible to observe the various
steps of formation of the SEI, based on different potential, in which the various structures of the
lithiated graphite (plateau) are formed.
32
0.0 0.3 0.6 0.9 1.2 1.5 1.8 2.1 2.4
-5000
-4000
-3000
-2000
-1000
0
1000
Cycle 1
Cycle 2
Cycle 5
Cycle 10
dQ
dE
-1 /m
Ah
g-1V
-1
E /V
(b)
Figure 35 dQ/dE (mAhg-1V-1) vs. Potential (Li+/Li) plot.
With this technique, a series of parameters can be evaluated:
- Specific Capacity: usually different from theoretical specific Capacity, it reflects the
electrode performances at a given current.
- Coulombic Efficiency Percentage: is the ratio between Qdischarge and Qcharge, and it is
an index of the process reversibility.
- Rate Capability: it shows the response of an electrode subjected at different currents
expresses as C-rate. For instance, a 1C current correspond to the current needed to
charge the cell in 1h, meanwhile a C/10 current correspond to the current needed to
charge the cell in 10h.
- Cycle Life: the cell is subjected to a high number of Galvanostatic cycles in order to
evaluate possible capacity fading due to the material degradation.
3.3.3. Electrochemical Impedance Spectroscopy (EIS)
In recent years, many researchers have applied electrochemical impedance spectroscopy (EIS)
to study the interfacial kinetics of electrode materials for rechargeable lithium batteries.
The impedance (Z) is the response of an electrochemical system when subjected to an
alternate voltage sinusoidal perturbation with frequency “ν” a t a given potential.

33
𝜈 =𝜔
2𝜋
𝑉(𝑡) = 𝑉𝑚𝑠𝑒𝑛(𝜔𝑡)
𝐼(𝑡) = 𝐼𝑚𝑠𝑒𝑛(𝜔𝑡 + 𝜃)
Where θ is the phase-shift associated with the elements that compose the cell.
In this case, the resulting impedance is: 𝑍 =𝑉(𝑡)
𝐼(𝑡)
For sufficiently low currents, Z is independent from the applied voltage and depends only on the
perturbation frequency. Common chemical and physical processes, which occur at the
interface, can be approximated by simple circuit elements like:
- Rs is electrolyte resistance.
- Rct is charge transfer resistance that occurs at the electrolyte/electrode interface.
- Cdl is the double layer capacity associated with charge accumulation processes at
electrolyte/electrode interface.
- RSEI is the resistance value associated to the Solid Electrolyte Interphase.
Figure 36 Circuit element definition.
It is also important to recall that the impedance of elements in series is additive, while the
impedance of elements in parallel is the inverse of the sum of the inverse of impedances as
shown in Figure 37.
Figure 37 Properties of in series (above) and parallel circuit element (below).

34
All circuit elements can be expressed as Constant Phase Element (CPE), when it is not
possible to approximate an interfacial process with a circuit element. The CPE value is defined
as follow:
𝑍 = 𝐴(𝑗𝜔)−𝛼
Where A and α are system parameters. Particularly, α can take any value between -1 and +1:
- If α=-1, then Z= jωL behaves as a Inductance,
- If α=0, then Z=R and CPE behaves as a Resistor,
- If α=1, then Z=1/jωC and CPE behaves as a Capacitor.
- If α=1/2, then A = RD(1/τ1/2), where RD is the resistance value associated with diffusion
and τ is the diffusion process time. In this case, the element is called Warburg
Impedance.
The representation that is most useful to represent and to analyse the data obtained, is that in
the complex plane, where the imaginary part of the impedance Zimm, is in function of the real
part Zreal in the analysed frequency range. Such representation, which takes the name of the
graph of Nyquist, is a representation in which the independent variable is constituted by the
angular frequency ω = 2πν. In Figure 38, a simulation of impedance spectra for an RC circuit is
shown.
Figure 38 Nyquist plot of an ideal parallel RC circuit.
If we add an ideal resistive element (R1) in series with the previous RC circuit, we obtain the
same representation, but shifted by a value R1 along the real axis. Another case is the
presence of two RC sub-circuits. In this case, we have two semicircles close to each other or a
convolution of both: this depends on their frequency values. If ω2≈ω1, we have two well-
resolved semicircles, otherwise we have convolution of semicircles, if ω2>>ω1.

35
Figure 39 a) RC, b) R1(RC) and c) (R1C)(R2C) equivalent circuits.
EIS data are usually analysed in terms by equivalent circuit analysis. The behaviour of an
electrochemical system is described in terms of an equivalent electrical circuit, and numerical
parameters related to this model circuit (as values of resistances, capacitances, etc.) are
calculated by fitting the experimental data with dedicated software (e.g. Boukamp’s EQVCRT).
The calculated values of the model parameters, that match most to the experimental impedance
spectrum, are used to describe the behaviour of the electrochemical system. In order to do this,
a non-linear least squares fitting algorithm (NLLS) is used. This algorithm finds the model’s
parameters in the following way:
- Initial estimate of the model's parameters;
- NLLS algorithm change one parameter value and calculate the fit. If the change
improves the fit, the parameter is accepted. If the change worsens the fit, the old
parameter is retained;
- A different parameter is changed;
- The test is repeated until the best fit is obtained (we previously define an acceptance
criterion or a maximum number of iterations).
Sometimes the data do not converge to a useful fit. This can be due to several factors like an
incorrect model, poor estimates of initial values or inaccurate data acquisition.

36
4. Synthesis, Characterization and Optimization of Manganese (II) Oxide-based
anodes for Li-Ion Batteries.
4.1. Introduction
In my thesis work, I studied the optimization of the electrode formulation to improve the
electrochemical performance of anode materials. In particular, I studied the conversion oxides
as anode materials, thanks to their high abundancy, low cost and high theoretical capacity. The
first conversion material I studied was the Manganese (II) Oxide.
Manganese (II) oxide is an inorganic compound with chemical formula MnO. It forms green
crystals, and as many monoxides, adopts the rock salt structure, where cations and anions are
both octahedrally coordinated as shown in Figure 40.
Figure 40 MnO crystal structure [Halite (cubic) cf8].
MnO reacts with metallic Lithium through a conversion mechanism. When discharged,
manganese (II) oxide reacts with Li+ ions and forms metal nano-domains (Mn0) dispersed in the
Li2O matrix, as shown in the following reaction:
Manganese (II) Oxide has many potential applications in the fields of high-density magnetic
recording, catalysis, energy storage, and energy generation [26, 27]. MnO could be a promising
compound, used as an anode material in Lithium-Ion batteries, due to its relatively high
theoretical capacity (755 mAhg-1) with respect to graphite theoretical capacity (372 mAhg-1), and
low overpotential [28]. Additionally, its discharge potential (≈ 0.5 - 0.6 V vs. Li+/Li) is moderate,
which avoids the formation of lithium dendrites ad thereby makes the battery safer. Among the
studied binary oxides, the feasibility of a conversion reaction in manganese oxides has not
attracted much attention, likely because Manganese is among the most difficult 1st row transition

37
metals to reduce into a metallic state [29]. The kinetic properties of the MnO anodes are not yet
fully understood, and further investigations and studies are needed in order to understand the
behavior of this material, and in general, the behavior of the conversion oxides.
The following sections describe the optimization of electrode formulation using a commercial
MnO, through replacement of binder, pressing of the anodes at different pressures, increase in
the percentage of conductive agent (SC65 up to 20%), use of a dispersing agent (Triton X-100),
carbon- and superficial golden-coating, use of VC as electrolyte additive and optimization of
working potential range.
4.2. Experimental
4.2.1. Electrode processing procedure
The experiments were performed using commercial MnO powder (Sigma-Aldrich −60 mesh,
99%) without further purification. Electrodes have been prepared with the same procedure. The
active material and Super C65 conductive additive were mixed in an agate mortar for 20
minutes, added to the binder solution, and left under magnetic stirring overnight. The slurry
were casted on a copper foil collector using the “Doctor Blade” technique at 150 µm and dried in
air at temperature, depending on used binder. In the Table 10, the optimized drying condition for
each binder are listed.
Binder Drying Condition
PVDF 2h at 50°C
Na-CMC Overnight at r.t.
PAA 2h at 70°C
Table 10 Drying condition for several binders.
Then, 9mm-diameter circular electrodes were cut and pressed at different pressure using a
hydraulic press at 4.71 tons/cm2 (HP3) and 7.86 tons/cm2 (HP5) specific pressures.
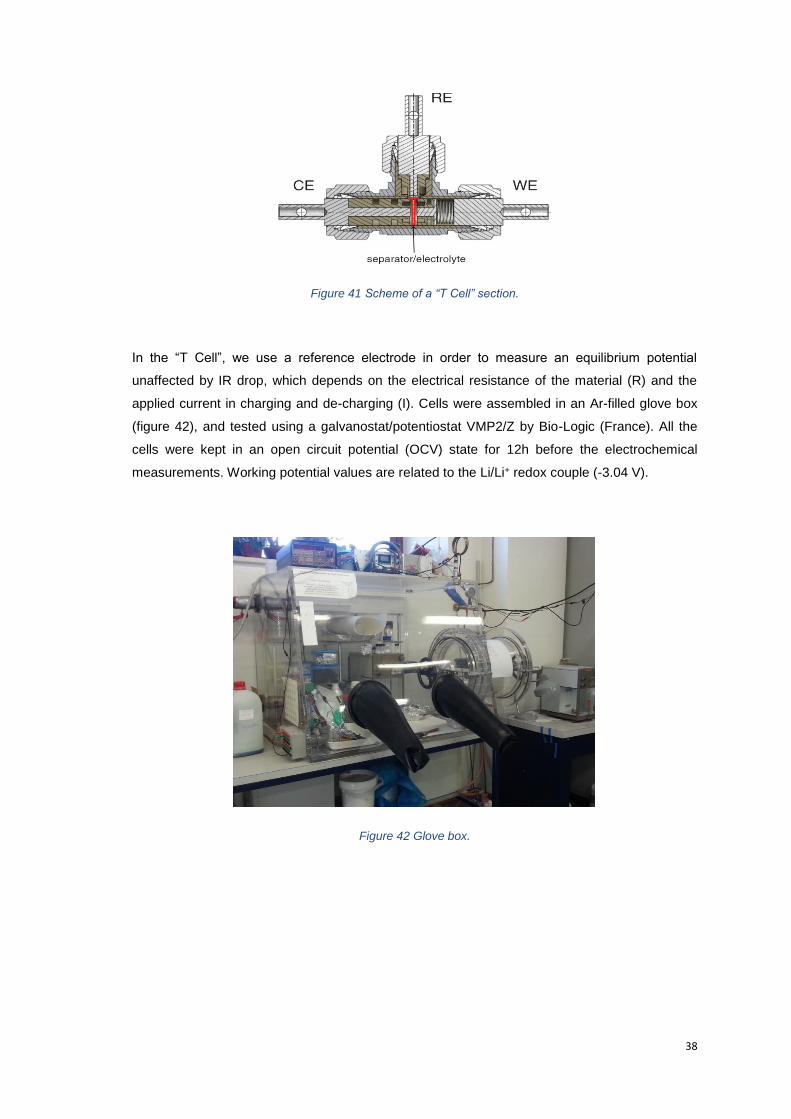
Electrochemical measurements were performed using T-shaped polypropylene Swagelok-type
cells equipped with stainless steel (SS304) current collectors. Disks of high-purity lithium foil
(Aldrich) were used as counter (CE) ad reference electrode (RE). Circular Whatman GF/A glass
fiber 12 mm diameter disks were used as separators and a 1M solution of LIPF6 in EC:DMC 1:1
(Solvionic) was used as electrolyte.
38
Figure 41 Scheme of a “T Cell” section.
In the “T Cell”, we use a reference electrode in order to measure an equilibrium potential
unaffected by IR drop, which depends on the electrical resistance of the material (R) and the
applied current in charging and de-charging (I). Cells were assembled in an Ar-filled glove box
(figure 42), and tested using a galvanostat/potentiostat VMP2/Z by Bio-Logic (France). All the
cells were kept in an open circuit potential (OCV) state for 12h before the electrochemical
measurements. Working potential values are related to the Li/Li+ redox couple (-3.04 V).
Figure 42 Glove box.

39
4.2.2. Surface Gold Coating process
Surface gold coating was performed, in order to make the material more conductive. A specific
pre-treatment called Metalation, which consisted in covering the electrode surface with a gold
layer by Physical Vapor Deposition (PVD) method. To find the optimal thick value of gold layer,
in Figure 43 is reported a table containing: current intensity values (Ampere), gold layer
thickness (nm) and deposition time (s). Eventually 15 nm thin gold layer was chosen.
Figure 43 Sputtering diagram for Gold.
4.2.3. Synthesis of Carbon coated MnO (MnO/C)
Starting from the commercial Manganese (II) Oxide, sucrose was added following a 5:1 weight
ratio. Ethanol was added to the mixture, that was treated 1h in Ultrasonic bath (60 W with 0.6
pulse) to improve the material dispersion. Table 11 shows the amount of used substances.
Material Weight
Commercial MnO 5,02108 g
Sucrose 0.99889 g
EtOH 4 ml
Table 11 Slurry composition.

40
After that, the mixture was left overnight at room temperature (20°C) in order to evaporate all
the solvent. At this point, the whole mixture was heated in an oven with the conditions reported
in Table 12:
Gradient 5°C/min
Time 2h
Temperature
600°C
Gas flow Argon
Table 12 Annealing condition.
The resulting MnO/C was analysed by capillary XRD and thermogravimetric analysis (TGA).
Figure 44 Slurry treated with ultrasound (left) and obtained MnO/C after annealing (right).

41
4.3. Discussion
In order to observe the MnO-related redox processes at quasi-equilibrium condition, a cyclic
voltammetry experiment was performed.
0,0 0,5 1,0 1,5 2,0 2,5 3,0 3,5-3,0
-2,5
-2,0
-1,5
-1,0
-0,5
0,0
0,5
1,0
(D)
(C)
(B)
Cycle 1
Cycle 2
Cycle 3
Cycle 4
Cycle 5
Cycle 6
Cycle 7
Cycle 8
Cycle 9
Cycle 10
I / m
A
Ewe Vs. Li+/Li / V
Scan Rate: 50 µV/s
Potential Range: 0,005V - 3V
(A)
Figure 45 MnO Cyclic Voltammetry at 50µV/s.
In Figure 45, the first ten cyclic voltammogram curves of the electrode are shown. The strong
peak at about 0.02 V in the first cathodic scan, labelled as peak (A), is due to the reduction of
MnO into Mn0 plus reversible lithium insertion from carbon. Furthermore, a phase transition from
a crystalline to an amorphous state could be involved, as in the case for the silicon composite
anode [11]. The peak labelled as (B) is due to the reversible lithium release from carbon. The
broad peaks located at about 1.2 V, labelled as (D), in the anodic scan curves may be attributed
to the Li2O decomposition and re-oxidation of Mn0 to Mn2+. From the second voltammetric scan,
the cathodic processes related to reversible MnO conversion reaction are located at 0.5 V, peak
labelled as (C). All these values are consistent with those obtained by Y. Liu et al. [30].

42
4.3.1. 80:10:10 Electrode formulation
The first layer (MnO-PVdF_#1) was prepared using the traditional binder (PVdF) in order to
have a comparison with the state of the art. In Table 13, its composition is reported.
Slurry Components Weight %
Commercial MnO 80.17 %
Super C65 10.16 %
PVdF 9.67 %
Table 13 MnO-PVdF_#1 composition.
A three-electrode cell was assembled in a glove box, using metal lithium foil as counter and
reference electrode and LiPF6 1M in EC:DMC 1:1 solution as electrolyte. The first tested cells
were cycled in the 0.005 V - 2.00 V working potential range with a specific current of 755 mAg-1
(1C-Rate). All the cells were kept at open circuit potential (OCV) for 12h before starting
electrochemical measurements, in order to allow an appropriate wetting of the electrodes.
0 5 10 15 20 25 30 35 40 45 500
100
200
300
400
500
600
700
800
900
1000
1100
1200
1300
1400
MnO-PVDF_#1
Lithium Release
Lithium Uptake
A.M. = 1,3869 mg
Loading = 2,1806 mg/cm2
C-Rate = 1C
Sp
ecific
Ca
pa
city /m
Ah
g-1
Cycle Number
0
20
40
60
80
100
Co
ulo
mb
ic E
ffic
ien
cy %
Figure 46 MnO-PVdF_#1 electrochemical performances.

43
During the first discharge step, the Coulombic efficiency was low (≈ 46%) and this is probably
due to the irreversible processes related to SEI formation during the first discharge, together
with the first conversion of pristine MnO particles to Mn0 embedded in a Li2O matrix. The
pristine MnO is reduced to Mn0 after discharging to 0.005 V and part of reduced Mn0 was not
oxidized to Mn++ after charging to 2.000 V, which partially explains the possible origin of initial
irreversible capacity loss [31].
After 50 cycles, the electrode showed a specific capacity of about 150 mAhg-1 at 1C rate (755
mAg-1), a higher value respect to the electrochemical performance of the electrodes found in
literature, which show specific capacity of about 50 mAhg-1, at very low specific current of 80
mAg-1 (≈ C/10 rate) [30]. As mentioned above, during charge/discharge cycles of conversion
materials, there is a strong reorganization of the chemical species [25], which leads to a large
volume change, resulting in pulverisation, loss of contact with the current collector and poor
cyclic performance.
In order to evaluate the effect of the polymeric binder on cycling performance, Na-CMC and
high molecular weight PAA (Mw = 450000) were chosen as alternative candidates to the
standard PVdF/NMP system. For the Na-CMC and PAA-based layer, ultrapure water and
ethanol were used as solvents, respectively. Since the MnO is almost insoluble in Na-CMC, all
the slurries were subjected to a preliminary ultrasonic treatment for 2h - 50W power and 0.6 s
pulse - in order to improve homogeneity and dispersion of the active material. In Table 14, the
compositions of the tested slurries are listed.
Layer name Commercial
MnO
Super C65 Na-CMC PAA
(Mw 450000)
MnO-CMC_#1 80.07 % 11.89 % 8.04 % ----------
MnO-PAA_#2 80.26 % 9.85 % ---------- 9.89 %
MnO-PAA_#3 79.39 % 10.36 % ---------- 10.25 %
MnO-PAA_#4 79.91 % 10.11 % ---------- 9.98 %
Table 14 Percentage composition of layers with Na-CMC and PAA as binders.

44
0 5 10 15 20 25 30 35 40 45 500
100
200
300
400
500
600
700
800
900
1000
1100
1200
1300
1400
MnO-CMC_#1
Lithium Release
Lithium Uptake
A.M. = 1,3171 mg
Loading = 2,0710 mg/cm2
C-rate = 1C
Spe
cific
Ca
pa
city /m
Ahg
-1
Cycle Number
0
10
20
30
40
50
60
70
80
90
100
110
Co
ulo
mb
ic E
ffic
ien
cy %
a)
0 5 10 15 20 25 30 35 40 45 500
100
200
300
400
500
600
700
800
900
1000
1100
1200
1300
1400
1500
1600
MnO-PAA_#2
Lithium Release
Lithium Uptake
A.M.= 0,8962 mg
Loading = 1,4092 mg/cm2
C-Rate = 1C
Sp
ecific
Ca
pa
city / m
Ah
g-1
Cycle Number
0
10
20
30
40
50
60
70
80
90
100
110
Co
ulo
mb
ic E
ffic
ien
cy %
b)
Figure 47 MnO-CMC_#1 (a) and MnO-PAA_#2 (b) electrochemical performances.

45
The use of these binders led to a significant increase of the specific capacity: after 50 cycles,
the cell showed specific capacities of 275 mAhg-1 and 202 mAhg-1, for the layers with Na-CMC
and PAA respectively. Regarding the initial Coulombic Efficiency, the use of Na-CMC as binder
led to an increase up to 71%, while in the PAA case, the value remains on 40%, in line with
PVdF.
The variation of certain key parameters, such as the pressure with which the electrodes are
pressed was considered, in order to improve the electrode processing procedure. An optimized
pressure value can lead to an improvement in the electrical contact between the active material
and the collector. Too high values of pressure, however, can have adverse effects on electrode
performance, as they tend to decrease the porosity of the electrode, which influences its
wettability and therefore the active surface of the active material.
In Figure 48, the galvanostatic cycling tests related to pressure optimization with different
binders are presented. HP3 and HP5 were pressed at 4.71 tons/cm2 and 7.86 tons/cm2,
respectively.
0 5 10 15 20 25 30 35 40 45 500
100
200
300
400
500
600
700
800
900
1000
1100
1200
1300
1400
MnO-PVDF_#1_HP3
Lithium Release
Lithium Uptake
A.M. = 1,3629 mg
Loading = 2,1429 mg/cm2
C-Rate = 1C
Sp
ecific
Ca
pa
city / m
Ah
g-1
Cycle Number
a)0
10
20
30
40
50
60
70
80
90
100
110
Co
ulo
mb
ic E
ffic
ien
cy %
0 5 10 15 20 25 30 35 40 45 50
0
100
200
300
400
500
600
700
800
900
1000
1100
1200
1300
1400
MnO-CMC_#1_HP3
Lithium Release
Lithium Uptake
A.M. = 1,3772 mg
Loading = 2,1654 mg/cm2
C-rate = 1C
Spe
cific
Ca
pa
city /m
Ahg
-1
Cycle Number
b)0
10
20
30
40
50
60
70
80
90
100
110
Co
ulo
mb
ic E
ffic
ien
cy %
0 5 10 15 20 25 30 35 40 45 500
100
200
300
400
500
600
700
800
900
1000
1100
1200
1300
1400
MnO-PAA_#3_HP3
Lithium Release
Lithium Uptake
M.A. = 1,3496 mg
Loading = 2,1221 mg/cm2
C-Rate = 1C
Sp
ecific
Ca
pa
city /m
Ah
g-1
Cycle Number
c)0
10
20
30
40
50
60
70
80
90
100
110
Co
ulo
mb
ic E
ffic
ien
cy %
0 5 10 15 20 25 30 35 40 45 500
100
200
300
400
500
600
700
800
900
1000
1100
1200
1300
1400
Lithium Release
Lithium Uptake
A.M. = 1,2464 mg
Loading = 1,9598 mg/cm2
C-Rate = 1C
Spe
cific
Ca
pa
city /m
Ahg
-1
Cycle Number
d)0
10
20
30
40
50
60
70
80
90
100
110
MnO-PAA_#3_HP5
Co
ulo
mb
ic E
ffic
ien
cy %
Figure 48 Electrochemical performances at different pressure of MnO-PVdF_#1_HP3 (a), MnO-CMC_#1_HP3 (b), MnO-PAA_#3_HP3 (c) and MnO-PAA_#3_HP5 (d).

46
The best specific capacity was obtained using PAA as a binder at a specific pressure of 7.86
tons/cm2 (HP5). The electrode resulted in a specific capacity of 296 mAhg-1 at the 50th cycle
with an initial coulombic efficiency of 43%, slightly lower than 50% of Na-CMC-based electrode.
Table 15 reports the electrochemical performances of the electrodes shown in Figure 48.
Electrode name
Initial
coulombic
efficiency
Specific
capacity at 50th
cycle
Capacity
retention at 50th
cycle
MnO-PVdF_#1_HP3 46 % 196 mAhg-1 42 %
MnO-CMC_#1_HP3 50 % 282 mAhg-1 56 %
MnO-PAA_#3_HP3 45 % 290 mAhg-1 57 %
MnO-PAA_#3_HP5 43 % 296 mAhg-1 54 %
Table 15 Summary of electrochemical performances on MnO-PVdF_#1_HP3, MnO-CMC_#1_HP3, MnO-PAA_#3_HP3 and MnO-PAA_#3_HP5 electrodes.
In Figure 49 (a), the galvanostatic profiles of the MnO-PAA_#3_HP5 electrode are shown. The
first discharge cycle profile shows a pseudo-plateau in 0.500 V - 0.200 V range, which
corresponds to the MnO reduction, while in the first charge cycle profile a plateau at about
1.200 V is present, which corresponds to the re-oxidation of metal nanoparticles. The results
are consistent with the voltammetry.
As hypothesized, Na-CMC and PAA binders provided more stability to the conversion material-
based electrodes, which undergo a large volume change. The different behavior could be
attributed to the different binder porosity, as well.

47
0 250 500 750 1000 1250 1500
0,0
0,5
1,0
1,5
2,0
2,5
3,0
3,5
4,0
MnO-PAA_#3_HP5
Ew
e V
s L
i+/L
i /V
Specific Capacity /mAhg-1
Cycle 1
Cycle 2
Cycle 5
Cycle 10
Cycle 20
Cycle 50
Cycle 100
a)
0,0 0,5 1,0 1,5 2,0 2,5 3,0 3,5
-13
-12
-11
-10
-9
-8
-7
-6
-5
-4
-3
-2
-1
0
1
2
3
MnO-PAA_#3_HP5
dQ
/dE
/m
Ah
V-1
Ewe Vs Li+/Li /V
Cycle 1
Cycle 2
Cycle 5
Cycle 10
Cycle 20
Cycle 50
Cycle 100
b)
Figure 49 Galvanostatic profiles (a) and the Differential analysis (b) of MnO-PAA_#3_9mm_10_HP5 electrode.
.

48
The next step was to find the optimal working potential range. In the first electrodes, a working
potential range of 0.005 V - 2.000 V has been used because of the thermodynamic value for
dissolution/oxidation of the manganese, as defined by its standard potential (e.g. Mn(s) to Mn++
at 1.960 V vs. Li+/Li).
Conversion materials shown, beyond the SEI formation, the growth of a polymer/gel-like film,
whose formation/dissolution around the transition metal oxide particles depends on working
potential range. This passivation layer, due to a catalysed electrolyte reduction, is maintained
when the cut-off value is below 1.800 V. With a 3.000 V cut-off value, an improved dissolution
process of the gel-like layer was hypothesized, thus increasing electrode performances [32]. For
this reason the upper cut-off value was increased, and a 0.005 V - 3.000 V working potential
range was applied.
0 5 10 15 20 25 30 35 40 45 500
100
200
300
400
500
600
700
800
900
1000
1100
1200
1300
1400
Lithium Release
Lithium Uptake
A.M. = 1,2544 mg
Loading = 1,9723 mg/cm2
C-Rate = 1C
Spe
cific
Ca
pa
city /m
Ahg
-1
Cycle Number
0
20
40
60
80
100
MnO-PAA_#3_HP5
Co
ulo
mb
ic E
ffic
ien
cy %
Figure 50 MnO-PAA_#3_HP5 electrochemical performances.
The increase of the upper potential cut-off, allowed to obtain an increase in specific capacity up
to 360 mAhg-1, a 20% improvement compared to the electrode cycled in the 0.005 V- 2.000 V.
The Initial Coulombic Efficiency remains on 50-60 %.

49
4.3.2. Au-coating
Since one of the main problems of the conversion transition metal oxides is the low conductivity,
the influence of a surface coating made of gold was evaluated. In Figure 51, the electrochemical
performances of MnO-PAA_#4_HP5_GoldCoated are shown.
0 10 20 30 40 50 60 70 80 90 100 1100
100
200
300
400
500
600
700
800
900
1000
1100
1200
1300
1400
1500
1600
MnO-PAA_#4_HP5_GoldCoated
Lithium Release
Lithium Uptake
A.M. = 1,2865 mg
Loading = 2,0228 mg/cm2
C-Rate = 1C
Spe
cific
Ca
pa
city /m
Ahg
-1
Cycle Number
0
20
40
60
80
100
Co
ulo
mb
ic E
ffic
ien
cy %
Figure 51 MnO-PAA_#4_HP5_GoldCoated.
Although the gold coating should increase the electrode conductivity, there was not any
improvement in terms of specific capacity and coulombic efficiency. The only improvement is
the flat trend of the specific capacity, which remains constant on 340 mAhg-1 even after 100
cycles. An explanation for this behavior could be that the electrode surface coating was not as
effective as when the coating is made on the single particles.
4.3.3. Carbon coating
Carbon coating on MnO particles were evaluated as well. The synthetized MnO/C was
subjected to various characterizations techniques to evaluate the actual success of the heat
treatment and the absence of any other oxide impurities. A small amount of sample was
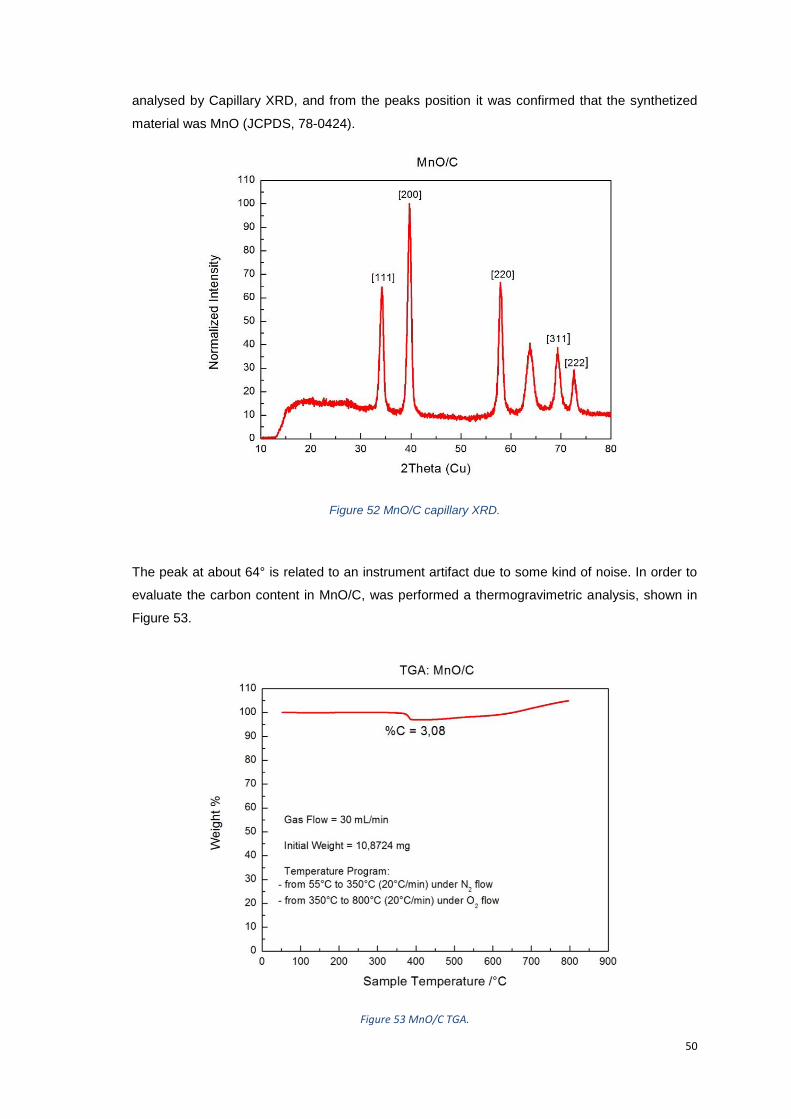
50
analysed by Capillary XRD, and from the peaks position it was confirmed that the synthetized
material was MnO (JCPDS, 78-0424).
Figure 52 MnO/C capillary XRD.
The peak at about 64° is related to an instrument artifact due to some kind of noise. In order to
evaluate the carbon content in MnO/C, was performed a thermogravimetric analysis, shown in
Figure 53.
Figure 53 MnO/C TGA.

51
From the thermogravimetric plot, it can be seen that from 350 ° C to 400 ° C, there was a
decrease in the weight of about 3%, due to the loss of carbon as CO2. After this temperature
range, however, the weight begun to increase, probably due to the oxidizing atmosphere that
reacted with MnO to give other oxides. Eventually, it was confirmed that the synthetized
material was MnO with a 3% of Carbon Coating. This material was tested with PVdF and PAA
as binders, to assess an increase in electrochemical performance due to a hypothesized
increase in electrical conductivity. In Figure 54, the cyclic behaviour of the tested electrodes is
reported.
-5 0 5 10 15 20 25 30 35 40 45 50 550
100
200
300
400
500
600
700
800
900
1000
1100
1200
1300
1400
1500
MnO/C-PVDF
Lithium Release
Lithium Uptake
A.M. = 1,2017 mg
Loading = 1,8895 mg/cm2
C-Rate = 1C
Sp
ecific
Ca
pa
city /m
Ah
g-1
Cycle Number
a)0
10
20
30
40
50
60
70
80
90
100
110
Co
ulo
mb
ic E
ffic
ien
cy %
-5 0 5 10 15 20 25 30 35 40 45 50 550
100
200
300
400
500
600
700
800
900
1000
1100
1200
1300
1400
1500
MnO/C-PAA
Lithium Release
Lithium Uptake
A.M. = 0,872 mg
Loading = 1,3710 mg/cm2
C-Rate = 1C
Sp
ecific
Ca
pa
city /m
Ah
g-1
Cycle Number
b)0
10
20
30
40
50
60
70
80
90
100
110
Co
ulo
mb
ic E
ffic
ien
cy %
Figure 54 Electrochemical performances of MnO/C with PVDF (a) and PAA (b) as binders.

52
This attempt to improve conductivity of the active material did not provide the expected results,
perhaps because of problems inherent to the material. Indeed, after 50 cycles, specific capacity
values of 310 mAhg-1 and 340 mAhg-1 for PVdF and PAA are obtained, respectively. Thus, the
carbon-coated material showed worse performance than the pure material, which due to the
lower conductivity was instead expected to exhibit smaller capacities.
0 300 600 900 1200 1500
0,0
0,6
1,2
1,8
2,4
3,0
MnO/C-PAA
Ew
e V
s L
i+/L
i /V
Specific Capacity /mAhg-1
Cycle 1
Cycle 2
Cycle 5
Cycle 10
Cycle 20
Cycle 50
Cycle 100
Figure 55 Galvanostatic profiles at 755 mAg-1 of MnO/C-PAA_#1_HP5 electrode.
In Figure 55, the galvanostatic profiles of the MnO/C cell cycled at 755 mAg-1 are shown. The
irreversible capacity at the first cycle is very high (799 mAhg-1) and it is caused mainly by the
degradation of the electrolyte and by the formation of the passivation layer. The reduction in
specific capacity was not limited to the first cycle, but also affected the subsequent cycles; in
fact, the specific capacity reached the value of 350 mAhg-1 at cycle 100.

53
0,0 0,5 1,0 1,5 2,0 2,5 3,0-9
-8
-7
-6
-5
-4
-3
-2
-1
0
1
MnO/C_PAAd
Q/d
E /m
AhV
-1
Ewe Vs Li+/Li /V
Cycle 1
Cycle 2
Cycle 5
Cycle 10
Cycle 20
Cycle 50
Cycle 100
Figure 56 Differential analysis of MnO/PAA_#1¬_HP5 electrode.
A greater understanding of the phenomena that occur at the electrodes can be derived from the
differential analysis in Figure 56. The peaks present in the analysis are those typical for
Manganese (II) Oxide: the only oddity is the shift of the cathodic scan peaks at 0.5 V (MnO
decomposition) toward lower potential, in the 50th and 100th cycles. This is probably due to the
aggregation of active material and/or conductive additive (Super C65) that increases the cell
resistance during cycling, shifting the peaks toward lower potential.
These electrodes have also been tested at different C-rates with a Rate Capability protocol,
useful for assessing electrodic performance at different charge / discharge currents. When the
current density increases, the higher ohmic polarization hinders a complete active material
utilization.

54
0 5 10 15 20 25 30 35 400
100
200
300
400
500
600
700
800
900
1000
1100
1200
1300
1400
MnO/C-PVDF
Lithium Release
Lithium Uptake
A.M. = 1.1619 mg
Loading = 1.8259 mg/cm2
Spe
cific
Ca
pa
city /m
Ahg
-1
Cycle Number
C/20
C/10C/5
C/21C
2C
5Ca)
0 5 10 15 20 25 30 35 400
100
200
300
400
500
600
700
800
900
1000
1100
1200
1300
1400
MnO/C-PAA
Lithium Release
Lithium Uptake
A.M. = 0.8720 mg
Loading = 1.3710 mg/cm2
Spe
cific
Ca
pa
city /m
Ahg
-1
Cycle Number
C/20
C/10
C/5
1C
2C
5C
C/2
b)
Figure 57 Rate capability of MnO/C-PVdF (a) and MnO/C-PAA (b).

55
4.3.4. 70:20:10 Electrode formulation
Continuing with an optimization strategy to improve the electrodic performance, the chemical
formulation of the initial slurry was changed by increasing the amount of conductive additive
(Super C65).
Figure 58 Improved contact between the active material (white dot) and the carbon black (black dot) conductive additive.
The Super C65 is a conductive carbon black, which is normally added to the slurry composition
in order to improve the particle-to-particle electrical contact. For this reason, trying to optimize
electrochemical performances also at a slurry formulation level, an increased quote of Super
C65, i.e. 20% was tested.
Slurry components Weight %
Commercial MnO 69,72 %
Super C65 20,18 %
PAA (Mw 450.000) 10,09 %
Table 16 MnO-PAA_#5 composition.
As reported in Figure 59, a large increase in specific capacity and a much improved electrode
stability throughout the test was obtained. This electrode, with a capacity retention of 89.6%,
shows an initial specific capacity of 1349 mAhg-1, a specific capacity of 564 mAhg-1 after 50
cycles, which slightly decreased until 552 mAhg-1 at the 100th cycle.

56
-10 0 10 20 30 40 50 60 70 80 90 100 1100
100
200
300
400
500
600
700
800
900
1000
1100
1200
1300
1400
Co
ulo
mb
ic E
ffic
ien
cy %
MnO-PAA_#5_HP5
Lithium Release
Lithium Uptake
A.M. = 1.1713 mg
Loading = 1.8417 mg/cm2
C-Rate = 1C
Sp
ecific
Ca
pa
city /m
Ah
g-1
Cycle Number
0
20
40
60
80
100
Figure 59 Electrochemical performances of MnO-PAA_#5_HP5 electrode.
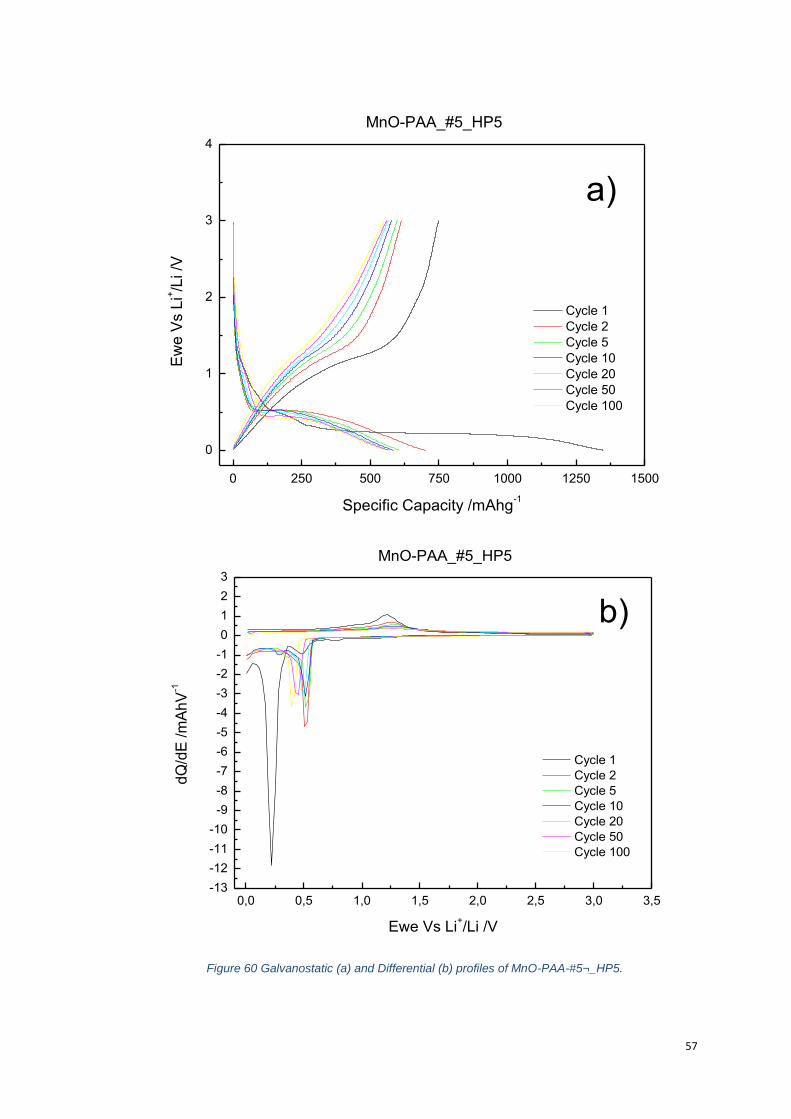
57
0 250 500 750 1000 1250 1500
0
1
2
3
4
MnO-PAA_#5_HP5
Ew
e V
s L
i+/L
i /V
Specific Capacity /mAhg-1
Cycle 1
Cycle 2
Cycle 5
Cycle 10
Cycle 20
Cycle 50
Cycle 100
a)
0,0 0,5 1,0 1,5 2,0 2,5 3,0 3,5-13
-12
-11
-10
-9
-8
-7
-6
-5
-4
-3
-2
-1
0
1
2
3
MnO-PAA_#5_HP5
dQ
/dE
/m
AhV
-1
Ewe Vs Li+/Li /V
Cycle 1
Cycle 2
Cycle 5
Cycle 10
Cycle 20
Cycle 50
Cycle 100
b)
Figure 60 Galvanostatic (a) and Differential (b) profiles of MnO-PAA-#5¬_HP5.

58
The higher amount of carbon increases inter-particle conductivity, enabling a larger active
material utilization. Nevertheless, the dispersion of the active material in the slurry continued to
be a problem: the prepared layers showed surface defects such as bubbles and cracks, which
compromised the active material cohesion to the current collector surface. For this reason, the
use of surfactants was tested in order to improve the dispersion of the hydrophobic Super C65
in polar solvents [33], thus simplifying and improving the stratification process.
Figure 61 Common MnO-PAA layer with bubbles and aggregation of active material.
Surfactants are amphiphilic species, which have both hydrophilic and hydrophobic groups. The
hydrophobic group is usually a short carbonaceous chain that adsorbs the conductive additive,
and decreases the interfacial energy between the polar solvent and the SC65, improving the
particles dispersion. A commercial, non-ionic surfactant named Triton X-100® (BASF) was
used, which has an hydrophilic polyethylene oxide chain and an hydrophobic aromatic
hydrocarbon moiety (4-(1,1,3,3-tetramethylbutyl)-phenyl group).
Figure 62 Triton X-100® structure.

59
The MnO-PAA_#6_Triton layer was prepared adding about a 2% of Triton X-100® and stirred
magnetically for 24h. In Table 17 the slurry composition is shown.
Slurry components Weight %
Commercial MnO 69.06 %
Super C65 22.01 %
PAA (Mw 450.000) 9.10 %
Triton X-100® 1.83 %
Table 17 Percentage composition of MnO-PAA_#6_Triton layer.
The prepared layer showed improved homogeneity and absence of surface defects thanks to
the presence of the surfactant in the slurry.
Figure 63 MnO-PAA_#6_Triton layer.
Once confirmed the usefulness of Triton X-100® in the preparation of the layers, we have
evaluated the electrodic performance considering the improved dispersion of materials. In
Figure 64, MnO-PAA_#6_Triton_HP5 electrode cycling performances are reported.
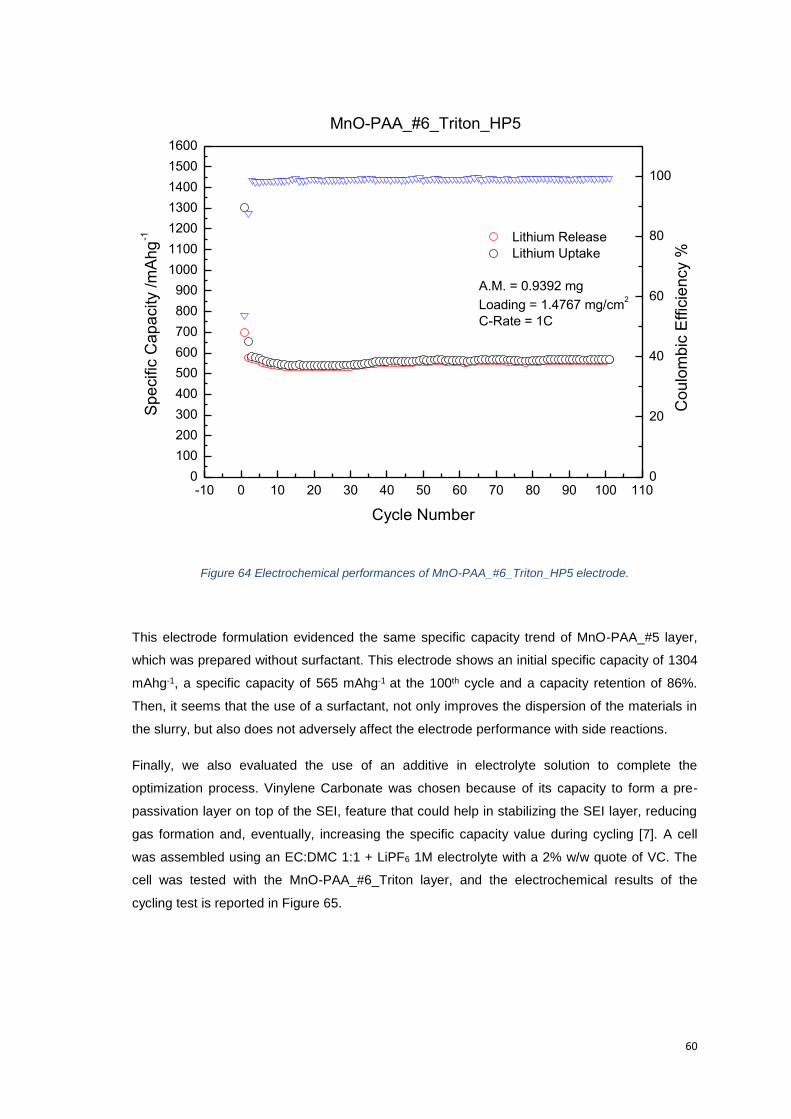
60
-10 0 10 20 30 40 50 60 70 80 90 100 1100
100
200
300
400
500
600
700
800
900
1000
1100
1200
1300
1400
1500
1600
Co
ulo
mb
ic E
ffic
ien
cy %
MnO-PAA_#6_Triton_HP5
Lithium Release
Lithium Uptake
A.M. = 0.9392 mg
Loading = 1.4767 mg/cm2
C-Rate = 1C
Spe
cific
Ca
pa
city /m
Ahg
-1
Cycle Number
0
20
40
60
80
100
Figure 64 Electrochemical performances of MnO-PAA_#6_Triton_HP5 electrode.
This electrode formulation evidenced the same specific capacity trend of MnO-PAA_#5 layer,
which was prepared without surfactant. This electrode shows an initial specific capacity of 1304
mAhg-1, a specific capacity of 565 mAhg-1 at the 100th cycle and a capacity retention of 86%.
Then, it seems that the use of a surfactant, not only improves the dispersion of the materials in
the slurry, but also does not adversely affect the electrode performance with side reactions.
Finally, we also evaluated the use of an additive in electrolyte solution to complete the
optimization process. Vinylene Carbonate was chosen because of its capacity to form a pre-
passivation layer on top of the SEI, feature that could help in stabilizing the SEI layer, reducing
gas formation and, eventually, increasing the specific capacity value during cycling [7]. A cell
was assembled using an EC:DMC 1:1 + LiPF6 1M electrolyte with a 2% w/w quote of VC. The
cell was tested with the MnO-PAA_#6_Triton layer, and the electrochemical results of the
cycling test is reported in Figure 65.

61
0 10 20 30 40 50 60 70 80 90 100 1100
100
200
300
400
500
600
700
800
900
1000
1100
1200
1300
1400
MnO-PAA_#6_Triton_HP5 + 2% VC
Co
ulo
mb
ic E
ffic
ien
cy %
Lithium Release
Lithium Uptake
A.M. = 0.877 mg
Loading = 1.3789 mg/cm2
C-rate = 1C
Spe
cific
Ca
pa
city /m
Ahg
-1
Cycle Number
0
20
40
60
80
100
Figure 65 Electrochemical performances of MnO-PAA_#6_Triton_HP5 electrode using a VC (2%) as electrolyte additive
The cell was cycled at 755 mAg-1 (1C) current density, showing an initial specific capacity of
1374 mAhg-1, a very high specific capacity of 696 mAhg-1 after 50 cycles, which reached the
725 mahg-1 value after 100 cycles. The capacity retention has very high value of 95%. In order
to evaluate the long-term performances, the cell was tested beyond 100 cycles. In Figure 66,
the results are shown.
0 25 50 75 100 125 150 175 200 225 250 2750
100
200
300
400
500
600
700
800
900
1000
1100
1200
1300
1400
1500
MnO-PAA_#6_Triton_HP5 + 2% VC
Co
ulo
mb
ic E
ffic
ien
cy %
Lithium Release
Lithium Uptake
A.M. = 0.877 mg
Loading = 1.3789 mg/cm2
C-rate = 1C
Sp
ecific
Ca
pa
city /m
Ah
g-1
Cycle Number
0
20
40
60
80
100
Figure 66 Long-Term protocol of MnO-PAA_#6_Triton_HP5 electrode.

62
The electrode shown a fairly flat specific capacity trend. A decrease in specific capacity occurs
from the 200th cycle that shows a specific capacity of 583 mAhg-1. In Figure 67, Galvanostatic
(a) and Differential (b) profiles of MnO-PAA_#6_Triton_HP5 are shown.
0 250 500 750 1000 1250 1500
0
1
2
3
4
MnO-PAA_#6_Triton_HP5 (2% VC)
Ew
e V
s L
i+/L
i /V
Specific Capacity /mAhg-1
Cycle 1
Cycle 2
Cycle 5
Cycle 10
Cycle 20
Cycle 50
Cycle 100
a)
0,0 0,5 1,0 1,5 2,0 2,5 3,0 3,5-13
-12
-11
-10
-9
-8
-7
-6
-5
-4
-3
-2
-1
0
1
2
3
MnO-PAA_#6_Triton_HP5 (2% VC)
dQ
/dE
/m
Ah
V-1
Ewe Vs Li+/Li /V
Cycle 1
Cycle 2
Cycle 5
Cycle 10
Cycle 20
Cycle 50
Cycle 100
b)
Figure 67 Galvanostatic (a) and Differential (b) profiles of MnO-PAA-#6_Triton¬_HP5.

63
These profiles show the shift toward lower potential in the cathodic scan at 0.5 V, as in the case
of carbon coated electrodes.
As in the case of the MnO/C, a rate capability test, reported in Figure 68, was performed in
order to evaluate the performance of the electrodes subjected to different current densities as
reported in Table 18. .
C-Rate Current density
1C 755 mAg-1
2C 1510 mAg-1
5C 3775 mAg-1
10C 7550 mAg-1
20C 15100 mAg-1
Table 18 MnO current density associated to different C-Rate.
0 5 10 15 20 25 30 35 40 45 50 55 60 65
100
200
300
400
500
600
700
800
900
1000
1100
1200
1300
1400
1500
20C
10C
5C
2C1C1C
MnO-PAA_#6_Triton_HP5 + 2% VC
Lithium Release
Lithium Uptake
A.M. = 0.9392 mg
Loading = 1.4767 mg/cm2
Sp
ecific
Ca
pa
city /m
Ah
g-1
Cycle Number
Figure 68 Rate capability of MnO-PAA_#6_Triton_HP5 electrode.
C-Rate Specific capacity
1C 672 mAhg-1
2C 586 mAhg-1
5C 487 mAhg-1
10C 385 mAhg-1
20C 198 mAhg-1
1C (after 20C cycles) 635 mAhg-1
Table 19 Rate capability values of MnO-PAA_#6_Triton_HP5 electrode.
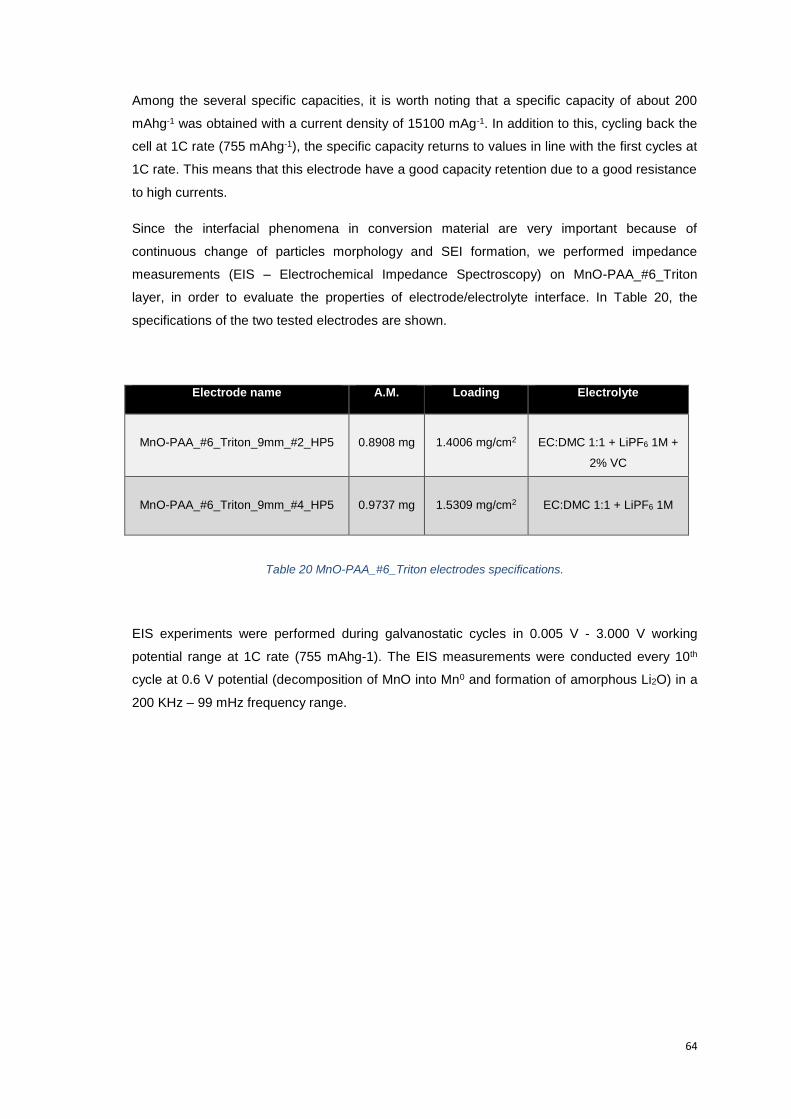
64
Among the several specific capacities, it is worth noting that a specific capacity of about 200
mAhg-1 was obtained with a current density of 15100 mAg-1. In addition to this, cycling back the
cell at 1C rate (755 mAhg-1), the specific capacity returns to values in line with the first cycles at
1C rate. This means that this electrode have a good capacity retention due to a good resistance
to high currents.
Since the interfacial phenomena in conversion material are very important because of
continuous change of particles morphology and SEI formation, we performed impedance
measurements (EIS – Electrochemical Impedance Spectroscopy) on MnO-PAA_#6_Triton
layer, in order to evaluate the properties of electrode/electrolyte interface. In Table 20, the
specifications of the two tested electrodes are shown.
Electrode name A.M. Loading Electrolyte
MnO-PAA_#6_Triton_9mm_#2_HP5
0.8908 mg
1.4006 mg/cm2
EC:DMC 1:1 + LiPF6 1M +
2% VC
MnO-PAA_#6_Triton_9mm_#4_HP5
0.9737 mg
1.5309 mg/cm2
EC:DMC 1:1 + LiPF6 1M
Table 20 MnO-PAA_#6_Triton electrodes specifications.
EIS experiments were performed during galvanostatic cycles in 0.005 V - 3.000 V working
potential range at 1C rate (755 mAhg-1). The EIS measurements were conducted every 10th
cycle at 0.6 V potential (decomposition of MnO into Mn0 and formation of amorphous Li2O) in a
200 KHz – 99 mHz frequency range.
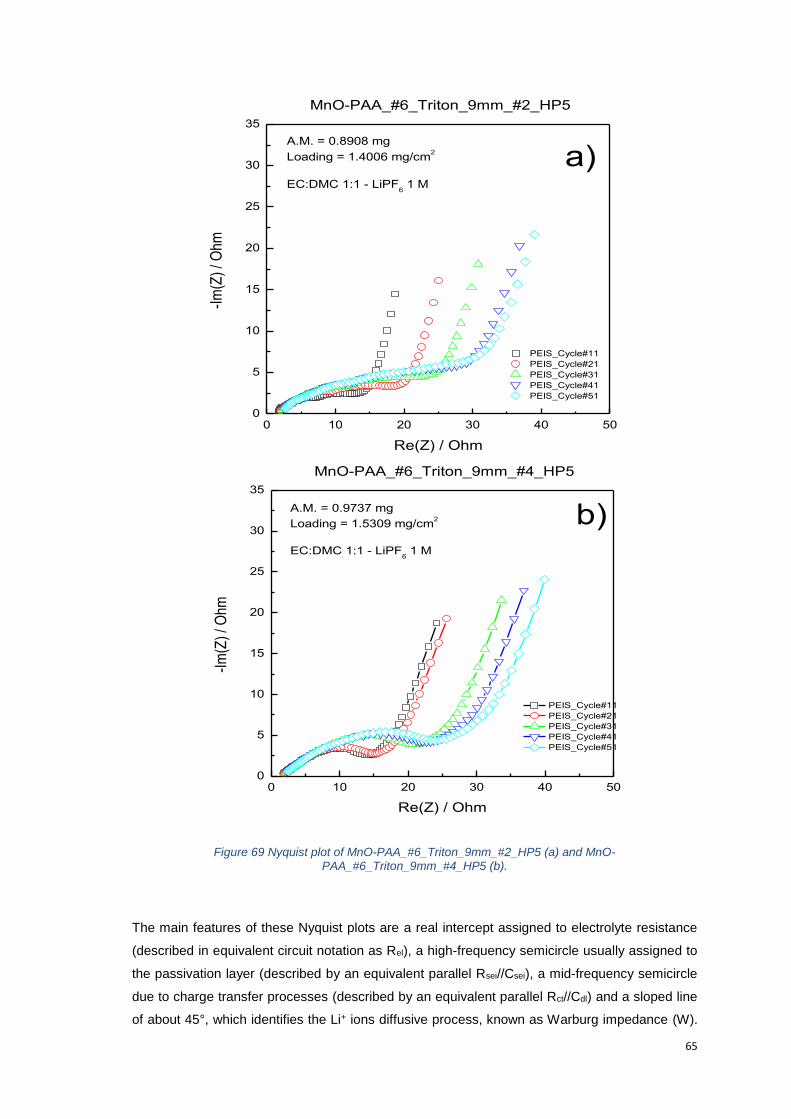
65
0 10 20 30 40 500
5
10
15
20
25
30
35
MnO-PAA_#6_Triton_9mm_#2_HP5
-Im
(Z)
/ Oh
m
Re(Z) / Ohm
PEIS_Cycle#11
PEIS_Cycle#21
PEIS_Cycle#31
PEIS_Cycle#41
PEIS_Cycle#51
A.M. = 0.8908 mg
Loading = 1.4006 mg/cm2
EC:DMC 1:1 - LiPF6 1 M
a)
0 10 20 30 40 500
5
10
15
20
25
30
35
MnO-PAA_#6_Triton_9mm_#4_HP5
-Im
(Z)
/ Ohm
Re(Z) / Ohm
PEIS_Cycle#11
PEIS_Cycle#21
PEIS_Cycle#31
PEIS_Cycle#41
PEIS_Cycle#51
A.M. = 0.9737 mg
Loading = 1.5309 mg/cm2
EC:DMC 1:1 - LiPF6 1 M
b)
Figure 69 Nyquist plot of MnO-PAA_#6_Triton_9mm_#2_HP5 (a) and MnO-PAA_#6_Triton_9mm_#4_HP5 (b).
The main features of these Nyquist plots are a real intercept assigned to electrolyte resistance
(described in equivalent circuit notation as Rel), a high-frequency semicircle usually assigned to
the passivation layer (described by an equivalent parallel Rsei//Csei), a mid-frequency semicircle
due to charge transfer processes (described by an equivalent parallel Rct//Cdl) and a sloped line
of about 45°, which identifies the Li+ ions diffusive process, known as Warburg impedance (W).
66
Since the semicircles are convoluted, a fit by NLLS method would be necessary to determine
the exact contributions of SEI and charge-transfer polarization. However, by simple observation
of the Nyquist plots we can see how the impedance of the two cells increases in the same way
during cycling. This general increase of impedance values is probably due to particles
morphology changes, superficial changes, aggregation phenomena and SEI instability.
4.4. Conclusions
The electrodic optimization of the commercial MnO anodes highlighted several aspects:
- Binder Influence: Among the three used binders, PAA seems to work better than
PVdF and Na-CMC, thanks to its improved mechanical features, which support the
continuous volume changes. Moreover, the use of PAA, in contrast to the traditional
PVdF binder that has been dispersed in expensive and toxic solvents, allows the use of
environment friendly and cheap solvents such as water and ethanol. This also affects
the electrodes production costs, because of the absence of a solvent recovery system
inside the coating plant.
- Pressure Influence: PAA-based electrodes pressed at HP5 showed the best result
respect the HP3 and not pressed electrodes. PVdF and Na-CMC based electrodes
pressed at HP3, shown better performances than the non-pressed electrodes,
nevertheless they shown worse performance than the PAA-based electrodes.
- Working Potential Influence: The 0.005 V - 3.000 V working potential range has
proven to be better with respect to 0.005 V – 2.000 V, since it allows a complete
dissolution/oxidation of the manganese during cycling. This increase in the cut-off value
has allowed a further increase in performances.
- Coating Influence: We performed a gold surface coating and a carbon coating in order
to improve the small conductivity typical of conversion materials. With gold coating, we
observed no improvements in terms of specific capacity and initial coulombic efficiency
percentage, but only a more linear decrease of specific capacities during cycling.
Possible improvements can be obtained by performing a single particles coating. Even
in the case of carbon coated MnO (MnO/C) we obtained comparable performance to
the pure material. This means that probably the conductive problems are inherent to the
material.
- Super C65 Percentage Influence: this is the key of the optimization process. Doubling
the SC65 percentage up to 20%, we obtained a clear improvement of specific
capacities obtaining a specific capacity of 560 mAhg-1 at 1C rate after 50 cycles.

67
- Surfactant influence: The poor solubility of manganese oxide, combined with the high
percentage of super C65, gave considerable problems in the slurry preparation, which
led to a lack of homogeneity in the coated layer. Lastly, the addition of Triton X-100 as
surfactant, has greatly improved the process of preparation and stratification of the
layer.
- Electrolyte Additive Influence: The use of VC as electrolyte additive translated into an
increase in the cyclic life of tested cells and improved capacity values. Moreover,
performing a rate capability test on the optimized electrode, an improved electrode
stability was noticed when high current densities (up to 15 A) were used during
charge/discharge cycles.
In the histogram, we can notice the overall specific capacity improvements respect the
bibliography and non-optimized electrodes
Figure 70 Specific Capacities comparison between bibliography, non-optimized and optimized electrodes.
4.5. Future work
In order to deeply investigate the Manganese (II) oxide performances, as anodic conversion
material for Li-Ion batteries, we have to evaluate several aspects that are listed below.
- Influence of the Active Material particles size: synthesize Manganese (II) oxide
nanoparticles by several methods (sol-gel method, aminolytic reaction etc.) and
evaluate the size influence on the electrochemical performances.
0
100
200
300
400
500
600
700
800
BIBLIOGRAPHY ELECTRODE NON-OPTIMIZEDELECTRODE
OPTIMIZED ELECTRODE
Spec
ific
cap
acit
y /m
Ah
g-1
Specific Capacity after 50 cycles

68
- Synthesis of a Graphene/MnO Nanocomposite: the active material nanoparticles will
be dispersed in a graphene matrix in order to avoid possible re-aggregations, which
could decrease the electrochemical perfomances and the stability of the cell.
- Investigate the electrode/electrolyte interface performing detailed impedance
measurements.
- Study other transition metal oxides, applying the studied optimizations

69
5. References
1. M. Winter, R. J. Brodd, Chemical Reviews, 104 (2004), 4245-4269.
2. Y. Nishi, Journal of Power Sources, 100 (2001) 101.
3. V. Etacheri, R. Marom, R. Elazari, G. Salitra, D. Aurbach, Energy Environ, Sci. 4 (2011)
3243.
4. G.A. Nazri, G. Pistoia, Lithium Batteries – Science and Technology, Kluver Academic
Publishing, 2004.
5. K. M. Shaju, P. G. Bruce, Dalton Trans., 40 (2008) 5471.
6. Z. Chen, J.R. Dahn, J. Electrochem. Soc., 149 (2002), A1184.
7. D. Aurbach, K. Gamolsky, B. Markovsky, Y. Gofer, M. Schmidt. U. Heider,
Electrochimica Acta, 47 (2002), 1423.
8. T. Sasaki, T. Abe, Y. Iriyama, M.Inaba, Z. Ogumia, J. Electrochem. Soc., 152 (2005),
A2046.
9. D. Larcher, S. Beattie, M. Morcrette, K. Edstrom, J.C. Jumas, J.M. Tarascon, Mater.
Chem. 17 (2007), 3759.
10. W.S. Hummers, R.E. Offeman, J. of American Chemical Soc., 80 (1958), 1339-1339.
11. F. Maroni, R. Raccichini, A. Birrozzi, G. Carbonari, R. Tossici, F. Croce, R. Marassi, F.
Nobili, Journal of Power Sources, 269 (2014), 873-882.
12. D. Linden, T.B. Reddy, Handbook of Batteries 3rd edition, Mc Graw-Hill Ed., 35.29.
13. J. Yamaki, S. Tobishima, Handbook of Battery Materials, J. O. Besenhard, ed. Wiley
VCH, Weinheim, (1999), pp. 339-357.
14. M. Inaba, Z. Ogumi, IEEE Electr. Insul. M., 17 (2001), 6
15. M.B. Armand, D.W. Murphy, in J. Broadhead, B.C. Steele (Eds.), Material for Advanced
Batteries, Plenum Press, New York, 1980, p. 145.
16. Y. Wu, J. Power Sources, 111 (2002), 329.
17. W.S. Hummers, R.E. Offeman, J. of American Chem. Soc., 80 (1958) 1339-1339.
18. Y. Zhu, S. Murali, M.D. Stoller, A. Velamakanni, R.D. Piner, R.S. Ruoff, Carbon, 48
(2010), 2118-2122.
19. J.E. Fisher, NATO ASI Series B, 172 (1987) 59.
20. J.R. Dahn, Phys. Rev. B 44 (1991) 9170.
21. M. Winter, J.O. Besenhard, M.E. Spahr, P. Novàk, Advanced Materials, Vol.10 (1998),
725-763.
22. R. Fong, U. Von Sacken, J.R. Dahn, J. Electrochem. Soc., 137 (1990), 2009.
23. M. V. Reddy, G.V. Subba Rao, B.V.R. Chowdari, Chem. Rev., 113 (2013), 5364.
24. K. Candace, H. Peng, G. Liu, K: McIlwrath, X.F. Zhang, R.A. Huggins, Y. Cui., Nature
Nanotechnology, 3.1 (2007) 31-35.
25. J. Cabana, L. Monconduit, D. Larcher, M.R. Palacìn, Advanced Energy Materials, 22
(2010), E170-E192.

70
26. J. Liu, J. Cai, Y.C. Son, Q. Gao, S.L. Suib, M. Aindow, Journal of Physical Chemistry, B
106 (2002), 9761.
27. F. Cheng, J. Shen, T. Zhanliang, J. Chen, Applied Materials and Interfaces, 1 (2009),
460.
28. X.Q. Yu, Y. He, J.P. Sun, K. Tang, H. Li, L.Q. Chen, X.J. Huang, Electrochem.
Communication, 11 (2009), 791.
29. A.J. Bard, R. Parsons, J. Jordan, Standard Potentials in Aqueous Solutions, Marcel
Dekker, Inc., New York 1985.
30. Y. Liu, X. Zhao, F. Li, D. Xia, Electrochimica Acta, Vol.56 (2011), pp. 6448-6452.
31. K.F. Zhong, X. Xia, B. Zhang, H. Li, Z.X. Wang, L.Q. Chen, J. Power Sources, 195
(2010), 3300.
32. S. Laruelle, S. Grugeon, P. Poizot, M. Dollè, L. Dupont, J.M. Tarascon, Journal of The
Electrochemical Society, 149 (2002), A627-A634.
33. W. Porcher, B. Lestriez, S. Jouanneau, D. Guyomard, Journal of Power Sources 195
(2010), 2835-2843.