CONTROLLING STIMULATED BRILLOUIN/RAMAN SCATTERING IN HIGH … · This research addressed...
74
AFRL-RD-PS- AFRL-RD-PS- TR-2017-0043 TR-2017-0043 CONTROLLING STIMULATED BRILLOUIN/RAMAN SCATTERING IN HIGH POWER FIBER LASERS Cody Mart Ben Pulford Khanh Kieu University of Arizona 888 N Euclid Ave Tucson, AZ 85719-4824 9 August 2017 Final Report APPROVED FOR PUBLIC RELEASE. DISTRIBUTION IS UNLIMITED AIR FORCE RESEARCH LABORATORY Directed Energy Directorate 3550 Aberdeen Ave SE AIR FORCE MATERIEL COMMAND KIRTLAND AIR FORCE BASE, NM 87117-5776
Transcript of CONTROLLING STIMULATED BRILLOUIN/RAMAN SCATTERING IN HIGH … · This research addressed...

AFRL-RD-PS- AFRL-RD-PS- TR-2017-0043 TR-2017-0043
CONTROLLING STIMULATED BRILLOUIN/RAMAN SCATTERING IN HIGH POWER FIBER LASERS
Cody Mart Ben Pulford Khanh Kieu
University of Arizona 888 N Euclid Ave Tucson, AZ 85719-4824
9 August 2017
Final Report
APPROVED FOR PUBLIC RELEASE. DISTRIBUTION IS UNLIMITED
AIR FORCE RESEARCH LABORATORY Directed Energy Directorate 3550 Aberdeen Ave SE AIR FORCE MATERIEL COMMAND KIRTLAND AIR FORCE BASE, NM 87117-5776

NOTICE AND SIGNATURE PAGE
Using Government drawings, specifications, or other data included in this document for any purpose other than Government procurement does not in any way obligate the U.S. Government. The fact that the Government formulated or supplied the drawings, specifications, or other data does not license the holder or any other person or corporation; or convey any rights or permission to manufacture, use, or sell any patented invention that may relate to them.
Qualified requestors may obtain copies of this report from the Defense Technical Information Center (DTIC) (http://www.dtic.mil).
AFRL-RD-PS-TR-2017-0043 HAS BEEN REVIEWED AND IS APPROVED FOR PUBLICATION IN ACCORDANCE WITH ASSIGNED DISTRIBUTION STATEMENT.
_________________________________ __________________________________BENJAMIN PULFORD, DR-II, DAF KENTON T. WOOD, DR-IV, DAFWork Unit Manager Chief, Laser Division
This report is published in the interest of scientific and technical information exchange, and its publication does not constitute the Government’s approval or disapproval of its ideas or findings.
PULFORD.BENJAMIN.NOAH.1299674262
Digitally signed by PULFORD.BENJAMIN.NOAH.1299674262Date: 2017.12.14 13:25:59 -07'00'
WOOD.KENTON.T.1151077656
Digitally signed by WOOD.KENTON.T.1151077656Date: 2018.01.12 14:49:55 -07'00'

i
REPORT DOCUMENTATION PAGE Form Approved OMB No. 0704-0188
Public reporting burden for this collection of information is estimated to average 1 hour per response, including the time for reviewing instructions, searching existing data sources, gathering and maintaining the data needed, and completing and reviewing this collection of information. Send comments regarding this burden estimate or any other aspect of this collection of information, including suggestions for reducing this burden to Department of Defense, Washington Headquarters Services, Directorate for Information Operations and Reports (0704-0188), 1215 Jefferson Davis Highway, Suite 1204, Arlington, VA 22202-4302. Respondents should be aware that notwithstanding any other provision of law, no person shall be subject to any penalty for failing to comply with a collection of information if it does not display a currently valid OMB control number. PLEASE DO NOT RETURN YOUR FORM TO THE ABOVE ADDRESS. 1. REPORT DATE08-08-2017
2. REPORT TYPEFinal Report
3. DATES COVERED (From - To)8 July 2015- 8 August 2017
4. TITLE AND SUBTITLE 5a. CONTRACT NUMBER FA9451-15-1-0042
5c. PROGRAM ELEMENT NUMBER
6. AUTHOR(S)
5d. PROJECT NUMBER
Cody Mart, Ben Pulford, Khanh Kieu 5e. TASK NUMBER
5f. WORK UNIT NUMBERD08H 8. PERFORMING ORGANIZATION REPORT
NUMBER 7. PERFORMING ORGANIZATION NAME(S) AND ADDRESS(ES)
University of Arizona 888 N. Euclid Ave Tucson, AZ 85721 9. SPONSORING / MONITORING AGENCY NAME(S) AND ADDRESS(ES) 10. SPONSOR/MONITOR’S ACRONYM(S)Air Force Research Laboratory AFRL/RDLT3550 Aberdeen Ave SEKirtland AFB, NM 87117-5776 11. SPONSOR/MONITOR’S REPORT
NUMBER(S)
AFRL-RD-PS-TR-2017-0043 12. DISTRIBUTION / AVAILABILITY STATEMENT
Approved for public release. Distribution is unlimited.
13. SUPPLEMENTARY NOTES
14. ABSTRACTThis research addressed suppression of stimulated Brillouin/Raman scattering in high power fiber lasers. The workwas done by Mr. Cody Mart under this research grant. Dr. Ben Pulford provided expert mentorship and laboratoryspace at the Air Force Research Lab (AFRL) New Mexico. Mr. Mart successfully defended his dissertation usingthe results reported herein in summer 2017. Detailed discussion of research activities and outcomes are described inthis final report. More information on the research work and background information can be also found in Mr.Mart’s dissertation.
15. SUBJECT TERMSFiber Amplifier, Microstructured Fiber, Stimulated Raman Scattering, Stimulated Brillouin Scattering
16. SECURITY CLASSIFICATION OF: 17. LIMITATIONOF ABSTRACT
18. NUMBEROF PAGES
19a. NAME OF RESPONSIBLE PERSONBenjamin Pulford
a. REPORTUnclassified
b. ABSTRACTUnclassified
c. THIS PAGEUnclassified
SAR 74
19b. TELEPHONE NUMBER (include area code)
505-846-3451Standard Form 298 (Rev. 8-98) Prescribed by ANSI Std. 239.18
Government Purpose Rights
Controlling Stimulated Brillouin/Raman Scattering in High Power Fiber Lasers

ii Approved for public release. Distribution is unlimited.
Table of Contents
1. Summary 1
2. Introduction 1
3. Methods, Assumptions, and Procedures 3
4. Results and Discussion 5
4.1 Experimental and Theoretical Investigations of Stimulated Brillouin
Scattering 5
4.1.1 SBS theory 5
4.1.2 Pump Probe Theory 10
4.1.3 Comparison of Dual Source and Phase Modulator Systems: Phase
Modulator System and Results 15
4.1.4 Comparison of Dual Source and Phase Modulator Systems: Dual
Source System and Results 18
4.1.5 Brillouin Gain Spectroscopy of All-Solid Ytterbium-doped Photonic
Bandgap Fiber 22
4.1.6 Brillouin Gain Spectroscopy of Hybrid Microstructured Fiber 26
4.1.7 Theoretical Examination of SBS in Microstructured Fibers 29
4.2 Power Scaling Microstructured Fiber Amplifiers 35
4.2.1. MI Theory 35
4.2.2 Counter-pumped Amplifier 41
4.2.3 Hybrid Microstructured Fiber Power Scaling 43
4.2.4 All-Solid Photonic Bandgap Fiber Power Scaling 54
4.2.5 Comparison and Discussion 57
5. Conclusion 59
6. Reference 61
List of Acronyms 65

iii Approved for public release. Distribution is unlimited.
List of figures
Figure 1: The two interacting optical fields and the acoustic wave are shown schematically along with direction of propagation. The laser field polarized in the x-direction, Ex,laser scatters to form the optical Stokes field, Ex,Stokes, and an acoustic displacement, aac……………………………………………………………………………..…6
Figure 2: Fiber amplifier schematics for co-pumped, counter-pumped, and two-tone configurations are shown. In the two-tone schematic, a wavelength division multiplexer is a photonic component that couples two fibers of differing wavelengths in the same fiber core. A tapered fiber bundle evanescently couples multimode fibers into the cladding mode of a double-clad fiber………………………………………………………….8
Figure 3: The evolution of the laser signal along the length of the fiber in a co-pumped (red) and counter-pumped (blue) amplifier configuration are shown above………………9
Figure 4: The evolution of the laser signal along the length of the fiber with a single laser at 1064 nm (red) is shown with a two-tone amplifier with an intermediate laser at 1040 nm (green) and signal laser at 1064 nm………………………………………...……10
Figure 5: Pump and Probe power coupling schematics for the dual-source (left) and phase modulated (right) BGS methods are shown………………………………………...12
Figure 6: Simulated BGS for amplified probe and depleted pump are shown along with locations of the boundary conditions used for numerical simulations……………………15
Figure 7: A pump probe design schematic for the phase modulator system is shown..17
Figure 8: Brillouin Gain Spectra for the OFS fiber using the phase modulator method along with the estimated gB at a range of pump powers tested…………………………..18
Figure 9: A pump probe design schematic for the dual source system is shown……...19
Figure 10: Brillouin Gain Spectra for the OFS fiber using the dual-source method is shown along with the gB estimated vs pump power……………………………….……...20
Figure 11: Brillouin Gain Spectra for the OFS fiber using the dual-source and phase modulator methods are shown above. Each is pumped with the same power………....21
Figure 12: The experimental BGS, scaled to the estimated gB is shown above…….....24
Figure 13: The gB that best matched simulated and experimental data at each pump power tested is shown above for the PBGF. This data was subsequently scaled to account for effects of a non-PM fiber……………………………………………………….25

iv Approved for public release. Distribution is unlimited.
Figure 14: The experimental BGS, scaled to the estimated gB is shown above for the hybrid fiber. Also shown is a long-range scan revealing a peak due to the pure-silica annulus (top)……………………………………………………………………………………28
Figure 15: The gB that best matched simulated and experimental data at each pump power tested is shown above for the hybrid fiber…………………………………………..29
Figure 16: CAD designs for the core of the PBGF. The left design was with course core sub-segmentation and the right employs core sub-segmentation with Yb-active regions that are 850 nm in diameter within a hexagonal shell……………………………………..33
Figure 17: Simulated BG spectra of the coarsely segmented (left) and finely segmented PBGF models are shown above……………………………………………………………..33
Figure 18: Simulated acoustic displacements showing the acoustic energy density at each Brillouin frequency response is shown above. Responses at 16.3 GHz are pure silica and responses at 15.45 GHz are Yb-active regions.......................................…...34
Figure 19: Longitudinal optical interference pattern in LMA PCF whose origin is conjectured as modal interference shown as bright and dark sites for Yb-photoluminescence. The rod is 15 cm long with a 100 µm core diameter……………...36
Figure 20: Simulated longitudinal thermal and optical intensity gratings are shown above from a study in [20]. The loss of phase relation between red and blue gratings at high optical intensity is responsible for mode coupling in MI……………………………..36
Figure 21: The wavelength dependence of MI threshold is shown above from a study in [21] along with the estimated population inversion curve (green)……………….……….40
Figure 22: A schematic of the counter-pumped amplifier is shown above………….…..41
Figure 23: A temporal response of the optical phase modulation sequence for a 1 GHz clock rate, 7 bit pattern PRBS scheme is shown [25]………………………………….…..44
Figure 24: The power spectral density of an optical signal after PRBS phase modulation with a 7 bit pattern driven at a clock rate of 2 GHz is shown above [26]. The left shows a long-range power spectrum while the right shows a more narrow frequency range with emphasis on the discrete tones comprising the total response………………….……….45
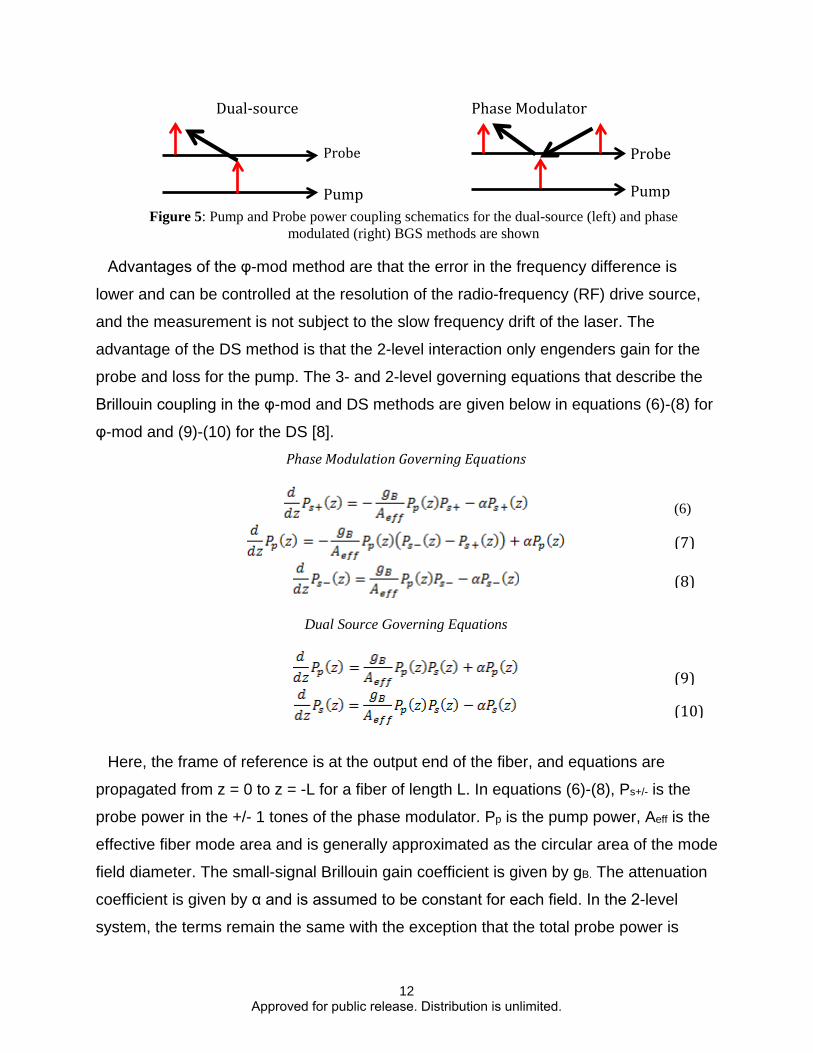
Figure 25: The output spectrum of the seed due to phase broadening is shown above in the hybrid fiber power scaling experiments………………………………………………....46
Figure 26: The pump power versus signal power for the 37/370 µm diameter core/clad is shown above. The change in response at 900 W pump is due to parasitic beam steering of the pump…………………………………………………………………………..47

v Approved for public release. Distribution is unlimited.
Figure 27: A high-resolution optical spectrum of the backward light is shown above. The spectrum of the 37/370 µm fiber under test is shown with ample Stokes light along with a reference spectrum with no Stokes light…………………………………………………48
Figure 28: M2 beam quality versus signal power is shown above. The uptick in M2 at high powers may be a precursor to MI……………………………………………………..49
Figure 29: The optical-to-optical power efficiency is shown above along with corresponding M2 values…………………………………………………………………….50
Figure 30: Individual frames from a high-speed camera showing modal instability…..51
Figure 31: x- and y-axis M2 values versus pump power showing MI onset occurred in the y-axis; which is guided by air gaps. Inset: the orientation of the high-index and air gap cladding structures………………………………………………………………………52
Figure 32: The forward OSA trace of the 35.5/355 µm diameter core/clad fiber design is shown above. The high levels of ASE centered at 1040 nm caused a self-pulse that catastrophically damaged the fiber…………………………………………………………53
Figure 33: The amplified signal versus launched pump is shown above for the Clemson PBGF. The original power scaling data is shown in black while the replication study is shown in blue. Markers indicate the onset of MI in each case as evidenced by the rapid increase in M2………………………………………………………………………………...56

1. Summary
This research addressed suppression of stimulated Brillouin/Raman scattering in high
power fiber lasers. The work was done by Mr. Cody Mart under a government research
grant. Dr. Ben Pulford provided expert mentorship and laboratory space at the Air
Force Research Lab (AFRL) New Mexico. Mr. Mart successfully defended his
dissertation using the results reported herein. The principal achievements were:
• Record output power from a ytterbium-doped photonic bandgap fiber amplifier
(410 W, 15x improvement), and a hybrid fiber amplifier (820 W, 14x
improvement).
• Stimulated Brillouin Backscattering (SBS) behavior studied numerically &
experimentally in Photonic Band Gap Fiber (PBGF); simulation results are in
excellent agreement with experimental results.
• SBS suppression by core feature demagnification.
• Large mode area Yb-doped microstructured fiber amplifiers shown suitable for
further power scaling.
• One PhD student graduated.
2. Introduction
Lasers are used in a wide range of applications that benefit from the tightly focused
beam and extremely high intensity that they can provide. In many cases, high average
power is essential for material modifications (cutting, drilling, and marking, just to name
a few). Fiber lasers have had a dramatic raise in capability over the past decade and
the trend is still continuing. The fastest growth in output power was observed for Yb-
doped fiber system with an increase in average of almost 2 times each year since the
year of 1999. Overall, the output power in Yb-doped fiber lasers has increased by two
orders of magnitude in the past decade. This level of development is unprecedented
compared to other laser platforms (crystal-based or gas-based). State-of-the art Yb-
doped lasers
1 Approved for public release. Distribution is unlimited.

can be massively scaled to an astounding 10 kW – comparable to the best performance
of any developed lasers currently available in the market. The result was obtained with
close to diffraction-limited beam quality, which determines the ability to focus to a
diffraction limited spot. For that reason, the brightness, which determines the power
density achievable on a target, is exceptionally high for these fiber lasers. This is
important since the power density largely defines the outcome of the treatment in the
majority of applications. Significant progress has also been visible for other fiber lasers
operating around 1550nm (Erbium-doped fiber) and around 2000nm (based on Thulium
and Holmium gain fibers).
The advances in fiber lasers have not come without the significant amount of research
efforts to solve a few obstacles on the road. First, high pump powers are needed to get
enough energy into the laser systems. Fortunately, high power laser diodes have been
developed in recent years and are available at power levels as high as hundreds of kWs
with combined laser diode arrays. Second, high output optical powers can lead to
optical damage of fibers. The damage threshold of silica is about 50W/μm2. When the
optical power inside the fiber is greater than this value, the fiber tends to be damaged.
The damage threshold can be lower if care would not be taken to avoid the so-called
fiber fuse. Furthermore, due to the strong confinement in fiber geometry nonlinear
effects play an important role in high power fiber lasers. Among the nonlinear effects,
stimulated Brillouin backscattering (SBS) is the limitation in output power scaling for
narrow-band lasers; and stimulated Raman scattering (SRS) can generate frequency
shift signals which decreases the output power at the required wavelength. Modal
instabilities are another obstacle in power scaling of fiber lasers/amplifiers. To scale up
the output power of fiber lasers further we need to use the so-called large mode area
fiber designs. These fibers tend to create lower beam quality due to coupling between
the fundamental (desirable) and higher order modes (undesirable). Thus, In order to
reach the material limit output power of fiber lasers/amplifiers we need to control
stimulated Brillouin/Raman scattering and MI effectively.
2 Approved for public release. Distribution is unlimited.

3. Methods, Assumptions, and Procedures
The extent of this research is to interrogate stimulated Brillouin scattering (SBS) and
modal instability (MI) in large mode area Yb-doped microstructured fiber amplifiers. The
performance goal of this research was to demonstrate milestones in output power of
beam combinable fiber amplifiers with high optical-to-optical efficiencies and with beam
qualities that approach the diffraction limit. The choice to study SBS and MI was made
because each is the bottlenecking process for narrow-linewidth output power and
diffraction limited beam quality respectively.
This work will treat SBS as a bane, as SBS depletes the forward-propagating light of
power and has been linked to intensity-induced fusion in active fiber. The focus will be
to understand the physics involved and to minimize its effect. It is worth noting,
however, that Brillouin scattering in fiber has been utilized for precision measurements
including high-sensitivity strain and temperature identification, and as a narrow-linewidth
laser source. No technological utility has been derived from MI because it is
fundamentally an unstable process, and this work will likewise treat MI as a bane.
The choice for limiting the study to ytterbium-doped fiber amplifiers was made
because favorable glass chemistry, favorable energetics in ytterbium, technological
advances in 900-1000 nm diode pumping, and photonic component reliability at 1064
nm has engendered a platform for demonstrating impressive power amplification feats
in in Yb-doped fibers. In a traditional rare-earth (RE) doped fiber amplifier, fiber coupled
diode lasers with low spatial coherence are directly coupled to the waveguide containing
the signal and the RE dopant, and are tuned to pump a strong absorption line in the RE
dopant. The laser signal, tuned to a strong emission line, extracts power through
stimulated emission. In this work, the strong Yb absorption line that is pumped is 976
nm and the Yb emission line is 1064 nm. Other RE metals prevalent in near IR silica
fiber amplification development were neglected for power scaling in a master oscillator
power amplifier (MOPA) configuration because each suffers from some, but not all, of
the following deficiencies: low optical-to-optical efficiency, high quantum defect heating,
low solid solubility limits in silica fiber, losses to non-radiative recombination processes
such as homogenous up-conversion in Erbium, and operation in the high-silica-loss
spectral region (relative to 1550 nm) such as thulium and holmium.
3 Approved for public release. Distribution is unlimited.

This work will study fiber amplifiers and neglect fiber lasers. A fiber laser differs from
an amplifier in that the waveguide contains optical cavity feedback and is not seeded
with laser signal. Instead, stimulated emission from the peak of the rare-earth (RE)
dopant emission oscillates in the fiber. Reflections for the oscillator can rely on the ~4%
Fresnel reflection at the air/glass interface or on external mirrors to provide feedback.
The primary reason that fiber lasers will be neglected is that control of the frequency
linewidth is important for both SBS mitigation and for coherence length considerations in
beam combining architectures. The requirements for a fiber laser to be high power with
a controllable, narrow linewidth when pumped by low-brightness diodes are
contradictory whereas these can be achieved cooperatively in a fiber amplifier. The
length of the gain fiber is the primary source for contradictory demands on a fiber
oscillator in that long lengths are needed to achieve high absorption and thereby
achieve high optical-to-optical efficiency whereas short lengths are needed to maintain
single longitudinal mode behavior from the oscillator and maintain a narrow-linewidth
and jointly mitigate SBS. A fiber amplifier, in contrast, can utilize long lengths (on the
order of 10 m) and achieve high efficiency because the frequency linewidth of the
master oscillator can be deterministically broadened before seeding the final stage
amplifier. Intensity noise, defined as the temporal fluctuations in output power, is also
notoriously bad in fiber lasers compared to semiconductor and solid-state lasers, but is
ameliorated in MOPA architectures because low-intensity-noise seed sources can
preserve the low intensity noise in fiber amplifiers relative to fiber lasers.
The research presented in this report is a collaborative effort between the University of
Arizona, College of Optical Sciences and the Air Force Research Laboratory (AFRL)
Fiber Lasers and Beam Combining Group, with the entirety of the research being
conducted at AFRL under the auspices of an Educational Partnership Agreement.
Computational resources were needed to model SBS in microstructured fiber. This
research will be presented in the section below. The Department of Defense High
Performance Computer consortium was utilized for these large computations.
4 Approved for public release. Distribution is unlimited.

4. Results and Discussion
4.1 Experimental and Theoretical Investigations of Stimulated BrillouinScattering
In this chapter, a Pump Probe Brillouin Gain Spectrum (BGS) diagnostic tool is used to
measure acoustic properties and to estimate SBS threshold in commercially-available
fibers as a proof-of-concept and in the novel microstructured fibers of interest for this
dissertation. The first section is devoted to understanding SBS in optical amplifiers. The
second section is devoted to understanding Pump Probe theory and practice, and a
commercially-available 6/125 µm core/clad passive, polarization maintaining Germania-
doped fiber is used for validation. In the third and fourth sections, the BGS of the
microstructured fibers used in later power scaling experiments are presented
In the final section, the experimental values for gB are tested against a theoretical
treatment of the acoustic-optical wave coupling that estimates gB with a finite element
solver. Brillouin coupling in a core with non-uniform acoustic velocity profile is
numerically investigated by solving a non-homogenous Helmholtz equation describing
the acoustic displacement in the core material driven by the optical field.
4.1.1 SBS Theory
A. Mathematical and Physical Description
SBS is a 3-wave nonlinear optical process involving an incident wave, an acoustic
wave, and a scattered wave. As the incident field passes through the waveguide, a
density wave is generated through a process known as electrostriction in response to
high-intensity, counter-propagating electric fields. Light is scattered from the density
wave, and in the process emits a phonon to satisfy conservation of energy and
momentum. The phonon is phase-matched to take on a wave vector twice of that of the
pump guided wave propagation constant because the Stokes light propagation is
opposite of the incident pump. The relevant fields and directions are shown in figure 1.
The phonon modifies the material density in a wave-like manner as it propagates, and
accordingly modifies the refractive index. This propagating density field can be viewed
as a reflective Bragg structure, and is essentially stationary in a timeframe that the
5 Approved for public release. Distribution is unlimited.

optical wave propagates through the fiber. Pump light scatters from the traveling wave
Bragg structure and emits more phonons in the process. The buildup of scattered, or
Stokes, light is phenomenologically modeled as an exponential process as the buildup
of Stokes light emits phonons and phonons create scattering sites to generate more
Stokes light.
Figure 1: The two interacting optical fields and the acoustic wave are shown schematically along with
direction of propagation. The laser field polarized in the x-direction, Ex,laser scatters to form the optical
Stokes field, Ex,Stokes, and an acoustic displacement, aac.
SBS onset in low-loss passive fiber has been considered theoretically for conventional
long-haul optical communications systems carrying short pulses of information [1];
which results in a closed-form solution for the SBS threshold. The seeding mechanism
for SBS in that case was purely from spontaneous Brillouin scattering due to
interactions with thermally-generated acoustic waves. In an optical amplifier, however,
ASE that is generated within the BGS can seed the SBS process as well. In addition,
the Stokes light will amplify due to both Brillouin scattering and optical gain while the
forward pump light is amplified.
The governing equations below, as modeled in [2], are written in a frame of reference
such that z = 0 is the fiber facet in which the pump and signal are co-seeded and z = L
is the output end of the fiber. The Stokes light is amplified in the –z direction.
Background attenuation is neglected because of the short lengths (~10 m) and low
inherent losses of rare-earth doped fiber while being pumped on a strong optical
transition.
The evolution of the pump, laser, Amplified Spontaneous Emission (ASE), and Stokes
powers (PP, Pl, PASE, PS) are modeled in equations (1)-(5) below. The pump excites
electrons to the upper state, N2, and provides inversion for all other signals. The laser
6 Approved for public release. Distribution is unlimited.

extracts power due to stimulated emission and loses power due to Brillouin coupling to
the Stokes light. The Brillouin coupling is represented by the Ps×Pl term. The Stokes
light is amplified through stimulated emission and nonlinear Brillouin coupling. In the co-
pumped configuration, as is the case below, the Stokes light will have its highest fields
present at the z = 0 boundary of the fiber where the highest levels of inversion are
present because the Stokes is counter-propagating with the pump. In contrast, the laser
will have weak optical fields at the z = 0 end and will amplify towards the z = L end of
the fiber because the pump and laser signals co-propagate along the fiber. This means
that Stokes light can compete favorably for optical gain near the z = 0 boundary
because power extraction from population inversion depends on local field intensities.
In this model, the excited state ion density, N2, is described by stimulated
emission and absorption rates of all contributing signals and the spontaneous decay
rate with inverse fluorescence lifetime 1/τ. The two-level approximation of the excited-
and ground-state populations are assumed as in the steady-state and N0 is the sum of
ground and excited states. The emission/absorption cross sections of the ytterbium-
doped fiber at each wavelength of interest are σa/e. To model the effects of imperfect
pump overlap with the core and the optical field distribution of the core mode, the
overlap factors ΓS and ΓP are introduced. The forward and backward ASE, superscripts f
and b, is discretized with parameter j to cover the spectrum with j lines, and is simulated
with a boundary condition fictitious seed of P0 = (2hc/λASE) ·ΔυASE where ΔυASE is the
ytterbium gain bandwidth. The Brillouin gain is similarly discretized with index i, and the
7 Approved for public release. Distribution is unlimited.
(1)
(2)
(3)
(4)
(5)

gain coefficient, gB, is assumed to take a lorentzian line shape with bandwidth ΔυB and
peak value gB0. The fictitious seed at z = L of the Stokes light is given as PN = hνBΔνB
where υB is the Brillouin peak shift, and is designed to simulate phonon generation from
noise [3].
B. SBS Mitigation Through Clever Amplification Schemes
SBS mitigation through different optical gain configurations has been discussed, and
now will be expounded on. Specifically, minimizing the total integrated power along the
fiber length is beneficial to SBS mitigation. Two examples of utilizing favorable optical
gain are counter-pumping and the so-called two-tone amplifier configuration. Basic fiber
amplifier schematics for a co-pumped, counter-pumped, and two-tone amplifier are
shown in figure 2. The pumps in the figure refer to lasers tuned to excite an optical
transition in a rare-earth dopant, and not to the pump used to excite an SBS process.
The role of the intermediate laser in the two-tone amplifier will be discussed below.
Figure 2: Fiber amplifier schematics for co-pumped, counter-pumped, and two-tone configurations are
shown. In the two-tone schematic, a wavelength division multiplexer is a photonic component that
couples two fibers of differing wavelengths in the same fiber core. A tapered fiber bundle evanescently
couples multimode fibers into the cladding mode of a double-clad fiber
8 Approved for public release. Distribution is unlimited.

From the coupled equations above, it is evident that the population inversion is similar
to a Beer’s law decay with length. It is also evident that the local laser gain along the
fiber is affected by population inversion, i.e. . This term in the differential
equation also implies power extraction from stimulated emission at any point z depends
on the local laser intensity along the fiber. In a counter-pumped amplifier, the laser
signal is highest at a point of the fiber where the highest inversion levels are present. In
contrast, a co-pumped amplifier has weak laser fields present at the highest inversion
levels. This creates vastly different power evolution profiles along the fiber axis; which is
simulated in figure 3. In the figure, the co- and counter-pumped amplifiers reach the
same output power. The co-pumped amplifier, shown in red, maintains high power
levels through much of the latter half of the fiber as opposed to the counter-pumped
amplifier, shown in blue; which rapidly extracts power at the output end of the fiber. This
means that throughout much of the fiber low optical fields exist in the counter-pumped
case. These low optical fields do not strongly excite the electrostriction process because
the process relies on localized field strengths to order Ex(z)2. That much of the fiber in a
counter-pumped configuration maintains low optical fields locally is the reason SBS
threshold is increased in counter-pumped fiber amplifiers [2].
Figure 3: The evolution of the laser signal along the length of the fiber in a co-pumped (red) and counter-pumped (blue) amplifier configuration are shown above
A two-tone amplifier is a pumping scheme that similarly reserves much of the laser
amplification to a small section of the fiber, but with the exception that the effect can be
9 Approved for public release. Distribution is unlimited.
10 Approved for public release. Distribution is unlimited.
seen in co-pumped configurations [4]. In the two-tone scheme, a ytterbium-doped large-
mode-area (LMA) fiber core is seeded with the signal and an intermediate laser at a
wavelength near the peak of the emission spectrum of ~1035 nm whose role is to
quickly amplify and get re-absorbed to act as a second pump to the intended signal.
The simulated power evolution of the intermediate and signal lasers along the length of
the fiber in a two-tone amplifier is shown in figure 4 as described in [5]. In the figure,
power was scaled until SBS threshold was met. The intermediate laser, shown in green,
dominates power extraction at the z = 0 seeded boundary until it is reabsorbed and
thereby provides gain for the signal, shown in blue. Since the intermediate laser is a
core mode, absorption is high and amplification of the signal occurs in a very short
section toward the end of the fiber. Also shown in the figure is a simulated co-pumped
amplifier with only a 1064 nm seed, shown in red. Since both the two-tone and single-
tone amplifiers were pumped until the SBS threshold was observed, it can be inferred
that the two-tone configuration amplified a 1064 nm laser signal >2x beyond the SBS
threshold of a single-tone amplifier.
4.1.2 Pump Probe Theory
A. Introduction and Mathematical Modeling
Two-tone 1040 nm intermediate Two-tone 1064 nm signal Single tone 1064 nm signal
Figure 4: The evolution of the laser signal along the length of the fiber with a single laser at 1064 nm (red) is shown with a two-tone amplifier with an intermediate laser at 1040 nm (green) and signal laser
at 1064 nm

In Pump Probe BGS measurement, opposing ends of the fiber are seeded with
simulated pump and Stokes (probe) light that are detuned in frequency, thus creating a
longitudinal interference pattern mimicking an acoustic wave in the fiber core. When the
laser field interference pattern matches the grating formed by the acoustic wave,
maximum power coupling through the Brillouin scattering process is achieved. The
spectrum of interacting acoustic waves in the fiber can be determined by the strength of
the energy coupling as a function of frequency detuning between the pump and probe. It
differs from spontaneous Brillouin scattering in that the Stokes light is seeded from a
laser and not scattered from thermal phonons.
Pump Probe BGS offers many favorable advantages over monitoring Stokes light in
an active amplifier. A response can be observed at pump powers below the saturation
power of the rare-earth doped fiber, thus the natural gB can be obtained with no
ambiguities as to the role of signal attenuation in the process. Also, no temperature
gradients along the fiber exist in this setup; which can be observed in active amplifiers
due to quantum defect heating.
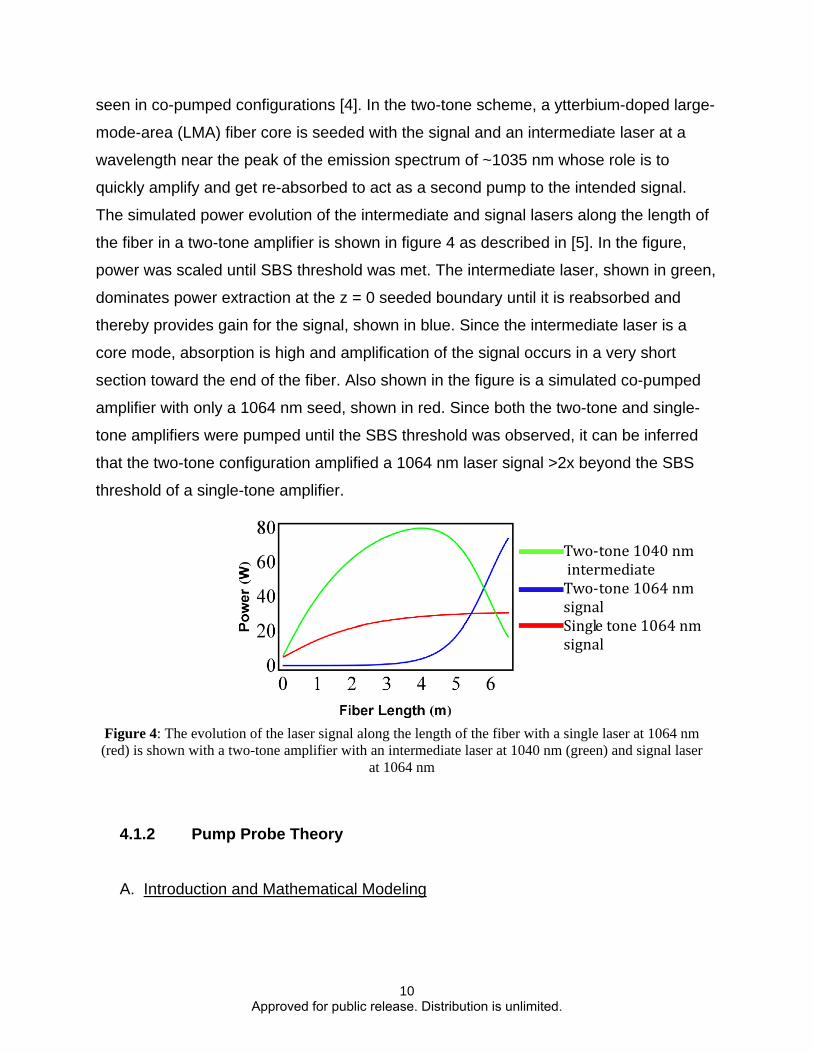
Two varieties of Pump Probe BGS have been widely implemented: a dual-source (DS)
scheme [6] in which two independent lasers are frequency detuned, and a phase
modulator (φ-mod) method [7] in which a single-source is split and the probe is phase
modulated to create interacting frequencies in the +/- 1 tones of a phase modulator
driven by a sinusoid. Figure 5 shows a schematic of the frequency content in the dual-
source and phase modulator methods along with the power coupling involved. In the
phase modulator method, the phase modulator is driven with a single sinusoid at a drive
voltage that depletes the center frequency content to zero. This is done to prevent
stimulated Rayleigh scattering and other same-frequency processes from interacting in
the fiber. The phase modulator method involves a 2-level interaction scheme in which
the +1 tone of the phase modulator amplifies the pump; which then amplifies the -1
tone. The DS is much simpler in that interaction only involves the pump amplifying the
probe.
11 Approved for public release. Distribution is unlimited.
Advantages of the φ-mod method are that the error in the frequency difference is
lower and can be controlled at the resolution of the radio-frequency (RF) drive source,
and the measurement is not subject to the slow frequency drift of the laser. The
advantage of the DS method is that the 2-level interaction only engenders gain for the
probe and loss for the pump. The 3- and 2-level governing equations that describe the
Brillouin coupling in the φ-mod and DS methods are given below in equations (6)-(8) for
φ-mod and (9)-(10) for the DS [8].
Here, the frame of reference is at the output end of the fiber, and equations are
propagated from z = 0 to z = -L for a fiber of length L. In equations (6)-(8), Ps+/- is the
probe power in the +/- 1 tones of the phase modulator. Pp is the pump power, Aeff is the
effective fiber mode area and is generally approximated as the circular area of the mode
field diameter. The small-signal Brillouin gain coefficient is given by gB. The attenuation
coefficient is given by α and is assumed to be constant for each field. In the 2-level
system, the terms remain the same with the exception that the total probe power is
12 Approved for public release. Distribution is unlimited.
Probe
Pump
Probe
Pump
Dual-source Phase Modulator I
Phase Modulation Governing Equations
Dual Source Governing Equations
(6)
(7)
(8)
(9)
(10)
Figure 5: Pump and Probe power coupling schematics for the dual-source (left) and phase modulated (right) BGS methods are shown

13 Approved for public release. Distribution is unlimited.
encompassed in Ps. These governing equations do not contain gain/loss terms due to
ytterbium population inversion because the Yb absorption at 1064 nm does not supply
sufficient population inversion to have an effect.
In the absence of attenuation, the pump and probe power equations can be solved
analytically. Solutions for the lower tone of the φ-mod, Eqn. (8), and the Stokes light in
the DS, Eqn. (10), are given in equation (11) and equation (12), respectively. The
solutions represent a co-seeded initial condition in which the pump and Stokes power
incident on the fiber are known. This does not accurately model SBS in that the process
is counter-seeded. In the case of counter-seeding, the solution becomes
transcendental. These exact solutions for the co-seeded condition, however, were
useful in estimating the numerical error when finite difference methods were used to
estimate the power coupling in the 3x3 and 2x2 coupled differential equations above
with α = 0. Ultimately, estimating the numerical error was necessary because the
microstructured fibers studied below have non-negligible attenuation due to Yb
absorption and scattering, and using finite difference methods to estimate the power
exchange in Eqns. (6)-(8) and (9)-(10) offered the most facile method for simulating the
power coupling. It was found that for Δz steps along the fiber to order Δz/L ~ 10-6, a
difference between exact and approximated power amplification was ~0.1%; which is
smaller than the error in measuring the power in the actual experiment.
Phase Modulation Lower Probe Tone Solution
Dual Source Probe Solution
(11)
(12)

14 Approved for public release. Distribution is unlimited.
where the initial conditions on the φ-mod equations are and
.
B. Estimations of gB
Estimates of the gB were obtained by using finite difference methods to solve the
coupled equations (6)-(8) for the φ-mod or (9)-(1)0 for the DS method, and tuning gB in
the equations to match the simulated power results with the acquired data. The
boundary conditions for the simulation were empirically derived from the experiment.
Figure 6 shows a schematic of the amplified probe and depleted pump BGS that shows
the power levels used as boundary conditions in the simulations. When the frequency
difference is far off Brillouin resonance, no Brillouin coupling occurs, and the power
dynamics evolve as because only fiber attenuation affects
propagation. With these power measurements, the powers coupled to the waveguide
can be estimated and power levels for the boundary conditions Pp(L) and Ps(0) can be
defined. When strong Brillouin coupling occurs, power evolves according to the
governing equations above and peak interactions can be used to determine Pp(0) and
Ps(L). This provides the four boundary conditions for the simulations to match. By
power-tuning the pump, gB can be estimated for a spectrum of pump powers and a
statistical average can be utilized to judge the quality of the estimation.

4.1.3 Comparison of Dual Source and Phase Modulator Systems: Phase Modulator System and Results
Figure 6: Simulated BGS for amplified probe and depleted pump are shown along with locations of the
boundary conditions used for numerical simulations
The first experiment conducted was to determine which of these methods was suitable
for BGS measurements for low Brillouin gain conditions such as short fiber length
and/or large diameter cores. A short (3.6 m) length of passive, polarization maintaining,
single clad GeO2 doped 6/125 μm core/clad fiber from OFS (product number F9920-01)
was chosen for the study. The experimentation and results of the φ-mod system will be
discussed in this section with the DS experimentation and results discussed in the next
section.
In the φ-mod schematic, shown in figure 7, a master oscillator (M.O.) is split with a
polarization beam splitter (P.B.S.). The pump is coupled directly to an all-fiber high
power, single-frequency Yb-doped amplifier from IPG photonics. The probe is coupled
to a LiNbO3 waveguide phase modulator from EOSpace and is driven by a 20 GHz RF
driver from Antritsu. The output is coupled into another IPG photonics amplifier to offer
mild amplification beyond the ~20 mW maximum that can be coupled to the phase
modulator without damaging the unit. The output of each amplifier is sampled with a
beam splitter (B.S.) to test source stability. Two power meters (P.M.) are dedicated to
measuring source stability and two power meters are used to measure the power
coupling of the transmitted pump and probe beams. Free-space Faraday isolators are
15 Approved for public release. Distribution is unlimited.
~Ps(0)
Ps(L) Pp(L)
~Pp(0)

used to prevent seeding the amplifiers with backward propagating light. Beam samplers
are also used to directionally separate the pump and Stokes light in the free-space
section of the diagnostic system. It should be noted, however, that in the experiments of
the LMA microstructured fiber the 70/30 and 50/50 beam splitters were removed
because high powers were needed to elicit a response from those fibers. The IPG
amplifier is a 3-stage amplifiers, and the powers needed to measure high fidelity signal
(< 3 W) would not require activation of the third stage in the IPG Amp. The beam
splitters were utilized to attenuate the seed beams so that the third stage would need to
active, as this was found to reduce intensity noise of the sources.
To couple light to the fiber in this system and the DS system discussed below, a simple
ABCD ray tracing matrix algorithm was used to simulate the propagation of a Gaussian
beam through a doublet lens system. The targeted optical design was achieved when
the simulated ray path achieved a beam waist that was equal to the mode field diameter
of the fiber. In this study, short focal length lenses (f < 8 mm) were needed to mode-
match due to the small core diameter; which necessitated use of specialty glasses
whose thermo-optic effects greatly influence focal length. In studies on the
microstructured fiber, longer focal length lenses made from UV-grade fused silica were
used; which reduced these parasitic thermo-optic effects.
16 Approved for public release. Distribution is unlimited.

Figure 7: A pump probe design schematic for the phase modulator system is shown
Data was acquired in the φ-mod experiment using a LabVIEW code that controlled the
RF drive voltage and frequency to the phase modulator to maintain the desired
frequency content in the probe while also controlling the IPG output power and
recording the power meter levels. Prior to acquisition, the transmitted power was
measured in the pump and probe beams so that the data could be calibrated to
represent the power in the fiber. Data acquisition was long (>10 minutes per sweep) and
was limited by the response time of the thermal power meters that were used to
measure powers > 200 mW. The response time for the LabVIEW code to properly
acquire data from the power meters took ~500 ms for each datum, and many data were
taken at each temperature setting so that averaging could be used to acquire high-
resolution data.
Figure 8 shows the measured BGS of the OFS test fiber using the φ-mod method. The
measured full-width at half-maximum is 40 MHz. The peak response at 15.8 GHz is
characteristic of germania doping [7]. The pump power coupled to the core is listed in
the inset. The importance of this will be discussed later in this chapter because the
same power was used to measure the BGS in the DS system and additional features
were resolved. Additionally shown in the figure is the estimated gB vs a range of pump
powers. The average was gB = 1.6×10⁻¹¹ m/W. Notice the wide fluctuations in estimated
17 Approved for public release. Distribution is unlimited.

gB at low pump powers. This significantly increased errors as evidenced by the standard
deviation; which was 0.1×10⁻¹¹ m/W.
Figure 8: Brillouin Gain Spectra for the OFS fiber using the phase modulator method along with the
estimated gB at a range of pump powers tested
4.1.4 Comparison of Dual Source and Phase Modulator Systems: Dual Source System and Results
The DS system, shown in figure 9, is the same following the IPG amplifiers as the φ-
mod system. Where it differs is the implementation of two independent sources to seed
the IPG amplifiers. In the DS system, the outputs from two non-planar ring oscillators
(NPROs), from Lightwave, are each split using a PBS with the transmitted beam being
used to seed the amplifiers and the reflected beam being fiber coupled into a 3 dB
coupler. The 3 dB coupler is then used to illuminate a 26 GHz InGaAs photodiode from
Newport for heterodyne detection. A radio frequency spectrum analyzer (RFSA) is used
to detect the frequency difference between pump and probe. The other fiber from the 3
dB coupler illuminates a scanning Fabry Perot interferometer (SFPI) to analyze the
single-frequency behavior of each NPRO. The SFPI interference fringes are read on an
oscilloscope. Frequency detuning is achieved by temperature tuning of the NPRO laser
crystal. The SFPI is needed to monitor each NPRO for single-frequency output while the
probe is frequency scanning. When properly tuned, the probe laser can scan >5 GHz
without mode-hopping, or switching between longitudinal modes of the laser cavity,
becoming problematic
18 Approved for public release. Distribution is unlimited.

The DS system needed further characterization because it is the more complex system.
Since the laser gain is modified with temperature, a change in the NPRO output power
is expected when temperature tuning. Since two NPROs are utilized for the DS system,
the NPRO with the lower sensitivity to output power drift while temperature-tuning would
be the probe NPRO. A LabVIEW program was written to control the laser crystal
temperature and record the NPRO output power from a power meter. Power increases
were nearly linear with temperature change. The better performing NPRO decreased
power by 8.7% over 23 °C whereas the worse performing NPRO increased 8.2% over
2.9 °C.
Figure 9: A pump probe design schematic for the dual source system is shown
To understand how the DS system may be affected by the temperature tuning, the
better performing NPRO was coupled into a 10 GHz free spectral range Fabry Perot
interferometer. A LabVIEW program was written to record the spectral shift in the SFPI
when temperature was increased. It was determined that a 1.5 °C temperature increase
shifted frequency by 5 GHz. Since most BGS resonances fall within a 2 GHz window
between 15 and 17 GHz, it was concluded that the DS system would vary in power <1%
due to heating of the crystal.
Data was acquired in the DS experiment using a LabVIEW program that thermally
tuned the probe laser and controlled the IPG output power while simultaneously
recording the power levels of each power meter and the frequency difference in the
19 Approved for public release. Distribution is unlimited.

20 Approved for public release. Distribution is unlimited.
RFSA. This LabVIEW code similarly was slow in data acquisition and was limited by the
response time of the thermal power meters.
Figure 10 shows the measured BGS of the OFS test fiber using the DS method. The
measured full-width at half-maximum is 60 MHz. The peak response is similarly at 15.8
GHz. As mentioned above, an additional feature is clearly resolved at 16.3 GHz when
pumped with 0.56 W. This is due to silica from the evanescent light in the two modes
interacting. This is generally a difficult feature to resolve in BG spectroscopy. Also
shown is the estimated gB vs pump power for the DS method. The average was gB =
1.61×10⁻¹¹ m/W and the measured variance was 0.018×10⁻¹¹ m/W. The variance is
much lower in the DS method than in the φ-mod method.
Figure 10: Brillouin Gain Spectra for the OFS fiber using the dual-source method is shown along with
the gB estimated vs pump power
Table 1 Measured Stokes gain and estimated gB are listed for pump powers in DS and φ-

21 Approved for public release. Distribution is unlimited.
A. Comparison of Dual Source and Phase Modulator Systems: Discussion
The measured FWHM of the BGS with the DS system was 60 MHz and was 40 MHz
in the φ-mod system. This large discrepancy in the measured widths is not due to
frequency resolution of each measurement system. The DS method resolution is limited
to frequency drift of the two sources. The frequency drift measured over a 10 second
span is approximately 2 MHz. The φ-mod frequency resolution is much more precise.
The resolution limit is nominally limited by the instantaneous linewidth of the NPRO;
which is rated at 10 kHz. This was not detected when inspected because the resolution
limit of the system was lower than our analysis method of measuring the variations in
the beat-note on a fast photodiode. The cause for the large discrepancy in full width at
half maximum (FWHM) measurements will be explained later in this section.
Table 1 shows the overall probe gain and estimated gB for each pump power using the
φ-mod and DS methods. The overall probe gain is much smaller for a given pump
power in the φ-mod method. The low signal gain in the φ-mod method is the
predominant cause for the wide statistical variation in gB cited above because of the low
signal-to-noise ratio (SNR). The large SNR in the DS method is responsible for the
lower statistical variation of +/- 0.01 cm/GW. The peak Brillouin gain value of 1.6
cm/GW is on the low end for GeO2-doped fiber cores. This is potentially due to gain
saturation effects because of the large pump powers involved.
Figure 11: Brillouin Gain Spectra for the OFS fiber using the dual-source and phase modulator
methods are shown above. Each is pumped with the same power

22 Approved for public release. Distribution is unlimited.
To investigate the cause for the abnormal performance of the φ-mod method,
equations 3.6-3.8 and equations 3.9-3.10 were separately solved using finite difference
methods to show the power growth/decay along the fiber. The parameters in the
simulation had a similar gB and effective area as the OFS fiber used in the experiment.
Figure 11 shows the power dynamics of the +/- 1 tones of the phase modulator along
with the probe light in the DS method for the simulated OFS fiber with a pump power of
250 mW and a total probe power of 25 mW. For the φ-mod method, the +1 tone loss
nearly equals the -1 tone gain for low Brillouin gain conditions. Additionally, of the total
probe power only ~54% of the light interacts with the pump because the remaining light
is dispersed among higher order tones of the phase modulator. This results in an overall
probe gain that is very low compared to the DS method; in which all probe light is
amplified by the pump. The total probe power gains in the figure are 1.77 dB for the DS
method and 0.069 dB for the φ-mod method. To achieve a probe gain of 1 dB, nearly 5x
more pump power is required in the φ-mod method.
For low gain processes such as responses off of the BGS peak or for short length,
large core diameter fibers, the φ-mod method as-implemented fails to capture all
necessary physics. This then explains discrepancy in BGS FWHM cited above because
the low Brillouin gain off peak resonance did not stimulate a strong enough power
exchange in the φ-mod method to produce a detectable signal.
In spite of its systematic simplicity and high frequency resolution, the φ-mod system
will not be used in this study. However, if diffractive optical elements and/or Fabry-Perot
filters with resolution >0.05 nm at 1064 nm can be integrated, the power dynamics of +/-
1 tones of the phase modulator can be studied independently and resolution can be
improved.
4.1.5 Brillouin Gain Spectroscopy of All-Solid Ytterbium-doped Photonic Bandgap Fiber
To accurately estimate gB in the PBGF, a fiber-coupled polarization scrambler from
General Photonics was integrated into the probe system to scramble the probe. The
polarization scrambler iterated through many cycles of π polarization retardation and
advance on a sub-nanosecond time scale. The polarization spanned through every

state of polarization on the Poincare sphere on a ns-timescale. On the time scale of a
phonon lifetime (~10 ns) this can essentially be treated as a source with no polarization
fidelity, or with a polarization extinction ration (PER) of 0 dB. Polarization-scrambling
was necessary because the non-PM PBGF degrades the polarization of a highly-
polarized source to a PER < 9 dB, and a randomly-polarized probe can capture
interactions of all polarization states of the pump. The degraded polarization affects the
analysis in that the observed gB is a factor of 2 lower than the natural gB [9]. The
estimated gain coefficient from the experiment must therefore be multiplied by 2. The
power of this scrambled probe was boosted in a non-P.M. pre-amplifier that produced
1.2 W of power and a PER of < 0.5 dB. The home-built non-P.M. amplifier was
necessary because the IPG amplifier required a seed with high-fidelity polarization and
will polarize incoming seeds to achieve this. A polarization-scrambled seed presented to
the IPG amplifier would produce a pulsed output because the embedded polarizer
would fully attenuate the seed when in the opposite polarization of the embedded
polarizer is encountered.
To prepare the fiber for test, the fiber tips were cleaved at a ~4° angle to prevent
parasitic reflections from the glass/air interface from affecting measurements. The fiber
tips were inserted in aluminum chucks atop a 5-axis stage for free-space coupling. No
attenuation of the pump IPG amplifier was applied and ~40 W were used to seed the
fiber under test. The fiber was coiled loosely on an optical breadboard with care taken to
maintain a constant bend axis throughout the fiber. The breadboard was positioned at a
height coincident with the fiber height in the chucks so as to reduce strain on the fiber
due to sag. A beam profiler from Thorlabs was utilized to measure beam quality; of
which the pump and probe beams emitted beams with M2 < 1.3. This ensured that the
measurement was capturing interactions between fundamental core modes of the pump
and Stokes light.
23 Approved for public release. Distribution is unlimited.

The optimized diameter was chosen as 80 cm from an experiment performed prior to
BGS interrogation in which a 1.5 m section of the fiber was tested for optimized bend
diameter then subsequently used in a cutback experiment to determine fundamental
mode loss at 1064 nm. The short section of fiber was ideal for determining the optimum
diameter because the mode filtering via the PBG effect can only occur over a short
distance. The optimum bend diameter was determined as 80 cm and the cutback
experiment determined an estimated loss coefficient of 0.02 m-1 (0.086 dB/m).
Figure 12: The experimental BGS, scaled to the estimated gB is shown above
Figure 12 shows the PBGF BGS scaled to the estimated gB. The two responses are
from structures that comprise the core. The 15.5 GHz peak is due to Yb- and P2O5-
doped silica and has an estimated gB of 0.58×10⁻¹¹ m/W. The peak interaction at 16.3
GHz is due to the SiO2 and carries a magnitude of 0.62⨯10-11 m/W; which is > 7x lower
than gB for pure-silica cores [7]. Commercial silica fibers have since been corrected for
the ultra-high gB reported in [7], but these still hover around gB ~ 2×10-11 m/W. The SiO2
response for the PBGF is at least 3x reduced from these fibers as well. The full-width
24 Approved for public release. Distribution is unlimited.

and half-maximum bandwidths are 100 MHz for the doped silica region and 80 MHz for
the pure silica region. The pure silica bandwidth is nearly twice the bandwidth of
traditional step-index fiber. No responses were resolved from the GeO2-doped high-
index cladding structures responsible for the PBG effect; which would be expected near
15.8 GHz [76]. Acoustic anti-guiding due to interactions with the high-index cladding
structures have been proposed as a Brillouin gain suppression mechanism in PBGF
[10]. The experimental BGS of the core, however, cannot validate these claims
Even with 40 W of single-frequency pump to couple into the fiber, the measurement
was nearing the resolution limits of the diagnostic. This can be seen in figure 13; which
shows the gB that best matched experimental and simulated data for each pump power.
The observed gB was the Brillouin gain experienced in the non-PM fiber. The natural gB,
cited above, is 2x the observed gB because of the poor polarization fidelity of the PBGF.
The spread of optimized gB values is large compared to the average value, namely an
average value of 3.1×10⁻¹² m/W for the SiO2 response with a standard deviation of
2×10-13 m/W.
Figure 13: The gB that best matched simulated and experimental data at each pump power tested is shown above for the PBGF. This data was subsequently scaled to account for effects of a non-PM fiber
The results above do not disprove the conjectures by Shirikawa et al [10] of acoustic
wave anti-guiding as a Brillouin gain suppression mechanism because the acoustic
wave propagation in the PBGF does not allow for pronounced interactions with the
cladding structures. In Shirikawa’s study the Brillouin response properties of interest
were of a pump wavelength of 1178 nm, a Brillouin peak shift of 14.38 GHz, and a
25 Approved for public release. Distribution is unlimited.

FWHM gain bandwidth of 56 MHz. These provide an estimated acoustic velocity of
5640 m/s and an acoustic wave lifetime of 2.8 ns, with the corresponding
propagation distance of 16 µm. This allows for interaction of phonons, if propagating
with a transverse component, with the cladding structure because the core radius was 5
µm. The acoustic wave propagation constant was calculated under the assumption of
perfect phase matching, i.e. where βP/S are the propagation constants of the
Pump/Stokes waves and q is the acoustic wave propagation constant. In the PBGF
from Clemson, however, estimated acoustic velocities and propagation lifetimes of the
P2O5 response are 5686 m/s and 1.59 ns respectively while those of the pure silica
response is 5980 m/s and 1.98 ns. These provide a characteristic propagation distance
of 9 µm for the P2O5 phonons and 11.8 µm for the pure silica phonons. Thus even if
PBGF phonon propagation has a transverse propagation component, the majority of the
phonons created at the center of the fiber, where the optical fields are highest, will not
propagate far enough to interact with the cladding structures because the core radius is
25 µm.
4.1.6 Brillouin Gain Spectroscopy of Hybrid Microstructured Fiber
The NKT hybrid fiber employs annular gain tailoring to mitigate MI. Since the gain
tailored core is spatially segregated into active and passive regions, each with a
different acoustic response, one might assume that having multiple acoustic frequencies
in the Brillouin gain spectrum would increase the SBS threshold. Furthermore, acoustic
wave interference between the fundamental core mode and the high index cladding
structures as argued by Shirikawa et al [10] would provide a more favorable
environment to be observed in the 35 µm core of the hybrid fiber than the 50 µm core of
the PBGF since phonon propagation lifetimes would allow for further penetration into
the 35 µm core structure. Previous power scaling efforts with Yb-doped hybrid fiber
amplifiers did so with broadband seeds and the SBS was not explicitly studied [80].
Hence, studying the Brillouin gain response of this fiber is important to understanding its
reliability as a high power fiber amplifier archetype.
26 Approved for public release. Distribution is unlimited.

The fiber was coiled on a 65 cm diameter aluminum spool with each facet given an
angle-cleave of ~4°. The pump and probe beams were coupled to the core and the
transmitted beams maintained a beam quality of M2 < 1.2. The polarization scrambler
was again utilized in the diagnostic as the hybrid fiber degraded the pump polarization
to a PER < 13 dB.
Two band gap (BG) spectra are shown in Figure 14. The long-range scan on the left
shows two distinct responses at 15.9 GHz and 16.3 GHz. The 15.9 GHz feature, which
has a measured bandwidth of 42 MHz, corresponds to the response of the Yb-doped
center region of the core and the 16.3 GHz feature corresponds to the response from
the passive fused silica annulus. To excite a resolvable response from the passive
silica, pump powers sufficient to induce pump depletion at the Yb-doped response were
needed. Since Yb lowers the BG coefficient in pure silica, it can be inferred that the
fundamental core mode overlaps poorly with the pure silica annulus. The natural gain
coefficient estimated from the experiment was 1.92×10⁻¹¹ m/W. This is 3x larger than
the BG coefficient estimated from the PBGF, but is ~20% smaller than reported
traditional LMA ytterbium-doped fibers [2]. During estimations of the BG coefficient, the
full mode-field diameter of the core was used to estimate the effective mode area even
though the gain-tailored core was not ytterbium-bearing throughout. The 20% reduction
in the BG coefficient is therefore ascribed to the presence of the annular pure silica ring
in the core. As with the PBGF, no resolvable responses were observed at the GeO2-
doped glass Brillouin shift frequency of 15.8 GHz indicating that acoustic waves in the
high-index cladding rods were not affecting acoustic properties in the core.
27 Approved for public release. Distribution is unlimited.

The measurement was affected by ytterbium gain saturation. At high pump powers,
the pump would saturate the gain and effectively create a lossless waveguide for the
counter-propagating probe. This affected the analysis because the 2x2 model assumes
a constant attenuation coefficient and in a gain-saturated amplifier the loss coefficient
varies with length. Only at pump powers < 6 W was the gain saturation of minimal
consequence to affect the analysis. The effects of gain saturation can be seen in figure
15 that shows the observed BG coefficient versus pump power. When high powers are
used to pump the fiber, the ytterbium attenuation of the lower-power probe is decreased
and more probe light is transmitted. This effect is incorrectly viewed by the numerical
28 Approved for public release. Distribution is unlimited.
Figure 14: The experimental BGS, scaled to the estimated gB is shown above for the hybrid fiber.Also shown is a long-range scan revealing a peak due to the pure-silica annulus (top).

29 Approved for public release. Distribution is unlimited.
simulations as owing to an enhanced Brillouin gain rather than a reduced, spatially-
varying attenuation coefficient.
Gain saturation was not observed in the interrogation of the PBGF because the
phosphate-doped glass engendered higher levels of ytterbium doping [11]. The higher
ytterbium concentrations along with the lower intensity engendered by the 50 µm cores
makes the saturation intensity much higher in the PBGF.
4.1.7 Theoretical Examination of SBS in Microstructured Fibers
In response to the unusually low gB from the PBGF found in the pump probe, a
numerical model was used to study gB to validate results. For perspective, the gB for the
silica response in the fiber core was >7x reduced compare to bulk silica [7] and the gB
for the Yb- and P2O5-doped silica was 4.3x reduced [12] compared to literature values.
A 2x reduction can be explained for each response considering that the core is roughly
comprised of 50% of each material; thereby lowering the overall response by 1/2. The
remaining reduction in gB is explained below after the model is introduced.
A. Mathematical Description of Acoustic & Optical Coupling in Fiber
Figure 15: The gB that best matched simulated and experimental data at each pump power tested is shown above for the hybrid fiber.

30 Approved for public release. Distribution is unlimited.
To describe the acoustic-optical wave coupling in fiber, a numerical scheme has been
developed to accomplish calculations of gB without simulating acoustic waveguide
properties of the fiber [13]. Also of importance is that this model utilizes first-principles
physics of the acoustic and optical properties of the glass waveguide. In this scheme, a
non-homogenous Helmholtz formalism with the electric field driving the acoustic
displacement is used to describe SBS gain. The wave equations describing optical and
acoustic propagation are given as:
where for the optical wave equation, ap/s is the z-dependent electric field amplitude that
grows/shrinks along the fiber, f is the transverse guided optical mode intensity profile, γ
is the electrostrictive coefficient, ε0 is the permittivity of free-space, and φ(x,y) is the
acoustic field displacement. Angle brackets indicate an integral over the fiber cross-
section. This representation is in the undepleted pump limit. For the acoustic wave
equation, Ω is the Brillouin frequency shift (1/s), Vt/I is the wave velocity in the
transverse/longitudinal direction, β is the acoustic propagation constant, Γ is the phonon
decay constant (rad/s), n is the optical refractive index, and ρ is the material density.
(13)
(14)

31 Approved for public release. Distribution is unlimited.
Equation (14) reduces to a Greens function, expressed as:
Since these equations become intractable for simple optical and acoustic refractive
index profiles for conventional fiber waveguides, a finite element solver has been
developed to model the interaction [13]. Leaving the governing equations in the
The Stokes power and pump power can be expressed as
The evolution of the Stokes light in the absence of attenuation then yields
With the Stokes gain calculated as
and
(19)
(20)
(21)
(22)
(23)
Where:
(15)
(16)
(17)
and the acoustic displacement can be expressed in integral form as a convolution with a
Green’s function, given as
φ(𝑥𝑥, 𝑦𝑦) = �𝐺𝐺(𝑥𝑥,𝑦𝑦, 𝑥𝑥′ ,𝑦𝑦′)Φ(𝑥𝑥,𝑦𝑦, 𝑥𝑥′ ,𝑦𝑦′)𝑑𝑑𝑥𝑥′𝑑𝑑𝑦𝑦′ ≡ �𝐺𝐺(𝑥𝑥, 𝑦𝑦) ∗ Φ(𝑥𝑥,𝑦𝑦)� (18)

formalism above assumes no guided wave nature of the longitudinal acoustic wave.
Thus, arbitrary acoustic velocity profiles can be simulated for an optical waveguide.
The model estimating gB is a steady-state solver, meaning no beam propagation is
employed. The optical mode is solved utilizing finite element methods developed with
Perfectly-Matched Layer techniques [14]. The meshing scheme is curvilinear hybrid
edge/nodal element patterning with triangular face shapes [15].
B. Numerical Model of Clemson PBGF
Two CAD designs were used to model the waveguide material arrangement, and are
shown in figure 16. The models are color-coded according to acoustic velocity, with a
scale shown on the right of each model in m/s. Dark blue is the P2O5- and Yb- co-doped
silica. Yellow is pure silica. The cyan is the GeO2-doped cladding structures. The
change in the two models was in the inclusion or exclusion of sub-optical-wavelength
micro-core features. The CAD drawing shown on the left excludes the subwavelength
micro-core features and models the actively-doped region of the core as a continuous
hexagonal feature that is nearly optically matched to the background silica so as to not
engender guiding through total internal reflection (TIR). The second design shown on
the right more accurately models the distribution of actively doped regions within the
core. The discrete, subwavelength micro-core features are modeled as cylinders with
850 nm diameters distributed within a hexagonal perimeter.
32 Approved for public release. Distribution is unlimited.

33 Approved for public release. Distribution is unlimited.
Results of the numerical model are shown in figure 17 with the coarsely segmented
core on the left and the core including micro-cores shown on the right. The coarsely
segmented core shows that the peak gB interaction is dominated by the pure silica
response at 16.3 GHz, and that the magnitude of 0.9×10⁻¹¹ m/W does not corroborate
with the gB estimated from the experimental pump probe. The SBS response of the
coarsely segmented core can be explained by the dilution of the core into two discrete
materials that are split nearly equally. The finely segmented core, however, produces a
BGS that matches very closely with the experimentally estimated gB. The peak gB
responses of the Yb-active and pure silica regions are nearly equivalent in magnitude.
Figure 16: CAD designs for the core of the PBGF. The left design was with course core sub-segmentation and the right employs core sub-segmentation with Yb-active regions that are 850 nm in
diameter within a hexagonal shell.
Figure 17: Simulated BG spectra of the coarsely segmented (left) and finely segmented PBGF models are shown above.

It should be emphasized that the CAD drawing that included the subwavelength micro-
cores designated more of the core area to pure silica. Yet, the peak SiO2 gB response
decreased by ~30% in this model when it was expected to increase. It should also be
emphasized that no advanced materials with ultra-low acoustic coupling are being
modeled. When the finite element solver models a homogenous step-index core, the
simulated gB is 2.4×10⁻¹¹ m/W; which is on-par with Yb-doped step-index fiber. The
micro-cores, therefore, must be affecting the dispersion of acoustic energy. Acoustic
energy dispersion is accurately modeled with the finite element solver employed
because no guided acoustic wave physics is assumed into the model. Acoustic
displacement field density at each frequency are simulated, and the results are shown
in figure 18. The acoustic displacements due to the Yb-active regions are shown to the
left and the pure silica acoustic field to the right.
(µm)
(µm) 15.45 GHz
15.45 GHz
(µm)
(µm) 16.3 GHz
16.3 GHz
Coarse Segmentation
Fine Segmentation
Figure 18: Simulated acoustic displacements showing the acoustic energy density at each Brillouin frequency response is shown above. Responses at 16.3 GHz are pure silica and responses at 15.45 GHz
are Yb-active regions.
34 Approved for public release. Distribution is unlimited.

4.2 Power Scaling Microstructured Fiber Amplifiers In this chapter, the microstructured fiber amplification limits for both the NKT hybrid
and Clemson PBGF are tested in a counter-pumped amplifier configuration. The
primary limitation to diffraction-limited, narrow linewidth amplification of these
microstructured fibers was the onset of modal instabilities (MI). The first section is
devoted to understanding the physics responsible for MI. The second section describes
the counter-pumped amplifier configuration along with the suite of diagnostics used to
monitor the fiber under amplification. The demonstration of each microstructured fiber is
then described in the following two sections. Finally, a discussion at the end of the
chapter compares hybrid fiber amplifiers with PBGF amplifiers.
4.2.1. MI Theory
A. Physical Description & Modeling Schemes
Critical to understanding MI is knowing the physical manifestation of the mode
coupling in multimode waveguides. Under the current understanding of MI, a coupling
mechanism is proposed whereby the longitudinal refractive index profile is modified
periodically along the fiber on a length-scale order of the beat length between
propagating modes of . Here υ is the optical frequency and
Neff,i/j is the effective refractive index of the i/j propagating modes determined by solving
for the eigenmodes of the waveguide [16, 17]. For a 1 µm wavelength and a difference
in Neff of 0.0001, this beat length is 1 cm. This interference phenomena is based on
experimental observations in LMA rod amplifiers in [18], and the image is reproduced in
figure 19. The green photoluminescence from nonlinear optical transitions in ytterbium
is modified because wave interference reduces optical amplification at the nodes and
the ytterbium emits a stronger spontaneous emission signal instead.
35 Approved for public release. Distribution is unlimited.

In an amplifier, this interference pattern reduces optical activity, and the corresponding
quantum defect heating, at the interference nodes. This establishes a longitudinal
periodic thermal gradient on a length scale of the mode beat length. When the periodic
thermal gradient is in phase with the optical mode interference pattern, no coupling
occurs. When the dynamics of optical amplification causes the optical field intensity
pattern to lead the thermal pattern in phase, dynamic coupling can occur. The loss in
phase relation between longitudinal optical and thermal interference patterns is shown
in figure 20 based on modeling from [19]. In the figure, the blue optical field interference
pattern is initially in phase with the red periodic temperature profile but becomes out-of-
phase at high field intensities.
Figure 19: Longitudinal optical interference pattern in LMA PCF whose origin is conjectured as modal interference shown as bright and dark sites for Yb-photoluminescence. The rod is 15 cm long with a 100
µm core diameter.
Figure 20: Simulated longitudinal thermal and optical intensity gratings are shown above from a study in [20]. The loss of phase relation between red and blue gratings at high optical intensity is responsible
for mode coupling in MI.
Jauregui et al modeled the coupling with a 3D beam propagation model (BPM) that
interrogated the role of a spatially resolved optical gain coupled to the modal
interference grating [17]. The longitudinal refractive index gradient is modeled as owing
to gain-guiding and anti-guiding, or the so-called Kramers-Kronig effect, whereby the
refractive index changes in response to high population inversion of the ytterbium ions.
The model accurately predicts an oscillatory coupling between fundamental and higher-
36 Approved for public release. Distribution is unlimited.

order modes without loss of overall energy. As argued in Smith et al [16], however, a
second condition necessary for coherent transfer of energy is to include a phase delay
between the longitudinal temperature gradient and the modal interference grating. This
breaks the symmetry between forward and backward propagation; which is key
because experimentally neither forward-propagating mode is observed to couple
strongly to the Rayleigh light and should according to the Jena model. The backward
wave was not accurately accounted for in the Jena group BPM because the model
utilizes the so-called one-way wave equation that only propagates the forward wave.
With the phase dynamics between the temperature gradient and modal interference
accounted for in the model, Smith was able to demonstrate that the longitudinal
refractive index dynamics was thermal at its origin and is only mildly affected by
Kramers-Kronig dynamics, and the authors were able to predict small-signal gain
coefficients for the mode coupling process. Attempts by the authors to model the effect
without the phase delay resulted in no mode coupling. The model, however, prescribes
an artificial phase matching of the two interfering optical modes necessary for coherent
energy transfer without positing a mechanism. Furthermore, only the small-signal gain
for the mode coupling was analyzed. No temporal dynamics were studied so the model
was not able to demonstrate the re-coupling of the higher-order mode to the
fundamental mode as is observed in MI.
Ward et al [36] developed a time-dependent model that demonstrated dynamic
coupling between the modes beyond MI threshold. In addition, a source for the phase
matching was posited as a nonlinear phase shift from self-phase modulation in the fiber
with additional contributions coming from how the temporal response of the heat and
laser gain modifies optical path length. In this paper, the laser gain and temperature rate
equations were assumed as steady-state, and no measurables were provided as to the
magnitude of the expected frequency difference between propagating modes.
In building off of Ward’s work, Naderi et al were able to model the mode coupling
without directly ascribing a source for the phase lag between the signal intensity and
longitudinal temperature grating [89]. The phase delay in this work was physically
manifested in the interdependent heat and laser gain equations whereby the
temperature and optical fields are influenced by the upper-state population density, N2.
37 Approved for public release. Distribution is unlimited.

N2 is an independent variable for the optical field equations but is a dependent variable
in the heat equations because these must change in response to the field equations.
This causes the electric field intensity to lead the thermal dynamics in phase. With this
treatment, the observed frequency difference was recovered from a first-principles
model and accurate MI thresholds were predicted for conventional step-index fiber and
gain tailored photonic crystal fiber (PCF) designs.
B. Role of Photodarkening
As mentioned in chapter 1, one MI mitigation technique is to reduce quantum defect
heating by amplifying a signal in a ytterbium-doped amplifier closer to the pump
wavelength of 976 nm. Also mentioned was the conditions that would make this a
difficult experiment to perform because the seed power influences both MI threshold
and ASE dynamics. This experiment was performed by the Jena group in a study that
conjectured that the role of photodarkening was very impactful for determining MI
threshold [21]. The main experimental evidence from Otto et al that photodarkening
influences MI threshold is given in a plot in figure 21. The figure shows actual MI
thresholds in a 62 µm core PCF according to first observed onset (blue) and several
trials after (black) according to wavelength. Recall from chapter 1 that one of the
signatures of MI is a hysteresis effect that causes the MI threshold to reduce with each
power scaling trial. Also shown is the numerically-derived population inversion
according to wavelength in green. The figure demonstrates an optimum MI threshold at
1030 nm wavelengths, and MI threshold is reduced when blue- and red-shifted from
1030 nm. According to relevant MI theory the MI threshold would continuously increase
when the wavelength is blue-shifted due to reduced quantum defect heating. Problems
exist, however, when analyzing the experiment to determine if the researchers properly
seeded the amplifier to mitigate ASE; which can interfere with the modal interference
because the ASE optical phase is random and would therefore reduce visibility of the
interfering modes. To properly seed the fiber amplifier to mitigate ASE, the seed power
must be several orders larger than the saturation power, given below as:
38 Approved for public release. Distribution is unlimited.

where Acore is the area of the core, υ is the optical frequency, h is Planck’s constant, σe/a
are the emission and absorption cross-sections, and τ is the upper-state lifetime for
ytterbium. With appropriate values in ytterbium at 1030 nm [22], the saturation power for
the 62 µm diameter Jena fiber is estimated as 0.81 W. An adequate figure of merit to
properly seed an amplifier is to exceed the saturation power by >100x. Naderi et al
seeded a 20/400 µm core/clad fiber amplifier operating at 1034 nm with 20 W [23] when
studying MI at wavelengths short than 1064 nm. This represents a 235x scaling of the
seed power relative to the saturation power of a 20/400 µm fiber of 0.084 W. The Jena
group, in contrast, exceeds the saturation power only by 25x at 1030 nm with the 62 µm
core rod-type amplifier. Saturation powers at 1010 nm and 1060 nm are higher than
1030 nm for the Jena fiber, and are, respectively, 1.12 W and 2.45 W. In the study by
Otto et al, the seed power was kept constant. At 1010 nm and 1060 nm, the 20 W seed
is only 17x and 8x above the saturation power, respectively. The seed power was
necessarily kept constant because MI has shown an increased threshold with increased
seed power. From the figure, MI threshold is reduced at 1010 nm and 1060 nm relative
to 1030. These results suggest that the effect measured was an artifact of an improperly
seeded amplifier. From this work, it is difficult to conclude that photodarkening is a
major factor in MI threshold physics. But nevertheless photodarkening may play a role
in determining MI threshold. A less ambiguous test that the researchers could have
attempted was to power scale at wavelengths 1080 nm to ~1150 nm to interrogate
wavelength dependence on MI threshold. In this spectral domain, the absorption is
nearly zero and the emission is much lower but is also nearly constant so a constant
seed power would not noticeably affect MI threshold.
39 Approved for public release. Distribution is unlimited.
(24)

Figure 21: The wavelength dependence of MI threshold is shown above from a study in [21] along with
the estimated population inversion curve (green).
There are two types of ASE, and only one is mitigated through proper seeding. The
process in which the laser is absorbed and re-emitted spontaneously at the same
wavelength, but out-of-phase with the original field can be mitigated by seeding at
higher powers and thereby saturating the gain at the laser wavelength. The process in
which the laser signal is absorbed and re-emitted at longer wavelengths is unavoidable
unless spectral filtering fibers are utilized.
C. MI in Raman Fiber Amplifiers
A less ambiguous test than Otto et al to determine the role of photodarkening in MI
dynamics may come in the form of power scaling LMA, cladding-pumped Raman fiber
amplifiers (CPRFAs). CPRFAs provide an interesting platform to experiment with MI
because of an absence of rare-earth dopants that are the cause for photodarkening.
Core pumped raman fiber amplifiers (RFAs) are not a good choice to test this effect
because the brightness of core pumped RFAs are limited by the pump source. The
major discrepancy between MI dynamics in CPRFAs and Ytterbium Doped Fiber
Amplifiers (YDFAs) that clouds an exact comparison for testing photodarkening is that
the Raman amplification along the length of a fiber is highly nonlinear, and leaves much
40 Approved for public release. Distribution is unlimited.

of the amplification, and corresponding quantum defect heating, at one of the
boundaries. Physical models have been proposed on MI in CPRFAs [24], and validate
that MI behaves differently. Notably, gain-tailoring of the core in CPRFAs does not offer
a significant increase in MI threshold.
4.2.2 Counter-pumped Amplifier
Figure 22: A schematic of the counter-pumped amplifier is shown above.
The free-space counter-pumped amplifier system is shown as a schematic in figure
22. A 1064 nm non-planar ring oscillator (NPRO) with a nominal frequency linewidth >
10 kHz is amplified in a 3-stage ytterbium-doped fiber amplifier from IPG photonics. The
~35 W output has PER > 20 dB, M2 < 1.2, negligible ASE and is functional with single-
frequency or phase-broadened seeds. A free-space Faraday isolator from EOTech is
used to collect backward-propagating light for spectral analysis. A 2-lens system is used
to mode-match the seed beam waist at focus with the waveguide mode. An optimum
design is initially posited using a wave optics simulation of the propagating beam with
ABCD matrices representing the lenses to properly prepare a beam waist of the desired
41 Approved for public release. Distribution is unlimited.

width to match the fundamental optical mode of the fiber. This design is then optimized
in practice by fine-tuning the distance between the two lenses to optimize the
transmitted beam M2 at the fiber output.
A fiber-coupled magnesium-doped lithium niobate phase modulator from EOSpace is
utilized for phase broadening, if needed. Phase broadening of the signal occurred
before amplification in the IPG amplifier. The 1.3 kW 976 nm fiber-coupled diode stack
from Laserline is coupled into the inner cladding waveguide of the double-clad fiber.
Dichroics are used to separate the pump and signal beams inside an enclosed housing
that is actively water-cooled; which is necessary because stray pump light from the
multimode pump fiber will heat the metal clamps holding the mirror and will cause
unwanted thermally-induced beam steering if left uncooled.
Unless otherwise noted, fiber facets are prepared by stripping the polymer coating and
angle-cleaved to ~4° to prevent parasitic laser oscillations engendered by Fresnel
reflections from competing with amplifier gain. The fiber tips are placed in aluminum
chucks that are actively water-cooled and sit atop 5-axis stages that are necessary to
align the beam due to the angle-cleave. Fibers are spooled, with attention paid to
maintain a constant coil axis, on aluminum spools. Arriving at the optimum diameter for
coiling of each fiber will be detailed below. Maintaining a constant bend axis relative to
the photonic structure of the microstructured fiber was critical to accurately study MI.
The suite of diagnostics used to characterize amplifier performance includes: power
meters to measure amplified signal and unused pump power, optical spectrum
analyzers (OSAs) to characterize the forward and backward spectra from the amplifier,
a spatial mode scanning M2 beam quality analysis system, a high-speed camera to
capture the onset of MI, and a self-heterodyne frequency analyzer. The last diagnostic
is used to capture high-resolution BGS of the spontaneously-generated Stokes light in
the amplifier in-situ while the amplifier is active so that comparisons can be made with
the pump probe. In this setup, a sample of the NPRO is mixed with the backward-
propagating light in a 3 dB splitter and the mixed signal illuminated a fast (26 GHz 3 dB
bandwidth) photodiode from Newport. The resulting signal, read on a radio frequency
spectrum analyzer, is the convolution of the two signals.
42 Approved for public release. Distribution is unlimited.

The amplifier is susceptible to parasitic pulsing that can damage the fiber due to ASE
and/or SBS processes. The initial damage to a small section of the fiber can be
exacerbated if the core is damaged and the signal loses guidance. In this case, a large
section of fiber will be pumped and unseeded; which will almost certainly result in more
extensive pulsing and the fiber can ignite. To prevent this, an electronic shutdown
system continuously monitors the output power and will sequentially shut down the
signal seed, pre-amps, and the pump if power momentarily drops. The circuitry
response is ~60 ms and is limited by mechanical responses of onboard relays. Ideally,
however, circuit response would be closer to the ~1 ms time scale for ytterbium upper-
state lifetimes so that significant build-up of inversion can be avoided if the seed is lost.
The counter-pumped scheme has advantages for free-space-coupled amplifiers over
co-pumped architectures for both performance and optical design reasons; which are
detailed below. From a seed coupling perspective, the compatible optical systems for a
co-pumped amplifier are very restrictive because both the signal and pump beams must
have coincident foci while the signal beam profile must match the fundamental mode
profile to properly seed the waveguide. This becomes cumbersome because the low-
brightness pump light restricts the number of short focal length (< 100 mm) lenses that
can be used while coupling the seed to the core is more manageable with more lenses.
The design is exacerbated with the additional complexity of correcting for beams that
are not collinear; which can occur if the multimode fiber containing the fiber light is not
precisely collimated. Additional beam steering methods must be used to steer the seed
or pump while introducing minimal aberrations because a 5-axis stage can only be
aligned to the seed or pump.
The counter-pumped amplifier, in contrast, does not rely on each beam having
coincident foci. The seed beam can utilize the requisite number of optics to efficiently
couple to the waveguide core without necessarily considering the effects of the pump,
and vice versa. Each beam can also be steered independently so as to ensure each
beam passes through critical optics in the center to minimize aberrations, and the 5-axis
stage used to mount the fiber can be aligned to the respective incoming beam.
The laser gain along the fiber depends on pumping direction as well, as was shown in
figure 2 in section 3.1. In a counter-pumped configuration, the highest ytterbium
43 Approved for public release. Distribution is unlimited.

inversion levels are coincident with the highest signal optical fields and overall power
levels along the fiber are not high until the end of the fiber. This contributes to a
favorable SBS threshold compared to co-pumping as described in section 3.1.
4.2.3 Hybrid Microstructured Fiber Power Scaling
A. Linewidth Broadening Schemes Employed
Figure 23: A temporal response of the optical phase modulation sequence for a 1 GHz clock rate, 7 bit pattern PRBS scheme is shown [25].
The Pump Probe BGS experiments with this fiber, described in section 3.1, indicated
that the natural BG coefficient was too high for single-frequency power scaling. Phase
broadening by applying a pseudo-random bit sequence (PRBS) bit pattern to an electro-
optic phase modulator was employed to mitigate SBS. In PRBS phase broadening, a
modulation depth between, say, zero phase shift and the π phase shift is determined.
The voltage difference between the zero phase shift voltage and the π phase shift
voltage on the electro-optics modulator, herein referred to as Vπ, is then discretized by
an integer number of bits and the PRBS sequence modulates between those discrete
drive voltages on time scales shorter than the phonon lifetime. The resulting temporal
response of the phase is rectangular pulses with varying temporal widths, and is shown
schematically in figure 23. The Fourier transform of this pattern is a sinc2 envelope, with
a bandwidth of the drive frequency, with discrete tones due to the random sequencing.
The number of discrete tones within the sinc2 envelope depends on the number of bits
between 0 and Vπ. A power spectral distribution of the optical output of a PRBS signal is
shown in figure 24. PRBS phase broadening has been shown as superior to white-noise
44 Approved for public release. Distribution is unlimited.

phase broadening [25], and the advent of low Vπ, fiber-coupled Lithium Niobate external
phase modulators makes this SBS suppression technique ideal for all-monolithic and
free-space fiber amplifiers.
Figure 24: The power spectral density of an optical signal after PRBS phase modulation with a 7 bit pattern driven at a clock rate of 2 GHz is shown above [26]. The left shows a long-range power spectrum while the right shows a more narrow frequency range with emphasis on the discrete tones comprising the
total response.
To find the optimal bit sequence and frequency settings, we utilized the figure of merit
offered by Zeringue et al [26] in which the spacing between the discrete single-
frequency tones underneath the sinc2 enveloped are spaced by a multiple of the
Brillouin gain bandwidth. In the case of the hybrid fiber, which had a measured BG
bandwidth of 42 MHz, a 1 GHz clock rate with a 15 bit sequence was chosen. This
provided a spacing between discrete tones of 66 MHz, or nearly 1.5x the BG bandwidth.
Optimal suppression for a given clock bandwidth is realized for a spacing between
discrete phase modulator tones of 2x the BG bandwidth. The argument for 2x the BG
bandwidth being optimized is that the Brillouin response of each discrete tone will not
appreciably seed one another while a bountiful amount of tones are available to
disperse the spontaneous Brillouin scattering. Our selection approaches this optimized
value.
In addition, the PRBS signal electronics were filtered to remove higher-order tones of
the sinc2 envelope from the power spectral density. This had the effect of drastically
reducing additional frequency spectra beyond the primary sinc2 envelope. The low pass
filter used to filter the RF spectrum was chosen to be 1/2 of the clock rate of the PRBS
system. The filtered spectrum can be seen in Figure 25 as detected using a heterodyne
45 Approved for public release. Distribution is unlimited.
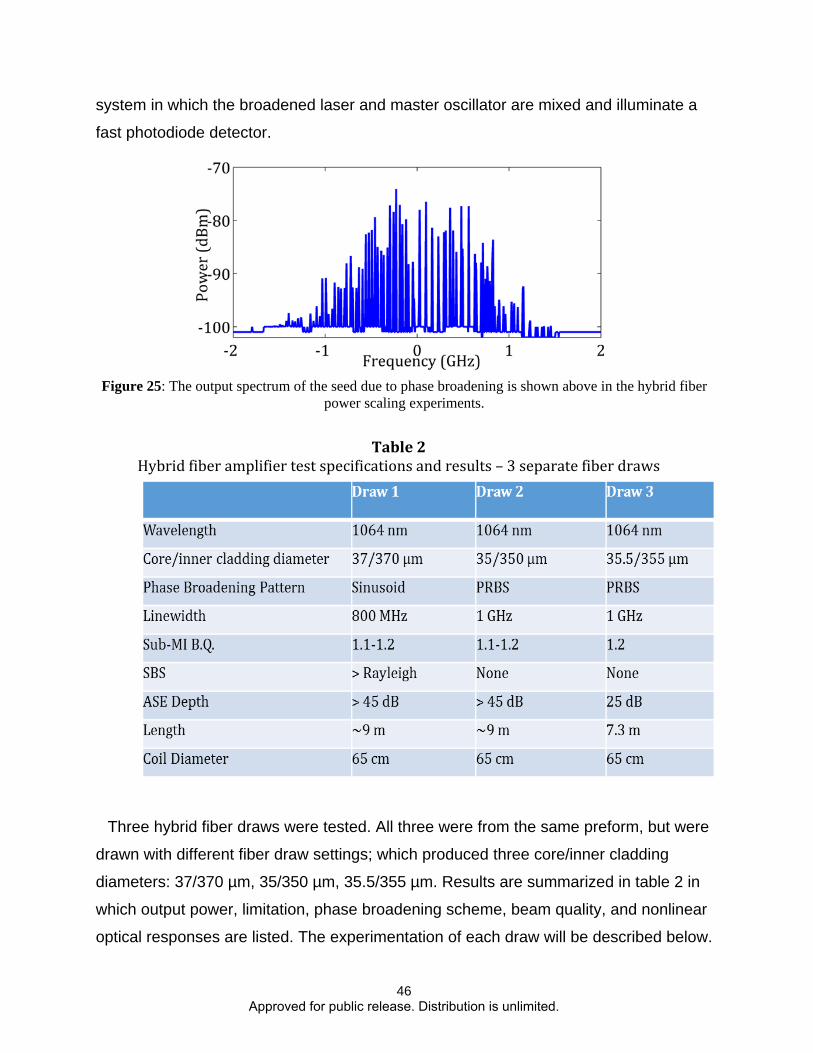
system in which the broadened laser and master oscillator are mixed and illuminate a
fast photodiode detector.
Three hybrid fiber draws were tested. All three were from the same preform, but were
drawn with different fiber draw settings; which produced three core/inner cladding
diameters: 37/370 µm, 35/350 µm, 35.5/355 µm. Results are summarized in table 2 in
which output power, limitation, phase broadening scheme, beam quality, and nonlinear
optical responses are listed. The experimentation of each draw will be described below.
46 Approved for public release. Distribution is unlimited.
Table 2 Hybrid fiber amplifier test specifications and results – 3 separate fiber draws
Figure 25: The output spectrum of the seed due to phase broadening is shown above in the hybrid fiber power scaling experiments.

Also, the optical-to-optical efficiency, unless otherwise noted, is taken with respect to
the launched pump power from the fiber emitting the diode light. The launched pump
light will experience ~4% Fresnel reflection at the air/glass interface. Other efficiency
metrics for free-space fiber amplifiers that are found in the literature include efficiency
with respect to the coupled pump and the absorbed pump. The coupled pump discounts
the 4% Fresnel reflections and the absorbed pump discounts the Fresnel reflections and
the unused pump as measured on the appropriate power meter. Thus, when
referencing optical-to-optical efficiencies in the literature it is important to distinguish
which metric is being discussed.
B. 37/370 µm Diameter Fiber
The 9 m amplifier was scaled to 750 W with M2 < 1.25 and frequency bandwidth of
800 MHz before thermal issues caused the fiber to fail. Figure 26 shows the amplified
signal versus launched pump for the first draw fiber. Notice the shift in conversion
efficiency at 900 W pump power. This was due to parasitic beam steering engendered
by stray pump light heating the dichroic mount. The pump began to couple into the
47 Approved for public release. Distribution is unlimited.
Figure 26: The pump power versus signal power for the 37/370 µm diameter core/clad is shown above. The change in response at 900 W pump is due to parasitic beam steering of the pump.

second cladding; which was in contact with the brass cooling chucks. The heating due
to brass absorption caused the fiber to fail.
Before failure due to thermal effects, both MI and SBS demonstrated signs of
threshold. The backward OSA high-resolution spectrum at 720 W signal power, shown
Figure 27: A high-resolution optical spectrum of the backward light is shown above. The spectrum of the 37/370 µm fiber under test is shown with ample Stokes light along with a reference spectrum with
no Stokes light.
in figure 27, shows the Rayleigh-scattered component of the spectrum with equal
magnitude to the longer-wavelength Stokes-scattered component. Sufficient Stokes
light is present in the fiber to cause catastrophic damage when the backward spectrum
consists of Stokes light greater than or equal to the Rayleigh light. This is the case in
the figure because the Stokes light at ~1064.55 nm is nearly equal in magnitude to the
Rayleigh light at ~1064.45 nm. The phase broadening scheme employed for this
experiment was a sinusoid pattern that continuously changed the drive voltage on the
phase modulator between 0-Vπ at 400 MHz. The high level of Stokes light in the fiber
demonstrates that this phase broadening scheme was insufficient for high power. The
poor performance of this phase broadening scheme engendered the implementation of
the PRBS phase broadening system discussed above.
48 Approved for public release. Distribution is unlimited.

49 Approved for public release. Distribution is unlimited.
The beam quality also showed signs that MI onset was pending. Figure 28 shows a
M2 versus pump power plot that shows an uptick of M2 at high pump powers. This,
unfortunately, is not an unambiguous sign that the fiber was suffering from MI. The
aforementioned beam steering that was affecting the pump coupling was also steering
the signal output. This signal output was also used to interrogate the beam quality and
was illuminating the Spiricon beam analyzer focusing lens at non-normal incident
angles. This introduced aberrations to the beam that could also explain the increase in
M2.
During subsequent testing, the fiber was fractured while spooling. Neither of the
lengths produced after the fracture would have been sufficiently long to produce the
high efficiencies needed to compare with standard Yb-doped fibers. Therefore, it is
unknown if the more advanced phase broadening schemes applied to the following
fibers would have identified the MI threshold unambiguously.
C. 35/350 µm Diameter Fiber
Figure 28: M2 beam quality versus signal power is shown above. The uptick in M2 at high powers may be a precursor to MI.

The 9 m amplifier was MI-free up to 820 W with near-diffraction-limited, SBS free
output. Figure 29 shows the amplified signal power versus pump power. The amplifier
operated at 78% efficiency when considering launched pump power.
Figure 29: The optical-to-optical power efficiency is shown above along with corresponding M2 values.
During subsequent measurements, the fiber pulsed ~3 m into the fiber creating two
useable sections that were 6 m and 3 m in length, but neither of these was scalable to
powers beyond 800 W because pump absorption was too low.
The 1 GHz, 15 bit sequence PRBS phase broadening scheme used to limit SBS was
proving effective at these power levels, as no Stokes light was detected in the high-
resolution OSA scan. At this frequency separation, trace Stokes light can reliably be
measured for depths below the Rayleigh light of ~30 dB. This indicates that the Stokes
light was propagating with at least 30 dB less power than the Rayleigh light in the hybrid
fiber.
At power levels above 820 W, dynamic MI onset was observed as evidenced dually by
a rapid degradation in beam quality and in observation of higher-order mode content
appearing in ~0.5 ms periods with the high-speed camera. Figure 30 shows individual
frames from the high speed camera. Images were acquired at a frame rate of 20,000
frames/sec. The figure shows rapid coupling of the fundamental mode and the first
higher-order mode.
50 Approved for public release. Distribution is unlimited.

51 Approved for public release. Distribution is unlimited.
It is interesting to note that MI occurred within the axis defined by the air gaps; which
is ostensibly able to more robustly guide the fundamental mode and strip higher-order
modes. This is evidenced by analyzing the M2 of each fiber axis versus pump power as
shown in figure 31; which shows the orientation of the high-index and air gap cladding
structures as an inset. This, however, does not offer unambiguous evidence that directly
tests the MI mitigating tendencies of PBG guidance versus modified-TIR. A fully time-
dependent, 3D beam propagation model to study these effects would provide more
clarity as to the better guiding mechanism to prevent MI.
t = 0 µs t = 100 t = 200 t = 300
t = 400 t = 500 t = 600 t = 700
Figure 30: Individual frames from a high-speed camera showing modal instability.
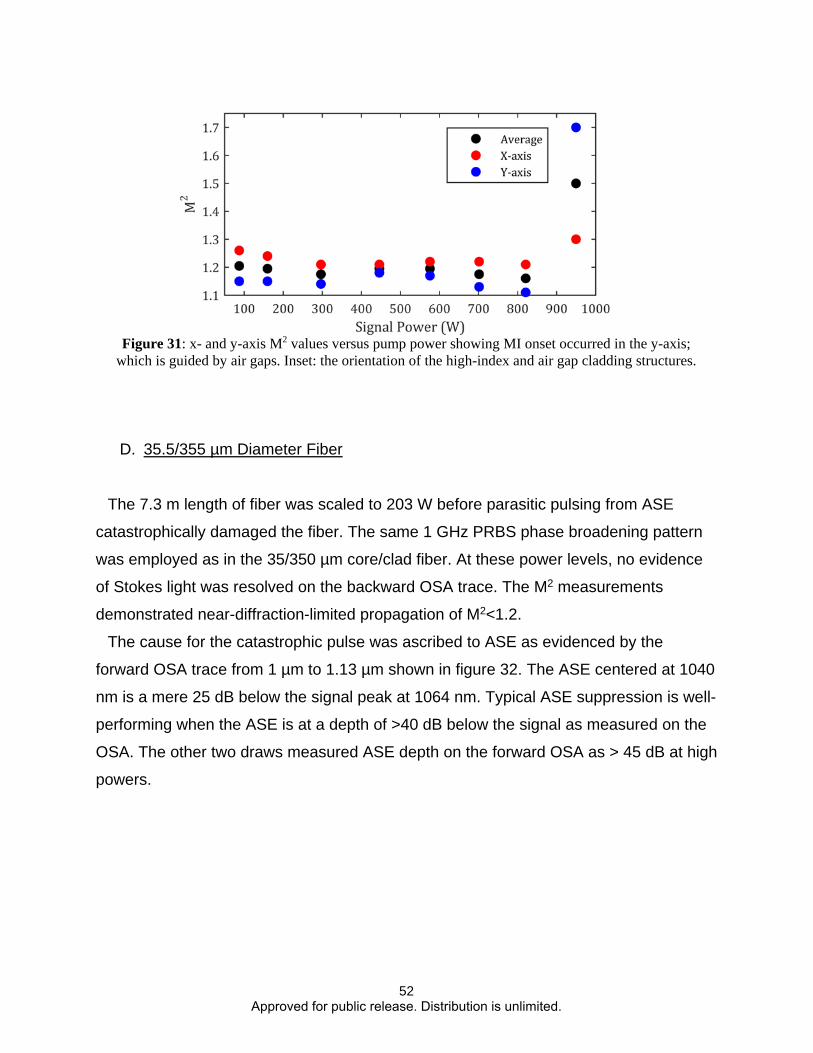
D. 35.5/355 µm Diameter Fiber
The 7.3 m length of fiber was scaled to 203 W before parasitic pulsing from ASE
catastrophically damaged the fiber. The same 1 GHz PRBS phase broadening pattern
was employed as in the 35/350 µm core/clad fiber. At these power levels, no evidence
of Stokes light was resolved on the backward OSA trace. The M2 measurements
demonstrated near-diffraction-limited propagation of M2<1.2.
The cause for the catastrophic pulse was ascribed to ASE as evidenced by the
forward OSA trace from 1 µm to 1.13 µm shown in figure 32. The ASE centered at 1040
nm is a mere 25 dB below the signal peak at 1064 nm. Typical ASE suppression is well-
performing when the ASE is at a depth of >40 dB below the signal as measured on the
OSA. The other two draws measured ASE depth on the forward OSA as > 45 dB at high
powers.
52 Approved for public release. Distribution is unlimited.
y
x
Figure 31: x- and y-axis M2 values versus pump power showing MI onset occurred in the y-axis; which is guided by air gaps. Inset: the orientation of the high-index and air gap cladding structures.
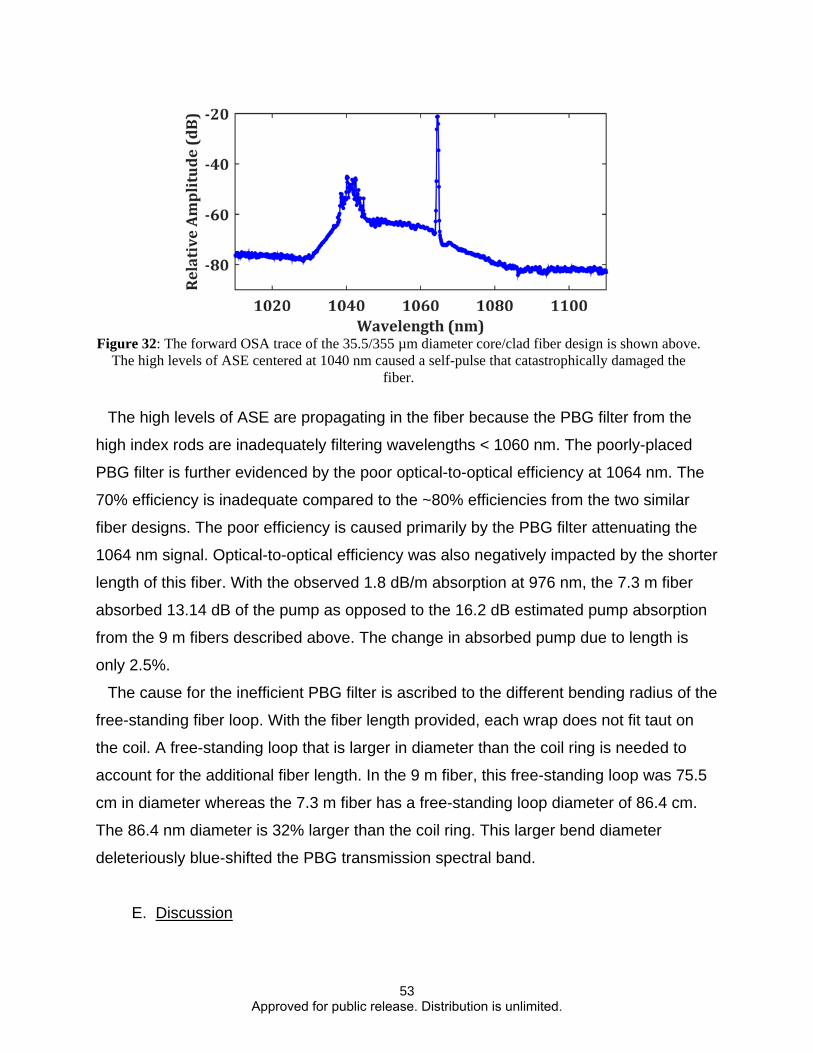
53 Approved for public release. Distribution is unlimited.
The high levels of ASE are propagating in the fiber because the PBG filter from the
high index rods are inadequately filtering wavelengths < 1060 nm. The poorly-placed
PBG filter is further evidenced by the poor optical-to-optical efficiency at 1064 nm. The
70% efficiency is inadequate compared to the ~80% efficiencies from the two similar
fiber designs. The poor efficiency is caused primarily by the PBG filter attenuating the
1064 nm signal. Optical-to-optical efficiency was also negatively impacted by the shorter
length of this fiber. With the observed 1.8 dB/m absorption at 976 nm, the 7.3 m fiber
absorbed 13.14 dB of the pump as opposed to the 16.2 dB estimated pump absorption
from the 9 m fibers described above. The change in absorbed pump due to length is
only 2.5%.
The cause for the inefficient PBG filter is ascribed to the different bending radius of the
free-standing fiber loop. With the fiber length provided, each wrap does not fit taut on
the coil. A free-standing loop that is larger in diameter than the coil ring is needed to
account for the additional fiber length. In the 9 m fiber, this free-standing loop was 75.5
cm in diameter whereas the 7.3 m fiber has a free-standing loop diameter of 86.4 cm.
The 86.4 nm diameter is 32% larger than the coil ring. This larger bend diameter
deleteriously blue-shifted the PBG transmission spectral band.
E. Discussion
Figure 32: The forward OSA trace of the 35.5/355 µm diameter core/clad fiber design is shown above. The high levels of ASE centered at 1040 nm caused a self-pulse that catastrophically damaged the
fiber.

The best performing fiber design was the MI-limited 35/350 µm core/clad fiber. This
fiber was also drawn with the smallest core and had the most narrow mode field
diameter. That the most MI-resistant fiber tested also has the smallest core diameter is
concordant with coupled-mode MI theory because this waveguide is expected to have
the largest frequency spacing between propagation constants, and thus the optical
mode beating interference will be smallest. This affects MI, in part, because thermal
diffusion from the longitudinal thermal grating can interfere with the process and smaller
gratings are more strongly influenced by this.
Microstructured fibers are susceptible to mechanisms that reduce efficiency that are
not found in conventional step-index fiber. These include: confinement losses to the
fundamental mode, pump coupling to the high-index rods, and increased scattering
losses in highly-doped GeO2 rods. Additional reduction in efficiency can be expected
due to the gain tailoring employed to mitigate MI because not the entire core is
ytterbium-bearing. The observed optical-to-optical efficiency of 78% in the second draw
is on par with conventional step-index fibers. This demonstrates that the effects due to
microstructures and gain tailoring do not noticeably affect amplifier performance.
Optimization of the PRBS linewidth was not possible because each fiber experienced
catastrophic failure during power scaling that caused fiber failure. After each fiber
failure, no section of fiber was > 6 m, and power scaling a short section with low Yb
concentrations would result in an inefficient MOPA. It is expected that more narrow
PRBS patterns will be able to sufficiently suppress SBS.
4.2.4 All-Solid Photonic Bandgap Fiber Power Scaling
The 50 µm diameter core and low gB of the PBGF were both conducive for high power
demonstrations of single-frequency power scaling. As such, no overt linewidth
broadening tactics were used. Single-longitudinal mode behavior of the oscillator was
verified with a 1 GHz free spectral range Fabry Perot interferometer. The oscillator
remained mode-hop-free for 10’s of hours while under inspection. In this study, the free-
standing loop was kept to a minimum so as to not interfere with the results because the
photonic resonance condition in PBGF is dependent on bend diameter. The coil axis of
54 Approved for public release. Distribution is unlimited.

the fiber in the experiments below was with the flat edge of the photonic lattice of the
PBGF parallel to the coil axis. The other extreme for PBGF coiling is for the fiber to be
coiled about the intersecting point on the photonic lattice.
A. Replication Study
The first experiment was to duplicate the results published in [27] with a similar coil
diameter and the same fiber, but with strict coil control implemented; which is to say that
the same flat edge of the hexagonal fiber was touching the spool throughout the full 7.3
m of coiling. The 70 cm diameter coiled amplifier reached single-frequency, MI free
amplification up to 368 W; which is 38 W lower than Pulford et al achieved. This lower
MI threshold is consistent with a hysteresis effect commonly encountered with MI-
suffering fibers. The origin of this hysteresis is believed to be a process that writes the
modal interference grating into the fiber by ytterbium concentration clustering. This
experiment demonstrates, among other things, that strict coil control cannot provide
enough differential mode loss to increase MI threshold. In the previous study, the fiber
was coiled with multiple 360° rotations of the photonic lattice about the axis of cylindrical
symmetry within the 7.3 m fiber.
The launched pump vs amplified signal power is shown in figure 33 for each power
scaling sequence. The replication study, in blue, was able to duplicate the optical-to-
optical efficiency of 79%. The depth of ASE as measured on the forward OSA was > 45
dB below the signal peak. No Stokes light was observed from the backward OSA in the
replication study. The PBGF is similarly susceptible to the reductions in efficiency listed
above for the hybrid fiber. The demonstration of a 79% optical-to-optical efficiency
demonstrates that these fiber waveguides can be reliably power scaled with high
conversion efficiency.
55 Approved for public release. Distribution is unlimited.

B. Out-of-Resonance Fiber Power Scaling
The optimization of environmental parameters of the power scaling experiments above
was done with low seed and no pump power. The shift in the PBG resonance condition
in response to bending, heating, thermal expansion, and gain dynamics that occurs at
high powers is not easily simulated, and was not corrected for in the experiments
above. The goal of the study discussed below was to power scale a fiber that performed
poorly at low powers to determine if the dynamics of the fiber in response to high heat
and stress loads shifted the photonic resonance favorably or unfavorably.
The fiber was coiled on a 43 cm diameter ring. At low powers, the M2 > 1.35 was due
to high levels of cladding light in the fiber. The mode behavior was stable on the high
speed camera; which indicated that the poor beam quality was a steady-state effect and
not due to MI. The forward spectrum at low powers was free of any non-seeded signals,
so ASE was not to blame for the poor M2. The origins of this cladding light is
conjectured as being 1064 nm light initially seeded to the core of the waveguide, but
that was stripped from the core to the cladding because the PBG waveguide attenuates
1064 nm.
56 Approved for public release. Distribution is unlimited.
Figure 33: The amplified signal versus launched pump is shown above for the Clemson PBGF. The original power scaling data is shown in black while the replication study is shown in blue. Markers
indicate the onset of MI in each case as evidenced by the rapid increase in M2.
M2 = 1.36 MI Onset
M2 = 1.36 MI Onset

The same section of MI-limited fiber discussed in the original and duplication studies
was used for this study, though 1 m removed to minimize the free-standing loop. As is
the case with the studies discussed above, no overt linewidth broadening tactics were
implemented.
While the coil was actively cooled with forced air, the amplifier was scaled to 347 W;
after which MI threshold was achieved. No section of the 6.3 m fiber was observed as
being heated above 60 °C. Temperature was monitored with a hand-held thermal
camera. The optical-to-optical efficiency was 69%. The reduction in conversion
efficiency compared to the 70 cm diameter coil was not significantly affected by the
shorter length. Only an estimated 2.5% more pump light was absorbed in the longer
fiber. The reduction in efficiency is prescribed to the PBG filter attenuating the 1064nm.
Thus, the PBG resonance does not favorably affect power scaling when the bend radius
is sub-optimal when no heat or stress gradients due to quantum defect heating exist.
This same fiber was then power scaled in the absence of continuous cooling. Instead,
forced air cooling was introduced locally to the sections of the fiber that exceeded 80 °C
solely to prevent thermal failure. With this variation, the MI-free threshold was scaled to
388 W; which is 11% higher than when continuously cooled. The fiber amplifier
performed similarly poor on the optical-to-optical efficiency at 69% conversion.
When cooling is introduced locally, the majority of the fiber is not sinked to cooling
elements and the temperature at the boundaries of the fiber is increased. This favorably
affects the MI threshold because the transverse temperature gradient is reduced when
the boundaries are not sinked to cooling. This explains the 41 W increase in MI
threshold between the continuously-cooled and locally-cooled fiber amplifiers.
4.2.5 Comparison and Discussion The results presented above represent the state-of-the-art power levels for narrow-
linewidth, near-diffraction limited hybrid MOPAs and All-solid PBGF MOPAs
respectively. The previous record for each fiber type was demonstrated at the weak Yb
emission spectral region near 1178 nm. Direct comparison studies at 1178 nm were not
possible because the photonic lattice of each fiber was not designed for propagation at
1178 nm.
57 Approved for public release. Distribution is unlimited.

With the exception of the 35.5/355 µm core/clad hybrid fiber, all microstructured fibers
studied were negatively impacted by MI. Ideally, a well-designed fiber waveguide
suitable for power scaling would have MI and SBS thresholds within ~10% of one
another. Neither of these fiber designs reached this criterion. The theoretical single-
frequency SBS limit of the PBGF was much larger than the observed MI threshold when
the estimated gB from the pump probe experiment is used. The SBS limits of the hybrid
fiber are also much larger than the observed MI limit when PRBS phase broadening is
implemented because no Stokes light was observed during power scaling with the 1
GHz, 15 bit sequence utilized. Waveguide designs for these microstructured fibers,
therefore, must concentrate on implementing more rigorous MI mitigation techniques.
In addition to optimizing the waveguide for MI suppression, experimental power
scaling systems can improve MI resistance with proper design. For example, seeding a
hexagonal waveguide core with a circular beam will engender unwanted coupling to
higher-order core modes or cladding modes. This can be improved by designing phase
screens that morph the collimated circular seed beam to a converging, hexagonal
beam. Additionally, pre-amplifiers utilizing microstructured fiber can be designed so that
the output of the pre-amplifier has similar transverse beam shape as the final-stage
amplifier.
The hybrid fiber demonstrated Raman suppression as explained in chapter 1 with the
experimental core transmission spectrum demonstrating high losses for wavelengths >
1110 nm because the PBG filter deterministically was designed to suppress the silica
Raman peak at 1120 nm. The PBGF was not tested directly for spectral
transmission/rejection at wavelengths > 1090 nm. Although each fiber was not able to
reach power levels in which spontaneous Raman scattering becomes detrimental to
laser linewidth, continuing to implement these suppression techniques will be necessary
if/when microstructured fibers sufficiently suppress SBS and MI.
The glass composition of the active regions in each microstructured fiber was different
with the PBGF composed of Yb-doped phosphate glass while the hybrid fiber contained
Yb-doped pure silica with Al and F used to match the optical refractive index. Each
glass composition has advantages and disadvantages. The phosphate-doped glass
permits higher ytterbium concentration without photodarkening [11], but the ytterbium
58 Approved for public release. Distribution is unlimited.

gain spectrum is blue-shifted [29] which causes both absorption and emission at 1064
nm to be weakened compared to the non-phosphate equivalent for a constant doping
concentration. In addition, phosphate fibers suffer from higher scattering cross-sections
[30]. Non-phosphate glasses have lower intrinsic loss at 1 µm and benefit from a higher
emission cross-section, but suffer from photodarkening when ytterbium doping
concentrations are less than half of that found in phosphate-doped glass.
The weaker emission cross-section at 1064 nm of the phosphate glass would cause
this glass composition to underperform compared to the non-phosphate equivalent in
terms of reliable amplification limitations. It is understood that ASE becomes
problematic in traditional pure-silica-doped ytterbium fiber amplifiers when amplification
exceeds ~17 dB, although 22 dB amplification has been reported [31]. Amplification
beyond 17 dB can lead to parasitic lasing at the ytterbium gain peak of ~1030 nm and/or
pulsing. The ASE problem is exacerbated for step-index phosphate fibers because the
emission cross-section is weaker at 1064 nm and the gain peak is near 1020 nm. The
phosphate-based PBGF, however, has the potential to mitigate the ASE threshold of 17
dB amplification because spectral filtering can significantly reduce ASE levels in the
core.
5. Conclusion
High-power ytterbium-doped fiber amplifiers designed with advanced waveguide
concepts are characterized and power scaled. Fiber waveguides utilizing cladding
microstructures to achieve wave guidance via the photonic bandgap (PBG) and a
combination of PBG and modified total internal reflection (MTIR) have been proposed
as viable single-mode waveguides. Such novel structures allow larger core diameters
(>35 μm diameters) than conventional step-index fibers while still maintaining near-
diffraction limited beam quality. These microstructured fibers are demonstrated as
robust single-mode waveguides at low powers and are power scaled to realize the
thermal power limits of the structure. Here above a certain power threshold, these coiled
few-mode fibers have been shown to be limited by modal instability (MI); where energy
is dynamically transferred between the fundamental mode and higher-order modes.
Nonlinear effects such as stimulated Brillouin scattering (SBS) are also studied in these
59 Approved for public release. Distribution is unlimited.

fiber waveguides as part of this dissertation. Suppressing SBS is critical towards
achieving narrow optical bandwidths (linewidths) necessary for efficient fiber amplifier
beam combining. Towards that end, new effects that favorably reduce acoustic wave
dispersion to increase the SBS threshold are discovered and reported.
The first advanced waveguide examined is a Yb-doped 50/400 µm diameter core/clad
PBGF. The PBGF is power scaled with a single-frequency 1064 nm seed to an MI-
limited 410 W with 79% optical-to-optical efficiency and near-diffraction limited beam
quality (M2 < 1.25) before MI onset. To this author’s knowledge, this represents >2.4x
improvement in power output from a PBGF amplifier. During power scaling, a
remarkably low Brillouin response was elicited from the fiber even when the ultra large
diameter 50 µm core is accounted for in the SBS threshold equation. Subsequent
interrogation of the Brillouin response in a pump probe Brillouin gain spectrum
diagnostic estimated a Brillouin gain coefficient, gB, of 0.62×10⁻¹¹ m/W; which is 4x
reduced from standard silica-based fiber. A finite element numerical model that solves
the inhomogenous Helmholtz equation that governs the acoustic and optical coupling in
SBS is utilized to verify experimental results with an estimated gB = 0.68×10⁻¹¹ m/W.
Consequently, a novel SBS-suppression mechanism based on inclusion of sub-optical
wavelength acoustic features in the core is proposed.
The second advanced waveguide analyzed is a 35/350 µm diameter core/clad fiber
that achieved wave guidance via both PBG and MTIR, and is referred to as a hybrid
fiber. The waveguide benefits mutually from the amenable properties of PBG and MTIR
wave guidance because robust single-mode propagation with minimal confinement loss
is assured due to MTIR effects, and the waveguide spectrally filters unwanted
wavelengths via the PBG effect. The waveguide employs annular Yb-doped gain
tailoring to reduce thermal effects and mitigate MI. Moreover, it is designed to suppress
Raman processes for a 1064 nm signal by attenuating wavelengths > 1110 nm via the
PBG effect. When seeded with a 1064 nm signal deterministically broadened to ~1
GHz, the hybrid fiber was power scaled to a MI-limited 820 W with 78% optical-to-
optical efficiency and near diffraction limited beam quality of M2 ~1.2 before MI onset.
This represents a 14x improvement in power output from a hybrid fiber, and
60 Approved for public release. Distribution is unlimited.

61 Approved for public release. Distribution is unlimited.
demonstrates that this type of fiber amplifier is a quality candidate for further power
scaling for beam combining.
6. References
1. R. G. Smith, "Optical Power Handling Capacity of Low Loss Optical Fibers as
Determined by Stimulated Raman and Brillouin Scattering," Applied Optics, vol. 11,
no. 11, pp. 2489-2494, 1972.
2. M. Hildebrandt, S. Busche, P. Webels, M. Frede and D. Kracht, "Brillouin
Scattering Spectra in High-Power Single-Frequency Ytterbium Doped Fiber
Amplifiers," Optics Express, vol. 16, no. 20, pp. 15970-15979, 2008.
3. N. A. Brilliant, "Stimulated Brillouin Scattering in a Dual-Clad Fiber Amplifier,"
Journal of the Optical Society of America B, vol. 19, no. 11, pp. 2551-2557, 2002.
4. C. Zeringue, C. Vergien and I. Dajani, "Pump-Limited, 203 W, Single-Frequency
Monolithic Fiber Amplifier Based on Laser Gain Competition," Optics Letters, vol.
36, no. 5, pp. 618-620, 2011.
5. C. Zeringue, "A Theoretical and Experimental Analysis of SBS Suppression
Through Modification of Amplifier Seed," PhD Dissertation, University of New
Mexico, 2011.
6. N. Shibata, R. G. Waarts and R. P. Braun, "Brillouin-Gain Spectra for Single-Mode
Fibers Having Pure-Silica, GeO2-doped, and P2O5-Doped Cores," Optics Letters,
vol. 12, no. 4, pp. 269-271, 1987.
7. M. Nikles, L. Thevenaz and P. A. Robert, "Brillouin Gain Spectrum
Characterization in Single-Mode Optical Fibers," Journal of Lightwave Technology,
vol. 15, no. 10, pp. 1842-1851, 1997.
8. G. Agrawal, Nonlinear Fiber Optics, Waltham, MA: Elsevier Academic Press, 2013.
9. T. Horiguchi, M. Tateda, N. Shibata and Y. Azuma, "Brillouin Gain Variations Due
to a Polarization-State Change of the Pump or Stokes Fields in Standard Single-
Mode Fibers," Optics Letters, vol. 14, no. 6, pp. 329-331, 1989.
10. M. Chen, A. Shirikawa, X. Fan, K.-i. Uead, C. B. Olausson, J. K. Lyngso and J.
Broeng, "Single Frequency Ytterbium Doped Photonic Bandgap Fiber Amplifier
at 1178 nm," Optics Express, vol. 20, no. 19, pp. 21044-21052, 2012.
62 Approved for public release. Distribution is unlimited.
11. Y. W. Lee, S. Sinha, M. J. F. Digonnet, R. L. Byer and S. Jiang, "Measurment of
High Photodarkening Resistance in Heavily Yb3+-Doped Phosphate Fibres,"
Electronics Letters, vol. 44, no. 1, pp. 14-16, 2008.
12. Y.-W. Lee, "Power Scaling of Yb-Doped Phosphate Fiber Laser and Amplifiers,"
PhD Dissertation, Stanford University, 2008.
13. B. Ward and J. Spring, "Finite Element Analysis of Brillouin Gain in SBS-
Suppressing Optical Fibers with Non-Uniform Acoustic Velocity Profiles," Optics
Express, vol. 17, no. 18, pp. 15685-15699, 2009.
14. K. Saitoh and M. Koshiba, "Full-Vectorial Imaginary-Distance Beam Propagation
Method Based on a Finite Element Scheme: Application to Photonic Crystal
Fibers," IEEE Journal of Quantum Electronics, vol. 38, no. 7, pp. 927-931, 2002.
15. M. Koshiba and Y. Tsuji, "Curvilinear Hybird Edge/Nodal Elements with Triangular
Shape for Guided-Wave Problems," Journal of Lightwave Technology, vol. 18, no.
5, pp. 737-743, 2000.
16. A. V. Smith and J. J. Smith, "Mode Instability in High Power Fiber Amplifiers,"
Optics Express, vol. 19, no. 11, pp. 10180-10192, 2012.
17. C. Jauregui, T. Eidam, J. Limpert and A. Tünnermann, "Impact of Modal
Interference on the Beam Quality of High-Power Fiber Amplifiers," Optics Express,
vol. 19, no. 4, pp. 3258-3271, 2011.
18. . Limpert, N. Deguil-Robin, I. Manek-Hönninger, F. Salin, F. Röser, A. Liem, T.
Schreiber, S. Nolte, H. Zellmer, A. Tünnermann, J. Broeng, A. Peterson and C.
Jakobsen, "High Power Rod-type Photonic Crystal Fiber Laser," Optics Express,
vol. 13, no. 4, pp. 1055-1058, 2005.
19. C. Jauregui, T. Eidam, H.-J. Otto, F. Stutzki, F. Jansen, J. Limpert and A.
Tünnermann, "Physical Origin of Mode Instabilities in High Power Fiber Laser
Systems," Optics Express, vol. 20, no. 12, pp. 12912-12925, 2012.
20. C. Jauregui, T. Eidam, H.-J. Otto, F. Stutzki, F. Jansen, J. Limpert and A.
Tunnermann, "Physical Origin of Mode Instabilities in High Power Fiber Laser
Systems," Optics Express, vol. 20, no. 12, pp. 12912-12925, 2012.

63 Approved for public release. Distribution is unlimited.
21. H.-J. Otto, N. Modsching, C. Jauregui, J. Limpert and A. Tünnermann, "Impact of
Photodarkening on the Mode Instability Threshold," Optics Express, vol. 23, no.
12, pp. 15265-15277, 2015.
22. H. M. Pask, R. J. Carman, D. C. Hanna, A. C. Tropper, P. R. Mackechnie and J.
M. Dawes, "Ytterbium-Doped Silica Fiber Lasers: Versatile Sources for the 1-1.2
micron Region," IEEE Journal of Selected Topics in Quantum Electronics, vol. 1,
no. 1, pp. 2-13, 1995.
23. N. A. Naderi, I. Dajani and A. Flores, "High-Efficiency, Kilowatt 1034 nm All-Fiber
Amplifier Operating at 11 pm Linewidth," Optics Letters, vol. 41, no. 5, p. 1018,
2016.
24. S. Naderi, I. Dajani, J. Grosek and T. Madden, "Theoretical and Numerical
Treatment of Modal Instability in High-Power Core and Cladding Pumped Raman
Fiber Amplifiers," Optics Express, vol. 24, no. 15, p. 16550, 2016.
25. B. Anderson, A. Flores, R. Holten and I. Dajani, "Comparison of Phase Modulated
Schemes for Coherently Combined Fiber Amplifiers," Optics Express, vol. 23, no.
21, pp. 27046-27060, 2015.
26. C. Zeringue, I. Dajani, S. Naderi, G. T. Moore and C. Robin, "A Theoretical Study
of Transient Stimulated Brillouin Scattering in Optical Fibers Seeded with Phase-
Modulated Light," Optics Express, vol. 20, no. 19, pp. 21196-21213, 2012.
27. B. Pulford, T. Ehrenreich, R. Holten, F. Kong, T. W. Hawkins, L. Dong and I.
Dajani, "400-W Near Diffraction-Limited Single-Frequency All-Solid Photonic
Bandgap Fiber Amplifier," Optics Letters, vol. 40, no. 10, pp. 2297-2300, 2015.
28. R. Koch, W. A. Clarkson, D. C. Hanna, S. Jiang, M. J. Myers, D. Rhonehouse, S.
J. Hamlin, U. Griebner and H. Schonnagel, "Efficient Room Temperature CW
Yb:Glass Laser Pumped by a 946 nm Nd:YAG Laser," Optics Communications,
vol. 134, no. 1-6, pp. 175-178, 1997.
29. Y. Jeong, J. Nilsson, J. K. Sahu, D. N. Payne, R. Horley, L. M. B. Hickey and P. W.
Turner, "Power Scaling of Single-Frequency Ytterbium-Doped Fiber Master-
Oscillator Power-Amplifier Sources up to 500 W," IEEE Journal of Selected Topics
in Quantum Electronics, vol. 13, no. 3, pp. 546-551, 2007.

64 Approved for public release. Distribution is unlimited.
30. Y.-W. Lee, M. J. F. Digonnet, S. Sinha, K. E. Urbanek, R. L. Byer and S. Jiang,
"High Power Yb3+-Doped Phosphate Fiber Amplifier," IEEE Journal of Selected
Topics in Quantum Electronics, vol. 15, no. 1, pp. 93-102, 2009.
31. M. D. Mermelstein, "SBS Threshold Measurements and Acoustic Beam
Propagation Modeling in Guiding and Anti-Guiding Single-Mode Optical Fibers,"
Optics Express, vol. 17, no. 18, pp. 16225-16237, 2009.

65 Approved for public release. Distribution is unlimited.
List of Acronyms
ACDC Alternating Current Direct Current
AFRL Air Force Research Laboratoty
ASE Amplified Spontaneous Emission
BG Band Gap
BGS Brillouin Gain Spectrum
BPM Beam Propagation Model
BS Beam Splitter
CAD Computer Aided Design
CPRFA Cladding-Pumped Raman Fiber Amplifiers
DS Dual-source
FWHM Full Width at Half Maximum
IPG (Company Name)
LMA Large Mode Area
MI Modal Instability
MO Master Oscillator
MOPA Master Oscillator Power Amplifier
MOPA Master Oscillator Power Amplifier
MTIR Modified Total Internal Reflection
NKT (Company Name)
NPRO Non-planar Ring Oscillator
OFS (Company Name)
OSA Optical Spectrum Analyzers
PBGF Photonic Band Gap Fiber
PBS Polarization Beam Splitter
PCF Photonic Crystal Fiber
PER Polarization Extinction Ration

66 Approved for public release. Distribution is unlimited.
PM Power Meters
RE Rare-Earth
RF Radio Frequency
RFA Raman Fiber Amplifiers
RFSA Radio Frequency Spectrum Analyzer
SBS Stimulated Brillouin Backscattering
SFPI Scanning Fabry Perot Interferometer
SNR Signal-to-Noise Ratio
SRS Stimulated Raman Scattering
TIR Total Internal Reflection
Yb Ytterbium
YDFA Ytterbium Doped Fiber Amplifier

67 Approved for public release. Distribution is unlimited.
DISTRIBUTION LIST
DTIC/OCP 8725 John J. Kingman Rd, Suite 0944 Ft Belvoir, VA 22060-6218 1 cy
AFRL/RVIL Kirtland AFB, NM 87117-5776 1 cy
Benjamin Pulford Official Record Copy AFRL/RDLT 1 cy