
Control of Invasive Species: Lessons from Miconia in Hawaiikburnett/micisland.pdfControl of Invasive...
25
Control of Invasive Species: Lessons from Miconia in Hawaii Brooks Kaiser a, b , Kimberly Burnett a , James Roumasset a November 11, 2005 a University of Hawaii, Manoa, HI b Gettysburg College, Gettysburg, PA
Transcript of Control of Invasive Species: Lessons from Miconia in Hawaiikburnett/micisland.pdfControl of Invasive...
Control of Invasive Species: Lessons from Miconia in Hawaii
Brooks Kaisera, b , Kimberly Burnett a, James Roumasset a
November 11, 2005
a University of Hawaii, Manoa, HI
b Gettysburg College, Gettysburg, PA
1. Introduction
Invasive species change ecosystems and the economic services that ecosystems provide. Policy
decisions regarding existing invasive species must compare the anticipated and actual costs and
benefits of any mitigating actions once a species has become established to the anticipated costs
and benefits of accommodating the change (control). Optimal policy regarding invasive species
will minimize the expected damages and costs of control within an ecosystem.
Theoretical treatment of invasions introduces conditions for eradication (Olson and Roy, 2002),
policy options under uncertainty (Horan et al, 2002; Eiswerth and van Kooten, 2002; Olson and
Roy, 2002), and integrated prevention and control (Pitafi and Roumasset, 2005). Here, we seek
to apply the theory to the case of an invasive shrubby tree, Miconia calvescens, now present in
Hawaii. By testing the theory with a real-world case, we intend to highlight both the usefulness
of the theory and its limitations.
The case of Miconia is used to illustrate dynamic policy options for forest invasive species that
are already present in an ecosystem. Hawaii’s forest ecosystems provide direct and indirect
ecosystem services, with high expected value generated from the preservation of existing
ecosystem conditions stemming from unique biodiversity assets. Miconia generates concerns
that extend from biodiversity to infrastructure for water supply as it threatens moist tropical
island watersheds and forest ecosystems.
In most if not all cases, the most costly anticipated changes are irreversible. Due to the need to
anticipate irreversible change, policy decisions may vary with the status of ecosystem health, i.e.
the levels of invasion and the imminence of the threat. In this work, we seek to explain how
biology and economics work together to determine policy. To improve outcomes and avoid
costly mistakes ranging from denying beneficial introductions to spending good money on
ecologically impossible control or eradication efforts, these policies must be seen as a continuous
effort to manage ecosystems rather than separate decisions handled as emergencies as they
2
arrive. A case study approach allows us to investigate how useful the existing economic theory
of invasions will be at facilitating these efforts.
2. Case Overview: Miconia Calvescens
One significant threat to Hawaii’s forest ecosystems comes in the form of the woody shrub,
Miconia calvescens. A member of the Melastomataceae family from Central America, the plant
was purposefully introduced to Hawaii; starting in a handful of back yards and arboretums four
decades ago, it has been spreading with increasing rapidity on the islands of Maui and Hawaii. It
is also present on Kauai and Oahu, though it has not yet claimed significant acreage in either
location.
A model of its potential expansion and damages is available through comparison with Tahiti,
where dense, monotypic stands of the tree now cover 65% or more of the main island of Tahiti
after a single specimen was introduced to the Papeari Botanical Garden in 1937 (Medeiros,
Loope et al. 1997). Miconia has earned itself descriptors like the “green cancer” of Tahiti and the
“purple plague” of Hawaii. Vast tracts of Miconia have wiped out native forest and reduced
forest cover, increasing the potential for soil erosion, landslides, and damages to near-shore
resources. The explosive growth in Tahiti was not obvious, however, until aided by two
successive hurricanes in the 1980s, at which point the ornamental plant was already established
in Hawaii.
The damages in Tahiti and the potential threats to Hawaiian biodiversity and forested watersheds
have rendered Miconia a priority weed in Hawaii. Since the early 1990s, millions of dollars have
been spent in the battle against its spread, though success at spatial containment on Hawaii and
Maui and eradication on Oahu and Kauai remains at bay. We explore quantitatively the policy
options and their economic consequences for the continued treatment of the invasion in the
modeling and discussion sections below.
3
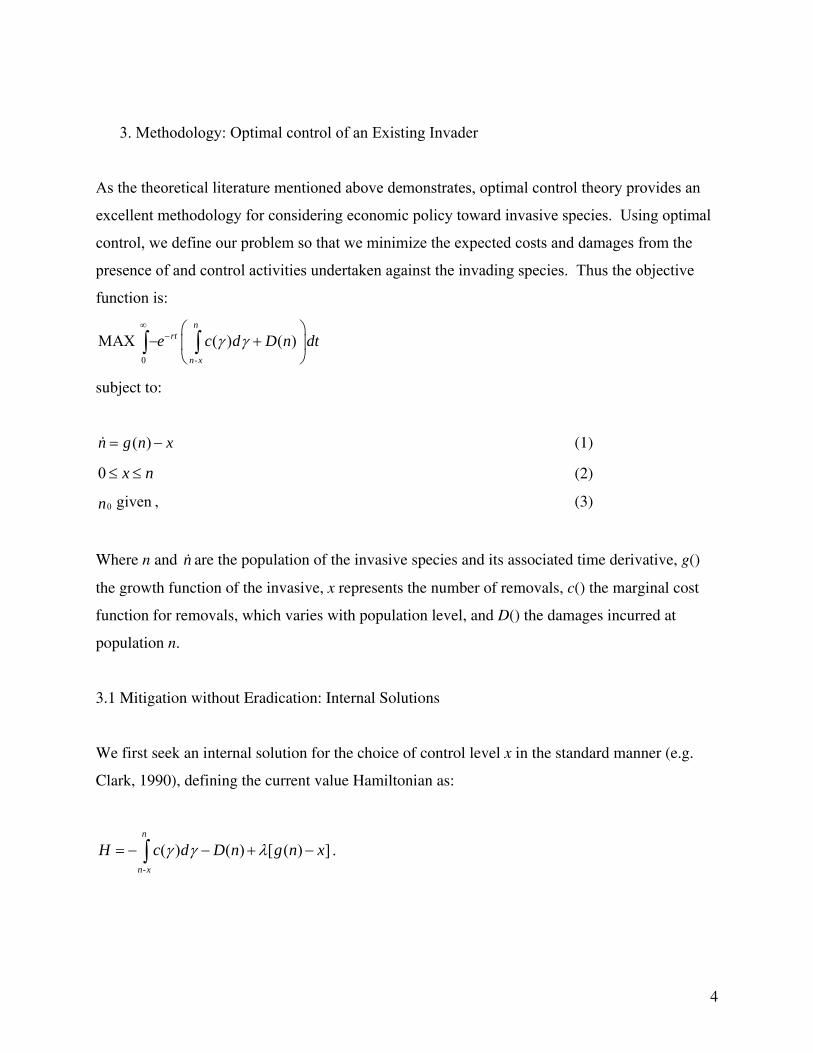
3. Methodology: Optimal control of an Existing Invader
As the theoretical literature mentioned above demonstrates, optimal control theory provides an
excellent methodology for considering economic policy toward invasive species. Using optimal
control, we define our problem so that we minimize the expected costs and damages from the
presence of and control activities undertaken against the invading species. Thus the objective
function is:
0 -
MAX ( ) ( )n
rt
n x
e c d D nγ γ∞
− ⎛ ⎞− +⎜ ⎟
⎝ ⎠∫ ∫ dt
x
subject to:
( )n g n x= − (1)
0 x n≤ ≤ (2)
0 givenn , (3)
Where n and are the population of the invasive species and its associated time derivative, g()
the growth function of the invasive, x represents the number of removals, c() the marginal cost
function for removals, which varies with population level, and D() the damages incurred at
population n.
n
3.1 Mitigation without Eradication: Internal Solutions
We first seek an internal solution for the choice of control level x in the standard manner (e.g.
Clark, 1990), defining the current value Hamiltonian as:
-
( ) ( ) [ ( ) ]n
n x
H c d D n g nγ γ λ= − − + −∫ .
4
Application of the Maximum Principle (assuming an interior solution for x) generates first order
conditions:
( )H c n x 0x
λ∂= − − − =
∂ (4)
[ ( ) ( )] '( ) '( )H c n c n x D n g n rn
λ λ λ∂= − − − − + = −
∂ (5)
( )H g n x nλ
∂= − =
∂ (6)
Taking time derivatives of (4) yields
'( )( )c n x n xλ = − − − (7)
Substituting (4), (6), and (7) into (5) yields
( ) '( ) [ '( ) 1] ( )( )'( )
c n D n g n r c n xx g n xc n x
+ + − − −= − +
−. (8)
Optimal harvest of the invasive species will result in a steady state population when
( )x n g n x= = − and thus
( ) '( ) [ '( ) 1] ( ) 0'( )
c n D n g n r c n xc n x
+ + − − −=
−, (9)
or
( ) '( ) [ '( ) 1] ( )c n D n g n r c n x− − = − − − . (10)
In other words, the marginal costs and damages of the steady state population (LHS) must be just
equal to the marginal opportunity costs of maintaining that population (RHS). If the LHS is
5
greater than the RHS, we should be increasing the harvest rate, while if the LHS is less than the
RHS, we should be decreasing the harvest rate.
3.2 Eradication or Accommodation: Corner Solutions
The internal solution must be compared to alternative policy options of eradication (x*=n) or
accommodation (x*=0). Thus, we compare the present value of eradication and accommodation
policies to the present value of the internal solution to determine if the internal solution is
dominated by either alternative.
The optimal policy for an existing invader can then be summarized by considering first where
the population is in relation to an optimal steady state population, as determined by minimizing
the present value of damages and control costs across an infinite time horizon. If the population
is currently at this steady state population, then we continue to harvest new growth at the steady
state, generating a stream of minimized economic costs and damages indefinitely, unless
eradication or accommodation has a lower expected present value of costs and damages. If the
population is currently above the steady state population, we expend control costs to reduce the
population to its steady state and then maintain that population, unless, again, a corner solution is
preferable. If the population lies below the steady state population, we accumulate damages as
the population grows which are lower than the costs of maintaining these lower populations,
until at the steady state population we initiate maintenance as described above.
4. Empirical Investigation
We investigate empirically the case of Miconia calvescens, discussed above. We determine cost,
damage, and growth function parameters with the help of scientists researching the species and
resource managers actively pursuing Miconia control. As potential habitat size, costs of control,
and damages vary widely across space, we specify each by island. The parameters are discussed
below, followed by results.
6
4.1 Growth Function
We utilize a standard logistic growth function to represent the spread of the invasive tree.
Thus:
( ) 1 ,ng n bnK
⎛= −⎜⎝ ⎠
⎞⎟ (11)
Where b is the intrinsic growth rate, estimated here to be 0.3, and K is the carrying capacity,
estimated to be 100 trees per acre over 1.2 million acres, or 120,000,000. The carrying capacity
is determined by the chief limiting factor for Miconia in Hawaii, precipitation, so the potential
range indicates areas above the 1800 mm/yr rainfall line as delineated in state GIS data (DBEDT,
2005). The growth rate was determined by analyzing the spread of the tree on Hawaii, where we
know the origins of the first population and its spread until harvesting began in the mid 1990s.
The standard logistic function is chosen because a single tree is capable of starting a population.
The seed bank is not addressed directly by the growth function; instead, we rely on the need to
return to a tree to treat its seed bank over time to build in the effects of the seed bank on reducing
the effectiveness of control cost expenditures (see cost function discussion). Carrying capacities
for each island are listed in Table 1.
Table 1. Carrying Capacity by island
Island K
Kauai 15,849,057
Oahu 8,713,551
Maui 14,133,791
Hawaii 78,216,124
Molokai 3,087,479
7
4.2 Damage (Net Benefit) Function
We estimate damages from Miconia as evolving from indirect ecosystem services as well as non-
market goods like biodiversity. Particularly significant threats are a reduction in habitat for
endangered species and a shift in the hydrological cycle that may reduce freshwater recharge and
increase runoff and sedimentation.
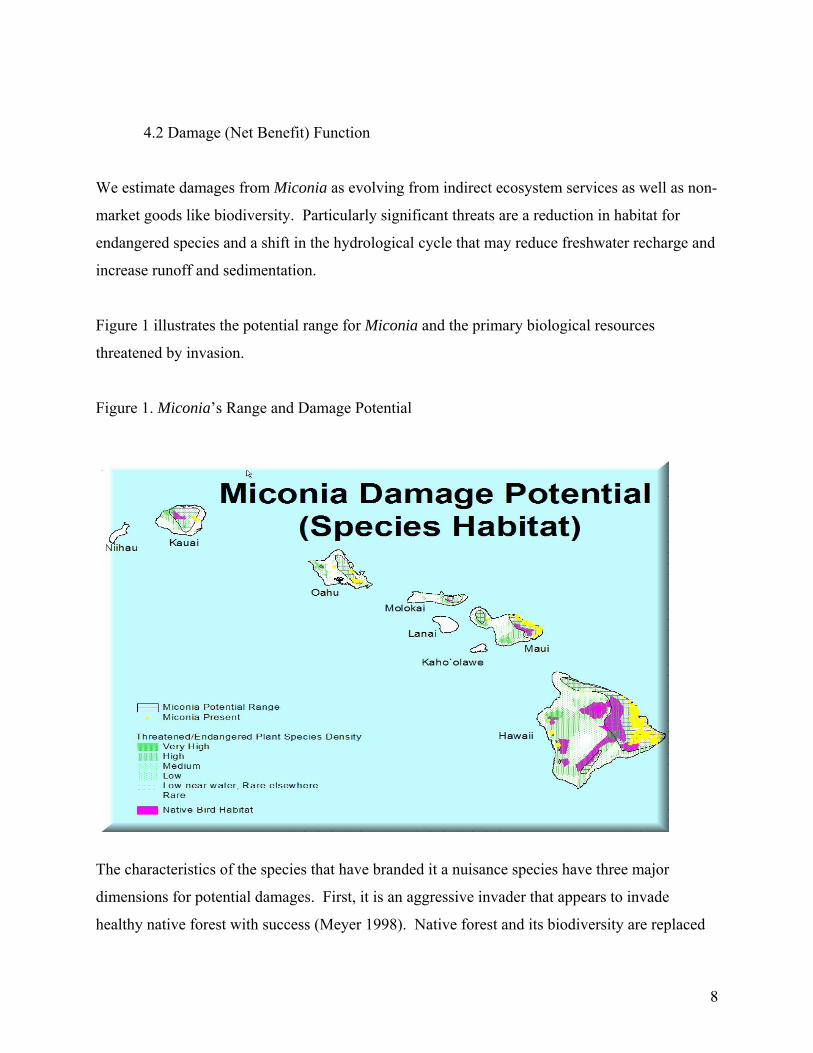
Figure 1 illustrates the potential range for Miconia and the primary biological resources
threatened by invasion.
Figure 1. Miconia’s Range and Damage Potential
The characteristics of the species that have branded it a nuisance species have three major
dimensions for potential damages. First, it is an aggressive invader that appears to invade
healthy native forest with success (Meyer 1998). Native forest and its biodiversity are replaced
8
with dense, monotypic stands of Miconia that shade out all undergrowth and may change soil
chemistry. Second, the seed bank develops quickly once the tree reaches flowering and fruiting
size of 4-5 meters (4 cm dbh; at least 4-5 years of age) as a single tree can flower and fruit 2-3
times a year, with a typical fruiting event producing 3 million seeds (Loope 1997). Third, the
seed bank has some longevity. It is known to last over 2 years, and may be as long as 10 years
(Loope 1997; D. Duffy personal communication 2005). Canopy openings are quickly taken
advantage of by new seedlings. Wind dispersal appears most prevalent, though birds are also
dispersal agents. With sufficient rainfall (greater than 1800 mm / yr) and canopy openings, a
single specimen may, in 5-15 years, start a stand that covers several hundred acres.
Hawaii is home to a great percentage of the United States’ and the world’s identified endangered
species. Changes in forest composition as described may threaten endangered plant species, bird
species, and invertebrate species in particular. Hawaii’s evolutionary isolation has led to much
adaptive radiation of species, where a single ancestor has generated a set of species that each
depend on new and different types of habitat; the state is considered to house the most unique
and diverse snail population in the world despite the limitation that only 15% of snail families
are represented (Asquith 1995). The wet, higher elevations of Maui and Hawaii contain most of
the only healthy remaining native forest supporting such diversity in the state, and are now
threatened by Miconia. For example, the upper Kipahulu Valley on Maui is a conservation
district reserve containing stands of Ohia (Metrosideros polymorphata) and Koa (Acacia koa)
that are the primary habitat for rare native Hawaiian birds and insects, and Miconia has been
discovered in the lower valley (Staff 2001).
In the federal register listing materials for the endangered Elepaio (Chasiempis sandwichensis)
bird on Oahu, the main justification for protection is based on the bird’s reliance on the current
forest structure (see Service 2001 for example). Since Miconia poses a significant threat to that
structure, the plant is listed directly as one of the concerns for the bird’s survival. A set of
studies indicates that, on average, each household would be willing to pay $31 (95% confidence
interval of $16.66-$48.92) per bird species per year to keep a species from extinction (Loomis
and White 1996). This amounts to an annual value for Hawaii state residents of $12.4 million
9
per avian species preserved. From the confidence interval, we assume the damages would lie
between $6.7m and $19.6m.
Economic theory and research predicts that households will value invertebrates and plants at
lower levels (Loomis and White 1996), and that non-residents will also have lower aggregate
values. For these reasons, we focus on bird losses to provide a lower bound estimate of expected
damages.
Additionally, damages to watershed functions are expected from dense stands of
Miconia. The hydrological properties of Miconia suggest that there may be a significant change
in the water balance, with an increase in runoff and a potential reduction in groundwater
recharge1. Estimates of potential expected losses from an invasion of Miconia on Oahu to
groundwater recharge suggest that a loss of 41 million gallons per day (mgd) would generate
economic losses of $137 million per year (Kaiser and Roumasset 2002), or $3.3 million per mgd.
Additionally, increased surface water runoff is expected to increase damages by $1.2 million per
mgd reduction in groundwater due to increased sedimentation costs (Kaiser and Roumasset
2000). Figure 2 illustrates the groundwater assets at risk.
10
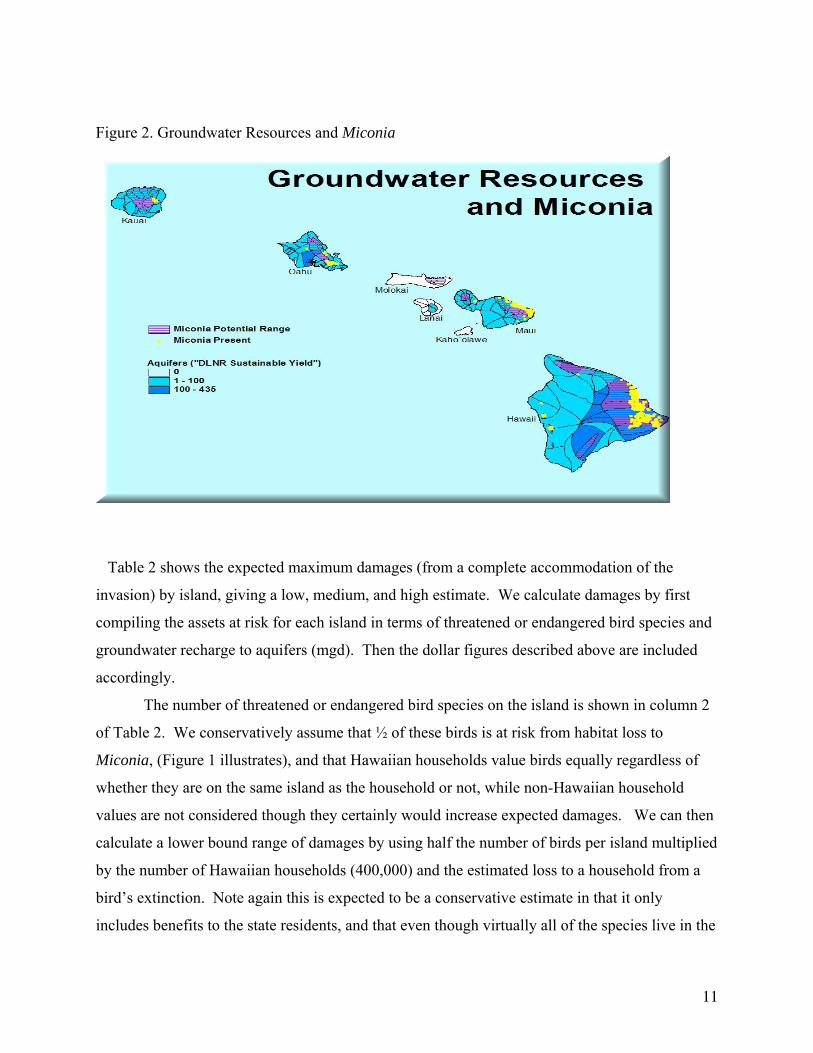
Figure 2. Groundwater Resources and Miconia
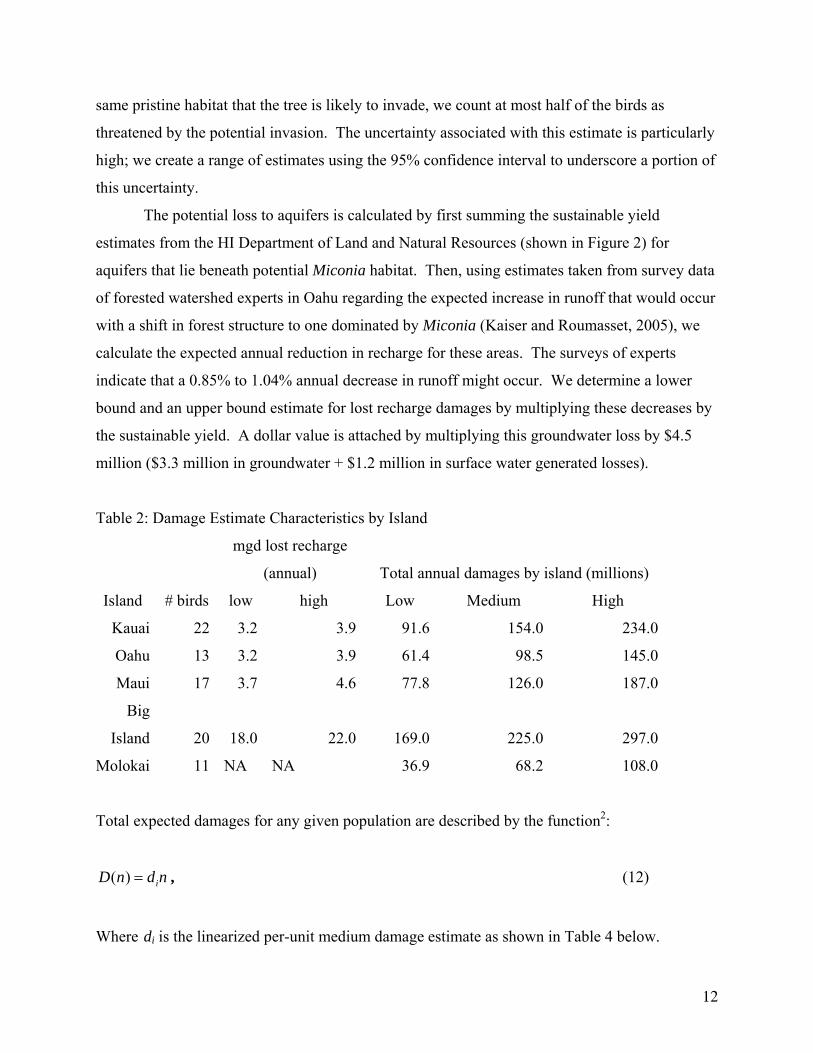
Table 2 shows the expected maximum damages (from a complete accommodation of the
invasion) by island, giving a low, medium, and high estimate. We calculate damages by first
compiling the assets at risk for each island in terms of threatened or endangered bird species and
groundwater recharge to aquifers (mgd). Then the dollar figures described above are included
accordingly.
The number of threatened or endangered bird species on the island is shown in column 2
of Table 2. We conservatively assume that ½ of these birds is at risk from habitat loss to
Miconia, (Figure 1 illustrates), and that Hawaiian households value birds equally regardless of
whether they are on the same island as the household or not, while non-Hawaiian household
values are not considered though they certainly would increase expected damages. We can then
calculate a lower bound range of damages by using half the number of birds per island multiplied
by the number of Hawaiian households (400,000) and the estimated loss to a household from a
bird’s extinction. Note again this is expected to be a conservative estimate in that it only
includes benefits to the state residents, and that even though virtually all of the species live in the
11
same pristine habitat that the tree is likely to invade, we count at most half of the birds as
threatened by the potential invasion. The uncertainty associated with this estimate is particularly
high; we create a range of estimates using the 95% confidence interval to underscore a portion of
this uncertainty.
The potential loss to aquifers is calculated by first summing the sustainable yield
estimates from the HI Department of Land and Natural Resources (shown in Figure 2) for
aquifers that lie beneath potential Miconia habitat. Then, using estimates taken from survey data
of forested watershed experts in Oahu regarding the expected increase in runoff that would occur
with a shift in forest structure to one dominated by Miconia (Kaiser and Roumasset, 2005), we
calculate the expected annual reduction in recharge for these areas. The surveys of experts
indicate that a 0.85% to 1.04% annual decrease in runoff might occur. We determine a lower
bound and an upper bound estimate for lost recharge damages by multiplying these decreases by
the sustainable yield. A dollar value is attached by multiplying this groundwater loss by $4.5
million ($3.3 million in groundwater + $1.2 million in surface water generated losses).
Table 2: Damage Estimate Characteristics by Island
mgd lost recharge
(annual) Total annual damages by island (millions)
Island # birds low high Low Medium High
Kauai 22 3.2 3.9 91.6 154.0 234.0
Oahu 13 3.2 3.9 61.4 98.5 145.0
Maui 17 3.7 4.6 77.8 126.0 187.0
Big
Island 20 18.0 22.0 169.0 225.0 297.0
Molokai 11 NA NA 36.9 68.2 108.0
Total expected damages for any given population are described by the function2:
( ) iD n d n= , (12)
Where di is the linearized per-unit medium damage estimate as shown in Table 4 below.
12
4.3 Control Cost Function
Control efforts began on Maui in 1991 and continue to expand on the four invaded islands.
Control in these areas begins with reconnaissance in helicopters to identify infestations and is
followed by either herbicide treatment from the helicopters themselves or by operations on the
ground to treat or manually pull the trees. In any case, there are two separate activities that must
occur – the trees must first be found, then treated.
We therefore define a cost function consisting of two parts, the “search” component and the
“treatment” component. While the unit cost of treating a tree with herbicide and/or cutting a tree
may be constant across population levels, the cost of finding a tree is rapidly decreasing in
population size. That is, it is extremely expensive to find the last tree, but much less so to find
one tree out of 120 million trees.
Because each island is unique in aspects such as topography, area, and vegetation, it is helpful to
estimate separate cost of control functions for all five major islands. We determine the two
components for each island in the following manner. The search component involves a fixed cost
which depends on the island’s potential habitat acreage and which decreases with increased
access to that habitat. Based on discussions with resource managers, searching one average acre
for Miconia costs approximately $1,000. Therefore, the numerator of the search component is
obtained by multiplying the number of potential acres by $1,000.
However, the ability to search an island’s habitat will depend on several characteristics of the
surrounding area, such as density of vegetation, the steepness of the terrain, etc. One major
determinant is ease of access into the potential habitat. We use the combined length of roads and
trails as a proxy for this variable. The length of roads and trails as compared to Molokai, the
most expensive island to search because it has the fewest roads and trails per acre of habitat, is
used to determine the coefficient γ in the denominator of the search component. Higher values
for γ imply greater ease of access, which translate into lower search costs.
13
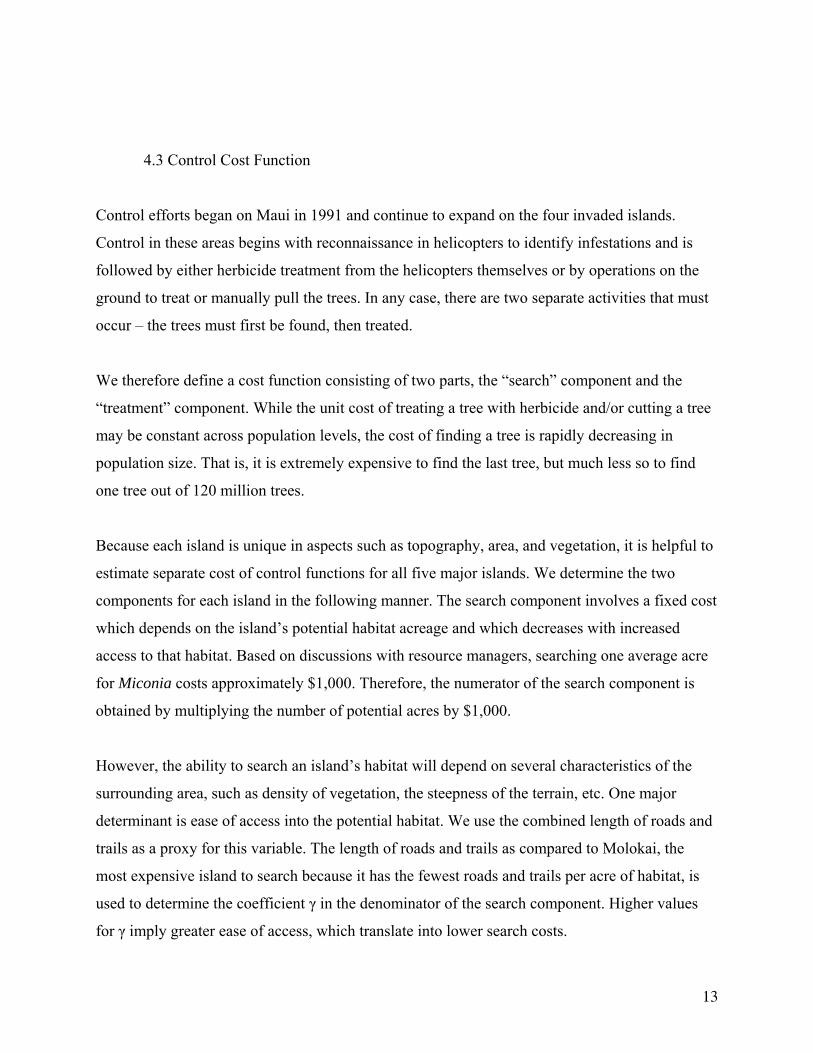
$1,000*potential acres( )xnγ
σ = ,
( ) 13.39xτ = ,
where ( )xσ represents the search cost component and ( )xτ represents the cost of treatment,
constant across all population levels. Total marginal cost is thus defined as:
$1,000*potential acres( , ) ( ) ( ) 13.39c n x x xnγ
σ τ= + = + , so that the total cost of searching and
treating x trees is:
$1,000*potential acres( , ) 13.39 *c n x xnγ
⎛= ⎜⎝ ⎠
⎞+ ⎟ (13)
While search costs will differ across islands, we assume that treatment costs remain constant
across islands. We begin by fitting these functions for the islands of Oahu and Maui. While the
exact budget for all islands is uncertain, we do have a good understanding of control budgets on
Oahu and Maui. Oahu Invasive Species Committee allocated $321,000 to Miconia control in
2005 (Ryan Smith, personal communication) while Maui expends approximately $1 million per
year on Miconia related activities (Teya Penniman, personal communication). These status quo
levels of expenditures, along with estimates of current populations, allow us to parameterize the
control function appropriately.
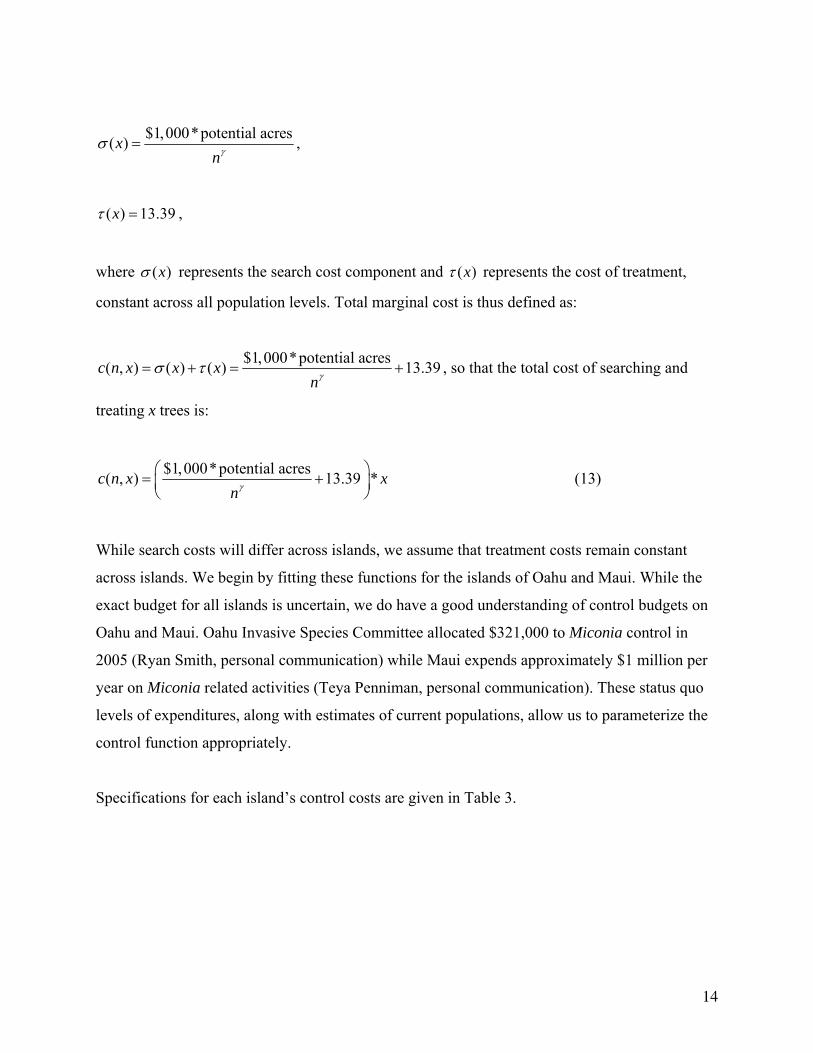
Specifications for each island’s control costs are given in Table 3.
14
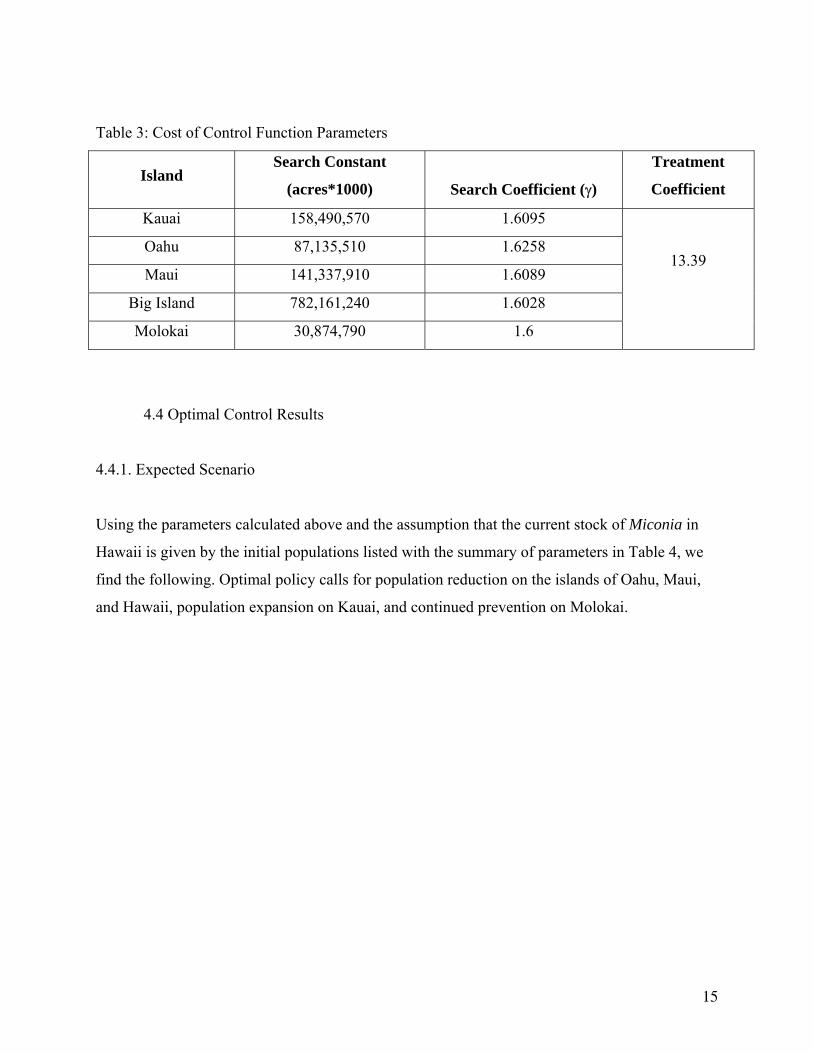
Table 3: Cost of Control Function Parameters
Island Search Constant
(acres*1000)
Search Coefficient (γ)
Treatment
Coefficient
Kauai 158,490,570 1.6095
Oahu 87,135,510 1.6258
Maui 141,337,910 1.6089
Big Island 782,161,240 1.6028
Molokai 30,874,790 1.6
13.39
4.4 Optimal Control Results
4.4.1. Expected Scenario
Using the parameters calculated above and the assumption that the current stock of Miconia in
Hawaii is given by the initial populations listed with the summary of parameters in Table 4, we
find the following. Optimal policy calls for population reduction on the islands of Oahu, Maui,
and Hawaii, population expansion on Kauai, and continued prevention on Molokai.
15
Table 4: Summary of Bio-economic Parameters
Island 0n K
Coefficient on
Damage
function
Cost of control function
Kauai 1,540 15,849,057 9.74 1.6095
158,490,570 13.39 * xn
⎛ ⎞+⎜ ⎟⎝ ⎠
Oahu 6,890 8,713,551 11.30 1.6258
87,135,510 13.39 * xn
⎛ ⎞+⎜ ⎟⎝ ⎠
Maui 111,050 14,133,791 8.93 1.6089
141,337,910 13.39 * xn
⎛ ⎞+⎜ ⎟⎝ ⎠
Hawaii 315,000 78,216,124 2.88 1.6028
782,161,240 13.39 * xn
⎛ ⎞+⎜ ⎟⎝ ⎠
Molokai 0 3,087,479 22.09 1.6
30,874,790 13.39 * xn
⎛ ⎞+⎜ ⎟⎝ ⎠
Differences in steady state populations are mainly the result of variations in search costs and
potential habitats. For example, the population on Kauai is currently “too small,” that is, the high
search cost calls for waiting until the population is larger to invest in harvesting. Although the
damage per tree is significant, it does not outweigh the magnitude of the search component of
control.
On the island of Oahu, however, ease of access to Miconia habitat is facilitated by the
comparatively large amount of roads and trails on the island. Furthermore, the search cost on
Oahu is almost half that of Kauai (due to fewer potential acres of habitat). Therefore, we find
reduction of approximately 1,400 trees to be optimal.
Maui and Hawaii have lower per unit expected damages than Oahu, and higher search costs due
to both greater amounts of habitat and more difficult access. While optimal populations are
higher than Oahu and Kauai, significant reductions of the Maui and Hawaii populations are
preferred to the current state.
16
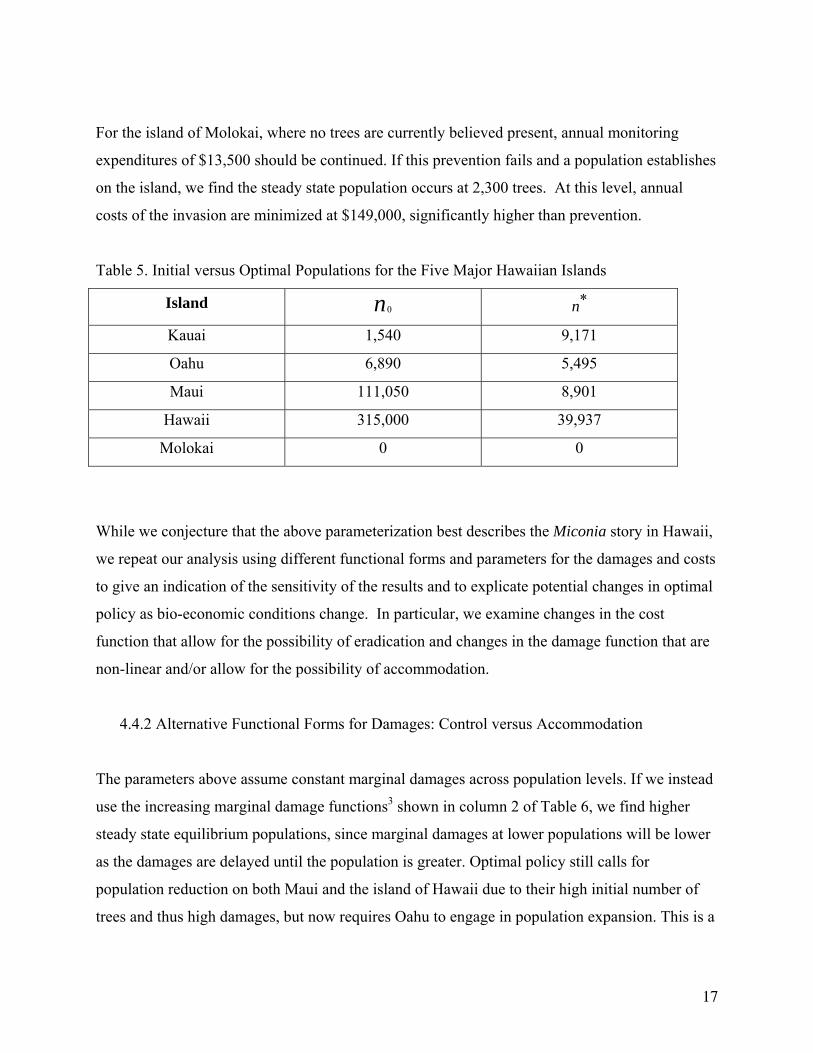
For the island of Molokai, where no trees are currently believed present, annual monitoring
expenditures of $13,500 should be continued. If this prevention fails and a population establishes
on the island, we find the steady state population occurs at 2,300 trees. At this level, annual
costs of the invasion are minimized at $149,000, significantly higher than prevention.
Table 5. Initial versus Optimal Populations for the Five Major Hawaiian Islands
Island 0n *n
Kauai 1,540 9,171
Oahu 6,890 5,495
Maui 111,050 8,901
Hawaii 315,000 39,937
Molokai 0 0
While we conjecture that the above parameterization best describes the Miconia story in Hawaii,
we repeat our analysis using different functional forms and parameters for the damages and costs
to give an indication of the sensitivity of the results and to explicate potential changes in optimal
policy as bio-economic conditions change. In particular, we examine changes in the cost
function that allow for the possibility of eradication and changes in the damage function that are
non-linear and/or allow for the possibility of accommodation.
4.4.2 Alternative Functional Forms for Damages: Control versus Accommodation
The parameters above assume constant marginal damages across population levels. If we instead
use the increasing marginal damage functions3 shown in column 2 of Table 6, we find higher
steady state equilibrium populations, since marginal damages at lower populations will be lower
as the damages are delayed until the population is greater. Optimal policy still calls for
population reduction on both Maui and the island of Hawaii due to their high initial number of
trees and thus high damages, but now requires Oahu to engage in population expansion. This is a
17
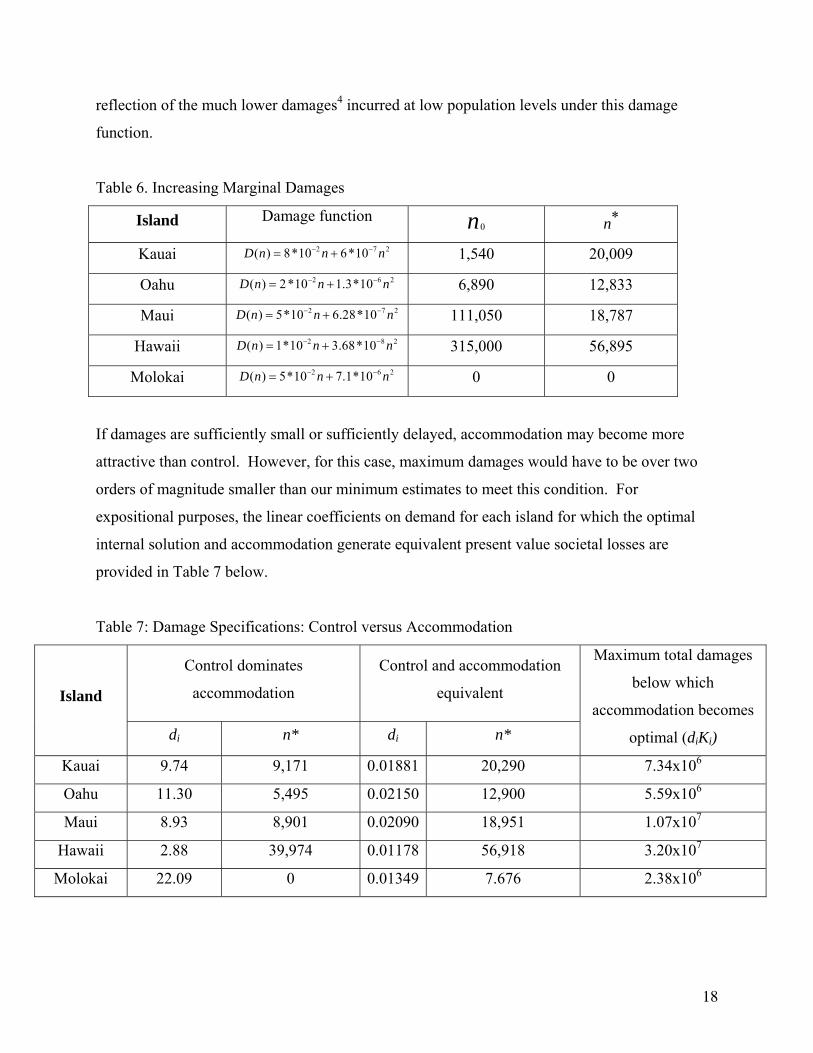
reflection of the much lower damages4 incurred at low population levels under this damage
function.
Table 6. Increasing Marginal Damages
Island Damage function 0n *n
Kauai 2 7( ) 8*10 6*10D n n n− −= + 2 1,540 20,009
Oahu 2 6( ) 2*10 1.3*10D n n n− −= + 2 6,890 12,833
Maui 2( ) 5*10 6.28*10D n n n− −= + 7 2 111,050 18,787
Hawaii 2( ) 1*10 3.68*10D n n n− −= + 8 2 315,000 56,895
Molokai 2 6( ) 5*10 7.1*10D n n n− −= + 2 0 0
If damages are sufficiently small or sufficiently delayed, accommodation may become more
attractive than control. However, for this case, maximum damages would have to be over two
orders of magnitude smaller than our minimum estimates to meet this condition. For
expositional purposes, the linear coefficients on demand for each island for which the optimal
internal solution and accommodation generate equivalent present value societal losses are
provided in Table 7 below.
Table 7: Damage Specifications: Control versus Accommodation
Control dominates
accommodation
Control and accommodation
equivalent Island
di n* di n*
Maximum total damages
below which
accommodation becomes
optimal (diKi)
Kauai 9.74 9,171 0.01881 20,290 7.34x10⁶
Oahu 11.30 5,495 0.02150 12,900 5.59x10⁶
Maui 8.93 8,901 0.02090 18,951 1.07x10⁷
Hawaii 2.88 39,974 0.01178 56,918 3.20x10⁷
Molokai 22.09 0 0.01349 7.676 2.38x10⁶
18
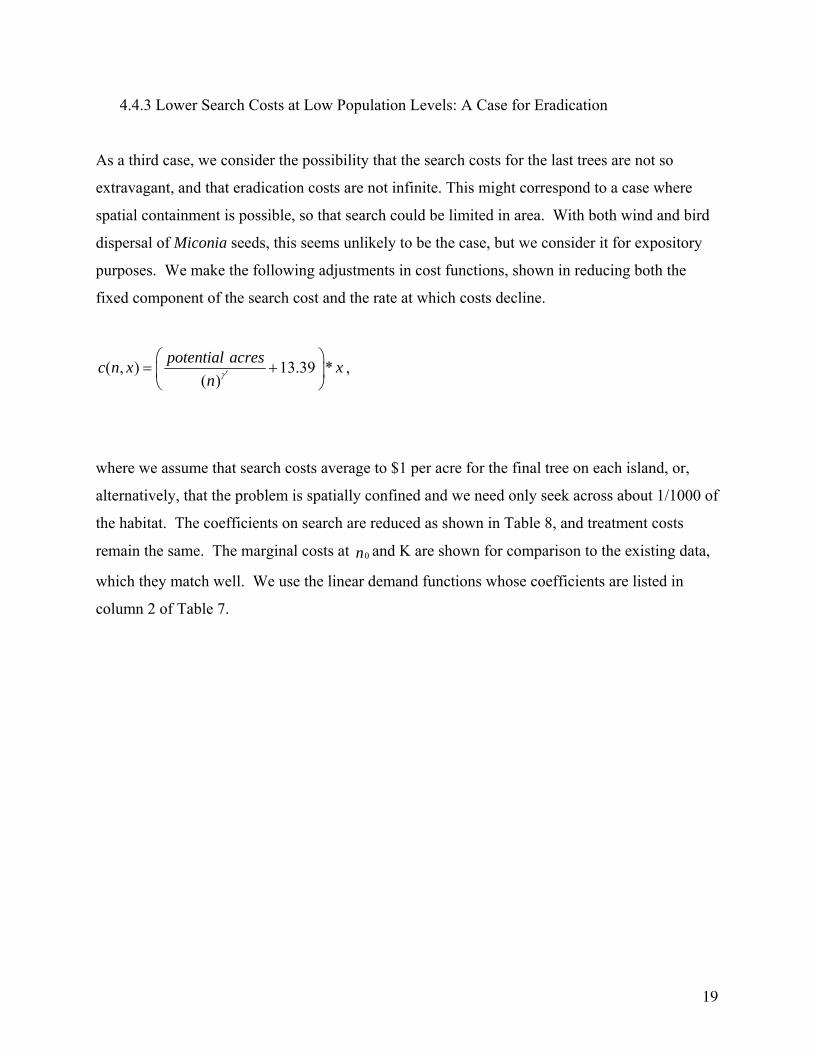
4.4.3 Lower Search Costs at Low Population Levels: A Case for Eradication
As a third case, we consider the possibility that the search costs for the last trees are not so
extravagant, and that eradication costs are not infinite. This might correspond to a case where
spatial containment is possible, so that search could be limited in area. With both wind and bird
dispersal of Miconia seeds, this seems unlikely to be the case, but we consider it for expository
purposes. We make the following adjustments in cost functions, shown in reducing both the
fixed component of the search cost and the rate at which costs decline.
( , ) 13.39 *( )
potential acresc n x xn γ ′
⎛ ⎞= +⎜ ⎟⎝ ⎠
,
where we assume that search costs average to $1 per acre for the final tree on each island, or,
alternatively, that the problem is spatially confined and we need only seek across about 1/1000 of
the habitat. The coefficients on search are reduced as shown in Table 8, and treatment costs
remain the same. The marginal costs at and K are shown for comparison to the existing data,
which they match well. We use the linear demand functions whose coefficients are listed in
column 2 of Table 7.
0n
19
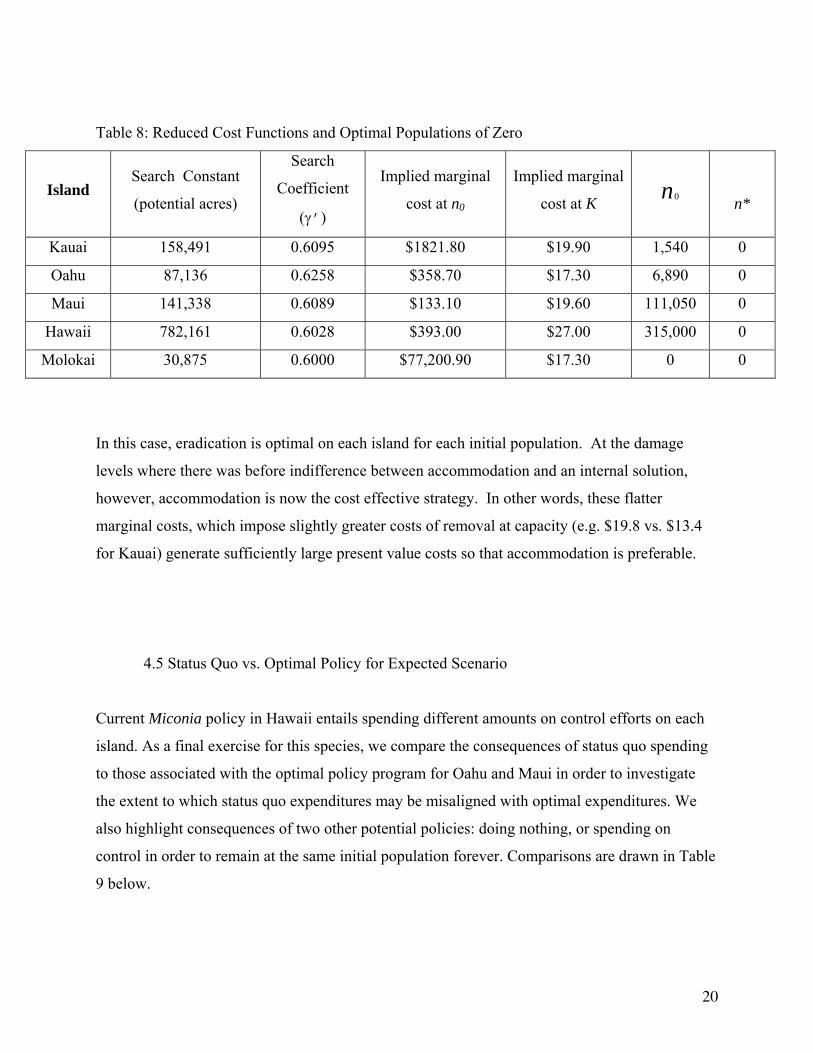
Table 8: Reduced Cost Functions and Optimal Populations of Zero
Island Search Constant
(potential acres)
Search
Coefficient
(γ’)
Implied marginal
cost at n0
Implied marginal
cost at K 0n
n*
Kauai 158,491 0.6095 $1821.80 $19.90 1,540 0
Oahu 87,136 0.6258 $358.70 $17.30 6,890 0
Maui 141,338 0.6089 $133.10 $19.60 111,050 0
Hawaii 782,161 0.6028 $393.00 $27.00 315,000 0
Molokai 30,875 0.6000 $77,200.90 $17.30 0 0
In this case, eradication is optimal on each island for each initial population. At the damage
levels where there was before indifference between accommodation and an internal solution,
however, accommodation is now the cost effective strategy. In other words, these flatter
marginal costs, which impose slightly greater costs of removal at capacity (e.g. $19.8 vs. $13.4
for Kauai) generate sufficiently large present value costs so that accommodation is preferable.
4.5 Status Quo vs. Optimal Policy for Expected Scenario
Current Miconia policy in Hawaii entails spending different amounts on control efforts on each
island. As a final exercise for this species, we compare the consequences of status quo spending
to those associated with the optimal policy program for Oahu and Maui in order to investigate
the extent to which status quo expenditures may be misaligned with optimal expenditures. We
also highlight consequences of two other potential policies: doing nothing, or spending on
control in order to remain at the same initial population forever. Comparisons are drawn in Table
9 below.
20
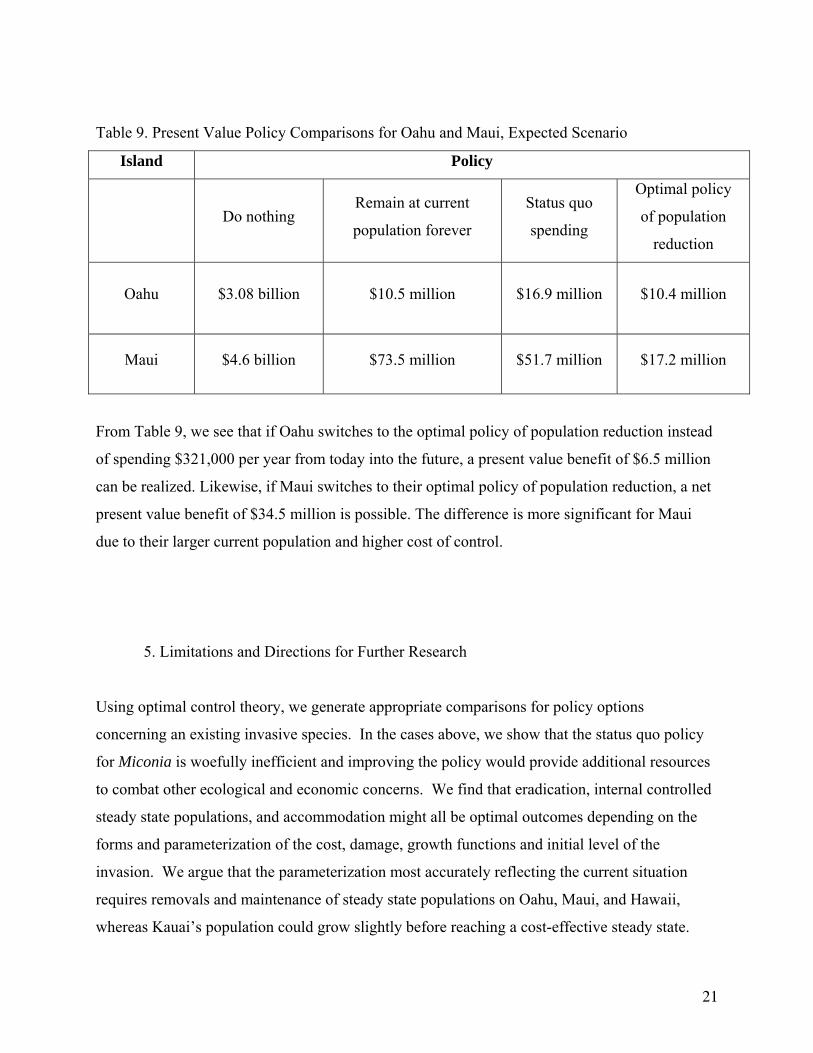
Table 9. Present Value Policy Comparisons for Oahu and Maui, Expected Scenario
Island Policy
Do nothing Remain at current
population forever
Status quo
spending
Optimal policy
of population
reduction
Oahu $3.08 billion $10.5 million $16.9 million $10.4 million
Maui $4.6 billion $73.5 million $51.7 million $17.2 million
From Table 9, we see that if Oahu switches to the optimal policy of population reduction instead
of spending $321,000 per year from today into the future, a present value benefit of $6.5 million
can be realized. Likewise, if Maui switches to their optimal policy of population reduction, a net
present value benefit of $34.5 million is possible. The difference is more significant for Maui
due to their larger current population and higher cost of control.
5. Limitations and Directions for Further Research
Using optimal control theory, we generate appropriate comparisons for policy options
concerning an existing invasive species. In the cases above, we show that the status quo policy
for Miconia is woefully inefficient and improving the policy would provide additional resources
to combat other ecological and economic concerns. We find that eradication, internal controlled
steady state populations, and accommodation might all be optimal outcomes depending on the
forms and parameterization of the cost, damage, growth functions and initial level of the
invasion. We argue that the parameterization most accurately reflecting the current situation
requires removals and maintenance of steady state populations on Oahu, Maui, and Hawaii,
whereas Kauai’s population could grow slightly before reaching a cost-effective steady state.
21
Molokai should continue their current levels of spending to prevent invasion of Miconia to their
island. Additionally, as the optimal policies can be traced out across time, we can compare the
costs and benefits of deviating from optimal policies if budgets are restricted below the point
where the optimal policy can be implemented in the present.
We conclude with an acknowledgment of the limitations of our ability to analytically determine
optimal policy for prevention and control and a discussion of directions for further research. In
the simple cases described above, we encounter both quantitative limitations and theoretical
ones.
In computing the optimal outcomes for Miconia calvescens, we encountered quantitative
challenges regarding the specification of functional forms for all three essential components:
costs, damages, and growth. In particular, choosing functional forms that both accurately
reflected our understanding of the biological and economic processes and resulted in
computationally feasible equations required several simplifications upon which further research
might improve.
For example, we chose to model the seed bank by assuming that the removal of a single tree
would require re-treatment over time, in effect sublimating the removal of future growth from
seeds into the cost of removing the parent tree so that we did not need to invoke delay-
differential equations, which would render computations extremely complex if even solvable.
We also abstracted away from important spatial considerations of the problem. It may be
desirable to consider strategies such as containment of the core (dense, original infestations) or
satellite (more sparse, spread out offspring) populations of Miconia. While spatial elements are
implicitly represented with search cost functions that differ across islands and include
considerations for access, and are discussed as potential shifts in the cost curves, it would be
useful to model these considerations more explicitly.
The linearity of the harvest control also limits the range of potential solutions to moving to
eradication, accommodation, or an internal steady state by the fastest possible path. Adding a
maximum annual removal capacity where the upper bound on x ( x ), was less than carrying
22
capacity, K, would allow for an additional case of contained population with continuous removal
such that the steady state occurred where the growth rate equaled the removal capacity. The cost
of attaining and maintaining this steady state would then be compared to accommodation,
eradication, and any other internal steady states that might differ from the case where x =g(n).
Nonlinearity in the control cost as a function of removals also adds the possibility that there will
be times where it is worth it to wait to harvest until growth has slowed, even though population
is greater.
Further policy implications may be drawn from the results. For Miconia, we find that at the
state’s current population level, investing in the optimal program of population reduction where
appropriate is welfare-improving for a range of assumptions concerning costs of control and
damages. In particular, damages could be more than 2 orders of magnitude smaller and the
steady state populations would still remain closer to the estimated optimal population at the
higher damages than they would to the current population (e.g. N*(expected damages) =39,974,
N*(low damages) = 56,919, N0=315,000 for Hawaii). However, damages below this threshold
make accommodation preferable.
The status quo policy will results in the stock growing to almost reach capacity. It is only
because we continue to spend an annual $1 million on Maui and $321,000 on Oahu that keeps
the population from reaching its carrying capacity on each island. Surely it is not the intention of
resource managers to spend significant funds to sustain a plant population to be practically equal
to its natural carrying capacity. Rather, optimal policy calls for comparisons of the time paths of
costs and damages, and how various population levels influence these paths.
23
Bibliography
Asquith, A., 1995. Alien species and the extinction crisis of Hawaii's invertebrates. Endangered
Species Update 12(6).
Clark, C., 1990. Bioeconomics, 2nd Ed. John Wiley & Sons, New York.
Department of Business, Economic Development, and Tourism, DBEDT, 2005. Downloadable
GIS Layers. http://www.hawaii.gov/dbedt/gis/download.htm
Eiswerth, M. E. and van Kooten, G. C, 2002. Uncertainty, Economics and the Spread of Invasive
Plant Species. American Journal of Agricultural Economics 84(5), 1317-1322.
Horan, R. D., Perrings, C. et al., 2002. The Economics of Invasive Species Management:
Biological Pollution Prevention Strategies under Ignorance: The Case of Invasive
Species. American Journal of Agricultural Economics 84(5), 1303-1310.
Kaiser, B. and Roumasset, J. 2005. Valuing Watershed Conservation for Groundwater and Nearshore Ecology. Proceedings of AWRA Summer Specialty Conference, Honolulu, HI, June 27-29, 2005. Kaiser, B. and J. Roumasset 2002. Valuing Indirect Ecosystem Services: the Case of Tropical
Watersheds. Environment and Development Economics 7(4).
Kaiser, B. and J. Roumasset 2000. Water Management and the Valuation of Indirect
Environmental Services. Interdisciplinary Environmental Review 2(2), 102-122.
Loomis, J. B. and White, D.S., 1996. Economic Benefits of Rare and Endangered Species:
Summary and Meta-analysis. Ecological Economics 18, 197-206.
Loope, L. L. 1997. HNIS Report for Miconia Calvescens. Honolulu, USGS/BRD: 8.
Medeiros, A. C., Loope, L.L., et al. 1997. Status, ecology and management of the invasive plant,
Miconia calvescens DC (Melastomataceae) in the Hawaiian Islands. Records of the
Hawaii Biological Survey for 1996, Bishop Museum Occasional Papers 48, 23-36.
Meyer, J.-Y. 1998. Epidemiology of the invasion by Miconia calvescens and reasons for a
spectacular success. Proceedings of the First Regional Conference on Miconia Control,
24
Aug 26-29, 1997, Papeete, Tahiti, Gouvernement de Polynésie française/University of
Hawaii at Manoa/Centre ORSTROM de Tahiti.
Olson, L. J., Roy, S. 2002. The Economics of Controlling a Stochastic Biological Invasion.
American Journal of Agricultural Economics 84(5), 1311-1316.
Pitafi, B. and J. Roumasset 2005. The Resource Economics of Invasive Species, manuscript.
Service, U.S. F. a. W., 2001 Endangered and Threatened Wildlife and Plants;
Reopening of Comment Period and Notice of Availability of the Draft Economic
Analysis for Proposed Critical Habitat for the Oahu Elepaio, Department of the Interior:
40960-40962.
Staff , 2001. Oheo gulch entrance fee to help Miconia eradication program. Maui News.
Maui, HI.
1 The particular role of Miconia in groundwater recharge is uncertain; on the one hand, increased runoff suggests there is less water available for recharge, but changes in evapotranspiration rates may counteract this loss. Surveys of forested watershed experts list Miconia as a very serious threat, however (see http://homepage.mac.com/ondinebak for survey results on threats to watershed quality on Oahu). 2 For simplicity, we assume a uniform distribution function where any tree contributes to the loss equally, given the existing population level, and the cumulative distribution as the probability of total losses for any given population, n, is just n/nmax. We assume nmax is 120,000,000 plants, based on a density of 100 plants per acre and 1,200,000 potential acres of habitat. To model a potentially more realistic situation where the damages are increasing at an increasing rate with population, the beta distribution might be preferred. 3 This damage function was fitted such that total damages at the island capacities match estimated damages, and are equal to the linear damage values at n=10% of capacity. 4 Smaller damages at lower population levels is a reasonable assumption, in that most watershed and biodiversity damage is expected to be borne under dense stands of the trees, rather than with a sparse number of trees spread out around the island.
25