Control of Aggregated Power Level of Safety Messages in...
18
1 Control of Aggregated Power Level of Safety Messages in VANET Ching-Ling Huang May, 6th, 2009 C265 Spring ’09 Class Project
Transcript of Control of Aggregated Power Level of Safety Messages in...

1
Control of Aggregated Power Level of Safety Messages in VANET
Ching-Ling Huang
May, 6th, 2009
C265 Spring ’09 Class Project

2
Outline
VANET and Safety Enhancement
Why Aggregated Power Level Should be Studied?
PDE Model of Aggregated Power Level with Uniform Tx Rate and Power
Summary

3
Vehicular Ad-Hoc Network
VANET: Wireless transceivers put on cars for real-time information exchange No need for Access Point. Cars can talk to cars in
ad hoc mode
First priority (of U.S. government, NHTSA) is to enhance highway safety
VSCC report (vehicle safety communication consortium, 2005) suggests two kinds of safety messages Status update messages
Event-driven (emergency) messages

Conceptually, VANET looks like this… (from http://www.intellidriveusa.org)

5
Status Update Messages
Subject vehicle broadcasts its own state information, e.g. position, speed, heading, to neighboring vehicles Based on received information, other vehicles estimate the
position, speed, heading of that subject vehicle
Every car tries to track other cars and get a “digital map” of all neighboring vehicles’ movement Various safety applications rely on this kind of “proximity
awareness” (e.g. 150m radius)
VSCC report suggests 100ms beacon interval
6
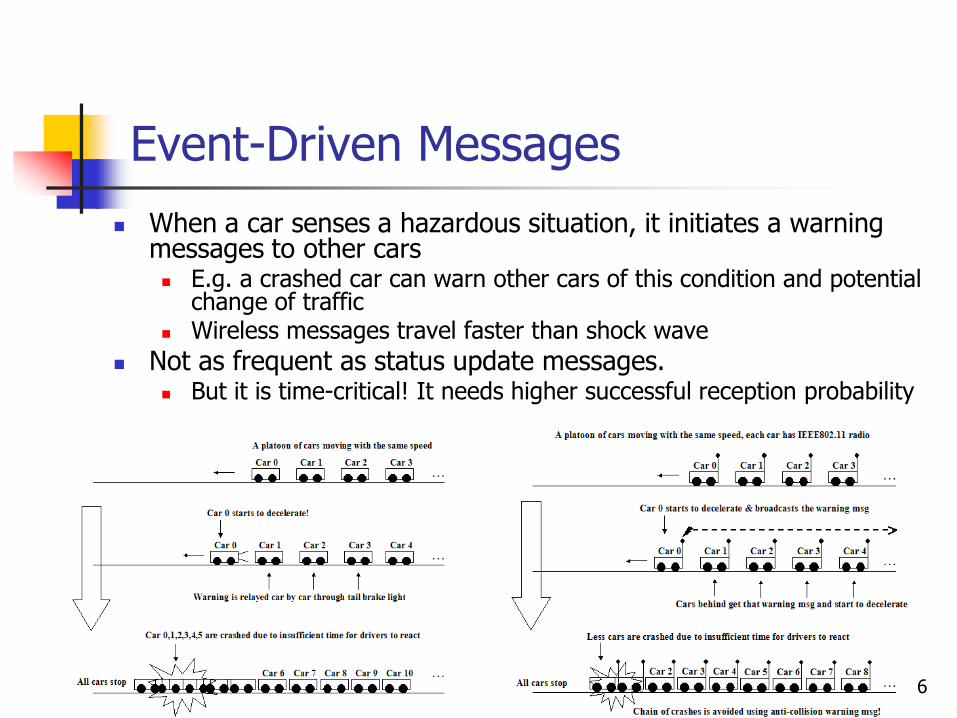
Event-Driven Messages
When a car senses a hazardous situation, it initiates a warning messages to other cars E.g. a crashed car can warn other cars of this condition and potential
change of traffic Wireless messages travel faster than shock wave
Not as frequent as status update messages. But it is time-critical! It needs higher successful reception probability

7
Why Tx Power/Rate of Status Update Messages Should Be Studied?
The delivery of time-critical event-driven messages needs to be protected from interference of frequent status update messages It uses maximum Tx power… but is that enough?
The aggregated power level from all status update messages becomes interference (noise) to an event-driven message E.g. talking in a party (with loud background music) For event-driven messages, its SNR (signal-to-noise ratio)
decides BER (bit error rate) and PER (packet error rate) given messages size
VSCC suggests fixed Tx rate (100ms interval) and fixed Tx power (100mW=20dBm) for all cars Is this a good idea? Let’s use PDE to analyze the aggregated
power level from status update messages

8
Stochastic Channel Model
Path loss exponent (energy dissipation) Usually 2~3 for outdoor environment
Shadowing effect (large scale fading) Usually modeled as log-normal distribution
Multi-path effect (small scale fading) Usually modeled as Rayleigh, Rician, or Nakagami-k distribution
Each sender-receiver pair can be calculated independently Aggregated power is the superposition of all transmissions

9
Vehicular Density of Simulated 4-lane Straight Highway
Microscopic traffic simulator (PATH SHIFT) http://path.berkeley.edu/smart-ahs/index.html
Density is calculated by moving average (10m window) over a 200m segment of highway An empty highway is gradually populated by vehicles

10
Aggregated Power Level (dBm) in DSRC for Simulated Highway
Shown plot is just one sample path (realization) Note that, dBm is a log-scale measure of power (mW)
Aggregated power level has correlation with vehicular traffic since each vehicle uses uniform Tx rate/power

11
PDE Model of Aggregated Power Level with Uniform Rate/Power

12
Solution to PDE Using Characteristics Time
Lo
ca
tio
n
Just an illustration from pp.63 of class note

Mean of Aggregated Power Level (dBm)
Standard Deviation of Aggregated Power Level (dBm)

Do You See the Characteristics of Vehicular Density?
t0 This plot is from microscopic traffic simulator (PATH SHIFT)

Characteristics of Mean Aggregated Power
t0

Characteristics of Std. Dev. of Aggregated Power
t0

17
Summary
Introduce VANET and safety enhancement Rate/power control problem of status update
messages in DSRC
Model aggregated power level in DSRC using PDE Show characteristics in vehicular density and
(mean, variance) of aggregated power in DSRC Show ideas to control aggregated power efficiently
Work to be done before end of semester: Simulate SNR, BER, PER of event-driven messages Finalize the report
18
Thanks for your patience! Q&A
Ching-Ling Huang
CE291 Spring ’09 Class Project