Contribution of Tropical Cyclones to the Global ...
18
Contribution of Tropical Cyclones to the Global Precipitation from Eight Seasons of TRMM Data: Regional, Seasonal, and Interannual Variations HAIYAN JIANG Department of Earth and Environment, Florida International University, Miami, Florida EDWARD J. ZIPSER Department of Atmospheric Sciences, University of Utah, Salt Lake City, Utah (Manuscript received 19 June 2009, in final form 2 October 2009) ABSTRACT Based on the University of Utah Tropical Rainfall Measuring Mission (TRMM) precipitation feature (PF) database, tropical cyclone PFs (TCPFs) are identified for over 600 storms that reached tropical storm intensity level or above around the globe during eight TC seasons from the period of 1998–2006. Each TC season includes 6 months yr 21 . Six basins are considered: Atlantic (ATL), east-central Pacific (EPA), northwest Pacific (NWP), north Indian Ocean (NIO), south Indian Ocean (SIO), and South Pacific (SPA). TRMM 2A25- (precipitation radar) and 3B42- (multisatellite) derived rainfall amounts are used to assess the impact of tropical cyclone (TC) rainfall in altering the regional, seasonal, and interannual distribution of the global total rainfall during the TC seasons in the six basins. The global, seasonal, and interannual variations of the monthly rainfall inside TCPFs are presented. The fractional rainfall contributions by TCPFs are compared in different basins. The TRMM 2A25 and 3B42 retrievals are compared in terms of the rainfall contribution by TCs. After constraining TC rainfall for being within 500 km from the TC center, 2A25 and 3B42 show similar results: 1) TCs contribute, respectively, 8%–9%, 7%, 11%, 5%, 7%–8%, and 3%–4% of the seasonal rainfall to the entire domain of the ATL, EPA, NWP, NIO, SIO, and SPA basins; 2) both algorithms show that, regionally, the maximum percentage of TC rainfall contribution is located in EPA basin near the Mexico Baja California coast (about 55%), SIO close to the Australia coast (about 55%), and NWP near Taiwan (about 35%–40%); 3) the maximum monthly percentage of TC rainfall contribution is in September for the ATL basin, August and September for EPA, August for NWP, May for NIO, March for SIO, and January and February for SPA; 4) the percentage of rainfall contributed by TCs is higher during El Nin ˜ o years than La Nin ˜ a years for EPA and NWP basins. The trend is the reverse for ATL and NIO, and nearly neutral for SIO and SPA. However, this study does not include enough years of data to expect the findings to be represen- tative of long-term statistics of the interannual variations. 1. Introduction Tropical cyclones (TCs) have a great impact on the total precipitation over global ocean basins. Since the latent heat release by cloud and precipitation is one of the main driving forces of the general atmospheric circulation (Mutai and Ward 2000; Gan et al. 2004), quantitative information about the contribution of TCs in distributing rainfall is critical to understanding the impact of these systems in altering the seasonal and global pattern of the general circulation. The contribution of TCs to cumulative precipitation has been investigated in regions like the whole North Pacific (Rodgers et al. 2000) and North Atlantic (Rodgers et al. 2001) basins, the western North Pacific (Kubota and Wang 2009), China including Taiwan and the Hainan Islands (Ren et al. 2006), four minibasins near coastal southeastern Unites States (Shepherd et al. 2007), and China’s Hainan Island only (Wu et al. 2007). Larson et al. (2005), using gridded daily rainfall analysis based on rain gauge observations, found that landfalling TCs contribute up to 15%–20% of rainfall along the U.S. Gulf and Mexican coasts on average during the period of 1950–98. Using rain gauge data over China during 1971– 2004, Ren et al. (2006) determined that the ratio of annual TC precipitation to total annual rainfall is Corresponding author address: Dr. Haiyan Jiang, 11200 SW 8th Street, PC-342B, Miami, FL 33199. E-mail: haiyan.jiang@fiu.edu 1526 JOURNAL OF CLIMATE VOLUME 23 DOI: 10.1175/2009JCLI3303.1 Ó 2010 American Meteorological Society
Transcript of Contribution of Tropical Cyclones to the Global ...

Contribution of Tropical Cyclones to the Global Precipitation from Eight Seasonsof TRMM Data: Regional, Seasonal, and Interannual Variations
HAIYAN JIANG
Department of Earth and Environment, Florida International University, Miami, Florida
EDWARD J. ZIPSER
Department of Atmospheric Sciences, University of Utah, Salt Lake City, Utah
(Manuscript received 19 June 2009, in final form 2 October 2009)
ABSTRACT
Based on the University of Utah Tropical Rainfall Measuring Mission (TRMM) precipitation feature (PF)
database, tropical cyclone PFs (TCPFs) are identified for over 600 storms that reached tropical storm intensity
level or above around the globe during eight TC seasons from the period of 1998–2006. Each TC season
includes 6 months yr21. Six basins are considered: Atlantic (ATL), east-central Pacific (EPA), northwest
Pacific (NWP), north Indian Ocean (NIO), south Indian Ocean (SIO), and South Pacific (SPA). TRMM
2A25- (precipitation radar) and 3B42- (multisatellite) derived rainfall amounts are used to assess the impact
of tropical cyclone (TC) rainfall in altering the regional, seasonal, and interannual distribution of the global
total rainfall during the TC seasons in the six basins. The global, seasonal, and interannual variations of the
monthly rainfall inside TCPFs are presented. The fractional rainfall contributions by TCPFs are compared in
different basins. The TRMM 2A25 and 3B42 retrievals are compared in terms of the rainfall contribution by
TCs. After constraining TC rainfall for being within 500 km from the TC center, 2A25 and 3B42 show similar
results: 1) TCs contribute, respectively, 8%–9%, 7%, 11%, 5%, 7%–8%, and 3%–4% of the seasonal rainfall
to the entire domain of the ATL, EPA, NWP, NIO, SIO, and SPA basins; 2) both algorithms show that,
regionally, the maximum percentage of TC rainfall contribution is located in EPA basin near the Mexico Baja
California coast (about 55%), SIO close to the Australia coast (about 55%), and NWP near Taiwan (about
35%–40%); 3) the maximum monthly percentage of TC rainfall contribution is in September for the ATL
basin, August and September for EPA, August for NWP, May for NIO, March for SIO, and January and
February for SPA; 4) the percentage of rainfall contributed by TCs is higher during El Nino years than La
Nina years for EPA and NWP basins. The trend is the reverse for ATL and NIO, and nearly neutral for SIO
and SPA. However, this study does not include enough years of data to expect the findings to be represen-
tative of long-term statistics of the interannual variations.
1. Introduction
Tropical cyclones (TCs) have a great impact on the
total precipitation over global ocean basins. Since the
latent heat release by cloud and precipitation is one of
the main driving forces of the general atmospheric
circulation (Mutai and Ward 2000; Gan et al. 2004),
quantitative information about the contribution of TCs
in distributing rainfall is critical to understanding the
impact of these systems in altering the seasonal and
global pattern of the general circulation.
The contribution of TCs to cumulative precipitation
has been investigated in regions like the whole North
Pacific (Rodgers et al. 2000) and North Atlantic (Rodgers
et al. 2001) basins, the western North Pacific (Kubota and
Wang 2009), China including Taiwan and the Hainan
Islands (Ren et al. 2006), four minibasins near coastal
southeastern Unites States (Shepherd et al. 2007), and
China’s Hainan Island only (Wu et al. 2007). Larson
et al. (2005), using gridded daily rainfall analysis based
on rain gauge observations, found that landfalling TCs
contribute up to 15%–20% of rainfall along the U.S.
Gulf and Mexican coasts on average during the period of
1950–98. Using rain gauge data over China during 1971–
2004, Ren et al. (2006) determined that the ratio
of annual TC precipitation to total annual rainfall is
Corresponding author address: Dr. Haiyan Jiang, 11200 SW 8th
Street, PC-342B, Miami, FL 33199.
E-mail: [email protected]
1526 J O U R N A L O F C L I M A T E VOLUME 23
DOI: 10.1175/2009JCLI3303.1
� 2010 American Meteorological Society

20%–30% in most of Taiwan and the China coastline
south of 258N, 30%–40% in most of Hainan and some
locations of Taiwan and the coastline, and 40%–45% in
southernmost Taiwan and westernmost Hainan. Kubota
and Wang (2009) analyzed rainfall data at 22 rain gauge
stations and found that along 1258E the TC rainfall ac-
counts for 50%–60% of the total rainfall between 188
and 268N during peak TC season from July to October.
Wu et al. (2007) showed that TCs accounted for more
than one-third of the total rainfall over the Hainan Is-
land, China, for the period 1962–2005. Using monthly
passive microwave rainfall estimates over two oceanic
basins, Rodgers et al. (2000, 2001) determined that TCs
contribute 7% (3%–4%) to the North Pacific (North
Atlantic) cumulative rainfall. Maximum contributions of
30%–40% are found over coastal regions like the north-
east of the Philippine Islands, lower Baja California coast,
and northeast of Puerto Rico. Using Tropical Rainfall
Measuring Mission (TRMM; Kummerow et al. 1998)
measurements, Yokoyama and Takayabu (2008) calcu-
lated the rainfall contribution of TCs to total annual
rainfall between 358N and 358S as 3.3%. The variation in
the fraction of TC rain in different regions implies that
the contribution of TC rain to total precipitation varies
across the global oceans. Since existing studies are mostly
regional, questions remain concerning the global
amount that TCs contribute to the total rainfall, how
these contributions are different for different global TC
basins, and how TC rainfall patterns are distributed
geographically, seasonally, and interannually.
In addition, above-mentioned studies use either rain
gauge observations or satellite-based passive microwave
estimates to examine the TC rainfall contribution. The
reality is that different estimates could have different
uncertainties. One of the main goals of the TRMM
satellite is to quantify the distribution and variability of
precipitation over the tropics and subtropics (Simpson
et al. 1988). With the first-ever satellite-based precip-
itation radar (PR), TRMM provides invaluable mea-
surements for global precipitation estimates (Adler et al.
2000; Schumacher and Houze 2003). Several algorithms
use the TRMM satellite to make rainfall estimates. The
PR-based 2A25 algorithm (Iguchi et al. 2000) is per-
haps the best available rainfall estimates for both over
ocean and over land systems in terms of its accuracy
because of its active remote sensing characteristics.
Better agreement has been found between PR 2A25
estimates and Global Precipitation Climatology Centre
(GPCC) gauge rainfall than TRMM Microwave Imager
(TMI) 2A12 estimates (Nesbitt et al. 2004). However,
because of the narrow swath of the PR (215/247 km
before–after TRMM boost on August 2001), TCs usu-
ally are not fully viewed by the TRMM PR (Fig. 4). In
contrast, the TRMM Multisatellite Precipitation Anal-
ysis (TMPA, also referred to as TRMM 3B42; Huffman
et al. 2007) provides a quasi-global (508S–508N) cover-
age of rain estimates at 3 hourly and 0.258 3 0.258 res-
olution by combining all available satellite microwave
measurements including TRMM and IR observations,
although its estimates are subject to errors introduced by
the IR-based rainfall retrieval.
In this study, we address the following questions: 1)
what are the differences between the global TC rain
fractions using the TRMM PR 2A25 and multisatellite
3B42 estimates; 2) how much rainfall is contributed by
TCs to tropical and subtropical regions; 3) where and
when does the greatest percentage contribution of TC
rainfall occur; and 4) what are the influences of El Nino–
Southern Oscillation (ENSO) on the TC rainfall pattern?
In the following sections, monthly TC rainfall and the
rainfall generated by all other systems is determined
using TRMM 2A25 and 3B42 data during 1998–2006.
Estimates of TC and non-TC rainfall are compared be-
tween 2A25 and 3B42. Then the 2A25 monthly rainfall is
used to examine global, seasonal, and interannual vari-
ations of global TC rain contribution.
2. Data and methodology
a. TRMM TCPF database
The University of Utah (UU) TRMM database is based
on the framework of precipitation features (PFs) that
were defined by grouping contiguous pixels based on
certain criteria as observed by TRMM (Nesbitt et al. 2000;
Liu et al. 2008). For example, Nesbitt et al. (2000) selected
contiguous areas with near-surface reflectivity equal to or
greater than 20 dBZ, or 85-GHz polarization corrected
temperature (PCT; Spencer et al. 1989) equal to or less
than 250 K as PFs. It provides an easy tool to search and
sort a cloud/precipitation event based on its TRMM ob-
served properties such as the feature size, volumetric rain,
maximum 20-dBZ height, etc. Many regional and global
climatological studies (Cecil et al. 2005; Zipser et al. 2006;
Liu et al. 2008) of precipitation and convection, including
TC studies (Cecil et al. 2002; Cecil and Zipser 2002), have
been done using this database. The current UU TRMM
PF database contains three levels of processing of TRMM
data (see Liu et al. 2008 for details).
To study TCs specially, a TRMM tropical cyclone
related precipitation feature (TCPF) database is created
as a subset of the UU TRMM PF database. Our ap-
proach utilizes a distance threshold to define a TCPF.
That is, we require the distance between the center of
the tropical cyclone, according to best-track informa-
tion, and the center of the PF at the time of TRMM
observation to be less than 500 km. Here the PF center is
15 MARCH 2010 J I A N G A N D Z I P S E R 1527

a raw geometric center, not being weighted by rain rates.
TCPFs and non-TCPFs are separated. The construction
of three levels of TCPF and non-TCPFs data is shown in
Fig. 1. A similar procedure is used to create the 3B42 PF
dataset. Level 1 data are produced in pixel-level pa-
rameters from the version 6 2A25 (Iguchi et al. 2000)
and 3B42 granules, and TCPF and non-TCPF grouping.
The output data are saved for each satellite orbit for
TRMM PFs and for each 3-hourly analysis for 3B42 PFs.
Using level 1 data, the statistics—such as mean, median,
and volumetric rain—for each TCPF and non-TCPF are
derived. Then, a monthly combination of orbital data is
performed to obtain the level 2 TCPF and non-TCPF
data. To process level 3 data, the monthly statistics of PF
properties in level 2 data are derived on a 18 3 18grid.
The UU TRMM PF database also saves other parameters
and contains several PF definitions (grouping methods;
Liu et al. 2008). In this study, the PFs are defined as
contiguous areas of surface raining pixels.
b. TC season and TRMM 2A25 global sampling
TCs occur mainly in TC seasons, which are different
for different basins. Six basins are considered in this
study, which include North Atlantic (ATL), east-central
Pacific (EPA), northwest Pacific (NWP), north Indian
Ocean (NIO), south Indian Ocean (SIO), and South
Pacific (SPA). The analysis area for this study covers both
land and ocean regions of the six basins. (The boundaries
between basins are indicated in Figs. 3 and 4c). Please
note that the central North Pacific region between 1708E
and 1608W is omitted purposely to make the TC rain
fractions more meaningful by excluding times and places
where TCs rarely occur. Figure 2 shows the monthly TC
numbers in each basin during 1998–2006 derived from
National Hurricane Center (NHC) and Joint Typhoon
Warning Center (JTWC) best-track data. From Fig. 2
we find that the TC number peaks in summer months for
all basins except NIO, where TCs tend to occur in the
monsoon transition months of early (May–June) and late
in the wet season (October–November). Therefore, the
TC seasons and analysis periods that we used in this study
for each basin are 1) for the Northern Hemisphere, the
6-month period of June–November for ATL, EPA, and
NWP and January, May–June, and October–December
for NIO during the years of 1998–2000 and 2002–06
(TRMM satellite boost was in 2001 that caused some data
problems in August 2001); and 2) for the Southern
Hemisphere, the 6-month period of November–April for
SIO and SPA during the years of 1998/99–2005/06.
TRMM 2A25 and 3B42 data are collected for these 8
half-year periods (8 TC seasons) for each basin.
Since in some basins, for example, NWP and SIO, TCs
occur all year round, our selection of the 6-month period
excludes some TC activity from the precipitation anal-
ysis. To evaluate how much TC activity is being ex-
cluded and where it is being excluded, in Fig. 3 we
compare the yearly averaged accumulated cyclone en-
ergy (ACE; Bell et al. 2000) of the 8 seasons with those
of the 8 entire years and a long-term record (30 entire
years during 1979–2008). ACE is an index of TC activity.
It is defined as the sum of the squares of the estimated
6-hourly maximum sustained surface wind speed for all
TCs having tropical storm intensity or greater summed
over all 6-h periods. As stated in Camargo and Sobel
(2005), ACE is a very useful TC activity index because
it is a continuous variable. Its integration of storm in-
tensity over the lifetime of each storm as well as over
all storms is appropriate for indexing the effect of TCs
on climate, and therefore might be strongly correlated
with TC precipitation. From Figs. 3a,b it can be seen
that majority of TC activity during the 8 entire years is
captured by the 8-season selection. However, it is also
obvious that the 8-season selection missed some TC ac-
tivity in each basin, especially in NWP as seen from
Fig. 3d, which shows the difference between Figs. 3a,b.
In NWP basin, up to 20% ACE is missed in a small
region east of the Philippine Islands. There are also some
FIG. 1. TRMM TCPF database construction flowchart.
1528 J O U R N A L O F C L I M A T E VOLUME 23

other minimal missing areas in each basins. Compared
with the 30 years of long-term record (Figs. 3c,e), the
8-season ACE shows a very similar pattern with slightly
different magnitude. The 30-year ACE is greater than
the 8-season ACE by up to 20%–25% in some areas in
NWP and EPA, but there are also some areas (east of
Taiwan Island, the Australia west coast, and almost the
whole ATL basin) where 8-season ACE is greater.
During the analysis period, 606 (607) TCs that reached
storm stage (maximum wind speed . 17 m s21) and
greater were observed globally, providing 7582 (34 500)
instantaneous observations by TRMM PR 2A25 (3B42).
Observations over tropical depression stages are also
included for storms whose maximum intensities are up
to tropical storm or greater. To determine if the TRMM
2A25 dataset is representative of the distribution of TCs
in terms of the sample size over the analysis period, the
number of observations by 2A25 was compared to that
by the 3-hourly 3B42 product. Table 1 shows a summary
of the TC, observation, and PF numbers and percentage
of 2A25 and 3B42 observations in each intensity and
basin group for the analysis period of 8 half years. The
3B42 and 2A25 distributions are similar in general in
Table 1, although the absolute numbers of observations
from 3B42 are much larger (about a factor of 4 ; 5) than
2A25. The 2A25 dataset is slightly biased toward stronger
storms in the northwest Pacific, as 39% (28.5%) of 2A25
observations are from typhoons (tropical depressions)
compared to 35.5% (32.5%) of the 3B42 observations.
All other basins show a difference of percentages in all
intensity categories equal or less than 2% between 2A25
and 3B42. The percentage of total 2A25 numbers of
observations is higher than 3B42 in ATL, NWP, and
SPA, and lower in EPA, NIO, and SIO, and equal to it in
NIO and SPA. But the difference is equal to or less than
4%. In terms of number of storms, 2A25 missed only one
TC (in EPA) during the 8-half-year analysis period
compared to 3B42. In summary, similar to the 3B42
dataset, 2A25 is representative of the global TC activity
in terms of sampling size.
FIG. 2. Monthly TC numbers in each basin during 1998–2006 as derived from NHC and JTWC best-track data.
Months that are used in the analysis are in gray, and all other months are in black.
15 MARCH 2010 J I A N G A N D Z I P S E R 1529

c. Analysis methods
TCPFs are determined based on a criterion that the
distance between the center of TC and the center of the
PF is within 500 km. From Table 1, we can see that on
average 2A25 has about 20 TCPFs per TC observation,
while 3B42 has only 5 (2A25 has 145 806 PFs in 7582
observations, while 3B42 has 169 186 PFs in 34 500 ob-
servations). The 3B42 features are usually much larger
than 2A25 features because the spatial resolution of
2A25 (4.3 3 4.3 km before TRMM boost and 5.0 3
5.0 km after TRMM boost) is about 4–5 times higher
than that of 3B42 (0.258 3 0.258). The outcome is that, in
majority of the cases, the 2A25 TCPFs are wholly con-
tained within the circular area of 500 km of a TC.
However, in a certain amount of cases, 3B42 TCPFs go
FIG. 3. Yearly ACE for (a) the 8 TC seasons in each basin (see text for details), (b) the 8 entire years, and (c) 30 entire years during 1979–
2008; yearly ACE differences between (d) the 8 entire years and 8 TC seasons and (e) the 30 entire yeas and 8 TC seasons. Borders of six
basins (ATL, EPA, NWP, NIO, SIO, and SPA) are indicated.
1530 J O U R N A L O F C L I M A T E VOLUME 23

far beyond the 500-km circle. Figure 4 shows a typical
example observed in Hurricane Bonnie (1998). The
large raining region beyond 500-km circle in the 3B42
was from a precipitation system not associated the
hurricane. This feature is separated with the hurricane
feature in both 2A12 rain and 85-GHz PCT panels in
Fig. 4. However, the 3B42 rain field shows only one
continuous PF. Although there is only a slight over-
estimate of rain rate (from no rain to very light rain) by
3B42 in the connection area between the two features, it
makes the 3B42 TCPF definition invalid in doing TC
analysis here. The slight overestimation of 3B42 in no-
rain regions is possibly caused by the combination of its
low spatial resolution induced by microwave data and
overestimation of rain in cold cloud regions induced by
IR observations. Because of this circumstance, besides
the 2A25 TCPF and 3B42 TCPF datasets, we built
a 3B42 500-km dataset in which only the 3B42 rain rates
that are observed within 500 km of the center of TCs are
used for TC rains. The 3B42 500-km dataset has a much
better coverage of a TC than 2A25. It could exclude
some raining areas that are associated with the TC but
go beyond 500-km radius, but this omission should only
be a problem for a minimal number of TC observations
(Larson et al. 2005). As expected, it is found that the
3B42 TCPF–derived TC rainfall has similar pattern but
1.5–3 times as much as its 2A25 TCPF and 3B42 500-km
counterparts (not shown here). Therefore, in this paper,
we will only compare 2A25 TCPF–derived results with
3B42 500 km.
To estimate the monthly TC rainfall for the 6 selected
months each year, the rain rates derived from the 2A25
TCPF and 3B42 500-km datasets are accumulated and
averaged for a 58 latitude–longitude grid and then mul-
tiplied by the number of hours for that given month.
These values will be referred to as ‘‘TC rainfall’’ in the
following text. Total rainfall and non-TC rainfall are
calculated using the same procedure from all systems
and non-TC systems, respectively, for the 6 selected
months each year.
3. Geographical distribution
Figures 5a–d show, respectively, the geographical dis-
tribution of the 2A25 TCPF–derived mean monthly
total rainfall, non-TC rainfall, TC rainfall, and the
percentage of rainfall contributed by TCs during the TC
season (see section 2b for the analysis period) for each
basin. The general rainfall pattern and locations of
greatest total rainfall and non-TC rainfall are similar
as seen from Figs. 5a,b. Precipitation near the equator
is high in part because of the influence of the inter-
tropical convergence zone (ITCZ). At about 308 north
and south latitude precipitation decreases because of
the presence of the subtropical high pressure systems.
The regions of greatest total and non-TC rainfall (.250
mm month21) are associated with the ITCZ, northwest
Pacific monsoon trough, South Pacific convergence zone
(SPCZ), India monsoon, and South American summer
monsoon. Figure 5c suggests that the maximum TC mean
monthly rainfall is concentrated at various locations in
each basin. These TC rain maximum locations are very
different from and poleward of, those for total–non-TC
rains.
Figure 5d shows the TC rain percentage. It indicates
that the maximum percentage is located either at the
same place where the TC rain itself is concentrated
(ATL, NWP, SIO, and NIO) or even more poleward
than TC rain itself (EPA, NIO, and SIO). The peak of
TC rain percentage is at 208N in EPA basin, 198–218N in
NIO, and 188–198S in SIO basin. Several coastal regions
with greatest contribution of TC rainfall can be identi-
fied from Fig. 5d. The first one is in a region west of the
Baja California coast (between 158 and 258N and be-
tween 1108 and 1308W) in EPA, where the maximum
percentage of TC rain is above 55%. The second one is
TABLE 1. Comparison of TRMM 2A25 and 3B42 sampled numbers of TCs, observations, and PFs in each basin during the analysis
period of this study (see text for details). Observations are also separated for each TC intensity group (Hur represents hurricane strength
TC, TS represents tropical storm, and TD represents tropical depression). Percentages of total observations for each intensity group and
each basin are shown in parentheses.
TCs
Observations
PFsHur TS TD Total
Basin 2A25 3B42 2A25 3B42 2A25 3B42 2A25 3B42 2A25 3B42 2A25 3B42
ATL 118 118 575 (31) 2187 (30) 808 (43) 3212 (44) 494 (26) 1926 (26) 1877 (25) 7325 (21) 34 896 40 325
EPA 111 112 232 (23.5) 1436 (25) 382 (38.5) 2139 (37) 372 (38) 2186 (38) 986 (13) 5761 (16.5) 16 771 26 634
NWP 155 155 857 (39) 3314 (35.5) 720 (32.5) 2947 (32) 633 (28.5) 2988 (32.5) 2210 (29) 9249 (27) 45 039 45 146
NIO 37 37 32 (10) 150 (9) 128 (40) 664 (41) 161 (50) 819 (50) 321 (4) 1633 (5) 6321 7707
SIO 120 120 389 (25.5) 1970 (26) 533 (35) 2558 (34) 601 (39.5) 3052 (40) 1523 (20) 7580 (22) 30 744 36 302
SPA 65 65 175 (26.5) 803 (27) 238 (35.5) 1013 (34.5) 252 (38) 1136 (38.5) 665 (9) 2952 (8.5) 12 035 13 072
Total 606 607 2260 (30) 9860 (28.5) 2809 (37) 12 533 (36.5) 2513 (33) 12 107 (35) 7582 34 500 145 806 169 186
15 MARCH 2010 J I A N G A N D Z I P S E R 1531

located west of the Australia coast (168S and between
1108 and 1208E) in SPA. The maximum percentage is
also around 55%. The third percentage peak is in NWP
within the region around Taiwan Island and northeast
of the Philippine Islands where the rainfall contributed
by TCs is approximately 35%–40%. It is believed that
this area is associated with the North Pacific tropical
upper-tropospheric trough (TUTT) where TCs usually
intensify rapidly (Holiday and Thompson 1979). Rodgers
et al. (2000) found a lower maximum percentage of
TC rainfall over the Baja California (30%) and Taiwan
Island region (10%–20%) by using 1987–98 Special
Sensor Microwave Imager (SSM/I) data. The difference
could perhaps be due to the retrieval algorithm difference
between SSM/I and TRMM 2A25. The SSM/I-based
rainfall retrieval may have missed or underestimated
shallow orographic rainfall in coastal regions because the
passive microwave technique is dependent on scattering
from ice to produce the necessary liquid. Also the SSM/I
algorithm used in Rodgers et al. (2001) was an old version
of the microwave retrieval algorithm, while, in the ver-
sion that 3B42 uses, several improvements have been
made. On the other hand, our result for the TC rainfall
percentage over Taiwan Island is closer to long-term rain
gauge–based analyses by Ren et al. (2006) and Kubota
and Wang (2009). Ren et al. (2006) found that the per-
centage of TC rainfall to annual total rain is between 30%
and 45% in Taiwan, while Kubota and Wang (2009)
found the ratio of TC rain to total rain during July–
October is 50%–60% in Taiwan during 1951–2005.
Figure 5d also suggests that TCs contribute signifi-
cantly to the rainfall over coastal areas in the Arabian
Sea, Southeast Asia, southeast United States and Mexico,
Caribbean Islands, Madagascar Island, and north coast
FIG. 4. The (top left) 3B42 rain rate at 1200 UTC, and (top right) 2A25 and (bottom left) 2A12 rain rates and
(bottom right) 85-GHz PCT at near 1135 UTC on 26 Aug 1998 for Hurricane Bonnie. A 500-km radius circle around
the storm center is indicated.
1532 J O U R N A L O F C L I M A T E VOLUME 23
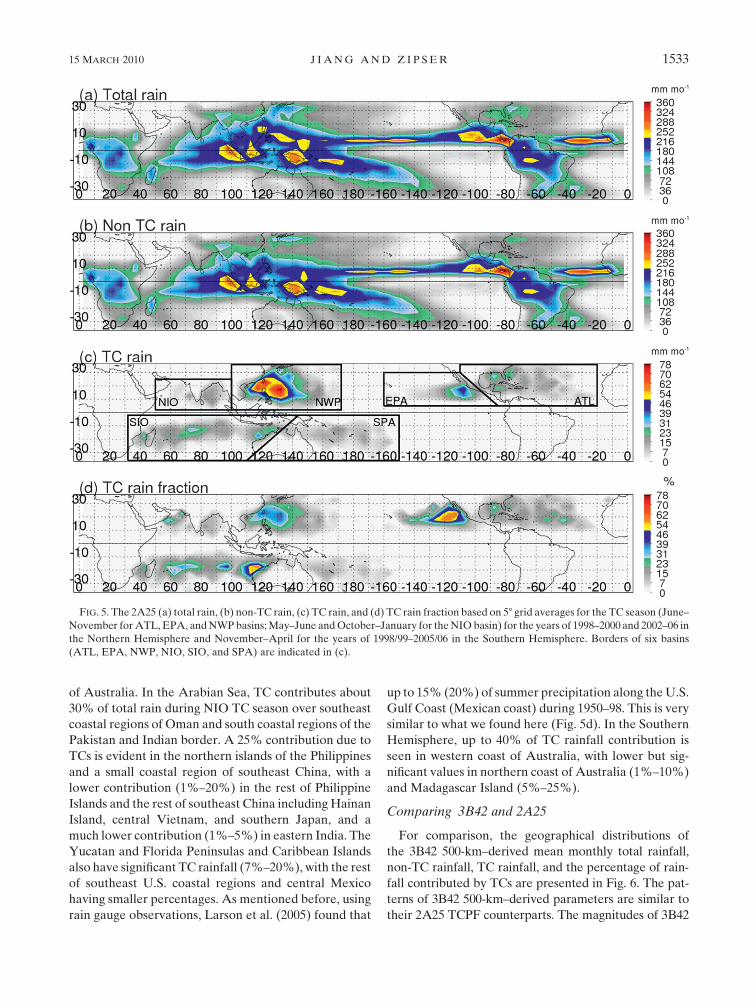
of Australia. In the Arabian Sea, TC contributes about
30% of total rain during NIO TC season over southeast
coastal regions of Oman and south coastal regions of the
Pakistan and Indian border. A 25% contribution due to
TCs is evident in the northern islands of the Philippines
and a small coastal region of southeast China, with a
lower contribution (1%–20%) in the rest of Philippine
Islands and the rest of southeast China including Hainan
Island, central Vietnam, and southern Japan, and a
much lower contribution (1%–5%) in eastern India. The
Yucatan and Florida Peninsulas and Caribbean Islands
also have significant TC rainfall (7%–20%), with the rest
of southeast U.S. coastal regions and central Mexico
having smaller percentages. As mentioned before, using
rain gauge observations, Larson et al. (2005) found that
up to 15% (20%) of summer precipitation along the U.S.
Gulf Coast (Mexican coast) during 1950–98. This is very
similar to what we found here (Fig. 5d). In the Southern
Hemisphere, up to 40% of TC rainfall contribution is
seen in western coast of Australia, with lower but sig-
nificant values in northern coast of Australia (1%–10%)
and Madagascar Island (5%–25%).
Comparing 3B42 and 2A25
For comparison, the geographical distributions of
the 3B42 500-km–derived mean monthly total rainfall,
non-TC rainfall, TC rainfall, and the percentage of rain-
fall contributed by TCs are presented in Fig. 6. The pat-
terns of 3B42 500-km–derived parameters are similar to
their 2A25 TCPF counterparts. The magnitudes of 3B42
FIG. 5. The 2A25 (a) total rain, (b) non-TC rain, (c) TC rain, and (d) TC rain fraction based on 58 grid averages for the TC season (June–
November for ATL, EPA, and NWP basins; May–June and October–January for the NIO basin) for the years of 1998–2000 and 2002–06 in
the Northern Hemisphere and November–April for the years of 1998/99–2005/06 in the Southern Hemisphere. Borders of six basins
(ATL, EPA, NWP, NIO, SIO, and SPA) are indicated in (c).
15 MARCH 2010 J I A N G A N D Z I P S E R 1533

and 2A25 total rainfall and non-TC rainfall are similar
over most regions, except that 3B42 is higher than 2A25
in South America and lower than 2A25 in southern Af-
rica (Figs. 6a,b). The 3B42 500-km–derived TC rain and
TC rain percentage (Figs. 6c,d) have magnitudes closer to
2A25 TCPF (Figs. 5c,d). The maximum 3B42 500-km–
derived TC mean monthly rain is about 80 mm month21
in Taiwan and the Philippines region.
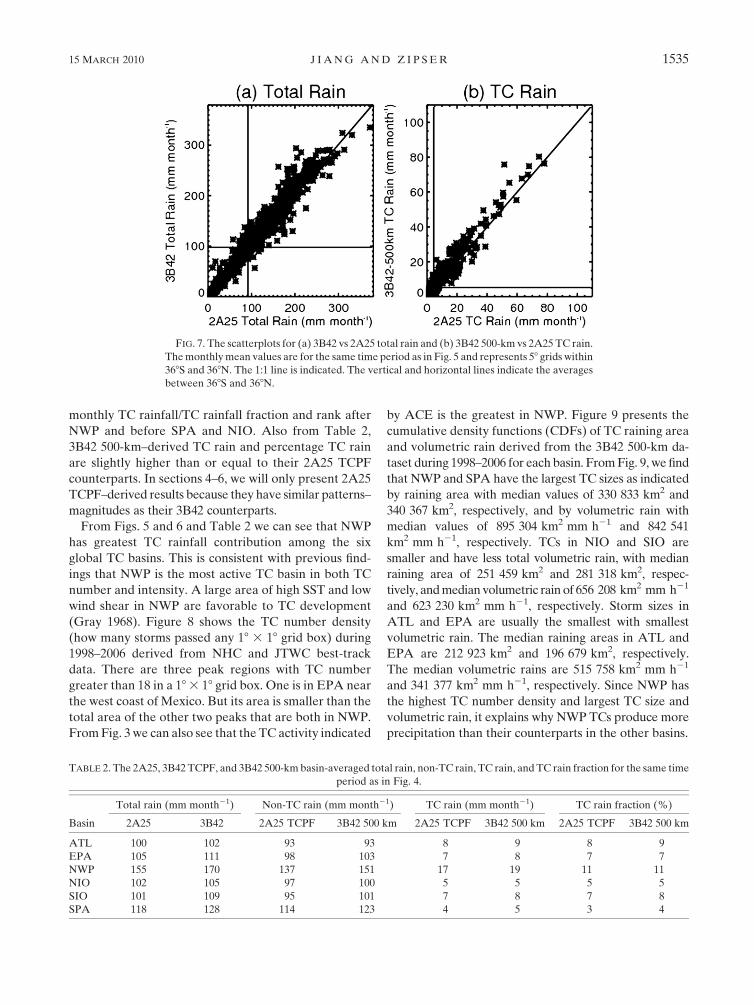
A point-by-point comparison of 3B42 and 2A25 total
rain and 3B42 500-km and 2A25 TCPF TC rain is shown
in Fig. 7. It is obvious that the 3B42 and 2A25 total rains
are close to each other. Similarly, the mean value of
3B42 500-km TC rain is 5.3 mm month21, which is very
close to 2A25. A similar analysis using TMI-based 2A12
rain retrievals in PR swath has been done (not shown
here), and it is found that 2A12 total rain and TC rain
are all close to its 2A25 and 3B42 500-km counterparts in
the time and space scale used in this study. Cecil and
Wingo (2009) provided a more detailed comparison of
2A25 and 2A12 TC rain in a finer scale. They found that
2A25 produced more rain within ;100 km of the center
of hurricanes compared to 2A12. However, at larger
distances and for weaker storms, those two algorithms
gave similar mean rain rates (slightly greater for 2A12).
From their Fig. 2, the averages over 0–500 km and
combining all storm intensities should be similar for
2A25 and 2A12.
Table 2 shows the basin-averaged total rain, non-TC
rain, TC rain, and TC rain percentage derived from
2A25 TCPF and 3B42 500 km. Regardless which dataset
is used, it can be seen from Table 2 that, among the six
global TC basins, NWP has the highest non-TC and TC
rain and TC rain fraction. SPA has the second highest
non-TC rain, but lowest TC rain and TC rain fraction.
NIO has the second lowest TC rain and TC rain fraction.
ATL, EPA, and SIO have similar amounts of mean
FIG. 6. As in Fig. 5, but rainfall amounts are derived from 3B42 500-km dataset (see text for details).
1534 J O U R N A L O F C L I M A T E VOLUME 23
monthly TC rainfall/TC rainfall fraction and rank after
NWP and before SPA and NIO. Also from Table 2,
3B42 500-km–derived TC rain and percentage TC rain
are slightly higher than or equal to their 2A25 TCPF
counterparts. In sections 4–6, we will only present 2A25
TCPF–derived results because they have similar patterns–
magnitudes as their 3B42 counterparts.
From Figs. 5 and 6 and Table 2 we can see that NWP
has greatest TC rainfall contribution among the six
global TC basins. This is consistent with previous find-
ings that NWP is the most active TC basin in both TC
number and intensity. A large area of high SST and low
wind shear in NWP are favorable to TC development
(Gray 1968). Figure 8 shows the TC number density
(how many storms passed any 18 3 18 grid box) during
1998–2006 derived from NHC and JTWC best-track
data. There are three peak regions with TC number
greater than 18 in a 18 3 18 grid box. One is in EPA near
the west coast of Mexico. But its area is smaller than the
total area of the other two peaks that are both in NWP.
From Fig. 3 we can also see that the TC activity indicated
by ACE is the greatest in NWP. Figure 9 presents the
cumulative density functions (CDFs) of TC raining area
and volumetric rain derived from the 3B42 500-km da-
taset during 1998–2006 for each basin. From Fig. 9, we find
that NWP and SPA have the largest TC sizes as indicated
by raining area with median values of 330 833 km2 and
340 367 km2, respectively, and by volumetric rain with
median values of 895 304 km2 mm h21 and 842 541
km2 mm h21, respectively. TCs in NIO and SIO are
smaller and have less total volumetric rain, with median
raining area of 251 459 km2 and 281 318 km2, respec-
tively, and median volumetric rain of 656 208 km2 mm h21
and 623 230 km2 mm h21, respectively. Storm sizes in
ATL and EPA are usually the smallest with smallest
volumetric rain. The median raining areas in ATL and
EPA are 212 923 km2 and 196 679 km2, respectively.
The median volumetric rains are 515 758 km2 mm h21
and 341 377 km2 mm h21, respectively. Since NWP has
the highest TC number density and largest TC size and
volumetric rain, it explains why NWP TCs produce more
precipitation than their counterparts in the other basins.
FIG. 7. The scatterplots for (a) 3B42 vs 2A25 total rain and (b) 3B42 500-km vs 2A25 TC rain.
The monthly mean values are for the same time period as in Fig. 5 and represents 58 grids within
368S and 368N. The 1:1 line is indicated. The vertical and horizontal lines indicate the averages
between 368S and 368N.
TABLE 2. The 2A25, 3B42 TCPF, and 3B42 500-km basin-averaged total rain, non-TC rain, TC rain, and TC rain fraction for the same time
period as in Fig. 4.
Total rain (mm month21) Non-TC rain (mm month21) TC rain (mm month21) TC rain fraction (%)
Basin 2A25 3B42 2A25 TCPF 3B42 500 km 2A25 TCPF 3B42 500 km 2A25 TCPF 3B42 500 km
ATL 100 102 93 93 8 9 8 9
EPA 105 111 98 103 7 8 7 7
NWP 155 170 137 151 17 19 11 11
NIO 102 105 97 100 5 5 5 5
SIO 101 109 95 101 7 8 7 8
SPA 118 128 114 123 4 5 3 4
15 MARCH 2010 J I A N G A N D Z I P S E R 1535

4. Rainfall and tropical cyclone intensity
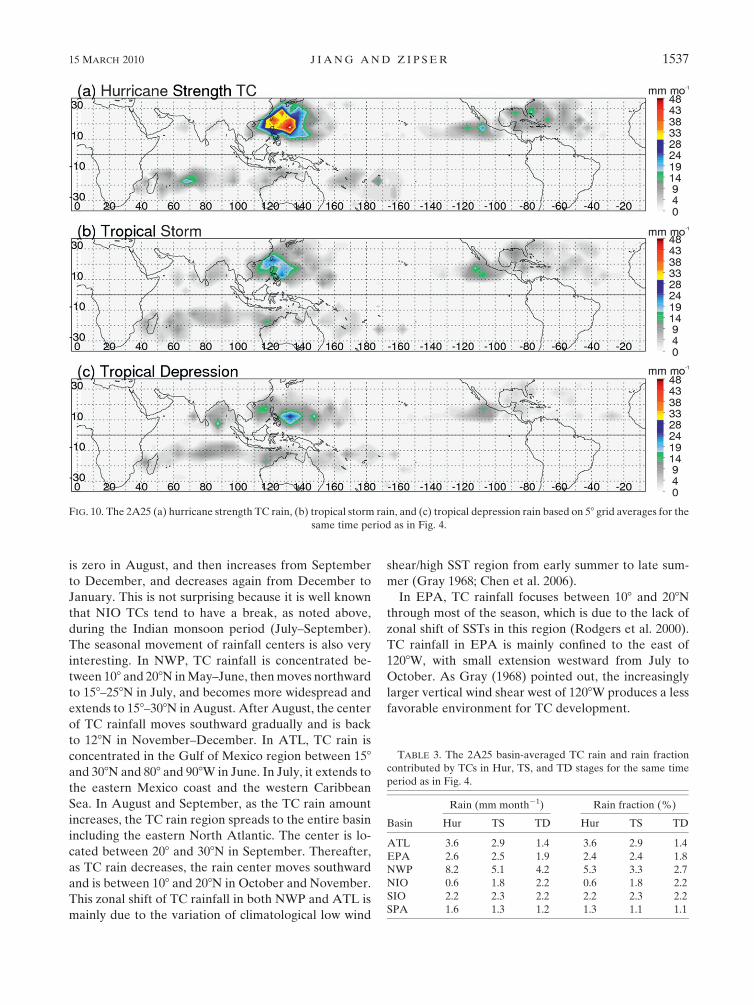
The geographic distribution of TC rainfall contributed
by hurricane strength TCs, tropical storms, and tropical
depressions is seen in Fig. 10. Rainfall from typhoons
extends to a large area in NWP and the peak is as high as
50 mm month21 in a region east of the Philippines in the
NWP basin. Rainfall from TCs of hurricane intensity
is generally less than 20 mm month21 in other basins.
Rainfall from TCs in hurricane intensity is concentrated
more poleward than storms and depressions for all ba-
sins. For example, peak hurricane rainfall is located
at around 288N in the ATL basin. Peak TC rainfall from
hurricane-stage storms in SPA and SIO is located at 198S.
Storms with a longer life time often are able to travel
to subtropical regions from lower latitudes and under
favorable conditions may intensify in higher-latitude
regions. Rainfall from tropical storms and depressions
is generally less than 25 mm month21 in NWP; 15 mm
month21 in EPA, NIO and SIO; and 12 mm month21 in
ATL and SPA.
The basin-averaged TC rainfall and percentage con-
tributed by different intensity stages is presented in
Table 3. The table shows that the greatest rain amounts
observed during the analysis period in ATL, EPA, NWP,
and SPA are contributed by TCs in hurricane stage, while
the greatest rain amounts during this period are con-
tributed by TCs in depression stage for the NIO basin and
storm stage for the SIO basin. Depressions are relatively
more frequent in the NIO than in other regions. For SIO,
the implication is that either the tropical storm stage is
more frequent, or that tropical storms (TSs) produce
a larger total volumetric rain during the period along the
western Australia coast than either depressions or strong
tropical cyclones.
5. Seasonal variation of tropical cyclone rainfall
The seasonal variation of the Northern Hemisphere
TC mean monthly rain for the months of May–January
is presented in Fig. 11. We select this 9-month period to
cover TC seasons in all basins in the Northern Hemi-
sphere. The figure shows that ATL and EPA (NWP) TC
rainfall increases from May to September (August) and
then decreases after September (August). TC rain is zero
in May and January for ATL and in December and Jan-
uary for EPA. NWP has TC activities all year long. NIO
TC rainfall peaks in May and decreases from June to July,
FIG. 8. Global TC number density on 18 3 18 grids during 1998–2006.
FIG. 9. CDFs of TC (left) raining area and (right) volumetric rain for each basin as derived from
the 3B42 500-km dataset (see text for details).
1536 J O U R N A L O F C L I M A T E VOLUME 23
is zero in August, and then increases from September
to December, and decreases again from December to
January. This is not surprising because it is well known
that NIO TCs tend to have a break, as noted above,
during the Indian monsoon period (July–September).
The seasonal movement of rainfall centers is also very
interesting. In NWP, TC rainfall is concentrated be-
tween 108 and 208N in May–June, then moves northward
to 158–258N in July, and becomes more widespread and
extends to 158–308N in August. After August, the center
of TC rainfall moves southward gradually and is back
to 128N in November–December. In ATL, TC rain is
concentrated in the Gulf of Mexico region between 158
and 308N and 808 and 908W in June. In July, it extends to
the eastern Mexico coast and the western Caribbean
Sea. In August and September, as the TC rain amount
increases, the TC rain region spreads to the entire basin
including the eastern North Atlantic. The center is lo-
cated between 208 and 308N in September. Thereafter,
as TC rain decreases, the rain center moves southward
and is between 108 and 208N in October and November.
This zonal shift of TC rainfall in both NWP and ATL is
mainly due to the variation of climatological low wind
shear/high SST region from early summer to late sum-
mer (Gray 1968; Chen et al. 2006).
In EPA, TC rainfall focuses between 108 and 208N
through most of the season, which is due to the lack of
zonal shift of SSTs in this region (Rodgers et al. 2000).
TC rainfall in EPA is mainly confined to the east of
1208W, with small extension westward from July to
October. As Gray (1968) pointed out, the increasingly
larger vertical wind shear west of 1208W produces a less
favorable environment for TC development.
FIG. 10. The 2A25 (a) hurricane strength TC rain, (b) tropical storm rain, and (c) tropical depression rain based on 58 grid averages for the
same time period as in Fig. 4.
TABLE 3. The 2A25 basin-averaged TC rain and rain fraction
contributed by TCs in Hur, TS, and TD stages for the same time
period as in Fig. 4.
Rain (mm month21) Rain fraction (%)
Basin Hur TS TD Hur TS TD
ATL 3.6 2.9 1.4 3.6 2.9 1.4
EPA 2.6 2.5 1.9 2.4 2.4 1.8
NWP 8.2 5.1 4.2 5.3 3.3 2.7
NIO 0.6 1.8 2.2 0.6 1.8 2.2
SIO 2.2 2.3 2.2 2.2 2.3 2.2
SPA 1.6 1.3 1.2 1.3 1.1 1.1
15 MARCH 2010 J I A N G A N D Z I P S E R 1537

FIG. 11. Seasonal 2A25 TC rain fraction based on 58 grid averages for the months of May–January for the years of
1998–2000 and 2002–06 in the Northern Hemisphere.
1538 J O U R N A L O F C L I M A T E VOLUME 23

In NIO, TC rain occurs from 208N to 08 in May in the
Bay of Bengal and 108 to 208N in the Arabian Sea, and
then decreases in both area and magnitude in June. Only
a small area on the eastern India coast is found in July
and even that disappears in August. Then TC rainfall
reappears in the middle of Arabian Sea in September
and moves to the eastern India, eastern Myanmar, and
southern Bangladesh coasts in October. From Novem-
ber to January, TC rainfall moves southward decreases
in areal coverage.
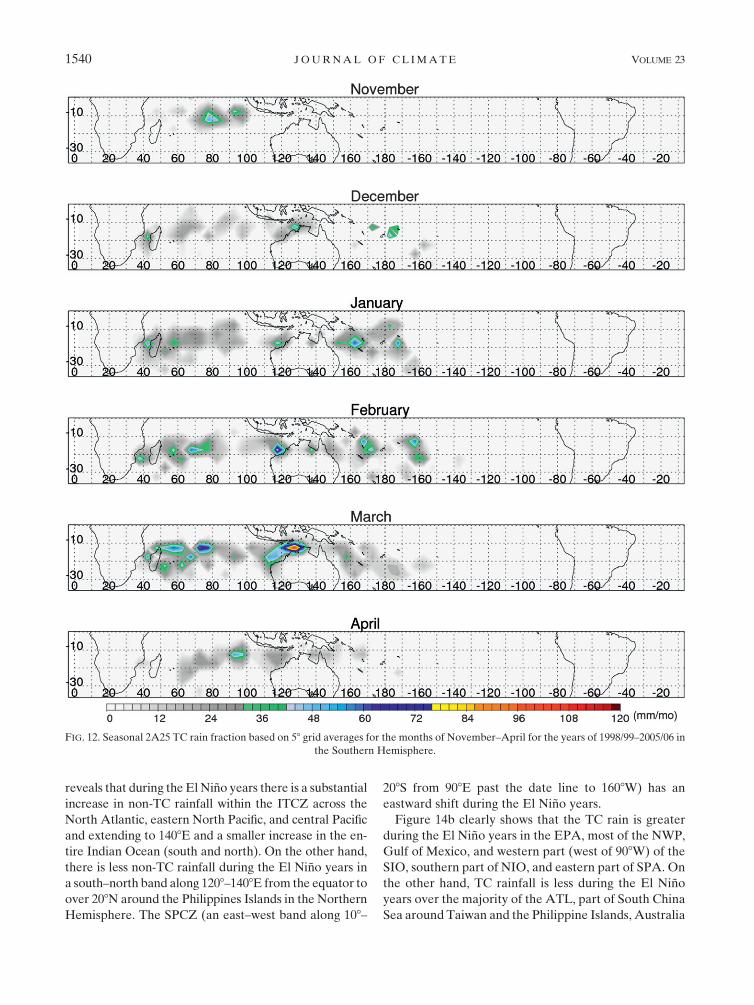
The seasonal variation of the Southern Hemisphere
TC mean monthly rain for the months of November–
April is presented in Fig. 12. The figure shows that SIO
(SPA) TC rainfall increases from November to March
(January) and then decreases. No TC occurs in No-
vember in SPA during the analysis period. The maxima
west of the Australia coast and west of Madagascar Is-
land are present from December through April with
only slight shifts in location. The maximum in the central
south Indian Ocean occurs in all the months with large
latitudinal and longitudinal variation. In SPA there is
a major increase from December to January and a de-
crease from March to April.
Figure 13 shows a bar graph that indicates the sea-
sonal variation of the non-TC (shaded bars) and TC
(white bars) mean monthly rainfall amounts for months
of May–January for Northern Hemisphere basins and
November–April for Southern Hemisphere basins. The
TC mean monthly rainfall and the percentage of rainfall
contributed by TCs both peak in September in ATL,
August–September in EPA, August in NWP, May in
NIO, March in SIO, and January–February in SPA. In
the Pacific (including EPA, NWP, and SPA), the months
that contain the greatest TC rainfall amounts–percentages
coincide with the months that have the largest non-TC
rainfall. Rodgers et al. (2000) found the same coincidence
in EPA. However, in ATL the month with greatest TC
rainfall (i.e., September) precedes with the month with
greatest non-TC rainfall (i.e., October). Rodgers et al.
(2001) found the same off phase between TC and non-TC
rainfall in eastern ATL, while in western ATL the months
with the greatest TC and non-TC rainfall coincide with
each other. This suggests that the ATL TC rainfall is
dominated by the eastern ATL storms generated by the
African easterly waves (Landsea and Gray 1992). In NIO
(SIO), the maximum TC rainfall occurs in May (March)
and precedes (lags) the maximum non-TC rainfall which
occurs in June (January).
6. Interannual variation of tropical cyclone rainfall
ENSO is the strongest interannual climate phenome-
non on a global scale. ENSO is known to affect the year-
to-year variability in TCs around the globe (Landsea
2000). Some previous studies have shown that there are
fewer Atlantic hurricanes in an El Nino year than usual,
while in a La Nina year there more Atlantic hurricanes
(Gray 1984; Saunders et al. 2000). During an El Nino
year, the wind shear is larger in most of the tropical
Atlantic, which inhibits the formation of hurricanes.
Rodgers et al. (2001) found an increase in ATL TC
rainfall in La Nina years. The situation is a little compli-
cated in the NWP. Mohr et al. (2009) showed that the
probability of the occurrence of large organized convec-
tive systems does not change with the phase of ENSO.
Lander (1994) did not observe an ENSO effect on annual
typhoon numbers. However, many other studies (Chan
1985, 2000; Chan et al. 1998; Saunders et al. 2000) showed
that the TC activity is above normal in the eastern part of
the NWP and slightly below normal over the South China
Sea during an El Nino event. They also found that TC
activity during a La Nina event is almost exactly the re-
verse of those in El Nino years, with significantly below
(above) normal activity over the eastern part of the
NWP (South China Sea). Rodgers et al. (2000) sug-
gested an increase in TC rainfall, frequency, and inten-
sity in all of the North Pacific Ocean (including the NWP
and EPA basins) during the warm ENSO years. Con-
flicting results have been presented for the NIO too.
Some studies showed that TC activity in the NIO basin is
not affected (Raghavan and Rajesh 2003), while others
argued that there is a reduction in TC activity in intense
cyclone months of May and November during El Nino
years (O. P. Singh 2009, personal communication).
Kuleshov et al. (2008) examined the 1981/82 to 2005/06
TC seasons in the Southern Hemisphere and found a
higher annual TC numbers in La Nina years than El Nino
years for the entire hemisphere (29 versus 25).
In this study, the multivariate ENSO index (MEI;
Wolter 1987) is used to identify El Nino and La Nina years
(http://www.cdc.noaa.gov/people/klaus.wolter/MEI/table.
html). Each basin is considered separately based on the
analyzed TC months indicated in section 2.2. A warm
(cold) ENSO episode was identified using a MEI thresh-
old of 1 (2) 0.55. The threshold is selected based on
probability MEI ranks similar to Kuleshov et al. (2008).
As a result, for the Northern Hemisphere basins, 2002
and 2006 are considered as El Nino years, while 1999 is
considered as La Nina year. For the Southern Hemi-
sphere, El Nino years are 2003 and 2005, while La Nina
years are 1999 and 2000. The resulting El Nino and La
Nina years are identical to those of Kuleshov et al. (2008)
for the Southern Hemisphere during the period applica-
ble to this study.
Figure 14 presents the differences of non-TC and TC
rain between the El Nino and La Nina years. Figure 14a
15 MARCH 2010 J I A N G A N D Z I P S E R 1539
reveals that during the El Nino years there is a substantial
increase in non-TC rainfall within the ITCZ across the
North Atlantic, eastern North Pacific, and central Pacific
and extending to 1408E and a smaller increase in the en-
tire Indian Ocean (south and north). On the other hand,
there is less non-TC rainfall during the El Nino years in
a south–north band along 1208–1408E from the equator to
over 208N around the Philippines Islands in the Northern
Hemisphere. The SPCZ (an east–west band along 108–
208S from 908E past the date line to 1608W) has an
eastward shift during the El Nino years.
Figure 14b clearly shows that the TC rain is greater
during the El Nino years in the EPA, most of the NWP,
Gulf of Mexico, and western part (west of 908W) of the
SIO, southern part of NIO, and eastern part of SPA. On
the other hand, TC rainfall is less during the El Nino
years over the majority of the ATL, part of South China
Sea around Taiwan and the Philippine Islands, Australia
FIG. 12. Seasonal 2A25 TC rain fraction based on 58 grid averages for the months of November–April for the years of 1998/99–2005/06 in
the Southern Hemisphere.
1540 J O U R N A L O F C L I M A T E VOLUME 23

west coast region, and south coast of India in Bay of
Bengal. The result in Fig. 14 is generally consistent with
Rodgers et al. (2000, 2001) but with some exceptions
such as in the Gulf of Mexico and South China Sea.
Neither this study nor Rodgers et al. (2000, 2001) in-
clude enough years of data to expect for the findings to
be considered representative of long-term statistics.
7. Conclusions
The impacts of TCs on geographical, seasonal, and in-
terannual variability of the total rainfall over six global
basins are investigated using rainfall estimated from
TRMM 2A25 and 3B42 during 1998–2006. The pattern of
3B42 TC rainfall is similar to its 2A25 counterpart, al-
though the feature-based 3B42 TC rainfall (3B42 TCPF)
overestimates about a factor of 2 relative to 2A25. By
constraining TC rainfall within 500 km of a TC center,
3B42-derived TC rain and TC rainfall percentage are ei-
ther slightly higher than or equal to its 2A25 counterparts.
TCs contribute, respectively, 11%, 8%–9%, 7%–8%,
7%, 5%, and 3%–4% of the total rainfall to the entire
domain of NWP, ATL, SIO, EPA, NIO, and SPA basins
during the TC season. The NWP basin has the highest TC
rain and TC rain fraction because the TC number density
and size in NWP are the highest and largest among
the six basins. At smaller subbasin scales, the greatest
contribution of TC rainfall is identified southwest of the
Baja California coast (55%), west of the Australia coast
(55%), and the region around Taiwan Island and north-
east of the Philippine Islands (35%–40%).
Generally TC rain maximum locations are poleward
of those for total/non-TC rains. The maximum TC rain
percentage is at the same place as where the TC rain is
concentrated in the ATL, NWP, and SIO basins, while it is
poleward of the TC rain itself in the EPA, NIO, and SIO.
FIG. 13. A histogram showing the 2A25 basin-averaged mean monthly rainfall amounts
contributed by non-TC systems (shade) and TCs (white) for (a) the months of May–January for
the years of 1998–2000 and 2002–06 in the Northern Hemisphere basins and (b) the months of
November–April for the years of 1998/99–2005/06 in the Southern Hemisphere. Percentage
above the bar represents the percentage of rainfall contributed by TCs during the month.
15 MARCH 2010 J I A N G A N D Z I P S E R 1541

TCs of hurricane intensity contribute the greatest rain
amounts in the ATL, EPA, NWP, and SPA basins, while
tropical depressions (tropical storms) contribute the
greatest rain amounts in the NIO (SIO) basin. Over the
globe, the rainfall of hurricane-stage TCs is more pole-
ward than that of depression and storm-stage TCs.
The seasonal TC rainfall shows different patterns for
different basins. The percentage of TC rainfall peaks in
September in the ATL basin (20%), August in NWP
(15%), August and September in EPA (10%), February
in SIO (7%), May in NIO (7%), and January in SPA
(6%). The peak TC rainfall month usually overlaps with
the month of peak TC rain fraction and sometime is offset
with the peak month of TC numbers shown in Fig. 2.
Distinct differences in both TC and non-TC rainfall
variations are shown between the El Nino and La Nina
years. Substantial (slight) El Nino year increase of TC
rain and TC rain fraction is seen for the NWP and EPA
(SIO and SPA) basins, while a decrease in TC rainfall
and TC rainfall percentage is found for the ATL and
NIO basins. However, this study does not include
enough years of data to expect the findings to be rep-
resentative of long-term statistics.
Acknowledgments. We thank Dan Cecil and George
Huffman for their very helpful review comments. Sup-
port for this study is provided by the NASA Precipitation
Measurement Mission (PMM) Grant NNX07AL41G,
NASA New Investigator Program (NIP) Grant
NNX08AT20G, and NASA Hurricane Science Research
Program (HSRP) Grant NNX09AC42G. The authors
thank Ramesh Kakar and Ming-Ying Wei (NASA head-
quarters) for their support. Discussions with Bin Wang at
University Hawaii, Bill Lau and Yaping Zhou at NASA
Goddard, Chuntao Liu at University of Utah, and Fumin
Ren at Chinese National Climate Center were very helpful.
REFERENCES
Adler, R. F., G. J. Huffman, D. T. Bolvin, S. Curtis, and
E. J. Nelkin, 2000: Tropical rainfall distributions determined
using TRMM combined with other satellite and rain gauge
information. J. Appl. Meteor., 39, 2007–2023.
Bell, G. D., and Coauthors, 2000: Climate assessment for 1999.
Bull. Amer. Meteor. Soc., 81, S1–S50.
Camargo, S. J., and A. H. Sobel, 2005: Western North Pacific tropical
cyclone intensity and ENSO. J. Climate, 18, 2996–3006.
Cecil, D. J., and E. J. Zipser, 2002: Reflectivity, ice scattering, and
lightning characteristics of hurricane eyewalls and rainbands.
Part II: Intercomparison of observations. Mon. Wea. Rev., 130,
785–801.
——, and M. Wingo, 2009: Comparison of TRMM rain rate
retrievals in tropical cyclones. J. Meteor. Soc. Japan, 87A,
369–380.
——, E. J. Zipser, and S. W. Nesbitt, 2002: Reflectivity, ice scat-
tering, and lightning characteristics of hurricane eyewalls and
rainbands. Part I: Quantitative description. Mon. Wea. Rev.,
130, 769–784.
——, S. J. Goodman, D. J. Boccippio, E. J. Zipser, and
S. W. Nesbitt, 2005: Three years of TRMM precipitation fea-
tures. Part I: Radar, radiometric, and lightning characteristics.
Mon. Wea. Rev., 133, 543–566.
Chan, J. C. L., 1985: Tropical cyclone activity in the northwest
Pacific in relation to the El Nino/Southern Oscillation phe-
nomenon. Mon. Wea. Rev., 113, 599–606.
——, 2000: Tropical cyclone activity over the western North Pacific
associated with El Nino and La Nina Events. J. Climate, 13,
2960–2972.
——, J. E. Shi, and C. M. Lam, 1998: Seasonal forecasting of
tropical cyclone activity over the western North Pacific and the
South China Sea. Wea. Forecasting, 13, 997–1004.
FIG. 14. The difference between (a) TC and (b) non-TC rain during El Nino years (2002 and
2004 for the Northern Hemisphere TC season and 2003 and 2005 for the Southern Hemisphere
TC season) minus the La Nina years (1999 for the Northern Hemisphere TC season and 1999
and 2000 for the Southern Hemisphere TC season) derived from 2A25.
1542 J O U R N A L O F C L I M A T E VOLUME 23

Chen, S. S., J. A. Knaff, and F. D. Marks, 2006: Effects of vertical wind
shear and storm motion on tropical cyclone rainfall asymmetries
deduced from TRMM. Mon. Wea. Rev., 134, 3190–3208.
Gan, M. A., V. E. Kousky, and C. F. Ropelewski, 2004: The South
America monsoon circulation and its relationship to rainfall
over west-central Brazil. J. Climate, 17, 47–66.
Gray, W. M., 1968: Global view of the origin of tropical distur-
bances and storms. Mon. Wea. Rev., 96, 669–700.
——, 1984: Atlantic seasonal hurricane frequency. Part I: El Nino
and 30-mb Quasi-Biennial Oscillation influences. Mon. Wea.
Rev., 112, 1649–1668.
Holiday, C. R., and A. H. Thompson, 1979: Climatological char-
acteristics of rapidly intensifying typhoons. Mon. Wea. Rev.,
107, 1022–1034.
Huffman, G. J., and Coauthors, 2007: The TRMM Multisatellite
Precipitation Analysis (TMPA): Quasi-global, multiyear,
combined-sensor precipitation estimates at fine scales. J. Hy-
drometeor., 8, 38–55.
Iguchi, T., T. Kozu, R. Meneghini, J. Awaka, and K. Okamoto,
2000: Rain-profiling algorithm for the TRMM precipitation
radar. J. Appl. Meteor., 39, 2038–2052.
Kubota, H., and B. Wang, 2009: How much do tropical cyclones
affect seasonal and interannual rainfall variability over the
western North Pacific? J. Climate, 22, 5495–5510.
Kuleshov, Y., L. Qi, R. Fawcett, and D. Jones, 2008: On tropical
cyclone activity in the Southern Hemisphere: Trends and the
ENSO connection. Geophys. Res. Lett., 35, L14S08, doi:10.1029/
2007GL032983.
Kummerow, C., W. Barnes, T. Kozu, J. Shiue, and J. Simpson, 1998:
The Tropical Rainfall Measuring Mission (TRMM) sensor
package. J. Atmos. Oceanic Technol., 15, 809–817.
Lander, M. A., 1994: An exploratory analysis of the relationship
between tropical storm formation in the western North Pacific
and ENSO. Mon. Wea. Rev., 122, 636–651.
Landsea, C. W., 2000: El Nino/Southern Oscillation and the sea-
sonal predictability of tropical cyclones. El Nino and the
Southern Oscillation: Multiscale Variability and Global and
Regional Impacts, H. F. Diaz and V. Markgraf, Eds., Cam-
bridge University Press, 149–181.
——, and W. Gray, 1992: The strong association between western
Sahelian monsoon rainfall and intense Atlantic hurricanes.
J. Climate, 5, 435–453.
Larson, J., Y. Zhou, and R. W. Higgins, 2005: Characteristics of
landfalling tropical cyclones in the United States and Mexico:
Climatology and interannual variability. J. Climate, 18, 1247–
1262.
Liu, C., E. J. Zipser, D. J. Cecil, S. W. Nesbitt, and S. Sherwood,
2008: A cloud and precipitation feature database from 9 years
of TRMM observations. J. Appl. Meteor. Climatol., 47, 2712–
2728.
Mohr, K. I., J. Molinari, and C. D. Thorncroft, 2009: The in-
terannual stability of cumulative frequency distributions for
convective system size and intensity. J. Climate, 22, 5218–
5231.
Mutai, C. C., and M. N. Ward, 2000: East African rainfall and the
tropical circulation/convection on intraseasonal to interannual
timescales. J. Climate, 13, 3915–3939.
Nesbitt, S. W., E. J. Zipser, and D. J. Cecil, 2000: A census of pre-
cipitation features in the tropics using TRMM: Radar, ice scat-
tering, and lightning observations. J. Climate, 13, 4087–4106.
——, ——, and C. D. Kummerow, 2004: An examination of version-5
rainfall estimates from the TRMM microwave imager, pre-
cipitation radar, and rain gauges on global, regional, and storm
scales. J. Appl. Meteor., 43, 1016–1036.
Raghavan, S., and S. Rajesh, 2003: Trends in tropical cyclone im-
pact: A study in Andhra Pradesh, India. Bull. Amer. Meteor.
Soc., 84, 635–644.
Ren, F., G. Wu, W. Dong, X. Wang, Y. Wang, W. Ai, and W. Li,
2006: Changes in tropical cyclone precipitation over China.
Geophys. Res. Lett., 33, L20702, doi:10.1029/2006GL027951.
Rodgers, E. B., R. F. Adler, and H. F. Pierce, 2000: Contribution
of tropical cyclones to the North Pacific climatological rain-
fall as observed from satellites. J. Appl. Meteor., 39, 1658–
1678.
——, ——, and ——, 2001: Contribution of tropical cyclones to the
North Atlantic climatological rainfall as observed from satel-
lites. J. Appl. Meteor., 40, 1785–1800.
Saunders, M. A., R. E. Chandler, C. J. Merchant, and F. P. Roberts,
2000: Atlantic hurricanes and NW Pacific typhoons: ENSO
spatial impacts on occurrence and landfall. Geophys. Res.
Lett., 27, 1147–1150.
Schumacher, C., and R. A. Houze, 2003: Stratiform rain in the
tropics as seen by the TRMM precipitation radar. J. Climate,
16, 1739–1756.
Shepherd, J. M., A. Grundstein, and T. L. Mote, 2007: Quantifying
the contribution of tropical cyclones to extreme rainfall along
the coastal southeastern United States. Geophys. Res. Lett.,
34, L23810, doi:10.1029/2007GL031694.
Simpson, J., R. F. Adler, and G. R. North, 1988: A proposed
Tropical Rainfall Measuring Mission (TRMM) satellite. Bull.
Amer. Meteor. Soc., 69, 278–295.
Spencer, R. W., H. M. Goodman, and R. E. Hood, 1989: Pre-
cipitation retrieval over land and ocean with the SSM/I:
Identification and characteristics of the scattering signal.
J. Atmos. Oceanic Technol., 6, 254–273.
Wolter, K., 1987: The southern oscillation in surface circulation
and climate over the tropical Atlantic, eastern Pacific, and
Indian Oceans as captured by cluster analysis. J. Appl. Me-
teor., 26, 540–558.
Wu, Y., S. Wu, and P. Zhai, 2007: The impact of tropical cyclones
on Hainan Island’s extreme and total precipitation. Int.
J. Climatol., 27, 1059–1064.
Yokoyama, C., and Y. N. Takayabu, 2008: A statistical study on
rain characteristics of tropical cyclones using TRMM satellite
data. Mon. Wea. Rev., 136, 3848–3862.
Zipser, E. J., D. J. Cecil, C. Liu, S. W. Nesbitt, and D. P. Yorty,
2006: Where are the most intense thunderstorms on earth?
Bull. Amer. Meteor. Soc., 87, 1057–1071.
15 MARCH 2010 J I A N G A N D Z I P S E R 1543