Contribution of Descriptive Characteristics to the Level...
36
Running head: CONTRIBUTION OF DESCRIPTIVE CHARACTERISTICS TO THE LEVEL OF ENVIRONMENTAL IMPACT AMONG NATIONS WITH LOW DEBT-TO-ASSET RATIOS Contribution of Descriptive Characteristics to the Level of Environmental Impact Among Nations with Low Debt-to-Asset Ratios MacKenzie Benson Wartburg College
Transcript of Contribution of Descriptive Characteristics to the Level...

Running head: CONTRIBUTION OF DESCRIPTIVE CHARACTERISTICS TO THE LEVEL OF ENVIRONMENTAL IMPACT AMONG NATIONS WITH LOW DEBT-TO-ASSET RATIOS
Contribution of Descriptive Characteristics to the Level of Environmental Impact Among Nations
with Low Debt-to-Asset Ratios
MacKenzie Benson
Wartburg College

ENVIRONMENTAL IMPACT AMONG NATIONS WITH LOW DEBT-TO-ASSET RATIOS 2
Abstract
This study examines the relationship between countries with low debt-to-asset ratios ecological
balance, as measured by the difference between a countries‟ biocapacity and ecological footprint of
consumption and several descriptive factors. The independent variables within this model are
specifically focused on the governmental propensity to respect the environment, employment makeup
within the country, and citizen welfare as it relates to resources available for environmental efforts. In
contrast to other studies, countries used were those who arguably have the monetary means to invest
in environmental policy and the model was multifaceted, including many levels. Using multiple linear
regression analysis of empirical data from 101 countries, results were that the factors of life
expectancy at birth, literacy rate, percent employment in agriculture, and CO2 emissions per capita
significantly correlated with the ecological footprint while governmental environmental agency,
percent of unemployment, life expectancy at birth, percent employment in industry, and proportion of
seats held by women in national parliament did not appear to have a significant correlation with the
ecological footprint. Based on these findings, the United Nations and other such governing bodies
should look at developing policies that consider these internal factors if they wish to have successful
policy outcomes and adherence with respect to the environment.
Keywords: ecological footprint, environmental impact, international environmental law

ENVIRONMENTAL IMPACT AMONG NATIONS WITH LOW DEBT-TO-ASSET RATIOS 3
Contribution of Descriptive Characteristics to the Level of Environmental Impact Among Nations
with Low Debt-to-Asset Ratios
The most recent Global Environment Outlook report published by the United Nations
Environmental Programme (2007) highlights that current environmental trends are compromising
human welfare: “in some cases climate change is having severe effects on human health, food
production, security and resource availability,” “both indoor and outdoor pollution [are] still causing
many premature deaths,” “land degradation is decreasing agricultural productivity, resulting in lower
incomes and reduced security,” (p. 6), species extinction rates are increasing at a rate 100 times that
shown in fossil records (p. 162), and “contaminated water remains the greatest single cause of human
sickness and death on a global scale” (p. 151). There is not a more truly international crisis occurring
today which calls for action and investigation than the health of the world and resources which we all
share.
The current study explores which empirical factors are important in influencing the
environmental impact a country and is measured by the ecological footprint, stated as either the deficit
or surplus, a country consumes as compared to the resources it has available (Global Footprint
Network, 2010). This is the dependent variable. Environmental impact is operationally defined as a
country which draws heavily on its available resources and in the context of the ecological footprint,
has a deficit.
In consideration of the independent variables to be used, the United Nations Environmental
Programme (2009) focuses on six main areas in its environmental examination: climate change,
resource efficiency, disasters and conflicts (“minimize threat to human well-being from the
environmental causes and consequences of existing and potential natural and man-made disasters”),
environmental governance, harmful substances and hazardous waste, and ecosystem management
(p.2). The scope of this study includes independent variables similar to those which the United

ENVIRONMENTAL IMPACT AMONG NATIONS WITH LOW DEBT-TO-ASSET RATIOS 4
Nations Environmental Programme focuses on: governmental propensity to respect the environment;
employment as it influences its likelihood to be less environmentally impactful; and citizen welfare as
it relays how much need a country has to invest its resources in improving the countries overall health
as opposed to environmental efforts.
In order to select the countries used in the study, countries with a low debt-to-asset ratio are
used – logically those who have relatively more resources to invest on improving their environmental
state and at a level seen by the European Union in its guidelines for adopting the Euro (European
Union, 2006). Ultimately 101 countries (see Table 1) were selected.
This study is done primarily to modestly aid in how international institutions should approach
structuring laws and with factors to consider when creating and modifying environmental standards to
be supremely effective. Though including such variables requires great breath – “The development of
modern international environmental law…has been one of the most remarkable exercises in
international lawmaking, comparable to the law of human rights and international trade law in the
scale and form it has taken” (Birnie, Boyle, & Redgwell, 2009, p. 1). Consequently, in an effort to
refine our understanding of environmental impact, it is essential in this and future studies that the
approach to examining environmental impact be multifaceted and thorough, considering many
significant key actions involved within a nation such as implementing environmental laws, structuring
government to support such desires, and assessing methods for enforcement.
The paper begins with a presentation of previous literature and the theories and discussion
presented posits a need to examine a multifaceted empirically based model for determining
environmental impact. Next, the variables used in the model are rationalized, examined, and finally
conclusions are stated along with the implications for future research.

ENVIRONMENTAL IMPACT AMONG NATIONS WITH LOW DEBT-TO-ASSET RATIOS 5
Literature Review
Environmental concerns have unquestionably been a hot topic internationally on many fronts –
within economics, science, and sociology, for example. The word sustainable, used in many contexts,
has been noted to be a common buzzword used with “remarkable regularity” among government
officials, policy-makers, and scientist alike (Bell, 2008, p. 3). The many benefits and fruits the
environment produces are being highlighted as well: promoting economic growth, as a contributor to
unique cultures, and enabling enjoyable, free, and often survival supporting benefits (United Nations
Environmental Programme, 2007, p. 13). All too often, these resources are being recognized as they
slowly begin to disappear. The conversation and action throughout the world have caused many
multilateral environmental agreements (MEAs) to become adapted (United Nations Environmental
Programme, 2007, p. 9) recognizing the formal importance of the environment and fashioning an
international push to reverse the damage done.
However, these agreements have been only moderately successful. So why are some countries
proposing and adhering to “environmental appreciation” more frequently and consistently than others?
Research over the last two decades has explored various elements such as income distribution and
wealth effects (Holland, Peterson, & Gonzalez, 2009; Hamilton & Turton, 2002), urbanization (York,
Rosa, & Dietz, 2003), and levels of international trade (Widemann, Lenzen, Turner, Barret, 2007).
Most often gross domestic product (GDP) and population are attributed to environmental impact
(Özler & Öbach, 2009, p.82). The inverse relationship has also been examined. Less developed, less
populous countries become better off economically as a product of their environmentalism (Schofer &
Granados, 2006, p. 965). This relationship indicates a strong, established relationship between a
country‟s environmental impact and economic well-being, as measured by GDP, regardless of a
country‟s state of development.
ENVIRONMENTAL IMPACT AMONG NATIONS WITH LOW DEBT-TO-ASSET RATIOS 6
Also explored within the field of environmental law enforcement have been the disparate
environmental impact levels between more-developed and developing countries. The ecologically
unequal exchange theory “posits that the vertical flow of exports is a structural mechanism allowing
for more-developed countries to partially externalize their consumption-based environmental impacts
to lesser-developed countries” (Jorgenson, Austin, & Dick, 2009, p. 263) and also suggests that more-
developed countries have greater access to resources externally (p. 265). From another perspective, the
environmental Kuznets curve (EKC) says that “in the early stages of economic growth degradation
and pollution increase, but beyond some level of income per capita, which will vary for different
indicators, the trend reverses, so that at high income levels economic growth leads to environmental
improvement” (Stern, 2004, p. 1419). The ecologically unequal exchange theory, in combination with
the EKC presents a very grim outlook for developing countries both in having their resources depleted
by outside sources as well as their own country‟s lack of economic growth causing them to face a
pinnacle that cannot be achieved to reduce their environmental impact.
Another applicable theory, the “treadmill of production,” helps to explain how the cycle of
struggling to increase production and increase GDP often leads to corners being cut and more waste
being produced therefore increasing the environmental impact (Gould, Weinberg, & Schnaiberg,
1993, p. 221). This cycle is often cited as very influential in the environmental impact of countries and
helps to explain and encourage research such as this which examines the disparities between
ecological footprints of countries with low debt-to-asset ratios. Therefore, if a country has successfully
amassed assets, mainly strong gross domestic product (GDP), that country is more likely to have faced
what the treadmill of production asserts is a lesser likelihood to be more environmentally impactful,
countering the EKC.
Previous environmental research has examined most or all countries including developing
countries and those with high debt to asset ratios in their analysis. Despite the opposing views on

ENVIRONMENTAL IMPACT AMONG NATIONS WITH LOW DEBT-TO-ASSET RATIOS 7
whether high GDP countries are more or less environmentally impacting, this study will use countries
with low debt-to-asset ratios so as to eliminate countries with overwhelming barriers to environmental
success on the front of resource availability. Additionally, GDP as a significant predictor of countries
with low debt-to-asset ratios would indicate that the treadmill production theory could be likely if such
a correlation was negative.
Specific overarching theories and models have seldom been presented to predict or determine a
country‟s involvement environmentally. Dernbach‟s (2003) research presents many significant themes
by arguing that the core of attaining sustainable development globally is to analyze integrated
decision-making because it “ensure[s] that environmental considerations and goals are integrated or
incorporated into the decisionmaking [sic] process for development, and are not treated separately or
independently…” along with being the “most easily translated into law and policy tools” (p. 248). He
argues that this focus responds well to governments who have been fragmented in their commitment
to such policies by acting as the glue which holds sustainability policies together (2003, pp. 257-258).
Contributing to this argument, the United Nations Environmental Programme (2007) observed that
decision making has become increasingly hands-on and is often spurred by the interaction of various
stakeholders and groups “building on national consensus…[and by] encourag[ing] local authorities to
engage in dialogue with their citizens” (p. 10). Other research has examined one factor, multiple
measure models within the empirical realm such as governmental structure (York, Rosa, and Dietz,
2003; Schofer & Hironaka, 2005) and economics (Özler & Öbach, 2009, p. 98; Jorgenson, Austin, &
Dick, 2009).
The literature indicates a gap in studying a consistent group of countries using a multifaceted
empirical model due to the newness of this topic. As the goals of this study mirror the outcomes seen
within the decision-making model (Dernbach, 2003) and in light of the previous research presented,
the following variables are examined:

ENVIRONMENTAL IMPACT AMONG NATIONS WITH LOW DEBT-TO-ASSET RATIOS 8
1. Government as it illustrates inclination to environmental issues and enactment of
environmental law (e.g. Dernbach, 2003);
2. Employment structure as it examine links between sectors of employment and their effect
on environmental impact (e.g. Rice, 2007; Enrhardt-Martinez, Crenshaw, & Jenkins,
2002);
3. Individual citizen welfare, as a measure of ability to engage in positively contributing to
reducing the environmental impact (e.g. Jorgenson, 2003; Heil & Seldon, 2001).
The research question at hand is: what factors most directly affect the degree of environmental
impact among countries with low debt-to-asset ratios? The research hypothesis states that there is a
significant direct relationship between environmental impact and descriptive characteristics involving
governmental attention, employment structure, and citizen welfare. Therefore the null hypothesis is
that there is no direct relationship between environmental impact and descriptive characteristics
involving governmental attention, employment structure, and citizen welfare. This study is testing the
theoretical orientation associated with the Ecological Kuznet‟s Curve (Stern, 2004, p. 1419) in the
sense that the lesser the debt of a country, the more likely they will be or become less environmentally
impactful.
Method of Analysis
The basis of this study is to find which indicator variables predict environmental impact – an
idea that has been popular “with many governments and agencies devoting substantial resources to
indicator development and testing” (Bell, 2008, pp.3-5). There is a challenge to conceptualize the
definition of environmental impact (Dernbach, 2003, p. 247). The term „environmental impact‟ is used
in this study to describe the degree to which a country impacts the earth. Hence, being an
environmentally impactful country denotes that a country uses a large portion of the resources
available, does not make many efforts to lessen this impact, and engages in environmental

ENVIRONMENTAL IMPACT AMONG NATIONS WITH LOW DEBT-TO-ASSET RATIOS 9
degradation. On the opposite end, countries that are not very environmentally impacting are those
which are much more sustainable in their practices such as setting standards when building or
producing to lessen the impact as well underutilizing the resources available by investing financially
or through other means to enable greater resources efficiency.
The independent variables are governmental propensity to respect the environment, as
measured by the proportion of women in the national parliaments, military expenditures, and the
presence of a governmental environmental agency; employment structure of the country as it
influences its likelihood to be less environmentally impactful, as measured by GDP per capita, percent
of employment in agriculture and industry, and unemployment level; and citizen welfare as it relays
how much need a country has to invest its resources in improving the countries overall health as
opposed to environmental efforts and overcoming large existing environmental hurdles, as measured
by life expectancy at birth, literacy rate, and current carbon emissions per capita.
Countries used in this study are those with low debt-to-asset ratios. The logic behind this
selection is that the lower the debt-to-asset ratio is the more money a country would arguably be able
to spend on discretionary spending such as environmental measures, for instance by decreasing their
ecological footprint or increasing biocapacity and increasing their ecological reserve. Ultimately 101
countries, as shown in Table 1, were selected whom had debt-to-asset ratios below .6 which was
calculated as external debt divided by GDP (World Bank, 2010). To justify the .6 level considered was
that among the Euro convergence criteria was a requirement that the ratio of government debt to GDP
was not to exceed 60% (European Union, 2006) therefore indicating that a ratio below .6 is considered
economically sound in at least one large international institution‟s viewpoint and would assumedly
equate to the ability to be environmental conscious as well. When the European Commission conducts
assessments the .6 debt-to-asset ratio is used to take into account: potential growth; “prevailing
cyclical conditions; and “developments in the medium-term budgetary position, particularly fiscal

ENVIRONMENTAL IMPACT AMONG NATIONS WITH LOW DEBT-TO-ASSET RATIOS 10
consolidation efforts in “good times,”‟ among others (European Union, 2007) all factors which are
important in evaluating the propensity of countries to be environmentally aware.
In using this criteria for country selection it is likely that they face the threats of both the
treadmill of production theory and possibly threat of the EKC and ecological unequal exchange theory
because of their successful accrual of a high GDP comparable to their external debt and possibly
because of their stage of development, which the majority of them are ranked relatively low on the
World Development Index (United Nations Development Programme, 2010) as shown in Table 1.
Additionally, this process left out a large majority of countries which are high on development, such
as the United States and many European countries due to their large debt-to-asset ratios.
Dependent Variable
The Global Footprint Network was established in 2003 in order to detail how proportionally
people and nations were using resources as they were available. For this study the environmental
impact of the country is determined by the ecological balance calculated by the biocapacity of the
country minus the ecological footprint of consumption for the country, as made available from Global
Footprint Network (2010) data. Each of these measured is reported as global hectares per capita.
Biocapacity of the country is the global hectares per capita of cropland, grazing land, forest, fishing
ground, and built land. Ecological footprint of consumption is the global hectares per capita of each of
these elements consumed. The entirety of this data set is shown in Table 4. In 2007 data made
available in 2010, the United Arab Emirates had the largest deficit of 8.9, Kuwait followed with a
deficit of 7.4, and Qatar had the third largest deficit of 5.8. Bolivia had the largest reserve of 16.9,
Congo had a reserve of 12.2 and Canada had the third largest reserve of 11.3.
Arguably the ecological footprint reflects poorly on countries who have little biocapacity.
However, all three of the countries who had the largest reserve also have the largest biocapacities. The
United Arab Emirates and Qatar each fell around the average biocapacity of 1.7. As a point of

ENVIRONMENTAL IMPACT AMONG NATIONS WITH LOW DEBT-TO-ASSET RATIOS 11
reference, the United States had the 19th
most biocapacity and the 6th
largest deficit. This measure is
seen as relatively fair and balanced in its approach to measuring the ecological reserve or deficit of a
country because it takes into account the existence and use of environmental resources available as
well as the land mass and population of the countries by virtue of measuring the resources available
and used in hectares per capita of resources available and used (Global Footprint Network, 2010). Its
use has been growing and has appeared in numerous other studies as a measure of environmental
impact (e.g. Özler & Öbach, 2009; Jorgenson, 2003; Rice, 2007; York, Rosa, Dietz, 2003) and has
been called the most comprehensive measure of environmental impact to date.
Independent Variables
Analysis within the categories of government, employment, and citizen welfare is limited to
variables which can increase empirical knowledge about the factors influencing the environmental
impact rather than aiming to assess the overall well-being of the countries directly, outside of their low
debt-to-asset ratio.
Government. There is a large network of organizations ranging from the governments
themselves to inter-governmental organizations to the scientific community that have aimed to have
an impact on environmental practices and outcomes (Schofer & Hironaka, 2005, p. 25). It is ultimately
the governments and citizens themselves who enact the laws and execute environmental practices
which influence the overall state of the environment internationally making the characteristics of the
government and its people of primal importance to better understand why the large variations of
environmental impact exist. However, York, Rosa, and Dietz‟s (2003) study suggests that form of
government has no part in explaining the variations in environmental impact (p. 279). Therefore, form
of government is not included within this study. Also within the literature is the positive correlation of
military expenditures (Jorgenson, Clark, & Kentor, 2010, p. 8) with environmental impact – the more
a country spends on its military the less environmentally conscious it is. Especially among countries

ENVIRONMENTAL IMPACT AMONG NATIONS WITH LOW DEBT-TO-ASSET RATIOS 12
who have managed their debt successfully, military expenditures correlation with environmental
impact is of great interest. A variable that has little research in the field of international
environmentalism is be included in the model as well – proportion of women in national parliaments.
It would be easy to reason that women would be more likely to demand equal resource distribution
and care in laws and regulations. Additionally included is a variable for the presence of a
governmental environmental agency. Many factors such as money and time investments suggest that
this would be a very strong predictor of environmental impact.
Employment. A previous study that used the ecological footprint as its measure already has
established that “in almost every respect, the free market, left unchecked by state action, yields greater
ecological degradation” (Özler & Öbach, 2009, p. 98) and therefore this study does not aim to
examine economic freedom within a country but instead mainly the employment structure of the
country. These measures are used: GDP per capita, in order to examine effects as presented by the
previously mentioned environmental Kuznets curve, as well as to confirm a previous finding that
“low- and lower middle-income countries…exhibit lower environmental consumption” (Rice, 2007, p.
1369); percent of employment in industry and agriculture, to examine the effect of the structure of
domestic production, as has been suggested (Enrhardt-Martinez, Crenshaw, & Jenkins, 2002); and
percent of the population which is unemployed, in order to reflect the economic and overall health of
the country in another manner.
Citizen welfare. Another study which also uses the ecological footprint as measured by
Jorgenson (2003) takes a global-approach to find why countries‟ have a great environmental impact
and finds that more powerful countries indeed consume significantly higher (p. 375). Jorgenson
(2003) also discovers that “domestic income inequality and literacy rates all prove to be significant
predictors of per capita ecological footprint” (p. 375). Literacy rates are used in this study as well as
life expectancy at birth to more accurately and comprehensively measure how the welfare of

ENVIRONMENTAL IMPACT AMONG NATIONS WITH LOW DEBT-TO-ASSET RATIOS 13
individual citizens ability and willingness to participate, also mirroring the decision-making model
(Dernbach, 2003).
Additionally included is a measure is CO2 emissions per capita in order to measure the current
state of environmental degradation as it affects citizen welfare within a country. Previous research
suggests that countries with high incomes contribute the majority of CO2 emissions (Heil & Seldon,
2001) which closely mirrors the treadmill of production theory.
Analysis
The PASW statistical package was used to determine the strength of the model proposed given
the factors chosen in their relation to environmental impact. The empirical data from each of the
variables was analyzed using collinear and multiple linear regression analysis. Data used for the
analysis is displayed in its entirety in Tables 5, 6, and 7.
Case presentation and discussion
A multiple linear regression was calculated to predict a nation‟s environmental impact based
on their governmental, employment, and citizen welfare variables. The model was significant, R2 =
.410, F (9, 32)=4.167, p< .001, n=41, as shown in Table 2. Life expectancy at birth, literacy rate,
percent employment in agriculture, and CO2 emissions per capita were the most significant predictors.
The life expectancy at birth, percent employment in agriculture, and CO2 emissions per capita were
negatively correlated with environmental impact. The literacy rate was positively correlated with
environmental impact.
The null hypothesis was accepted with a few exceptions. The null hypothesis stated that there
was not a significant direct relationship between environmental impact and descriptive characteristics
involving governmental attention, employment structure, and citizen welfare. Indeed, some of the
factors did have a direct relationship with environmental impact. However, variables such as
governmental environmental agency, which conceptually seems closely related, did not have any

ENVIRONMENTAL IMPACT AMONG NATIONS WITH LOW DEBT-TO-ASSET RATIOS 14
direct significance. And while there was no previous research supporting this, proportion of seats held
by women in national parliaments was not significant and actually had a negative effect.
Some of the previous research was not supported by this study either. For instance, the variable
of military expenditures (Jorgenson, Clark, & Kentor, 2010, p. 8) was most nearly significant as seen
in Table 3, Model 3 which includes GDP per capita and not CO2 emissions per capita. This result
suggests that national defense expenditures likely vary a great deal in their effect on the environment.
Each of the significant findings positively contributes to the theories posed. According to the
environmental Kuznets curve (EKC), countries moving through development will be negatively
affected by variables such as low life expectancy at birth and literacy rate which is what these results
illustrated holds true even in countries with greater resources to surpass such obstacles. The variable
of CO2 emissions per capita agrees with ecologically unequal exchange theory because countries with
higher CO2 emissions per capita, which could be due to more-developed countries externalizing their
consumption, indeed are more environmentally impactful which contributes to the hurdles faced by
the EKC.
The treadmill theory of production is not supported by this research because GDP was only
found to be significant when the independent variables of “CO2 emissions per capita” and
“governmental environmental agency” are removed as illustrated in Table 3, Model 2. In terms of the
ecological footprint, these variables are very influential within the model. With both of these variables
included, GDP becomes insignificant as seen in Table 3, Model 1. Interestingly, however, when CO2
emissions per capita are not included GDP per capita becomes incredibly significant as seen in Table
3, Model 3.
The limitations of this research are primarily access to consistent and recent data. While the lag
in data was compensated by mostly using the same year – 2008 – missing data had a large effect on

ENVIRONMENTAL IMPACT AMONG NATIONS WITH LOW DEBT-TO-ASSET RATIOS 15
results ability to be generalizable. Collinearity was analyzed as well and the model seen in Table 2 is
the model that has minimal overlap (VIF ≤ 3.735) providing strength to the results.
Environmental law implications for this study are numerous. If a consistent predictor such as
life expectancy at birth or literacy rate were to be used to set standards for reducing environmental
impact (e.g. countries with literacy rates above 80 are required to reduce their ecological footprint by 1
global hectare per capita per year whereas countries with literacy rates below 80 are only required to
reduce their ecological footprint by .5 global hectare per capita per year), there could be a greater hope
for achieving application that provides a change in the environmental state. Additional impacts could
be seen in the formulation of such laws targeting countries with high existing carbon emissions more
than those with lower existing carbon emissions. If the environmental governance focuses primarily
on a consistent predictor it is logical that better outcomes could be possible and more greatly received.
Further research is needed using a complete data set for every country in the world to
determine if this limitation of choosing only countries with debt-to-asset ratios lower than .6 is
influencing the strong correlations seen in the significant variables. The research should aim to
determine how much these variables actually influence the policy and decision making processes
related to environmental decisions.
Conclusion
The existence of a World Environmental Organization has been proposed extensively as a
solution to improving global environmental governance and was suggested by US foreign policy
strategist George F. Kennan in the 1960s who is often accredited as the person “who started the debate
on organizational aspects of what later evolved into today‟s global environmental governance
discourse…[in his] call for „an organizational personality‟ in international environmental politics
(Biermann & Bauer, 2005). Research such as this however, suggests that countries are continuously
relying not on their own capabilities and resource availability to become less environmentally
ENVIRONMENTAL IMPACT AMONG NATIONS WITH LOW DEBT-TO-ASSET RATIOS 16
impactful, but instead acting according to their internal states – mainly life expectancy, literacy rate,
percent employment in agriculture, and CO2 emissions per capita. Therefore, the dilemmas often
suggested to global governance organizations – “address[ing] questions of transparency,
accountability, and democracy” (Moravcsik, 2002, p. 213) cannot be overcome unless we realistically
consider the individual differentials in social power (p. 222) and include empirical analysis as well (p.
238).
While this model is significant on paper, the examination of whether these factors are actively
or passively affecting environmental impact requires future research to greater solidify more extensive
research being done. Still, any effort to consistently gain adherence and form more equal standards to
decrease environmental impact on a global scale must keep in mind the empirical differences,
specifically within employment and citizen wellbeing indicators, among countries if it hopes to be
successful in creating a better future for the health of our world.

ENVIRONMENTAL IMPACT AMONG NATIONS WITH LOW DEBT-TO-ASSET RATIOS 17
References
Atkeson, L.R. (2003). Not all cues are created equal: The conditional impact of female candidates on
political engagement. The Journal of Politics, 65(4), 1040-1061. Retrieved from:
http://www.jstor.org/stable/3449920
Bell, S. & Stephen, M. (2008). Sustainability Indicators (2nd ed.). Sterling, VA: Earthscan.
Biermann, F. & Bauer, S. (Eds.), (2005). A world environment organization. Burlington, VT: Ashgate
Publishing Company.
Birnie, P., Boyle, A, & Redgwell, C. (2009). International law and the environment (3rd ed.). New
York, NY: Oxford University Press.
Dernbach, J. C. (2003). Achieving sustainable development: The centrality and multiple facets of
integrated decisionmaking [sic]. Indiana Journal of Global Legal Studies, 10 (1), p. 247-285.
Enrhardt-Martinez, K., Crenshaw, E. M., & Jenkins, J. C. (2002). Deforestation and the environmental
Kuznets curve: a cross-national investigation of intervening mechanisms. Social Science
Quarterly, 83 (1), 226-243. doi: 10.1111/1540-6237.00080
European Union (2006). Summaries of EU legislation: Introducing the Euro: convergence criteria.
Retrieved from:
http://europa.eu/legislation_summaries/economic_and_monetary_affairs/institutional_and_eco
nomic_framework/l25014_en.htm
European Union (2007). The correction arm: the excessive deficit procedure. Retrieved from:
http://europa.eu/legislation_summaries/economic_and_monetary_affairs/stability_and_growth
_pact/l25020_en.htm
Global Footprint Network (2010). Ecological footprint and biocapacity, 2007. [Data set]. Retrieved
from http://www.footprintnetwork.org/images/uploads/2010_NFA_data_tables.xls

ENVIRONMENTAL IMPACT AMONG NATIONS WITH LOW DEBT-TO-ASSET RATIOS 18
Gould, K. A., Weinberg, A. S., Schnaiberg, A. (1993). Legitimating impotence: Pyrrhic victories of
the modern environmental movement. Qualitative Sociology, 16 (3), 207-247. Retrieved from
http://www.sociology.northwestern.edu/faculty/schnaiberg/documents/03.LEGIT.IMPOTENC
E-ENV.MVTS.pdf
Hamilton, C. & Turton, H. (2002). Determinants of emission growth in OECD countries. Energy
Policy, 30, 63-71. doi:10.1016/S0301-4215(01)00060-X
Heil, M. T. (2001). Carbon emissions and economic development: future trajectories based on
historical experience. Environmental and Development Economics, 6, 63-83. doi:
10.1017/S1355770X01000043.
Holland, T. G., Peterson, G. D., & Gonzalez, A. (2009). A cross-national analysis of how economic
inequality predicts biodiversity loss. Conservation Biology, 23 (5), 1304-1313. doi:
10.1111/j.1523-1739.2009.01207.x
Jorgenson, A. K. (2003). Consumption and environmental degradation: A cross-national analysis of
the ecological footprint. Social Problems, 50 (3), 374-394. doi: 10.1525/sp.2003.50.3.374
Jorgenson, A. K., Austin, K., & Dick, C. (2009). Ecologically unequal exchange and the resource
consumption/environmental degradation paradox: A panel study of less-developed countries,
1970–2000. International Journal of Comparative Sociology, 50 (3-4), 263-284. doi:
10.1177/0020715209105142
Jorgenson, A. K., Clark, B. & Kentor, J. (2010). Militarization and the environment: A panel study of
carbon dioxide emissions and the ecological footprints of nations, 1970-2000. Global
Environmental Politics, 10 (1), 7-29. doi: 10.1162/glep.2010.10.1.7
Moravcsik, A. (2002). Is there a „democratic deficit‟ in world politics? A framework for analysis. In
D. Held & M. Koenig-Archibugi (Eds.), Global Governance and Public Accountability (pp.
212-239). Malden, MA: Blackwell Publishing.

ENVIRONMENTAL IMPACT AMONG NATIONS WITH LOW DEBT-TO-ASSET RATIOS 19
Özler, Ş. İ. & Öbach, B. K. (2009). Capitalism, state economic policy and ecological footprint: An
international comparative analysis. Global Environmental Politics, 9 (1), 79-108. doi:
10.1162/glep.2009.9.1.79
Rice, J. (2007). Ecological unequal exchange: International trade and uneven utilization of
environmental space in the world system. Social Forces, 85 (3), p. 1369-1392. doi:
10.1353/sof.2007.0054
Schofer, E. & Granados, F. J. (2006). Environmentalism, globalization, and national economies, 1980-
2000. Social Forces, 85 (2), 965-991. doi: 10.1353/sof.2007.0024
Schofer, E. & Hironaka, A (2005). The effects of world society on environmental protection
outcomes. Social Forces, 84 (1), 25-47. doi: 10.1353/sof.2005.0127.xls
Stern, D. I. (2004) The rise and fall of the environmental Kuznets curve. World Development, 32 (8),
1419-1439. doi: 10.1016/j.worlddev.2004.03.004
United Nations Development Reports (2010). Human Development Report. Retrieved from:
http://hdr.undp.org/en/media/HDR_2010_EN_Complete.pdf
United Nations Environment Programme (2007). Global Environment Outlook 4. Retrieved from
http://www.unep.org/geo/geo4/report/GEO-4_Report_Full_en.pdf
United Nations Environment Programme (2009). UNEP in 2010-2013. Retrieved from
http://www.unep.org/pdf/Overview_folder.pdf
United Nations Environment Programme (2010). Environment Knowledge Hub. Retrieved from
http://ekh.unep.org/?q=front_page
Widemann, T., Lenzen, M., Turner, K., & Barrett, J. (2007). Examining the global environmental
impact of regional consumption activities. Ecological Economics, 61 (1), 15-26. doi:
10.1016/j.ecolecon.2006.12.003

ENVIRONMENTAL IMPACT AMONG NATIONS WITH LOW DEBT-TO-ASSET RATIOS 20
World Bank. (2010). Statistics retrieved from World Development Indicators. Available from
http://data.worldbank.org/indicator
York, R., Rosa, E. A., & Dietz, T. (2003, Apr.) Footprints on the Earth: the environmental
consequences of modernity. American Sociological Review, 68 (2), 279-300. Retrieved from:
http://www.jstor.org/stable/1519769

ENVIRONMENTAL IMPACT AMONG NATIONS WITH LOW DEBT-TO-ASSET RATIOS 21
Appendix:
Table 1
Countries with debt-to-asset ratios below .60 a, alphabetical
Afghanistan
Algeria !
Angola
Argentina !
Armenia !
Aruba
Azerbaijan !
Bahrain *
Bangladesh
Belarus !
Belgium *
Bolivia
Bosnia and Herzegovina !
Botswana
Brazil !
Burkina Faso
Cambodia
Cameroon
Central African Republic
Chile !
China
Colombia !
Congo, Dem.
Costa Rica !
Cote d'Ivoire
Cuba
Czech Republic *
Dominican Republic
Ecuador !
Egypt
El Salvador
Equatorial Guinea
Ethiopia
Gabon
Georgia !
Ghana
Greenland
Guatemala
Guyana
Haiti
Honduras
India
Indonesia
Iran !
Israel *
Italy *
Japan *
Jordan !
Kenya
Korea, South *
Kuwait !
Laos
Lesotho
Libya !
Madagascar
Malawi
Malaysia !
Maldives
Malta *
Marshall Islands
Mauritius
Mexico !
Mongolia
Morocco
Mozambique
Namibia
Nepal
New Zealand *
Nigeria
Oman
Pakistan
Panama !
Papua New Guinea
Paraguay
Peru !
Philippines
Poland *
Romania !
Russia !
Saudi Arabia !
Senegal
Singapore *
South Africa
Sri Lanka
Swaziland
Syria
Tajikistan
Tanzania
Thailand
Trinidad and Tobago !
Tunisia !
Turkey !
Turkmenistan
Uganda
United Arab Emirates *
Uruguay !
Uzbekistan
Venezuela !
Vietnam
Yemen
Zambia
a Calculated using World Bank data (2010): GDP(ex. exchange rate)/external debt (exchange rate basis)
* Very high human development (12); ! High human development (28) (from Human Development Index (2010), pp.
139-142)

ENVIRONMENTAL IMPACT AMONG NATIONS WITH LOW DEBT-TO-ASSET RATIOS 22
Table 2
Coefficients for independent variables
Independent variables Beta
t
Sig.
Military expenditures as % of GDP -.070
-.374
.711
Proportion of seats held by women in
parliament
-.198
-1.331
.192
Percent of unemployment -.273
-1.411
.168
Life expectancy at birth -.555
-2.488
.018*
Literacy rate .469
2.948
.006**
Percent employment in agriculture a -.430
-1.857
.073
Percent employment in industry a -.159
-.798
.431
CO2 emission per capita -.677
-3.322
.002**
Governmental environmental agency .051
.373
.712
Note: Data is 2008 World Bank (2010) development indicator data except where noted. a Data from 2006 and 2007 were used as most recently available from the World bank ( r = .874, p <
0.01 (1-tailed)). Conceptually it makes sense that this same correlation would be found among
percent employment in industry.
** p < .01
* p < .05

ENVIRONMENTAL IMPACT AMONG NATIONS WITH LOW DEBT-TO-ASSET RATIOS 23
Table 3
Coefficients for independent variables based on three models
Independent variables Beta
t
Sig.
Model 1: Coefficients for independent variables (with IV GDP per capita included)
Military expenditures as % of GDP -.111
-.584
.563
Proportion of seats held by women in
parliament
-.185
-1.238
.225
Percent of unemployment -.257
-1.327
.194
GDP per capita -.279
-.994
.328
Life expectancy at birth -.445
-1.787
.084
Literacy rate .433
2.661
.012*
Percent employment in agriculture a -.442
-1.905
.066
Percent employment in industry a -.208
-1.014
.319
CO2 emission per capita -.414
-1.240
.224
Governmental environmental agency 0.42
.308
.760
Model 2: Coefficients for independent variables (not including CO2 emission per capita
or governmental environmental agency and including GDP per capita)
Military expenditures as % of GDP -.374
-1.582
.711
Proportion of seats held by women in
parliament
-.202
-1.364
.182
Percent of unemployment -.213
-1.262
.216
GDP per capita -.559
-3.281
.002**
Life expectancy at birth -.295
-1.395
.172
Literacy rate .363
2.384
.023*
Percent employment in agriculture a -.442
-2.001
.054
Percent employment in industry a -.329
-1.828
.077
Note: Data is 2008 World Bank (2010) development indicator data except where noted a Data from 2006 and 2007 were used as most recently available from the World bank ( r = .874, p < 0.01 (1-tailed)).
Conceptually it makes sense that this same correlation would be found among percent employment in industry.
** p < .01
* p < .05

ENVIRONMENTAL IMPACT AMONG NATIONS WITH LOW DEBT-TO-ASSET RATIOS 24
Table 3 (cont.)
Coefficients for independent variables based on three models
Independent variables Beta
t
Sig.
Model 3: Coefficients for independent variables (with GDP per capita present and not
including CO2 emissions per capita)
Military expenditures as % of GDP -.248
-1.582
.123
Proportion of seats held by women in
parliament
-.201
-1.337
.191
Percent of unemployment -.192
-1.020
.216
GDP per capita -.556
-3.201
.003**
Life expectancy at birth -.287
-1.331
.193
Literacy rate .366
2.364
.024*
Percent employment in agriculture a -.425
-1.818
.078
Percent employment in industry a -.318
-1.699
.099
Governmental environmental agency .037
.268
.791
Note: Data is 2008 World Bank (2010) development indicator data except where noted a Data from 2006 and 2007 were used as most recently available from the World bank ( r = .874, p <
0.01 (1-tailed)). Conceptually it makes sense that this same correlation would be found among
percent employment in industry.
** p < .01
* p < .05

ENVIRONMENTAL IMPACT AMONG NATIONS WITH LOW DEBT-TO-ASSET RATIOS 25
Table 4
Ecological footprint data for all available countries (all values in global hectares per capita) Country Ecological Footprint
of Consumption
Total
Biocapacity
Ecological
Footprint
Afghanistan 0.6 0.5 (0.1)
Albania 1.9 0.9 (1.0)
Algeria 1.6 0.6 (1.0)
Angola 1.0 3.0 2.0
Argentina 2.6 7.5 4.9
Armenia 1.8 0.7 (1.0)
Australia 6.8 14.7 7.9
Austria 5.3 3.3 (2.0)
Azerbaijan 1.9 0.8 (1.1)
Bangladesh 0.6 0.4 (0.2)
Belarus 3.8 3.3 (0.5)
Belgium 8.0 1.3 (6.7)
Benin 1.2 0.8 (0.4)
Bolivia 2.6 18.8 16.3
Bosnia and Herzegovina 2.7 1.6 (1.1)
Botswana 2.7 3.8 1.2
Brazil 2.9 9.0 6.1
Bulgaria 4.1 2.1 (1.9)
Burkina Faso 1.3 1.3 (0.0)
Burundi 0.9 0.5 (0.4)
Cambodia 1.0 0.9 (0.1)
Cameroon 1.0 1.9 0.8
Canada 7.0 14.9 7.9
Central African Republic 1.3 8.4 7.1
Chad 1.7 3.2 1.4
Chile 3.2 3.8 0.6
China 2.2 1.0 (1.2)
Colombia 1.9 4.0 2.1
Congo 1.0 13.3 12.3
Congo, Democratic Republic of 0.8 2.8 2.0
Costa Rica 2.7 1.9 (0.8)
Côte d'Ivoire 1.0 1.7 0.7
Croatia 3.7 2.5 (1.2)
Cuba 1.9 0.7 (1.1)
Czech Republic 5.7 2.7 (3.1)
Denmark 8.3 4.9 (3.4)
Dominican Republic 1.5 0.5 (1.0)
Ecuador 1.9 2.3 0.4
Egypt 1.7 0.6 (1.0)
El Salvador 2.0 0.7 (1.4)
Eritrea 0.9 1.6 0.7
Estonia 7.9 9.0 1.1
Ethiopia 1.1 0.7 (0.4)
Finland 6.2 12.5 6.3
France 5.0 3.0 (2.0)
Gabon 1.4 29.3 27.9
Gambia 3.4 1.1 (2.3)
Georgia 1.8 1.2 (0.6)
Germany 5.1 1.9 (3.2)
Ghana 1.8 1.2 (0.6)
Note All Table 4 data is from the Global Footprint Network (2010) 2007 ecological footprint data

ENVIRONMENTAL IMPACT AMONG NATIONS WITH LOW DEBT-TO-ASSET RATIOS 26
Table 4 (cont.)
Ecological footprint data for all available countries (all values in global hectares per capita) Country Ecological Footprint
of Consumption
Total
Biocapacity
Ecological
Footprint
Greece 5.4 1.6 (3.8)
Guatemala 1.8 1.1 (0.6)
Guinea 1.7 2.8 1.2
Guinea-Bissau 1.0 3.2 2.3
Haiti 0.7 0.3 (0.4)
Honduras 1.9 1.8 (0.1)
Hungary 3.0 2.2 (0.8)
India 0.9 0.5 (0.4)
Indonesia 1.2 1.4 0.1
Iran, Islamic Republic of 2.7 0.8 (1.9)
Iraq 1.3 0.3 (1.0)
Ireland 6.3 3.5 (2.8)
Israel 4.8 0.3 (4.5)
Italy 5.0 1.1 (3.8)
Jamaica 1.9 0.4 (1.5)
Japan 4.7 0.6 (4.1)
Jordan 2.1 0.2 (1.8)
Kazakhstan 4.5 4.0 (0.5)
Kenya 1.1 0.6 (0.5)
Korea, Democratic People's Republic of 1.3 0.6 (0.7)
Korea, Republic of 4.9 0.3 (4.5)
Kuwait 6.3 0.4 (5.9)
Kyrgyzstan 1.2 1.3 0.1
Lao People's Democratic Republic 1.3 1.6 0.3
Latvia 5.6 7.1 1.4
Lebanon 2.9 0.4 (2.5)
Lesotho 1.1 0.8 (0.3)
Liberia 1.3 2.5 1.2
Libyan Arab Jamahiriya 3.1 0.4 (2.6)
Lithuania 4.7 4.4 (0.3)
Macedonia TFYR 5.7 1.4 (4.2)
Madagascar 1.8 3.1 1.3
Malawi 0.7 0.7 (0.0)
Malaysia 4.9 2.6 (2.3)
Mali 1.9 2.5 0.6
Mauritania 2.6 5.5 2.9
Mauritius 4.3 0.6 (3.7)
Mexico 3.0 1.5 (1.5)
Moldova 1.4 0.7 (0.7)
Mongolia 5.5 15.1 9.6
Morocco 1.2 0.6 (0.6)
Mozambique 0.8 1.9 1.1
Myanmar 1.8 2.0 0.3
Namibia 2.2 7.6 5.4
Nepal 3.6 0.5 (3.0)
Netherlands 6.2 1.0 (5.2)
New Zealand 4.9 10.8 5.9
Nicaragua 1.6 2.8 1.3
Niger 2.3 2.1 (0.3)
Nigeria 1.4 1.1 (0.3)
Norway 5.6 5.5 (0.1)

ENVIRONMENTAL IMPACT AMONG NATIONS WITH LOW DEBT-TO-ASSET RATIOS 27
Table 4 (cont.)
Ecological footprint data for all available countries (all values in global hectares per capita) Country Ecological Footprint
of Consumption
Total
Biocapacity
Ecological
Footprint
Oman 5.0 2.1 (2.8)
Pakistan 0.8 0.4 (0.3)
Panama 2.9 3.1 0.3
Papua New Guinea 2.1 3.8 1.6
Paraguay 3.2 11.2 8.0
Peru 1.5 3.9 2.3
Philippines 1.3 0.6 (0.7)
Poland 4.3 2.1 (2.3)
Portugal 4.5 1.3 (3.2)
Qatar 10.5 2.5 (8.0)
Romania 2.7 2.0 (0.8)
Russian Federation 4.4 5.7 1.3
Rwanda 1.0 0.6 (0.5)
Saudi Arabia 5.1 0.8 (4.3)
Senegal 1.1 1.2 0.1
Serbia 2.4 1.2 (1.2)
Sierra Leone 1.1 1.2 0.1
Singapore 5.3 0.0 (5.3)
Slovakia 4.1 2.7 (1.4)
Slovenia 5.3 2.6 (2.7)
Somalia 1.4 1.4 (0.0)
South Africa 2.3 1.1 (1.2)
Spain 5.4 1.6 (3.8)
Sri Lanka 1.2 0.4 (0.8)
Sudan 1.7 2.4 0.7
Swaziland 1.5 1.0 (0.5)
Sweden 5.9 9.7 3.9
Switzerland 5.0 1.2 (3.8)
Syrian Arab Republic 1.5 0.7 (0.8)
Tajikistan 1.0 0.6 (0.4)
Tanzania, United Republic of 1.2 1.0 (0.2)
Thailand 2.4 1.2 (1.2)
Timor-Leste 0.4 1.2 0.8
Togo 1.0 0.6 (0.4)
Trinidad and Tobago 3.1 1.6 (1.5)
Tunisia 1.9 1.0 (0.9)
Tajikistan 1.0 0.6 (0.4)
Turkey 2.7 1.3 (1.4)
Turkmenistan 3.9 3.2 (0.7)
Uganda 1.5 0.8 (0.7)
Ukraine 2.9 1.8 (1.1)
United Arab Emirates 10.7 0.8 (9.8)
United Kingdom 4.9 1.3 (3.6)
United States of America 8.0 3.9 (4.1)
Uruguay 5.1 9.9 4.8
Uzbekistan 1.7 0.9 (0.8)
Venezuela, Bolivarian Republic of 2.9 2.8 (0.1)
Viet Nam 1.4 0.9 (0.5)
Yemen 0.9 0.6 (0.3)
Zambia 0.9 2.3 1.3
Zimbabwe 1.2 0.8 (0.5)

ENVIRONMENTAL IMPACT AMONG NATIONS WITH LOW DEBT-TO-ASSET RATIOS 28
Table 5
Data for countries used in analysis (governmental factors)
Country Military expenditures
(% of GDP)
Presence of a
government
environmental
agency (1 = present)
Proportion of seats held
by women in national
parliaments(%)
Afghanistan 2.1 1 28
Algeria 3.8 0 8
Angola 4.6 0 37
Argentina 0.8 0 42
Armenia 3.3 0 N/A
Aruba N/A 0 N/A
Azerbaijan 3.5 0 11
Bahrain 3 0 3
Bangladesh 1.1 1 19
Belarus 1.8 0 32
Belgium 1.2 0 35
Bolivia 1.6 0 17
Bosnia and
Herzegovina
1.5 0 12
Botswana 3.2 0 11
Brazil 1.7 1 9
Burkina Faso 1.3 0 15
Cambodia 1.2 1 16
Cameroon 1.5 0 14
Central African
Republic
1.6 0 11
Chile 3.1 0 15
China 2 1 21
Colombia 4.1 0 8
Congo, Dem. 1.4 0 8
Costa Rica 0 0 37
Cote d'Ivoire 1.6 0 9
Cuba N/A 0 43
Czech Republic 1.5 0 16
Dominican
Republic
0.6 0 20
Ecuador 3.3 0 32
Egypt 2.2 0 2
El Salvador 0.5 0 17
Equatorial Guinea N/A 0 10
Ethiopia 1.4 0 22
Gabon 1.1 0 17
Georgia 5.6 0 5
Ghana 0.7 0 8
Greenland N/A 0 N/A

ENVIRONMENTAL IMPACT AMONG NATIONS WITH LOW DEBT-TO-ASSET RATIOS 29
Table 5 (cont.)
Data for countries used in analysis (governmental factors)
Country Military expenditures
(% of GDP)
Presence of a
government
environmental
agency (1 = present)
Proportion of seats held
by women in national
parliaments (%)
Guatemala 0.4 0 12
Guyana N/A 0 30
Haiti 0 0 4
Honduras 0.8 0 23
India 3 1 11
Indonesia 0.9 0 18
Iran 2.8 0 3
Israel 6.9 1 18
Italy 1.7 0 21
Japan 1 0 11
Jordan 6.1 0 6
Kenya 1.9 0 10
Korea, South (Rep.
of)
2.9 1 14
Kuwait 3.1 0 8
Laos 0.4 1 25
Lesotho 3 0 25
Libya 1.2 0 8
Madagascar 1.1 0 8
Malawi 1.2 0 21
Malaysia 2 1 11
Maldives N/A 1 7
Malta 0 0 9
Marshall Islands N/A 1 3
Mauritius 0.2 0 17
Mexico 0.5 1 28
Mongolia 1.4 1 4
Morocco 3.4 0 11
Mozambique 0.9 0 35
Namibia 3.3 0 27
Nepal 1.6 1 33
New Zealand 1.1 1 33
Nigeria 0.9 1 7
Oman 7.7 0 0
Pakistan 3.1 1 23
Panama 0 0 9
Papua New Guinea 0.5 1 1
Paraguay 0.8 0 13
Peru 1.2 0 28
Philippines 0.8 1 21

ENVIRONMENTAL IMPACT AMONG NATIONS WITH LOW DEBT-TO-ASSET RATIOS 30
Table 5 (cont.)
Data for countries used in analysis (governmental factors)
Country Military expenditures
(% of GDP)
Presence of a
government
environmental
agency (1 = present)
Proportion of seats held
by women in national
parliaments (%)
Poland 2 0 20
Romania 1.5 0 9
Russia 4.3 0 14
Saudi Arabia 11.2 1 0
Senegal 1.6 0 22
Singapore 4.3 1 25
South Africa 1.5 0 45
Sri Lanka 3.5 0 6
Swaziland 2.2 0 14
Syria (Syrian Arab
Republic)
4.2 0 12
Tajikistan N/A 1 18
Tanzania 1.1 0 30
Thailand 1.8 1 12
Trinidad and
Tobago
N/A 0 27
Tunisia 1.4 0 23
Turkey 2.8 0 9
Turkmenistan N/A 1 17
Uganda 2 0 31
United Arab
Emirates
5.6 0 23
Uruguay 1.6 0 12
Uzbekistan N/A 1 18
Venezuela 1.3 0 19
Vietnam 2.2 1 26
Yemen 4.4 0 0
Zambia 1.7 0 15
ENVIRONMENTAL IMPACT AMONG NATIONS WITH LOW DEBT-TO-ASSET RATIOS 31
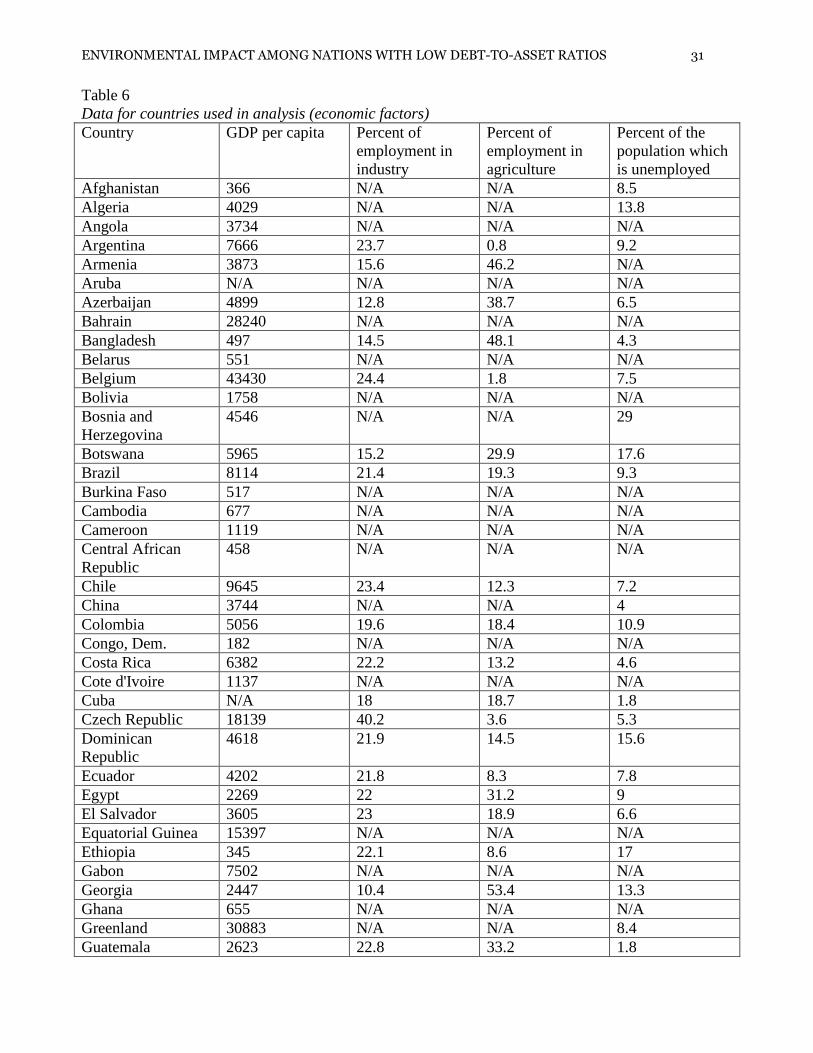
Table 6
Data for countries used in analysis (economic factors)
Country GDP per capita Percent of
employment in
industry
Percent of
employment in
agriculture
Percent of the
population which
is unemployed
Afghanistan 366 N/A N/A 8.5
Algeria 4029 N/A N/A 13.8
Angola 3734 N/A N/A N/A
Argentina 7666 23.7 0.8 9.2
Armenia 3873 15.6 46.2 N/A
Aruba N/A N/A N/A N/A
Azerbaijan 4899 12.8 38.7 6.5
Bahrain 28240 N/A N/A N/A
Bangladesh 497 14.5 48.1 4.3
Belarus 551 N/A N/A N/A
Belgium 43430 24.4 1.8 7.5
Bolivia 1758 N/A N/A N/A
Bosnia and
Herzegovina
4546 N/A N/A 29
Botswana 5965 15.2 29.9 17.6
Brazil 8114 21.4 19.3 9.3
Burkina Faso 517 N/A N/A N/A
Cambodia 677 N/A N/A N/A
Cameroon 1119 N/A N/A N/A
Central African
Republic
458 N/A N/A N/A
Chile 9645 23.4 12.3 7.2
China 3744 N/A N/A 4
Colombia 5056 19.6 18.4 10.9
Congo, Dem. 182 N/A N/A N/A
Costa Rica 6382 22.2 13.2 4.6
Cote d'Ivoire 1137 N/A N/A N/A
Cuba N/A 18 18.7 1.8
Czech Republic 18139 40.2 3.6 5.3
Dominican
Republic
4618 21.9 14.5 15.6
Ecuador 4202 21.8 8.3 7.8
Egypt 2269 22 31.2 9
El Salvador 3605 23 18.9 6.6
Equatorial Guinea 15397 N/A N/A N/A
Ethiopia 345 22.1 8.6 17
Gabon 7502 N/A N/A N/A
Georgia 2447 10.4 53.4 13.3
Ghana 655 N/A N/A N/A
Greenland 30883 N/A N/A 8.4
Guatemala 2623 22.8 33.2 1.8

ENVIRONMENTAL IMPACT AMONG NATIONS WITH LOW DEBT-TO-ASSET RATIOS 32
Table 6 (cont.)
Data for countries used in analysis (economic factors)
Country GDP per capita Percent of
employment in
industry
Percent of
employment in
agriculture
Percent of the
population which
is unemployed
Guyana 1518 N/A N/A N/A
Haiti 667 N/A N/A N/A
Honduras 1960 20.9 39.2 3.1
India 1134 N/A N/A N/A
Indonesia 2349 18.8 41.2 9.1
Iran 4540 32 22.8 10.5
Israel 26175 21.9 1.6 7.3
Italy 35084 30.2 4 6.1
Japan 39727 27.9 4.2 3.9
Jordan 3829 N/A N/A 12.7
Kenya 759 N/A N/A N/A
Korea, South (Rep.
of)
17078 25.9 7.4 3.2
Kuwait 54260 N/A N/A N/A
Laos 882 N/A N/A 1.4
Lesotho 851 N/A N/A N/A
Libya 9714 N/A N/A N/A
Madagascar 461 3.4 82 2.6
Malawi 326 N/A N/A N/A
Malaysia 6975 28.5 14.8 3.2
Maldives 4384 24.3 11.5 14.4
Malta 18209 25.9 1.6 6.5
Marshall Islands 2504 N/A N/A N/A
Mauritius 7337 32.3 9.1 8.5
Mexico 8144 25.9 13.5 3.4
Mongolia 1573 17.9 37.7 3.3
Morocco 2795 20.3 43.3 9.5
Mozambique 428 N/A N/A N/A
Namibia 4338 N/A N/A N/A
Nepal 427 N/A N/A N/A
New Zealand 27045 21.9 7.2 3.6
Nigeria 1092 N/A N/A N/A
Oman 21649 N/A N/A N/A
Pakistan 981 21 43.6 5.1
Panama 7155 19.3 14.7 6.8
Papua New Guinea 1172 N/A N/A N/A
Paraguay 2365 18.1 29.5 5.6
Peru 4345 42.1 9.3 7
Philippines 1745 15.1 36.1 6.3
Poland 11273 30.7 14.7 9.6
Romania 9300 31.4 29.5 6.4

ENVIRONMENTAL IMPACT AMONG NATIONS WITH LOW DEBT-TO-ASSET RATIOS 33
Table 6 (cont.)
Data for countries used in analysis (economic factors)
Country GDP per capita Percent of
employment in
industry
Percent of
employment in
agriculture
Percent of the
population which
is unemployed
Russia 8676 29.2 9 6.1
Saudi Arabia 14540 19.8 4.7 5.6
Senegal 1042 14.8 33.7 11.1
Singapore 36537 22.6 1.1 4
South Africa 5798 26 8.8 23
Sri Lanka 2068 26.6 31.3 6
Swaziland 2478 N/A N/A 28.2
Syria (Syrian Arab
Republic)
2474 N/A N/A N/A
Tajikistan 716 N/A N/A N/A
Tanzania 509 5 74.6 4.3
Thailand 3894 N/A 41.7 1.2
Trinidad and
Tobago
15753 31 4.3 6.5
Tunisia 3792 N/A N/A 14.2
Turkey 8248 25.5 26.4 9.9
Turkmenistan 3904 N/A N/A N/A
Uganda 481 N/A N/A N/A
United Arab
Emirates
58272 39.8 4.9 3.1
Uruguay 10790 21.7 11 9.2
Uzbekistan 1182 N/A N/A N/A
Venezuela 11503 23.3 8.7 7.5
Vietnam 1052 N/A N/A N/A
Yemen 1118 N/A N/A N/A
Zambia 985 N/A N/A N/A

ENVIRONMENTAL IMPACT AMONG NATIONS WITH LOW DEBT-TO-ASSET RATIOS 34
Table 7
Data for countries used in analysis (citizen welfare factors)
Country CO2 Emissions
(metric tons per capita)
Literacy rates Life expectancy at birth
Afghanistan 0 N/A 44
Algeria 4.1 73 72
Angola 1.4 70 47
Argentina 4.6 98 75
Armenia 1.6 98 74
Aruba 23 98 75
Azerbaijan 3.7 100 70
Bahrain 29.6 96 76
Bangladesh 0.3 55 66
Belarus 6.9 100 71
Belgium 9.7 N/A 80
Bolivia 1.4 91 66
Bosnia and
Herzegovina
7.7 98 75
Botswana 2.6 83 54
Brazil 1.9 90 72
Burkina Faso 0.1 29 53
Cambodia 0.3 78 61
Cameroon 0.3 76 51
Central African
Republic
0.1 55 47
Chile 4.3 99 79
China 5 94 73
Colombia 1.4 93 73
Congo, Dem. 0 67 48
Costa Rica 1.8 96 79
Cote d'Ivoire 0.3 55 57
Cuba 2.4 100 79
Czech Republic 12.1 N/A 77
Dominican
Republic
2.1 88 73
Ecuador 2.2 84 75
Egypt 2.3 66 70
El Salvador 31 84 71
Equatorial Guinea 7.5 93 50
Ethiopia 0.1 36 55
Gabon 1.4 87 60
Georgia 1.4 100 72
Ghana 0.4 66 57
Greenland 9.2 N/A 68
Guatemala 0.9 74 70
Guyana 2 N/A 67

ENVIRONMENTAL IMPACT AMONG NATIONS WITH LOW DEBT-TO-ASSET RATIOS 35
Table 7 (cont.)
Data for countries used in analysis (citizen welfare factors)
Country CO2 Emissions
(metric tons per capita)
Literacy rates Life expectancy at birth
Haiti 0.2 N/A 61
Honduras 1.2 84 72
India 1.4 63 64
Indonesia 1.8 92 71
Iran 7 82 71
Israel 9.3 N/A 81
Italy 7.7 99 82
Japan 9.8 N/A 83
Jordan 3.8 92 73
Kenya 0.3 87 54
Korea, South (Rep.
of)
10.4 N/A 80
Kuwait 32.3 94 78
Laos N/A 73 65
Lesotho N/A 90 45
Libya 9.3 88 74
Madagascar 0.1 71 60
Malawi 0.1 73 53
Malaysia 7.3 92 74
Maldives 3 98 72
Malta 6.7 92 80
Marshall Islands 1.7 N/A 99
Mauritius 3.1 88 73
Mexico 4.5 93 75
Mongolia 4 97 67
Morocco 1.5 56 71
Mozambique 0.1 54 48
Namibia 1.5 88 62
Nepal 0.1 58 67
New Zealand 7.7 N/A 80
Nigeria 0.6 60 48
Oman 13.7 87 76
Pakistan 1 54 67
Panama 2.2 94 76
Papua New Guinea 0.5 60 61
Paraguay 0.7 95 72
Peru 1.5 90 73
Philippines 0.8 94 72
Poland 8.3 100 76
Romania 1.7 98 73
Russia 10.8 100 68
Saudi Arabia 16.6 86 73

ENVIRONMENTAL IMPACT AMONG NATIONS WITH LOW DEBT-TO-ASSET RATIOS 36
Table 7 (cont.)
Data for countries used in analysis (citizen welfare factors)
Country CO2 Emissions
(metric tons per capita)
Literacy rates Life expectancy at birth
Senegal 0.5 42 56
Singapore 11.8 95 81
South Africa 9 89 51
Sri Lanka 0.6 91 74
Swaziland 0.9 87 46
Syria (Syrian Arab
Republic)
3.5 84 74
Tajikistan 1.1 100 67
Tanzania 0.1 73 56
Thailand 4.1 94 69
Trinidad and
Tobago
27.9 99 69
Tunisia 2.3 78 74
Turkey 4 89 72
Turkmenistan 9.2 100 65
Uganda 0.1 75 53
United Arab
Emirates
2.3 90 78
Uruguay 1.9 98 76
Uzbekistan 4.3 99 68
Venezuela 6 95 74
Vietnam 1.3 93 74
Yemen 1 61 63
Zambia 0.2 71 45