A Preliminary Biological and Geological Assessment...
113
A PRELIMINARY BIOLOGICAL AND GEOLOGICAL ASSESSMENT OF SUBAQUEOUS TAILINGS DISPOSAL IN BENSON LAKE, BRITISH COLUMBIA MEND Report 2.11.1c-a March 1991
Transcript of A Preliminary Biological and Geological Assessment...
A PRELIMINARY BIOLOGICAL ANDGEOLOGICAL ASSESSMENT OF
SUBAQUEOUS TAILINGS DISPOSALIN BENSON LAKE, BRITISH
COLUMBIA
MEND Report 2.11.1c-a
March 1991
A PRELIMINARY BIOLOGICAL AND
GEOLOGICAL ASSESSMENT OF
SUBAQUEOUS TAILINGS DISPOSAL
IN BENSON LAKE, BRITISH COLUMBIA
Prepared and Funded by:
Ministry of Energy, Mines and Petroleum Resources B.C. Acid Mine Drainage Task Force
and CANMET Environment Canada
Room 105 • 525 Superior Street Hudson Bay Mining and Smelting Co. Ltd. Victoria, British Columbia
VSV 1X4
Prepared by:
Rescan Environmental Services Ltd. Vancouver, British Columbia
March 1991

EXECUTIVE SUMMARY
l\.vailable evidence suggests that the chemical and biological reactivity of mine tailings is
inhibited by storage underwater and thus appears to be a promising alternative to the
less environmentally benign practice of land disposal. While impacts on the biotic
community resulting from subaqueous disposal have been documented, the duration of
these impacts appears to be transitory. To assess the above, we examined the water
quality, geochemical conditions of the sediments and biotic communities in Benson Lake
near Port Alice, British Columbia. Benson Lake had been used as a tailings repository
for approximately eleven years prior to cessation of operations in 1973.
Benson Lake is a small, deep, oligotrophic coastal mountain lake situated in the coastal
western hemlock biogeoclimatic zone on the northern end of Vancouver island. During
the period August 1962 through January 1973, the Benson Lake Coast Copper Mine,
operated by Cominco Ltd. disposed of its mine tailings by depositing them, under
permit, into the deep basin of the lake. As a result, the lake was subject to extended
periods during which lake turbidity levels were elevated beyond levels normally found in
the lake. Furthermore, tailings fines smothered the lake's profundal sediments thereby
eradicating all traces of benthic invertebrate life. Tailings fines were also found in the
Lower Benson River. Finaliy, tailings deposition also resulted in elevated levels of zinc,
relative to background control levels, in the water and in the flesh of fish taken from the
lake.
In 1973, Cominco Ltd. ceased operations and halted their tailings disposal activities. A
subsequent evaluation of the lake, conducted 10 months later, found that colloidal
tailings material in the lake's waters had settled and that Benson Lake's clarity had
returned to pre-mine conditions. Also, the elevated levels of zinc noted in the water
column during active tailings deposition had subsided. However, it was noted that the
profundal zone of the lake was still devoid of invertebrate life.
In September 1990, more than 17 years after cessation of tailings disposal, it was found
that Benson Lake showed little evidence of the fact that it was the recipient of mine
waste.
- i -
EXECUTIVE SUMMARY
T"\1 _ - • - - 1 - - _1 ,_ - • 1 • 'I.. .. • .. • .. • • • • • rnys1ca1 ana cnermca1 water quamy sampnng conauctea at tnree stations m the lake
indicated that lake water was similar in virtuallv all resnects to the waters of a nearhv .,/ --- ---.- --- -- ---- - ------ -- - -------.1
control lake, Keogh Lake. Some differences were noted, however, the differences were
attributable to inherent characteristics of Benson Lake's drainage basin and to the
presence of a fish farm sited in the control lake. Benson Lake ·was characterized by
higher conductivity, total dissolved solids, alkalinity, calcium and potassium than the
control lake, but the levels of each of these parameters reflected their levels in the water
flowing into the lake via the Benson and Raging Rivers and Craft Creek. The fish farm
on Keogh Lake appeared to be eliciting a fertilization effect that resulted in higher
levels of nutrients (phosphorous and nitrogen) and plankton growth in the control lake
compared to Benson Lake.
Lake and surface samples of tailings-rich sediments were collected and examined in
detail. Metal and petrographic analyses of lake samples indicated that tailings are
areally widespread in the lake. A surficial organic layer is accumulating over the tailings
which may be helping to prevent benthic effluxes of metals to the overlying water
column. Sequential extractions of tailings-dominated lake and land tailings samples
revealed that underwater samples did not release any significant quantities of metals
from the watei-soluble or exchangeable cation phases. In contrast, metals were released in the water-soluble phase of the land tailings sample. Most of the metals appeared to
be associated with primarily the unreactive residual phase in both samples. However, a
significant quantity of metals were associated with the oxidizable phase ( organo-metal
complexes, metal sulphides) in the lake tailings sample which was not apparent in the
land tailings sample. These preliminary results suggest that the chemical reactivity of
the underwater tailings is minimal and that their presence is not degrading the
biochemical environment of Benson Lake.
The biota of Benson Lake was examined in considerable detail. It was found that the
benthic invertebrate community in the lake had re-estabiished itself to reflect the
community structure and organism density typical of oligotrophic lakes throughout
Canada and the world. Net phytoplankton densities and community structure were
similar to densities and assemblages found in the control lake and in other coastal
mountain lakes in British Columbia. Zooplankton species compositions in Benson Lake
were also similar to those in the control lake, but their densities were significantly lower
in both lakes than in other oligotrophic coastal lakes.
-n -
EXECUTIVE SUMMARY
Aquatic vegetation was well established in the littoral zone of the lake particularly along
its southern and eastern shorelines. Compared to the control lake, aquatic vegetation in
Benson Lake was found to contain elevated levels of arsenic and copper. Arsenic
accumulated in both the tops and roots of horsetail (Eauisetum so . ) and oond weed .. '~ .1., -i----- ---
(Potamogeton sp. ), while copper only accumulated in the roots of horsetail and in both
the tops and roots of pond weed.
Fish sampling confirmed the presence of rainbow trout in both Benson and Keogh
Lakes, a species of char in Benson Lake, and cutthroat trout in Keogh Lake. Fish from
Benson Lake were significantly larger and had significantly higher condition factors than
fish from the control lake. In addition, the concentrations of metals in the flesh of fish
from Benson Lake were lower than body metal burden in fish from the control lake, but
the concentrations of metais in the iivers were higher. However, the concentrations of
all metals in the fish from both lakes were within the range of concentrations for the
same metals in fish tissues and livers from unpolluted Canadian waters. The stomach
contents of fish from Benson Lake suggested that the fish in the lake were incorporating
the re-established benthic invertebrate community in their diet.
- iii -

SO:Ml\{AIRE
Selon des donnees limitees, la reactivite chimique et biologique des residus miniers serait
inhibee lorsque ces residus sont elimines sous reau. L'elimination subaquatique des residus
pourrait done constituer une alternative prometteuse a I' elimination sur terre, qui est plus
nuisible a l'environnement. Bien que l'on ait documente les repercussions, sur la biocenose,
de !'elimination subaquatique des residus, ces repercussions semblent !tre transitoires. Afin
de les evaluer, on a examine la qualite des eaux, les conditions geochimiques des sediments
et la biocenose du lac Benson pres de Port Alice, en Colombie-Britannique. Le lac Benson a
ete utilise comme bassin de reception de residus pendant environ 11 ans, avant qu'on ait mis
fin aux activites en 1973.
Le lac Benson est un lac oligotrophe, petit et profond, de chaine ootiere qui se situe dans la
zone biogeoclimatique ootiere de la pruche occidentale, dans l 'extreme nord de l 'ile de
Vancouver. Au cours de la periode allant d'aout 1962 a janvier 1973, la Cominco Ltee. a
elimine les residus de sa mine de cuivre (Benson Lake Coast Copper Mine) en les deversant,
sous licence, dans le bassin lacustre profond. Par consequent, pendant certaines periodes
prolongees, la turbidite des eaux du lac a ete plus elevee que la normale. En outre, les
particules fines comprises dans les residus miniers ont couvert les sediments de la zone
profonde du lac, effa~t ainsi toute trace de vie benthique. On a aussi trouve des particules
fines de residus dans la riviere Benson inferieure. Entin, le deversement de residus a fait
augmenter, par rapport aux niveaux de fond, les concentrations de zinc dans les eaux et dans
la chair des poissons du lac.
En 1973, la Cominco Ltee a cesse ses activites et mis fin a }'elimination des residus miniers.
Une evaluation subsequente du lac, menee 10 mois plus tard, a revele que les particules
colloidales des residus dans les eaux du lac s'etaient deposees, et que les eaux avaient
retrouve leur limpidite d'origine. En outre, les fortes concentrations de zinc qui avaient ete notees dans la tranche d'eau durant la periode de deversement des residus, avaient baisse.
Cependant, on a note que les zones profondes du lac etaient encore depourvues d'invertebres.
En septembre 1990, soit plus de 17 ans apres que la societe eO.t arrete d'y deverser les
residus, le lac Benson montrait peu d'indications qu'elle avait servi de bassin de reception de
residus.
L'echantillonnage de la qualite physique et chimique de l'eau, entrepris a trois stations dans
le lac, a revele que les eaux lacustres ressemblent a presque tous les egards aux eaux du lac
Keogh, lac temoin situe a proximite. Or, certaines differences ont ete notees, mais elles sont
attribuees aux caracteristiques inherentes du reseau hydrographique du lac Benson et a la
presence d'une piscifacture dans le lac temoin. La conductivite, les matieres totales dissoutes,
l'alcalinite et la teneur en calcium et en potassium sont toutes plus elevees dans le lac Benson
que dans le lac temoin, mais les niveaux de chacun de ces parametres traduisent les niveaux·
dans les apports d'eaux provenant des rivieres Benson et Raging et du ruisseau Craft. La
piscifacture du lac Keogh semble avoir un effet fertilisant de sorte que la quantite de
substances nutritives (phosphore et azote) et le degre de developpement planctonique sont
plus eleves dans le lac temoin que dans le iac Benson.
Des echantillons de sediments lacustres et terrestres riches en residus ont ete preleves puis
examines en detail. L'analyse des metaux et de la petrographie des echantillons lacustres
indique que les residus sont tres etendus dans le lac. Une couche organique superficielle
s' accumule sur les residus et pourrait aider a empecher le passage benthique de metaux dans
la tranche d'eau sus-jacente. Les prelevements sequentiels d'echantillons lacustres a predominance de residus et d'echantiHons de residus terrestres montre que les echantiiions
subaquatiques ne !iberent pas de qua.11tites significatives de metaux de la phase hydrosoluble
OU de la phase de cations echangeables. Par opposition, il y a liberation de metaux dans la
phase hydrosoluble de l'echantillon de residus terrestres. Dans les deux echantillons, la
plupart des metaux semblent etre associes principalement a la phase residuelle inerte.
Cependant, une quantite significative de metaux est associee a la phase oxydable (complexes
organometalliques, sulfures de metaux) dans l'echantillon de residus lacustres, ce qui n'etait
pas apparent dans l'echantillon de residus terrestres. Ces resuitats provisoires portent a croire
1 ./. . ... h t" t , t" "t.t. h. . . . 1 t ' 0 1 t que .es res1uus su_aqua . .iques on. une reac.1v1.e c .. 1m1que m1n1ma..e e" qu 1 ... s ne provoquen"
pas la degradation de l'environnement biochimique dans le lac Benson.
On a examine en det~il le biote du lac Benson. On s'est rendu compte que la communaute
d'invertebres benthiques du lac s'etait retablie de sorte a refleter la structure des
communautes et la densite d'organismes typiques des lacs oligotrophes partout au Canada et a travers le monde. Les densites nettes de phytoplancton et la structure des communautes
ressemblent a d'autres densites et assemblages qui se trouvent dans le lac temoin et dans
d'autres lacs de chaine ootiere en Colombie-Britannique. En outre, la composition des
especes de zooplancton du lac Benson ressemble a celle du lac temoin, mais les densites sont
beaucoup moins elevees dans ces deux lacs que dans d'autres lacs oligotrophes ootiers.
La vegetation aquatique est bien etablie dans la zone littorale du lac, notamment le long des
rivages sud et est. La vegetation du lac Benson contient des quantites elevees d'arsenic et de
cuivre, comparativement a la vegetation du lac temoin. L'arsenic s'accumule dans les
racines, ies tiges et ies feuiiies du preie (Equisetum sp.) et du potamot (Potamogeton sp.) et
le cuivre, dans les racines du prele et dans les racines, les tiges et les feuilles du potamot.
L'echantillonnage de poissons a confirme la presence de truite arc-en-ciel dans les lac Benson
et Keogh, d'une espece d'omble dans le lac Benson, et de truite fardee dans le lac Keogh.
Les poissons du lac Benson sont beaucoup plus grands et ont un coefficient de condition
beaucoup plus eleve que les poissons du lac temoin. En outre, les concentrations de metaux
dans ia chair des poissons du iac Benson sont inferieures a ia charge corporeUe de metaux
des poissons du lac temoin, bien que les concentrations de metaux dans le foie soient plus
elevees. Toutefois, les concentrations de tous les metaux dans les poissons des deux lacs se
trouvent dans la gamme de concentrations des memes metaux dans les tissus et foies de
poissons provenant d'eaux canadiennes non polluees. Le contenu des estomacs de poissons du
lac Benson porte a croire que la communautes retablie d'invertebres benthiques fait partie du
regime alimentaire des poissons du lac.

ACKNOWLEDGEMENTS
We \Vould like to gratefully ack...11owledge the finacial assistance of the British Columbia Ministry of Energy, Mines and Petroleum Resources, Hudson Bay Mining and Smelting
Co., Ltd., Environment Canada and CANMET. We would also like to extend our
appreciation to Ian Home of BHP-Utah's Island Copper Mine, for generously providing
a work boat and various field supplies.
A number of peopie have made substantiai contributions to the compietion of this
project. Mr. Clem Pelletier of Rescan Environmental Services Ltd. (Rescan) provided
overall project coordination and senior review of the report. David Flather and John
Werring (Rescan) conducted all field work and analytical review and reporting ..
Gratitude is also extended to Ping Lee for his drafting efforts.
- iv-

TABLE OF CONTENTS
EXECUTIVE SUMMARY .............................................................................................................. .i
ACKNOWLEDGEMENTS .......................................................................................................... .iv
TABLE OF CONTENTS ............................................................................................................... v
LIST OF TABLES ......................................................................................................................... vii
LIST OF FIGURES ....................................................................................................................... ix
1.0 INTRODUCTION ........................................................................................................... 1-1
2.0 METHODS ..................................................................................................................... 2-1
2.1 Study Area ......................................................................................................... 2-1
2.2 Sampling. Stations ............................................................................................. 2-1
2.3 Study Methods .................................................................................................. 2-1
2.3.1 Lake Morphometry and Hydrology ................................................ 2-1
2.3.2 Water Quality ..................................................................................... 2-6
2.3.3 Sediment ............................................................................................. 2-7
2.3.4 Phytoplankton .................................................................................... 2~9
2.3.5 Zooplankton ....................................................................................... 2~9
2.3.6 Benthic Invertebrates ...................................................................... 2-10
2.3.7 Aquatic Vegetation ......................................................................... 2-11
2.3.8 Fish .................................................................................................... 2-11
3.0 RES UL TS AND DISCUSSION .................................................................................... 3~ 1
3.1 Lake Morphometry and Hydrology ............................................................... 3-1
3.1. l Morphometry of Benson and Keogh Lake .................................... 3-1
3.1.2 Benson Lake Hydrology ................................................................... 3-4
3.2 Water Quality .................................................................................................... 3-4
3.3 Sediment and Tailings ................................................................................... 3-13
3.3.1 Particle Size Analysis ...................................................................... 3-13
-v-

TABLE OF CONTENTS
3.3.2 Petrographic Analysis ..................................................................... 3-14
3.3.3 Sediment Metal Analysis ................................................................ 3-17
3.4 Biota ................................................................................................................. 3-25
3.4.1 Benthic Invertebrates ...................................................................... 3-25
3.4.2 Phytoplankton .................................................................................. 3-31
3.4.3 Zooplankton ..................................................................................... 3-35
3.4.4 Aquatic Vegetation ......................................................................... 3-38
3.4.5 Fish .................................................................................................... 3-45
4.0 CONCLUSIONS ............................................................................................................ 4-1
REFERENCES .......................................................................................................................... R-1
APPENDICES
APPENDIX A Hydrologic Data ........................................................................................... A-1
APPENDIX 8 Water Quality Data ................................................ : ..................................... 8-1
APPENDIX C Particle Size Analysis ................................................................................... C-1
APPENDIX D Detailed Petrographic Analysis ................................................................. 0-1
- vi·

TABLE OF CONTENTS
LIST OF TABLES
Table
2-1 Extractants and Associated Phases in Sequential Extraction of Sediments ................................................................................................................ 2-10
3-1 Physical and Chemical Water Quality Parameters for Benson Lake and Keogh Lake ..................................................................................................... 3-10
3-2 Water Quality Analysis for Benson and Raging Rivers and Craft Creek ..... 3-ii
3-3 Field Observations of Sediments Collected from the Profundal Zone of Benson and Keogh Lake for Benthic Invertebrate, Metals, and Particle Size Analyses .......................................................................................................... 3-14
3-4 Total Carbon, Nitrogen and Sulphur in Surface Sediments from Benson Lake ........................................................................................................... 3-15
3-5 Particle Size Distribution for Benson and Keogh Lake Sediments ............... 3-15
3-6 X-Ray Fluorescence (XRF) Analysis of Top 15 cm Layer of Sediments from Benson Lake .................................................................................................. 3-18
'2 "7 AA~+nl A-nl .. r-r ~+' C'~~~---+ C',.m-l~r +'-~- D--r-- T -1-- "> 11'\ .r I 1V1ClC11 .M.!IC11J:!C:l Ul ..JCUHHCHl ..Ji:l.U pie;:, u UH! DCU:!Ull L(;l.J\.C ••••••••••••••••••••••••••••••• .)- Cf
3-8 Sequential Extraction of BL2 Tailings from Benson Lake ............................. 3-21
3-9 Sequential Extraction of Land Tailings near Benson Lake ............................ 3-22
3-10 Densities and Species Compositions of Benthic Invertebrate r'nmm11n1t1,.., 1n R,.n.,nn <>n'1 Tl'i:>nnh T .. tr,.., 1n ~ontom'ho .. 100(\ 'l_')t;: ......... V".l..l..L.1..1..1.U.& .l.'-.1.Vi.:J ........... A.J'""'.1..1.i.:JV.1..1. '4.1..A.U .&~ ..... vo.1..1. ~""" ..... .., ......... V""'t'" ............ u ..... .1., ..l...J.JV •••••••••••••••••••• ...,-~v
3-11 Average Numerical Density of Benthic Macroinvertebrates in the Profundal Zone of Several Lakes of Varying Productivity ............................. 3-29
3-12 Phytoplankton Taxa found in Benson and Keogh Lakes ................................ 3-32
3-13 Densities of the Phytopla!l_kton in the Water Colurrm at Three Sites in Benson Lake, September 1990 .............................................................. 3-33
3-14 Densities of Phytoplankton in the Water Column at Two Sites in Keogh Lake ............................................................................................................. 3-34
-vii -

TABLE OF CONTENTS
3-15 Benson Lake - Densities of Zooplankton Captured in Vertical and J..:rnri•u,nt"ll 'Tnu1c:: ~-~h .1..1.V.1..l.L..V.lJ.t,.'4.1. .&. VYl'o;;J••••••••••••••••••••••••••••••••••••••••••••••••••••••••••••••••••••••••••••••••••••••••••••••••••••• V JU
3-16 Keogh Lake - Densities of Zooplankton Captured in Vertical and Horizontal Tows ..................................................................................................... 3-37
3-17 Typical Fall Densities of Some Crustacean Zooplankton in a Coastal Lake in British Columbia ....................................................................... 3-38
3-18 Concentrations of Specific Metals in Benson and Three Isle Lake Aquatic Vegetation ............................................................................................... 3-41
3-19 Mean Metal Concentrations in Tops and roots of Equisetum sp. from Benson Lake and Three Isle Lake ............................................................. 3-42
3-20 Metal Levels in Sediments A..ssociated with Aquatic Vegetation Samples .................................................................................................................... 3-43
3-21 Mean Metal Concentrations in Potamogeton sp. Tops in Benson Lake, Mandy and Anderson Lakes, Manitoba ............................................................. 3-44
3-22 Condition Factors and Stomach Contents of Fish from Benson and Keogh Lakes ........................................................................................................... 3-46
3-23 1v1etal Body Burden in Fish Tissue and Livers fiom Benson and Keogh Lakes ........................................................................................................................ 3-47
- Viii -

TABLE OF CONTENTS
UST OF FIGURES
Figure
1-1 Project Location Map .............................................................................................. 1-2
2-1 Benson Lake Project Location and Hydrology Sites .......................................... 2-2
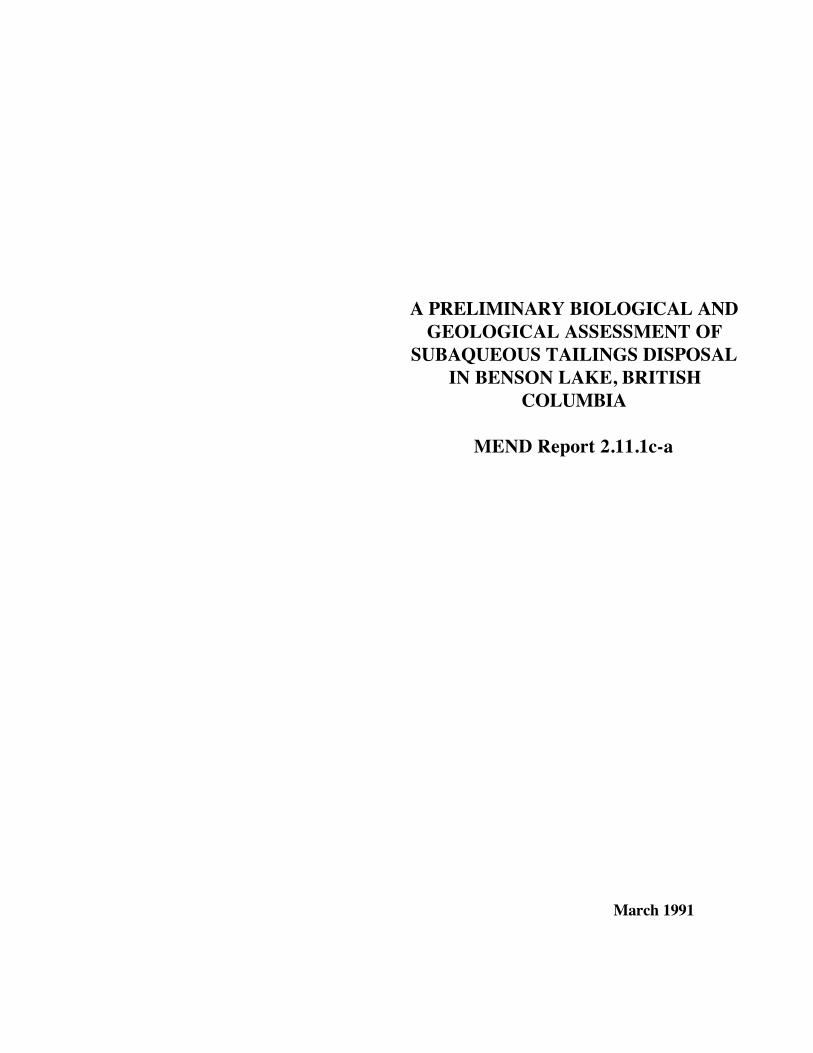
2-2 Benson Lake Sampling Stations ............................................................................ 2-3
2-3 Keogh Lake Sampling Stations ............................................................................... 2-4
2-4 Benson Lake Vegetation Sampling Locations .................................................. 2-12
3-1 Benson Lake Bathymetric Mapping ..................................................................... 3-2 .
3-2 Keogh Lake Bathyrnetric Mapping .............................................. ; ........................ 3-3
3-3 Turbidity, Conductivity, pH, Dissolved O:z, and Temperature Profiles for Benson Lake, Station 1 ..................................................................................... 3-5
3-4 Turbidity, Conductivity, pH, Dissolved 0 2, and Temperature Profiles r T'"'l Y t ro. . . • _ ..-.. .., / ror Jjenson LaKe, ;:)£anon L. ••••••••••••••••••••••••••••••••••••••••••••••••••••••••••••••••••••••••••••••••••••• .)-o
3-5 Turbidity, Conductivity, pH, Dissolved 0 2, and Temperature Profiies for Benson Lake, Station 3 ..................................................................................... 3-7
3-6 Turbidity, Conductivity, pH, Dissolved 0 2, and Temperature Profiles for Keogh Lake, Station 1 ....................................................................................... 3-8
3-7 Metals Released in Water Soluble Phase from Land and Submerged Lake Tailings .......................................................................................................... 3-23
3-8 Metals Released in Oxidizable Phase from Land and Submerged T "'lro T..,111nlT<" ~-.,~ ~1"¥ .I. "'J..11.l.lf)ii:J ........................................................................................................... v ~..,.,
3-9 •- _ ... _,1 ___ .._ _ _...__! ___ .._.- ___ _!__ ..,..,n Aquauc v egerauun iv1app1ng ............................................................................... J-J"':I
- ix -
1 - lntioduction
(i(escan)

1.0 INTRODUCTION
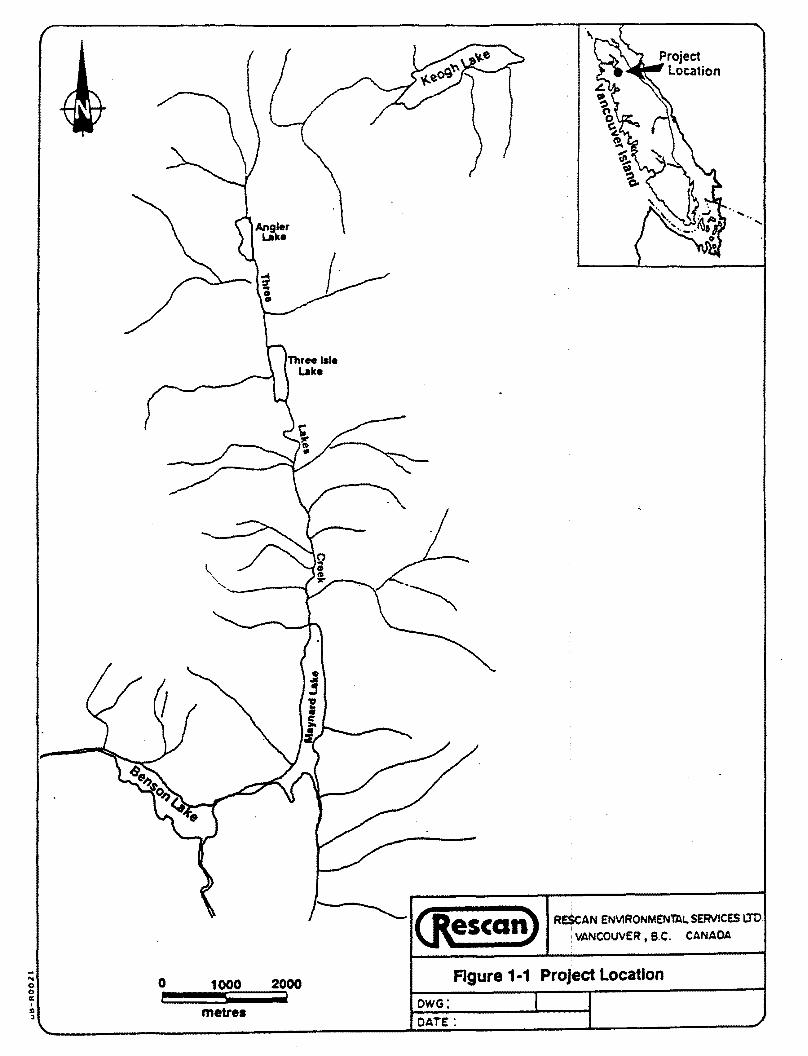
The Benson Lake watershed is located on northern Vancouver Island, about 15 km east
of the town of Port Alice and is part of the Marble River drainage (Figure 1-1) . The
drainage is primarily surrounded by a coastal western hemlock biogeoclimatic zone.
MacMillan Bloedel Limited cur~ently logs the Benson River and Raging River drainages
out of their Port McNeil division. Access to the area is therefo~e excellent along active
logging roads.
The area is characterized by iimestone karst formations, and has historically been the
location of a number of mining operations. The Be:nson T .J1ke Coast Copper Mine,
owned by Cominco Ltd., commenced operations in August 1962 and operated until
January 1973. Over the operating period, a total of 3.6 million tons of ore were mined.
The underground operation and adjoining concentrator processed 750 to 850 tpd, and
discharged the tailings, under permit, into Benson Lake.
Throughout the period of operation of the mine, the lake consistently exhibited
increased levels of turbidity caused by the finer colloidal fractions of the tailings
remaining in suspension despite the addition of flocculents to enhance particle settling
(Hallam et al. 1974). Moreover, tailings fines were also found in the Lower Benson
River below the lake's outlet. As a direct result of tailings deposition, prof.indal benthic
organisms in Benson Lake were eliminated by the smothering effect of the tailings
(Kussat et al. 1972). Because of the lack of aquatic benthic invertebrate production in
the lake, resident fish were found to be feeding on insects commonly found in the
benthic drift (aquatic and terrestrial invertebrates) entering the lake from inlet streams
and on adult terrestrial insects deposited on the lake's surface (Kussat et al. 1972).
Finally, elevated concentrations of zinc (relative to background concentrations) were
observed in both Benson Lake water and in the flesh of fish from Benson Lake.
However, the metal concentrations in fish were found to be simJlar to those found in fish
from nearby Maynard Lake. Maynard Lake flows into Benson Lake via the Raging
River which is dammed for hydroelectric power (Figure 1-1). A study carried out in
Benson Lake 10 months after Cominco's operations had ceased, showed an
improvement in lake water clarity, although metal concentrations in the water and fish
tissue had not changed (Hallam et al. 1974). Hallam et al. concluded that improvements
1 - 1
.. 0 0 a: ' = ~
0
Three Isle Like
\ "------i
1000 2000
metres
------...._ (jlescat9 REfAN ENlllRONM£N111L SEfMCES IJ'O 'VANCOUVER, B.C. CANADA
Figure 1·1 Project Location
owG: OATE:

2- Methods
(itescan)
INTRODUCTION
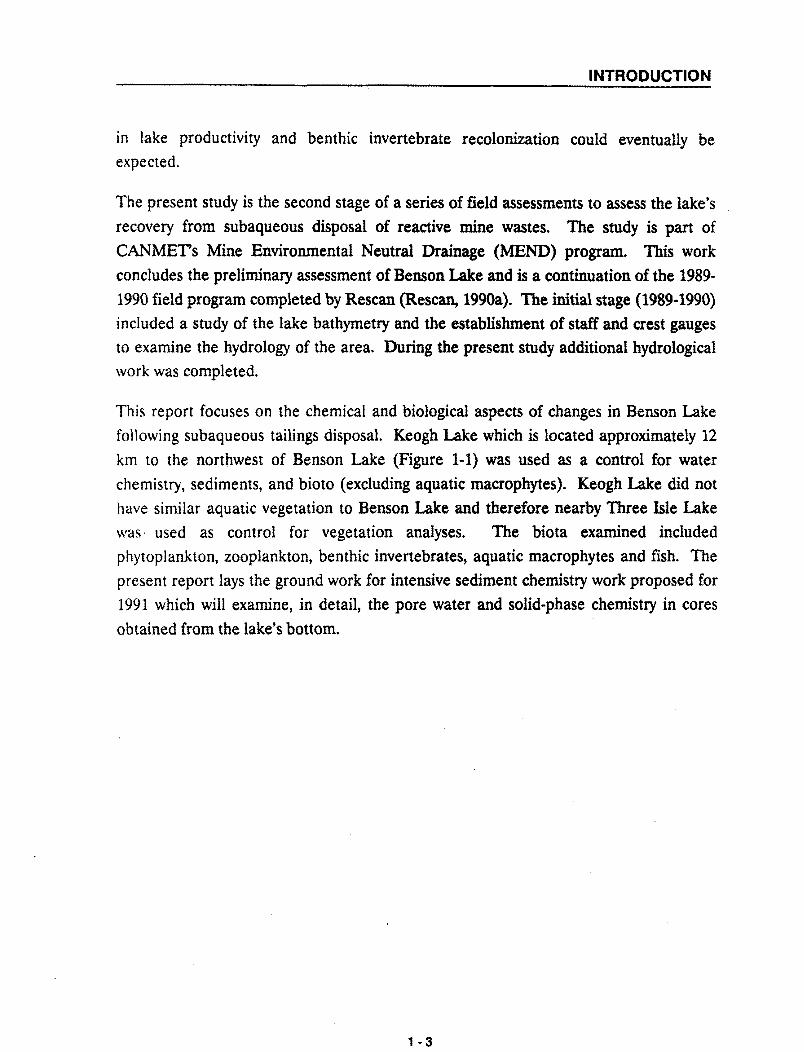
in lake productivity and benthic invertebrate recolonization could eventually be
expected.
The present study is the second stage of a series of field assessments to assess the lake's
recovery from subaqueous disposal of reactive mine wastes. The study is part of
CANMET's Mine Environmental Neutral Drainage {MEND) program. This work
concludes the preliminary assessment of Benson Lake and is a continuation of the 1989·
1990 field program completed by Rescan (Rescan, 1990a). The initial stage (1989-1990)
included a study of the lake bathymetry and the establishment of staff and crest gauges
to examine the hydrology of the area. During the present study additional hydrological
work was completed.
This report focuses on the chemical and biological aspects of changes in Benson Lake
following subaqueous tailings disposal. Keogh Lake which is located approximately 12
km to the northwest of Benson Lake (Figure 1-1) was used as a control for water
chemistry, sediments, and bioto (excluding aquatic macrophytes). Keogh Lake did not
have similar aquatic vegetation to Benson Lake and therefore nearby Three Isle Lake
was· used as control for vegetation analyses. The biota examined included
phytoplankton, zooplankton, benthic invertebrates, aquatic macrophytes and fish. The
present report lays the ground work for intensive sediment chemistry work proposed for
1991 which will examine, in detail, the pore water and solid·phase chemistry in cores
obtained from the lake's bottom.
1 -3

2.0 METHODS
2.1 Study Area
The study area is located in northern Vancouver Island (Figure 2-1) near the towns of
Port Alice, to the west and Port. Hardy to the northeast. Benson Lake received tailings
from August 1962 through January 1973. Tailings were discharged onto the surface of
the lake not at depth.
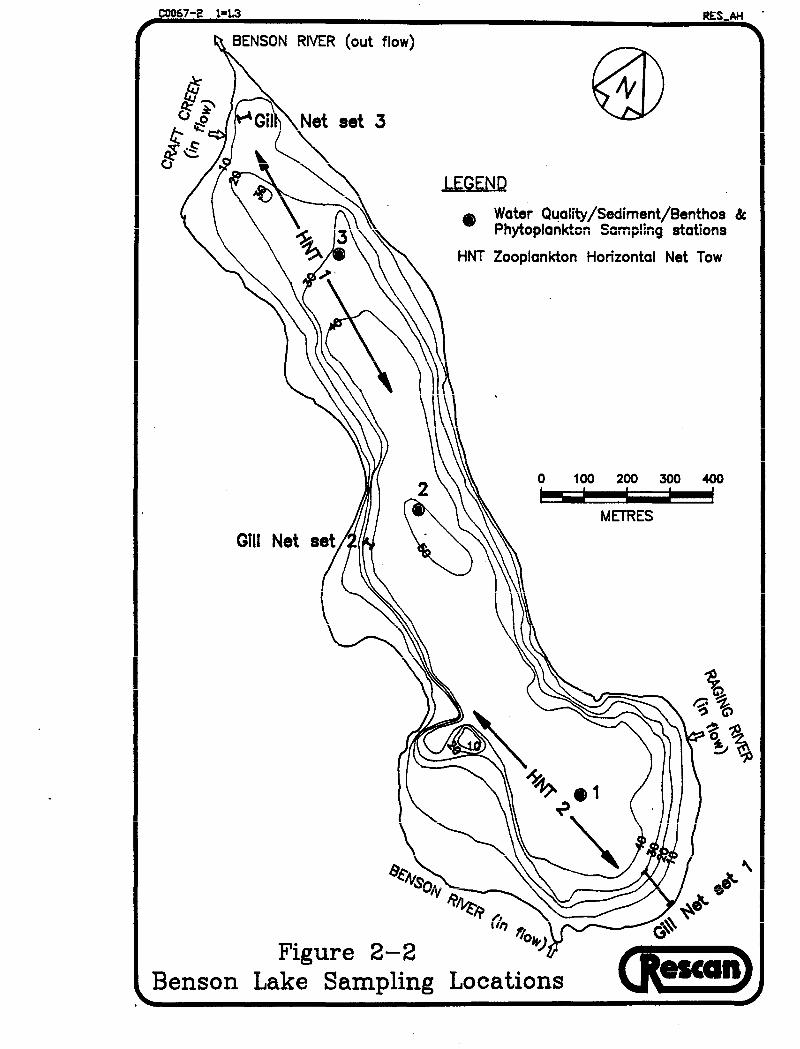
2.2 Sampilng Stations
Three (3) primary sampling stations were established on Benson Lake along a east-west ·
axis (Figure 2-2). ·water, sediment, benthos, zooplankton and phytopiankton were
collected at each station. Dissolved oxygen, pH, and temperature profiles and Secchi
disk transparency were measured at each station. Seine netting was attempted at several
locations in Benson Lake but proved unsuccessful. Three (3) gill net sites were
therefore employed over the lake.
Water samples were collected at three inflow streams (Benson River, Raging River and rr'Aft rrppJr\ 'Ann t\TIP (1 \ t\lltflnUJ 4:-frP~m fl...oUJPr °RPn4:.nn l);upr\ -•-.a.•_ ... __ ,.,,-•.&-...., ...... _, ... , ""W'°'.LAU'IJ'I" r.Jl'°'.A.""W.&.1.& \ .... .__. .. &l"".l.&..:JU'.&.I. .&'-.1.Y'-"'J.}•
One ( 1) sampiing station was estabiished on Keogh Lake and sampled for water,
sediments, zooplan_kton and phytoplankton (Figure 2-3). As with Benson Lake, a
dissolved oxygen, pH and temperature profile and Secchi disk transparency were
measured at the station. One gill net site was established on Keogh Lake.
2.3 Study Methods
2.3.l Lake Morphometry and Hydrology
A bathymetric map of Benson Lake was constructed from timed depth profiles taken at
a slow speed along predefined transects using a Lowrance X16 Computer Sonar
2-1

"' N 0 0 a: I
CD Q
I
I I
. .. I
.·· /
.·
BENSON LAKE PROJECT LOCATION
8 HYDROLOGY SITES
I \.
LEGEND
Stoff 8 Crest Gouge Sires
.A
~
Stream
• 0
November 1989
Morch 1~90
Profile a Discharge Sire
November 1989
March 1990
BENSON LAKE OWG: PWD
Figure 2·1
' ' \ ' I I I
' I
{ ((8 ' I I
, I
' ... I
' ' ' ' \ \ \
\ \
, I
I
, I
I , I
.,I ; ,
LOCATION
...
o•'--"P-~..._~~~~~---1
I I I
' , I
..J
"' a c:
,/)
:' : \
I
I
(Jlescan)
C0067-2 1=1.3 RES_AH •
LEGEND
HNT Zooplankton Horizontal Net Tow
I I 0 100 200 300 400
METRES
I
I Figure 2-2
Benson Lake Sampling Locations

I
I
I
I
C0076-3 1-1.4 RES AH .
LEGEND
• Water Quality /Sediment/Benthos c!c - Phytoplankton Sampling stations
HNT Zooplank-ton Horizontal Net iow
Figure 2-3 Keogh Lake Sampling Stations (Jlescan)
I
I
I
METHODS
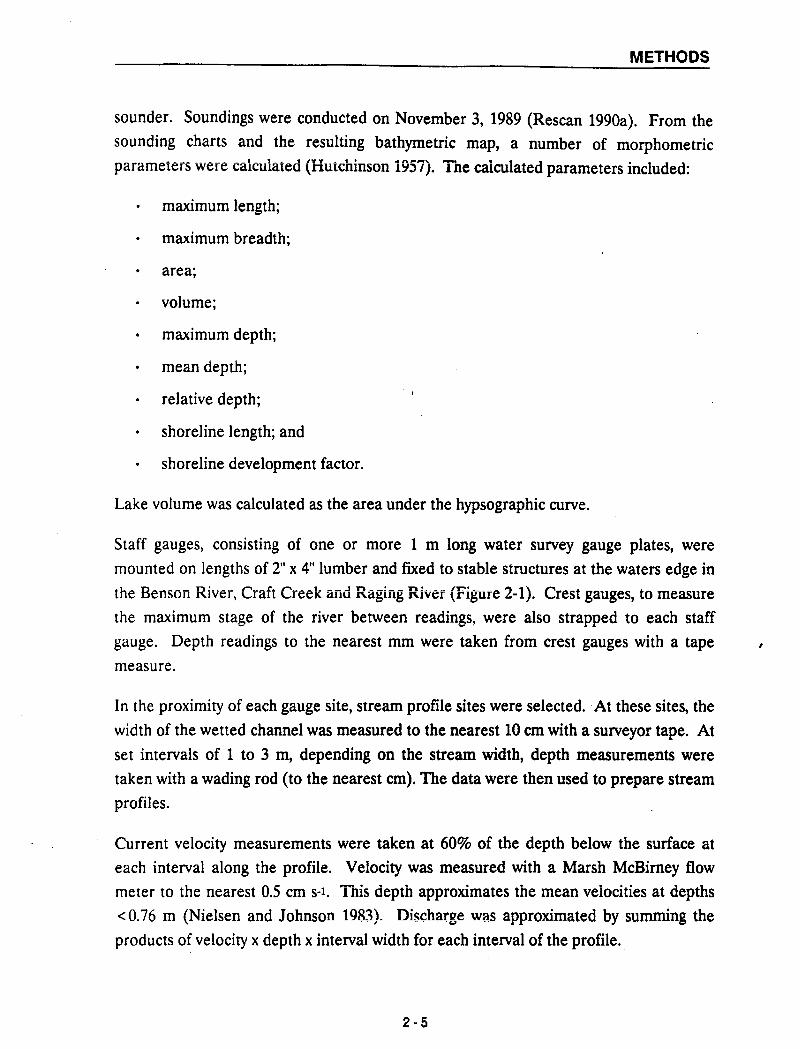
sounder. Soundings were conducted on November 3, 1989 (Rescan 1990a). From the
sounding charts and the resulting bathymetric map, a number of morphometric
parameters were calculated (Hutchinson i95i). Tne caicuiated parameters included:
maximum length;
maximum breadth;
area;
volume;
maximum depth;
mean depth;
reiative depth;
shoreiine iength; and
shoreline deveiopment factor.
Lake volume was calculated as the area under the hypsographic curve.
Staff gauges, consisting of one or more 1 m long water survey gauge plates, were
mounted on lengths of 2" x 4" lumber and fixed to stable structures at the waters edge in
the Benson River, Craft Creek and Raging River (Figure 2-1). Crest gauges, to measure
the maximum stage of the river between readings, were also strapped to each staff
gauge. Depth readings to the nearest mm were taken from crest gauges with a tape
measure.
In the proximity of each gauge site, stream profile sites were selected. At these sites, the
width of the wetted channel was measured to the nearest 10 cm with a surveyor tape. At
set intervals of 1 to 3 m, depending on the stream width, depth measurements were
taken with a wading rod (to the nearest cm). The data were then used to prepare stream
profiles.
Current velocity measurements were taken at 60% of the depth below the surface at
each interval along the profile. Velocity was measured with a Marsh McBirney flow
meter to the nearest 0.5 cm s-1. Tnis depth approximates the mean veiocities at depths <0.76 m (Nielsen and Johnson 1983). Dischar!le was annroximated hv summing the - ' - -- ------ - --------- -- --,- ---------g- -- -re----------- -.1 ---------o ----
products of velocity x depth x interval width for each interval of the profile.
2-5
,

METHODS
2.3.2 Water Quality
Lake water samples were collected on September 13 and 17, 1990 at three Benson Lake
sites and at Keogh Lake using a teflon-lined 5 L Go·Flo (General Oceanics) water
sampler (Figures 2-2 and 2-3). Water samples from lake sampling sites were taken at 4
depths in the water column (0.5 m below the surface, S to 11 m (variable depending on
temperature stratification data), 20 m and 0.5 m off the lake bottom). One litre and 250
ml polyethylene bottles and caps were rinsed with sample water prior to filling. To
minimize air contact, bottles for lake samples were carefully filled to the top using a
teflon tube attached to the water sampler and inserted into the sample bottle. No
preservatives were added to the 1 L bottles which were maintained at 4°C during
shipping and handling. The 250 ml bottles collected for metals analyses were field
filtered using a 0.45 µm filter and preserved with 1:1 nitric acid. Grab water samples
were collected from inflow and outflow stream sites at Benson Lake by submerging
rinsed sample bottles directly into the water flow. Preservation was as for the lake
samples.
Water samples were analyzed by Analytical Services Laboratories (ASL) of Vancouver,
B.C. Samples were analyzed for physical parameters including pH, specific conductivity,
turbidity (NTU), total dissolved solids and total suspended solids (volatile and fixed), as
well as anions and nutrients including alkalinity, sulphate, chloride, reactive silica, total
phosphorus, nitrate/nitrite, ammonia, total dissolved nitrogen and total organic carbon
using standard methods (APHA 1985).
Dissolved metals were analyzed by various atomic absorption and emission spectroscopy
methods as follows:
Inductively coupled argon plasma (ICP) emission spectroscopy for higher
concentration elements
Graphite furnace atomic absorption spectroscopy for low concentration elements
Hydride generation atomic absorption spectroscopy for arsenic
Cold vapour atomic absorption spectroscopy for mercury
2-6

METHODS
2.3.3 Sediment
Sediments were collected at three stations in Be:nson T ~ke and one station in. Keogh
Lake on September 14, 1990 using a stainless steel Ponar grab sampler (Figures 2-2 and
2-3). The top 2 - 3 cm of sediments were collected and placed in plastic sample cups.
Samples of un-oxidized tailings were obtained from the bottom few centimetres of the
Ponar grab sample (at depth of 15 cm) taken at Site BU in Benson Lake and from
surface samples of tailings disposed on land near the mine site. Sediment and tailing
samples were split into four portions. One portion was sent to Dr. Jeff Harris, Harris
Exploration Services Ltd., North Vancouver, B.C. for petrographic analysis using
polished thin sections for mineral identification and X-ray diffraction (XRD) analysis.
Oceanography, Vancouver, B.C. where the samples were freeze-dried and ground to -
200 mesh in a tungsten carbide mill for total carbon, nitrogen and sulphur (CNS) and X
ray fluorescence (XRF) analyses. A third portion was sent to Golder Associates Ltd. of
Vancouver, B.C. for particle size analysis using a hygrometer method in accordance with
ASTM designation 0422-72 "Standard Metho~s for Particle-Size Analysis of_Soils". The
fourth portion was sent to Elemental Research Inc. (Elemental) of North Vancouver,
B.C. for metals analyses. Also, a multiple extraction leach test was conducted on the
lake tailings samole and land tailings samole <BU Tails and Land Tails). - ... '""" .&. ' ,
Samples for petrographic analysis were· dried, disaggregated by brief pulverization,
dispersed in epoxy on glass slides and prepared as polished thin sections for microscopic
study. No slide could be made for the Keogh Lake sample as some property of the
sample prevented hardening of the mounting medium. X-ray diffractometer (XRD)
scans (Cu Ka radiation) were carried out on unmounted portions of the samples.
Major and minor element concentrations were respectively measured on cast glass and
pressed powder discs, using an automated Philips PW 1400 X-ray fluorescence
spectrometer equipped with a Rh target anode. Glass discs were prepared using a slight
modification of the method of Norrish and Hutton (1969), which eliminated the need to
appiy specific corrections for matrix absorption effects. Major eiements for the Keogh
Lake sample could not be deterrriJned by XRF as sirriJlar matrix problems occur in trying to form the glass disc as were experienced in the petrographics thin sections.
2·7

METHODS
Calibration for both sets of measurements was provided by a wide range of international
geochemical reference standards, with discs prepared in the appropriate way, and using
the element concentrations recommended by Abbey (1980). Additional metal-rich
standards were prepared for the minor element measurements on the tailings-bearing
samples, to ensure that a calibration curve could be used which was linear up to and
beyond the maximum Zn, Cu or Pb concentration encountered.
Total carbon, nitrogen and sulphur were determined using elemental analysis. Total C
and N were measured using a Carlo-Erba 1106 Elemental Analyzer which combusts the
sample in a stream of 0 2, separates the combustion gases (C02 and N2 reduced from
NOx) chromatographically, and measures the gas concentrations (thus C and N
contents) by thermal conductivity. Sulphur was determined u~ing a Carlo-Erba NA-1500
CNS Analyzer, which employs the same methodology. The analyzers are calibrated
using acetanilide and the NRC marine sediment standards MESS-1 and BCSS-1.
Accuracy is excellent; agreement with the recommended values for total C and N was
always within analytical precision. The precision of the measurements (la, R.S.D.) was
about 1.5%, 3% and 3% for C, N and S respectively.
Carbonate carbon was determined on all samples by coulometry using a coulometrics
analyzer, which electrochemically measures the C02 evolved following addition of HCI
to a sample. Concentrations were very low in the natural sediments (typically <0.1 wt.
%), but ranged up to 0.8 wt. % in the tailings. Precision of the measurements (la,
R.S.D.) was better than 3% for the higher carbonate carbon concentrations. Organic
carbon was determined by subtracting carbonate carbon from the total C measurements.
Precision of the resulting organic C value was about ±5 % (la, R.S.D.).
Sediments were homogenized by shaking. A percent solids determination was made on
a 1.0 g portion of the sample at 103°C for 24 hours. For metals analysis 1.0 g of sample
was weighed into a 250 ml Phillips beaker to which 4 ml (1:1) HN03, 10 ml (1:4) HN03
and two drops of concentrated HCl was added. The beaker was covered with a watch
glass and refluxed for 30 minutes at 95°C. The sample was cooled and diluted to 100 ml with deionized distilled water. Analysis was by ICP-MS as per EPA protocol 200.8. To
determine sulphate concentration, 5.0 g of solid was weighed into a 250 ml beaker, to
this 5.0 g of Na2C03 was added and 100 ml of DIH20 with a boiling chip. The sample
was boiled for 20 minutes. The sample was then cooled and filtered and analyzed as per
2-8

METHODS
"Standard Methods", 16th edition (section 426c). Total organic carbon was determined by dichromate reflux.
A multiple extraction leach test was performed on material from lake (Bl2) and land
tailings to assess the leachability of metals from tailings exposed to a range of
environmental conditions. The test used was similar to those utilized in other aquatic
studies (Forstner and Wittman 1983, Engler, Brannon and Rose 1974, Rescan 1990c and
Rescan 1990d). In a multiple extraction, the mildest extraction is completed first, solids are recovered by filtration and washed, and subsequent extractions, are conducted until
the sample has been subjected to an entire predetermined series of extractants. Table 2-1 lists the extractants used, and identifies each in terms of their anticipated reaction with
metals in the solids.
2.3.4 Phytoplankton
Phytoplankton samples were collected at the three stations on Benson Lake and on one
station in Keogh Lake on September 13 and 17, 1990, respectively (Figures 2-2 and 2-3).
Two bottle casts were taken at 0.5 m and 5-11 m (variable) depths. Five hundred ml
samples were collected for phytoplankton identification and preserved with Lugol's
solution. Additional samples were collected for chlorophyll a analysis. Chlorophyll
samples were filtered through a 45 µm filter and preserved with a saturated MgC03
solution. Filters were wrapped in aluminum foil and frozen. Analysis for chlorophyll a was completed using an approved spectrophotometric method (APHA 1985).
Qualitative and quantitative phytoplankton analysis was carried out to the lowest
possible taxonomic level by Aquametrix Research Ltd., Sydney, B.C. Samples were
counted using Utermohl chambers. Organisms in 10 fields of each sample were
identified and counted at 350 x magnification. Data are expressed as number of cells
ml-I.
2.3.5 Zooplankton
Vertical net hauls for zooplankton collection were taken at three Benson Lake sites and
one site in Keogh Lake on September 14 and 17, 1990 respectively using a 13 cm
diameter Wisconsin 80 µm mesh plankton net. Hauls were brought up from just off the
bottom to the surface at a rate of 0.5 to 1 m s-1. Three horizontal net tows were also
2-9

METHODS
Tabie 2-1
Extiactants and Associated Phases In Sequentiai Ell1raetion oi Sediments
Extraction Phase
Water Soluble Phase
Exchangeable Cations
Weak Acid Soluble Phase
Easily Reducible Phase
Moderately Reducible Phase
Difficultly Reducible Phase
Oxidizable Phase
Total Extractable
Extractant
DistUled water extractant;
1 molar ammonium acetate at pH 7;
1 molar sodium acetate at pH 5;
0.1 molar hydroxylamlne hydrochloride + 0.01 moiar nitric acid at pH 2;
0.2 molar ammonium ox.alate + 0.2 molar oxalic acid at pH 3;
0.5 molar sodium citrate + 0.1 molar sodium dithionite;
30% hydrogen peroxide + 1 molar ammonium acetate acidified to pH 2.5 with nitric acid;
Nitric/perchloric/hydrofluoric acid digestion.
conducted, two on Benson Lake and one on Keogh Lake on September 14 and 17, 1990
respectively. Horizontal tows were approximately 500 m long at a depth of 1 m and
towed at l::: 0.75 m s-1. Zooplankton samples were preserved in 10% buffered formalin.
Qualitative and quantitative zooplankton analyses were performed by Sy-Tech Research
Ltd., Sidney B.C. Zooplankton were keyed to lowest practical taxonomic level using
keys of Pennak (1978), Torke (1974), Torke (1976) and Ward and Whippie (1963).
2.3.6 Benthic Invertebrates
Benthic invertebrate (benthos) samples were collected using a Ponar grab sampler at
the three Benson Lake sites and the Keogh Lake site (Figures 2-2 and 2-3). Three sub
samples were taken within the grab sampler using a 8 cm diameter cylinder at each site.
Samples were then washed through a sieve bucket with a screen mesh size of 253 µm.
2 - iO

METHODS
The retained material was preserved in a 10% buffered formalin solution. Benthos were
counted and identified to the lowest practical taxonomic group.
Surber samples were collected on September 14, 1990 from Benson and Raging rivers
using a 1 square foot Wildco Surber Sampler with 1 mm mesh net. Samples were taken
identified to species.
Fish stomachs were collected from Benson and Keogh Lakes on September 14 and 17,
1990 respectively. Samples were preserved in 10% buffered formalin and the contents
of each stomach counted and identified to the lowest practical taxonomic level.
2.3. 7 Aquatic Vegetation
The aquatic macrophytes of Benson Lake were surveyed and mapped. Sampies of
macrophytes and associated sediments were collected from Benson Lake (Figure 2-4)
and Three Isle Lake on September 15, 1990. In addition, the sediments in which the
plants were rooted were collected using a hand trowel or shovel. Sampled plants were
separated into tops and root material and placed in individual plastic zip-loc or whirlpak
bags (after a thorough rinsing in site water) and refrigerated.
surface material and homogenized in a stainless steel blender. Percent moisture was
determined gravimetrically on a 1.0 g sample at 103°C for 24 hours. For metals
anaiysis, a 1.0 g sampie was weighed into a 60 mi teflon digestion vessei, 2 mi of
ultrapure nitric acid was added, and the sealed vessel was then heated to 200°C until
digestion was complete. The sample was then diluted to 10 ml using deionized distilled
water and metals analysis performed using an inductively coupled plasma mass
spectrophotometer (ICP-MS).
2.3.8 Fish
Fish were sampled in Benson and Keogh Lakes on September 13 and 17, 1990 using 2.0
cm mesh sinking and floating gill nets. Gill nets were set at various sites in each lake
(Figure 2-2) with soak time of 3 to 6 hours. Captured fish were weighed (±0.1 g),
measured for fork length (±1 mm), sexed and dissected to extract stomachs. The
2-11

0 100 200 300 400 - --- -METRES
Figure 2-4 Benson Lake Vegetation Sampling Locations

METHODS
stomachs were retained and preserved in 10% buffered formalin. Selected fish were
dissected on clean plastic bags using a stainless steel scalpel. Tissue samples of the
dorsal muscle were obtained by removing the skin from the first dorsal fin ray forward to
the gill cover. A tissue sample was collected from this area taking special care not to
include any bones or skin. Liver samples were also collected from the same fish. Tissue
samples were frozen and shipped to Elemental. Scales were collected for aging analysis.
Fish tissue samples were homogenized using a mortar and pestle to prevent metal
contamination. The percent moisture was determined gravimetrically by weighing 1.0 g
of tissue into a small beaker and drying at 103°C for 24 hours. For metals analysis a 1.0
g sample was weighed into a 60 mJ teflon digestion vessel; 2 ml of ultra pure Ilitric acid added and the sealed vessel was then heated to 200 ° C until digestion was complete.
The sample was then diluted to 10 ml with deionized distilled water and metals analysis
performed using an inductiveiy coupied piasma mass spectrophotometer unit (iCP-MS).
2-13
3 - Results and Discussion
(]lescan)

3.0 RESULTS AND DISCUSSION
The following section details the results of physical and chemical analyses of the
hydrology, water quality and sediment characteristics of Benson Lake 17 years after the
cessation of subaqueous tailings disposal. In addition, the biota (plankton, vegetation
and fish) are evaluated to determine whether effects of tailings disposal on community
structure and composition are evident.
3.1 Lake Morphometry and Hydrology
3.1.1 Morphometry of Benson and Keogh Lake
Benson Lake is a small deep lake about 2.16 km long with a mean breadth of 0.36 km, a
mean depth of 25.5 m, and a maximum depth of approximately 54 m (Figure 3-1). The
total area enclosed is 773,000 m2 and the lake volume is currently 1.97 x 10⁶ m3. The
lake is one in a series of lakes that lie in an area of moderate relief on the northern end
of Vancouver Island. It is oriented in a southeast-northwest direction and is fed from
the eastern end by the Benson River and the Raging River. The Raging River flows in
the adjacent valley to the east and ultimately drains Maynard Lake which lies to the
northeast. The lower Benson River, which drains Benson Lake, flows west'.vard to
Kathleen Lake and further to Alice Lake.
Keogh Lake, the control lake, is similar to Benson Lake in size, shape and depth (Figure
3-2) and lies approximately 12 km to the northeast (see Figure 1-1). This lake forms the
headwaters of the Keogh River which flows northwestward into Queen Charlotte Strait.
The lake morphometry of Three Isle Lake, used as a control lake for aquatic vegetation
analyses, was not examined in detail. However, a preliminary examination found the
lake to be relatively shallow (maximum depth less than 12 m) and gradually sloping
around its entire perimeter.
3 - 1

C0079-"4 1•1.3 RES AH .
I LEGEND
Mean Breadth (b) 357 m Length (I) 2165 m Maximum Depth (Z m ) 54 m Mean Depth (Z) 25.5 m Ar•,, (A' 77'1, nnn rn2 Rei~ti~; Depth (Zr) 5:4~--- ... : I ~~~,:;~. {V(L) ~!;72 * 10 8 ml 1 Shorefine Development (SLDj 1. 7
I I 0 100 200 300 400 - -- - -
I Mt:.lRES
I Figure 3-1 BENSON RIVER {in flow)
l Benson Lake Bathymetric Mapping ~J

LEGEND
Elevation Surface Area Volume Mean Depth (Z) Max. Depth (Z m ) Shoreline
150 - 300 m 797,570 m2
16.1 X 10 6 m3
20.2 m 43.3 m 5,130 m
Figure 3-2 Keogh Lake Bathymetric Mapping
RES AH
Q(escan)
RESULTS
3.1.2 Benson Lake Hydrology
While a detailed hydrological investigation of Benson Lake and its associated dr~inages was not part of the present scope of work, the data collected to date affords some
general comments. At the time of this survey (September 13 - 17, 1991), the Raging
River, which enters Benson Lake on its eastern end, contributed the greatest amount of
inflow (80%) to the lake, followed by the upper Benson River (13.5%) and Craft Creek
(6.5%) (Appendix A). Discharge measurements indicated that total surface water
inflow (2.08 mJ s-1) was roughly equal to total surface water outflow (1.88 mJ s-1). No
measurements of input or loss due to groundwater, evapotranspiration and or
precipitation were made.
The hydrology of Benson Lake is also affected by a dam situated on the Raging River at .
the outlet of Maynard Lake. Since the Raging River contributes the greatest amount of
inflow to Benson Lake in late summer, water management strategies that affect water
levels in Maynard Lake will also affect water levels and water quality in Benson Lake.
3.2 Water Quality
The summer stratification regime in Benson Lake appeared to be deteriorating with the
onset of fall overturn as there was a progressive deepening of the epilimnion with no
distinct thermocline evident (Figures 3-3 to 3-5). In contrast, the control lake, Keogh
lake, had a distinct thermal discontinuity layer at between 6 and 9 m in depth (Figure
3-6).
Temperature, oxygen, pH, turbidity and conductivity profiles in Benson and Keogh
Lakes indicated that the physical properties controlling water quality were similar to a
depth of approximately 35 m, both between lakes and at each of the three sampling
stations within Benson Lake (Figures 3-3 to 3-5). Below 35 rn, there was a progressive
reduction in oxygen content at all sites, becoming acute just above the sediments in
Keogh Lake. Turbidity levels at Stations 1 and 2 in Benson Lake were slightly higher
below 35 m than above this depth (1.1and1.6 NTU's, respectively), however, values in
the range of those observed essentially represent clear water. Station 3 in Benson Lake
and Station 1 at Keogh Lake were not sampled for turbidity, conductivity or pH below
35 m. The observed sharp decline in oxygen concentrations above the sediments in
Keogh Lake may, in part, be explained by the fact that an operational fish farm was
3-4

A T11rhirlitv ,._,.. . -· -·-·•J
Figure 3-3 Turbidity (NTU), Conductivity (l'mhos), pH, DiSSolved 0-2 (mg L-1) and Temperature Profiles for Benson Lake, Station 1
0.0 0.2 0.4 0.6 0.8 1.0 , .2 1.4 1.6 I I
"tn "tC::. An AC:. c:.n c:. c::. .JV .J.J "TV "'T'-.1 .JV ..,, ..,,
, .8
• Conductivity I I I I I 1 I 1 I I I I I I I I i
• pH 0 , 2 3 4 5 6 7 8 9 I I I
A Dissolved 02
V Temperature 0
O 2 4 6 8 10 12 14 16 18
I ' /11 .. ' I I / L~ .. I t _f-v--1' .. ~
10 ~ v-vl /f .. )::I vv ,..
l v~ • -v J ..
~ 20 _,,v ,....... I \ ~ I It E v - I \ p I I ~ J::. -a.
I v I I I Q)
0
30 t 40~ + \ V I
2.0
t::.n vv
' I
10
20
I I I ~
I J .)<J 1 so~I -----·-~-------·----------~~~~---.J
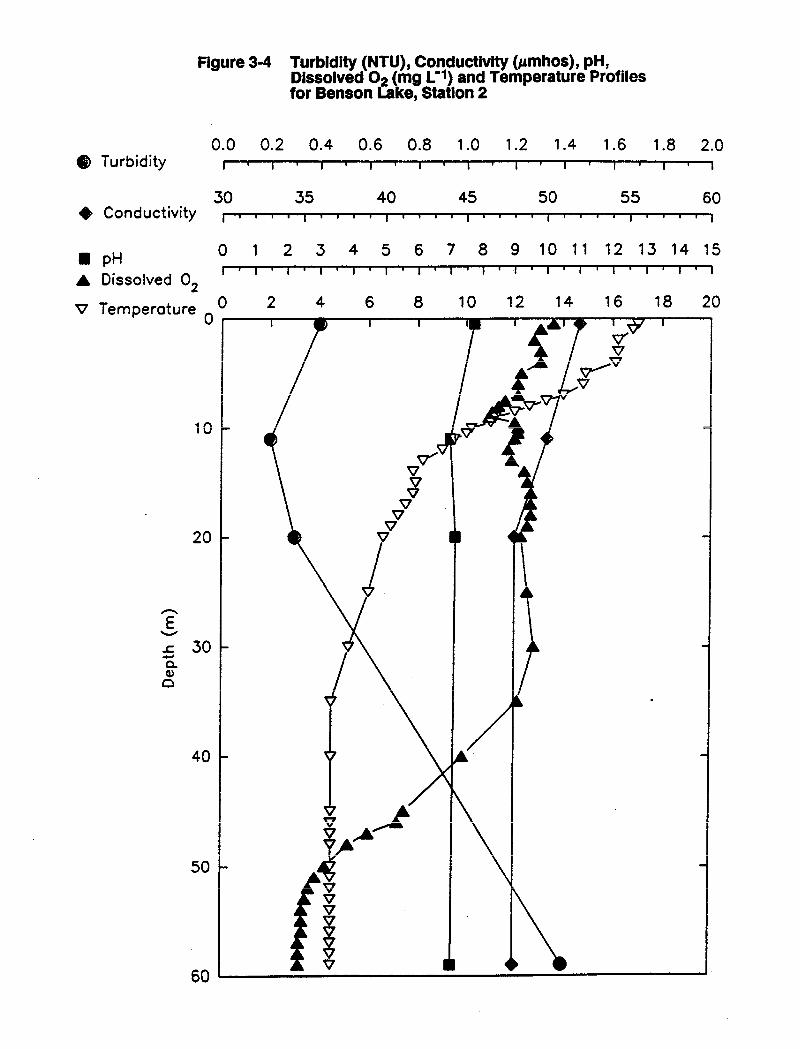
Figure 3-4 Turbidity (NTU), Conductivity (µmhos), pH, Dissolved 0 2 (mg e1) and Temperature Profiles for Benson Lake, Station 2
0.0 0.2 0.4 0.6 0.8 1.0 1.2 1.4 1.6 1.8 2.0 e Turbidity
30 35 40 45 50 55 60 + Conductivity I I i I I I I i I ' ' I I I I I I I I I I I
• pH 0 1 2 3 4 5 6 7 8 9 10 11 12 13 14 15
A Dissolved 02 ' I I I I I I I I • I I I • I I I
v Temperature 0
0 4 6 8 10 12 14 16 18 20
1~ -----------r-·-r~.,~i-~~ 2
I I rLrv 41~v~ IA~/
I ~Jr7
/ f
20
E I :; 30 ~ l I
40
vv ~
~
Jvvv
\/v I I
/\ I I

Figure 3-5 Turbidity (NTU), Conductivity {µmhos), pH, Dissolved o2 ~g L ·1) and Temperature Profiles for Benson La e, Station 3
0.0 0.2 0.4 0.6 0.8 1.0 1.2 1.4 1.6 1.8 2.0 e Turbidity
30 35 40 45 50 55 60 • Conductivity I I I I I I I I I I I I I I ' I
• pH 0 1 2 3 4 5 6 7 8 9 10
A Dissolved 0 2
V Temperature 0
O 2 4 6 8 10 12 14 20
I • I I / I I / {. I I I
10
20 ~ ~ i
++ -.. I \ I I E ......... ~ ...., 0. Cl.>
0
30
I 40 ~

Figure 3-6
0.0 0.2 9 Turbidity
"rt'\ ...JV
• Conductivity
• pH 0 1
A Dissolved 0 2
'\1 Temperature 0
0 2
I I I
10
20
,,.-.... I E - I ~ ~
c. Q)
0
30
40 ~ I
Turbidity (NTU), Conductivity (µmhos), pH, Dissolved 0 2 (mg L ·1) and Temperature Profiles for Keogh Lake, Station 1
0.4 0.6 0.8 1.0
"lC. At'\ Ac:;_ ...J.J "'T'\,I "'T',J
I I I I I I I
2 3 4 5
4 6 8 10
T '• I
"" • ") I ~" 7""7""
v"i
n i ~\ I
1.2 1.4 1.6 1.8
"" I; I; w.., <JoJ
i j I I I
6 7 8 9
12 14 16 18
IT')'{ ~v~•
-'7- I } ..
2.0
~" ...,.., I I
10
20
I I I
50 '------------------------------~~~~~~~~--
RESULTS
located near the sampling station. Fouling of the profundal sediments from uneaten fish
food and from fish feces may be increasing the biological oxygen demand at the
sediment-water-inteiface resulting in lower-than-expected oxygen concentrations.
Physical and chemical water quality test results indicated similar water quality at all
Lakes {Table 3-1; ~ppendix B). Both lakes were circumneutral in pH, but Benson Lake
water was significantly higher in conductivity (74.7 µmhos), alkalinity (31.8 mg L-1
CaC03) and total dissolved solids (53.5 mg L-1) than Keogh Lake water (comparative
values 24.5 µmhos, 7.7 mg L-1 CaC03, and 20 mg L-1, respectively). Keogh Lake water
was significantly higher in the nutrient phosphorus (6.5 µg L-1 vs 3.3 µg L-1) and in total
productivity as measured by the parameters Chlorophyll a (0.64 µg L-1 vs 0.072 µg L-1), totai organic carbon (4.4 mg L-1 vs i.7 mg L-1), and secchi disk transparency (3.5 m·vs 6.3
m). All other parameters, including dissolved metals concentrations, were similar
between lakes. Finally, the chemical composition of the water entering Benson lake
through the inflows was very similar in composition to the lake water (Table 3-2) and
reflects the higher conductivity, alkalinity, total dissolved solids and lower nutrient levels
mentioned above. Inflow water quality to Keogh Lake was not assessed.
Dissolved metals concentrations in both lakes and in the inflow streams to Benson Lake
were generally low with only aluminum, arsenic, copper, and iron being consistently
above detection limits {Table 3-2). Aluminum concentrations ranged from 0.015 to
0.046 mg L-1, As from <0.0001to0.0005 mg L-1, Cu from <0.001 to 0.003 mg L-1, and Fe
values were 0.066 to 0.141 µg L-1 for Al, <0.0001 mg L-1 (always) for As, 0.002 to 0.003
mg L-1 for Cu, and 0.039 to 0.309 for Fe. Aluminum concentrations were consistently
above the CCREM guidelines for the protection of aquatic life in both lakes (Table 3-1;
Appendix B). The forest podzolic soils in the area are the likely source of soluble
aluminum. Decomposition of forest litter releases humic acids that chelate aluminum
and enhance its mobility through the soil column and into surface waters. Arsenic never
exceeded CCREM guideiines. Copper did so on oniy two occasions (max. 0.003 mg L-1) and iron did so only once (max. 0.309 mg L-t; see Appendix B).
Differences in the chemical profile of water from surface (0 to 10 m) and mid-water (10
to 20 m) depths were minor in both lakes, but bottom waters (below 20 m) were
significantly different with respect to levels of ammonia nitrogen, nitrate/nitrite nitrogen
3.9

RESULTS
Table 3-1
Physical and Chemical Water Quality Parameters . for Benson Lake (Sept 13, 1990) and Keogh Lake (Sept 17, 1990) * ·
Benson U'---L.. CCREM Receiving"" Nl:IU!::fll
Parameters Lake Lake Water Guidelines
Physical Tests Conductivity µmhos/cm 74.7 '.>A I: . ..,. . .,,,, Total Dissolved Solids (mg/L) 53.5 20.0 pH 7.56 7.15 6.5-9.0 Total Suspended Solids (mg/L) 3.71 2.47 increase of 10.0 mg/L Fixed Suspended Solids (mg/L) <1 <1 Volatile Suspended Solids (mg/L) 2.15 2.25 Turbidity NTU 0.51 0.40
Dissolved Anions (mg/L) Alkalinity CaC03 31.8 7.65 Chloride Cl 0.94 1.1 Silicate Si02 3.27 3.3 Sulphate S04 1.16 2.0
Nutrients (mg/L) Ammonia Nitrogen N 0.020 0.007 Nitrite/Nitrate Nitrogen N 0.033 0.037 Total Phosphorus p 0.0033 0.0065
Other Tests (mg/L) Chlorophyll µg/L 0.072 0.64 Total Organic Carbon c 1.70 4.37
Dissolved Metals (mg/L) Aluminum Al 0.028 0.105 0.1 Arsenic As 0.00025 <0.0001 0.05 Cadmium Cd <0.0002 <0.0002 0.0002 Calcium Ca 11.9 2.45 Copper Cu 0.001 0.002 0.002 iron Fe 0.081 0.131 0.300 Lead Pb 0.001 <0.001 0.001 Magnesium Mg 1.11 0.72 Manganese Mn 0.05 0.02 Mercury Hg <0.00005 <0.00005 0.0001 Nickel Ni 0.001 <0.001 0.025 Potassium K 0.10 0.035 Silver Ag <0.0001 <0.0001 0.0001 Sodium
..,_ 1.13 1.12 .... Cl
Zinc Zn <0.0005 <0.005 0.03
<=less than • Mean values for entire water column (I.e. mean of samples taken at 4 depths. See Appendix 8) .. For the protection of aquatic life.
3 -10

RESULTS
Table 3·2
Water Quality Analysis for Benson and Raaina Rivers and Craft CrAAk .... .... - - - - - - - -- - - - - - - - - - - - - --
Bens9n Benson Craft Raging Inflow Outflow Creek River
Parameters Sep 18/90 Sep 18/90 Sep 18/90 Sep 18/90
Physical Tests Conductivity µmhos/cm 105 76.8 124 70.6 Total Dissolved Solids (mg/L) 90.0 60.0 100. 60.0 pH 7.90 7.78 8.03 7.84 Total Suspended Sands (mg/L) ,, '7 A '7 " ..,. - 4 ,..
'·' ~-· '·' ...... u I Fixed Suspended Solids (mg/L) <1 <1 <1 <1
1
i~:~;~~:uspended Scl!ds (m~~ ?n "n '>n ~1 ~ . .., ....... '·" .... ' 0.20 0.30 0.10 0.50
I Dissolved Anions (mg/L) A!ka!inity CaC03 47.5 34.3 55.5 31.5
Chloride Cl 0.9 0.5 0.6 0.5 Silicate Si02 3.2 3.8 3.3 4.3 Sulphate S04 4.1 2.5 2.6 1.7
Nutrients (mg/L) Ammonia Nitrogen N <0.005 <0.005 <0.005 <0.005 Nitrite/Nitrate Nitrogen N 0.120 0.036 0.140 0.023 Total Phosohorus p 0.003 0.004 0.004 0.005
I Other Tes~s (mg/L) I Total Organic. Carbon c 0.75 1.64 0.84 1.92
Dissolved Metals (mg/L) Aluminum Al 0.020 0.028 0.056 0.033 Arsenic As 0.0007 0.0002 0.0004 <0.0001 Cadmium Cd <0.0002 <0.0002 <0.0002 <0.0002 Calcium Ca 18.9 12.5 21.3 10.8 Copper Cu 0.001 0.005 0.001 0.002 Iron Fe <0.030 0.043 <0.030 0.079 Lead Pb <0.001 <0.001 <0.001 <0.001 Magnesium Mg 0.927 1.35 1.66 1.60 Manganese Mn <0.005 <0.005 <0.005 <0.005 Mercury Hg <0.00005 <0.00005 <0.00005 <0.00005 Nickel Ni <0.001 <0.001 <0.001 <0.001 Potassium K 0.16 0.09 0.14 0.08 Silver Ag <0.0001 <0.0001 <0.0001 <0.0001 Sodium Na 1.40 1.22 1.50 1.20 Zinc Zn <0.005 <0.005 <0.005 <0.005
<=less than
3. 11
RESULTS
and the dissolved metals aluminum and iron (Table 3-1). All other parameters were
similar from top to bottom.
Ammonia nitrogen concentrations in the bottom water of Benson Lake (0.096 mg L-1) were an order of magnitude higher than in surface waters (0.005 mg L-1) while
nitrate/nitrite levels remained fairly consistent from top to bottom (range 0.21 to 0.46
mg L-1 ). The observed increases in ammonia, iron and aluminum concentrations and
the reduction in the concentration of nitrate/nitrite in the profundal zones of Benson
Lake are consistent with the observation that oxygen concentrations near the bottom
were reduced (Figures 3-3 to 3-5). Under anaerobic conditions, and with a suitable
supply of metabolizable carbon, denitrification can convert nitrates and nitrites to
gaseous nitrous oxide and dinitrogen. Moreover, under highly reducing conditions,
nitrate and nitrate can be dissimilated to ammonium by fermentative bacteria. Iron and
aluminum solubility also increases as the redox potential decreases and the two
compounds are liberated from benthic muds (Hutchinson 1957).
In accordance with the observed, rather severe, oxygen depletion in the bottom waters of
Keogh Lake (Figure 3-6), dissolved iron and aluminum concentrations increased relative
to the well-oxygenated overlying waters. Ammonia nitrogen, on the other hand, was
undetectable ( <0.005 mg L-1) and nitrate/nitrite was relatively abundant (0.083 mg L-t). In contrast, ammonia nitrogen was present in surface water (0.011 mg L·I), while
nitrate/nitrite was not ( <0.005 mg L-1; see Table 3-1). The absence of ammonia
nitrogen and the prevalence of nitrate/nitrite nitrogen species in the bottom waters of
Keogh Lake, at first glance, appears to be anomalous. However, the deep water sample
in this lake was taken from a depth of 35 m, which was still in the well oxygenated zone
(Figure 3-6). Therefore, it is not surprising that nitrate/nitrite nitrogen was present in
this sample in significant concentrations.
Depletion of nitrate/nitrite in the surface waters of Keogh Lake may have been caused
by assimilation of this nutrient by photosynthetic processes, leading to the apparent
stratification of this form 0£ nitrogen. This hypothesis is supported by the eVidence of
increased photosynthetic activity, as suggested by the elevated levels of Chlorophyll a and total organic carbon relative to Benson Lake. The detectable levels of ammonia
nitrogen in the surface waters of Keogh Lake, which in itself is anomalous, may have
been caused by excretory products generated by a nearby fish farm.
3. 12
RESULTS
In conclusion, it can be stated that the water quality in Benson Lake, 17 years after
cessation of tailings deposition, was similar to that of the control lake which had not
received tailings. Differences in the water quality between the two lakes can be
be having the effect of enriching lake productivity. Both lakes can be categorized as
being oligotrophic on the basis of their water quality. Anaerobic conditions in the deep
profundal zones of both lakes are likely due to a high biological oxygen demand
resulting from consumption during the oxidation of organic matter. The profundal
oxygen depletion in Keogh Lake was more severe than in Benson Lake. This may be
attributable to increased bacterial decomposition of detritus from the fish farm.
3.3 Sediment and Tailings
Benthic sediments collected from Benson Lake indicated that the tailings which had
once been deposited and dispersed over the lake bottom are presently overlain by a
layer of mud and organic material between 2 and 3 cm thick (Table 3-3). The sediment
collected at the station nearest the lake's inlet streams (Station l} contained abundant
organic material and significant quantities of poorly decomposed wood chips; probably
by-products of active forestry (carried down in surface runoff) which has been going on
in the area over the last decade. Below the organic muds, there was evidence of tailings
materiai at aii stations, being most prominent at Station 2.
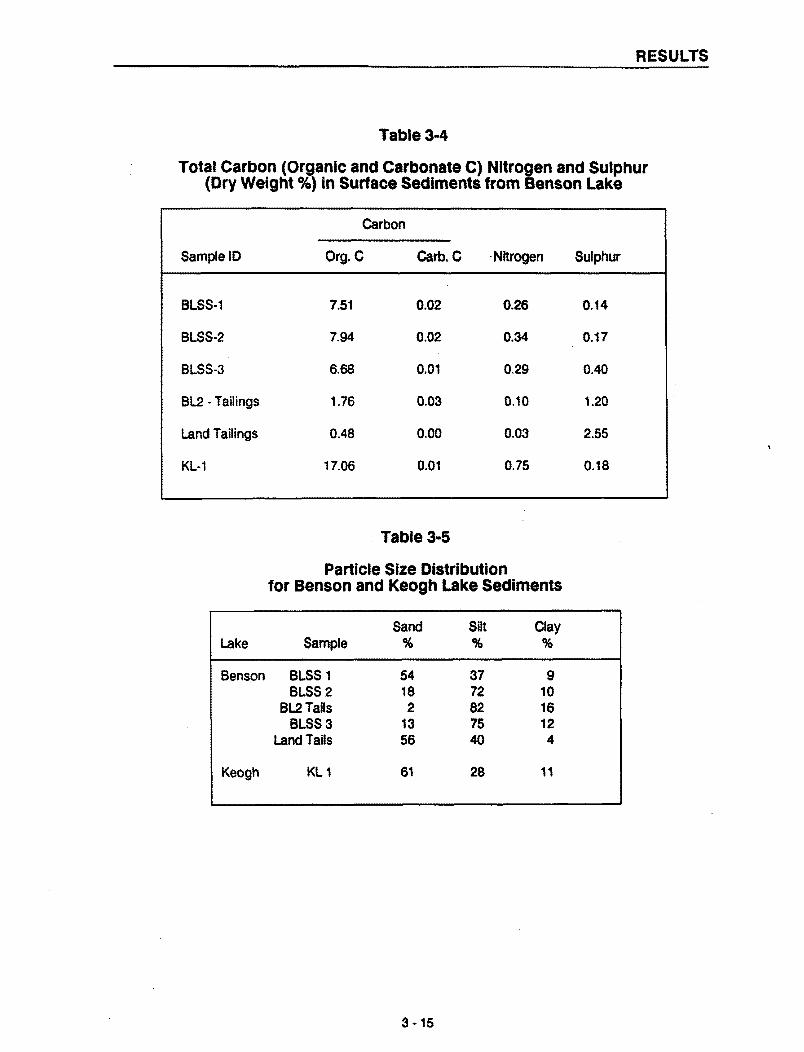
Total carbon, including organic and carbonate forms, nitrogen and sulphur analyses
resuits are presented in Tabie 3-4. Sampies BLSS 1-3 contained significant amounts of
organic carbon (6.6 to 7.9%) with much lesser amounts of carbonate-C being present.
Total nitrogen concentrations were greatest in those samples with the highest amount of
organic-C as expected. Total sulphur concentrations were poorly correlated with
organic-C concentrations. Moreover, the highest sulphur concentrations were associated
with the tailings samples indicating that the majority of the sulphur in these samples was
inorganic. The sediment sample obtained from Keogh Lake (KL-1) was high in organic
C ( 17%) and contained less sulphur than Benson Lake tailings sediments.
3.3.1 Particle Size Analysis Particle size analysis of the Benson Lake samples indicated the sediments at Station 1
(BLSS-1) were coarser and contained more fine sand particles ( < 0.15 mm) than
3-13

RESULTS
Table 3=3
F'iAlrl nh«tAnt:tfinn~ nf ~Atfirnant~ l'ftlla"'ta'4 fr"'""" • • .,,,,,. ___ ._.._. •• ..., •• ...,. •• ...,. ..,... V'V¥•111...,11ir.~ '-"'VllW..,W.VW llVlll
the Profundal Zone of Benson and Keogh Lake for Benthlc Invertebrate, Metals and Particle Size Analyses
Siation Lake Number Date Time Depth Observations
Benson 1 09/14/90 17:00 hrs 47m High organic content. Contained significant quantities of poorly decomposed wood chips. More sand sized particles
2 09/14/90 17:45 hrs 51 m Brown to reddish brown mud, 2 cm thick underlain by laye; of mixed tailings and mud approximately 8 cm thick. Metallic ,. .. "'-' +,..n; ... ,.'"' ...... ,...,,..-.......,, ... ,..._+ ""--•-·., .. n --1:1' "')' LQllll 11;1~ ..,1..UVll llllQllL ug11,1vv I u \,ii II.
3 na1u.1on 1A·~n hrc. 35m Brc\Yn to reddish brc\•1n organic ooze4 --1·--...1-v •-•VW 1uw
Absence of large organic material that was found on site 1 (above). ~-~ud was under~ lain by coarse gravelly type sediment.
Keogh 1 09/17/90 15:45 hrs 40m Chocolate brown coloured organic ooze approximately 1 O cm thick underlain by brown to grey clayey material.
sediments at the other sites (Table 3-5; Appendix C). By contrast, sediments at Stations
2 and 3 were composed almost entirely of silt and fine clay particles. The fine sand
particles at Station 1 are probably carried into the lake in the runoff from both the
tailings sample had a particle size distribution most similar to that observed at Station 1,
being composed primarily of fine sand and silt sized material. The Keogh Lake sample
also .consisted of fine sand material with similar proportions of clay as compared to the
Benson Lake samples.
3.3.2 Petrographic Analysis
Six sediment samples ·were mounted on glass slides and prepared as polished thin
sections for microscopic study. No slide could be made of the sample from Keogh Lake
as some property of the sample prevented hardening of the mounting medium. X-ray
3 -14
RESULTS
Table 3-4
Total Carbon (Organic and Carbonate C) Nitrogen and Sulphur (Dry Weight %) in Surface Sediments from Benson Lake
Carbon
Sample ID Org.C Carb. c ·Nitrogen Sulphur
BLSS-1 7.51 0.02 0.26 0.14
BLSS-2 7.94 0.02 0.34 0.17
BLSS-3 6.68 0.01 0.29 0.40
BL2 - Tailings 1.76 0.03 0.10 1.20
Land Tailings 0.48 0.00 0.03 2.55
KL-1 17.06 0.01 0.75 0.18
Table 3·5
Particle Size Distribution for Benson and Keogh Lake Sediments
Sand Silt Clay Lake Sample % % %
Benson BLSS 1 54 37 9 BLSS2 18 72 10
BL2Tails 2 82 16 BLSS3 13 75 12
Land Tails 56 40 4
Keogh KL 1 61 28 11
3-15

RESULTS
diffractometer scans (CuKa radiation) were carried out on portions of each of the
unmounted samples. Samples BL SS 1, 2, 3 and BL 2 Tailings are all of .similar
character, consisting of a mixture of mineral grains and a translucent brown to opaque
amorphous material which almost certainly represents a veneer of organic-rich ooze and
possible Fe-hydroxides on the lake bottom. Estimated proportions of the organic
material are generally in the range of 30 to 40%.
The mineral component seems similar in all cases, consisting of various proportions of
feldspar (plagioclase ), quartz, amphibole, chlorite, garnet, epidote, possible diopside
and/or olivine, and Fe-oxides (magnetite and minor hematite). The mineral grains are
small (mainly in the range 5 to 100 microns), and identifications and estimates of
relative proportions are not of high reliability.
Sulphides were notably sparse, totalling an estimated 0.3 to 0.5%. They consisted of·
pyrite, pyrrhotite and traces of chalcopyrite, all as liberated particles. The Fe sulphides
occasionally showed thin rims of oxidation to limonite, but the chalcopyrite was
unoxidized. The proportion of the mineral component (and specifically of sulphides) was
not significantly different in the BL 2 Tailings sample than in samples BL SS 1 to 3. The
overall mineralogy of the mineral component in the latter samples was also similar to
that of BL 2, suggesting that it consists, in all cases, predominantly of redistributed
tailings.
The CuKa XRD scans and analyses confirm the salient features of the optically
estimated mineralogy. Various small, unidentified peaks (not always the same in each
sample) were also present. The brown organic phase, being non-crystalline, did not
show up on the XRD traces. The XRD pattern of the Keogh sample showed only a few
subdued peaks, suggesting that it consisted largely of organic ooze, with a minimal
(quartzo-feldspathic) mineral component. Such a composition may explain its effect on
the epoxy used in the attempted mounting.
The sample designated "Land Tailings" was apparently some form of comminuted high
grade ore. It contained about 12% chalcopyrite and 20% magnetite. Its mineralogy
differed from that of the material whose processing produced the tailings in the lake, as
the sulphides are devoid of pyrite or pyrrhotite, and, in the gangue, quartz was strongly
dominant over feldspar. X-Ray Fluorescence analyses of the profundal and surficial
sediments confirm these findings. The lake samples showed substantial amounts of
3-16

RESULTS
A120 3 and Na20, indicating that plagioclase was a major component of the gangue
material discharged to the lake. Conversely, the sample of land tailings contained
significantly iess Na20 and Al20 3 with quartz being more dominant (Table 3-6). The Ch::tlcnnvrlte 17r::tinl: ~nne::trP.it rP.)~tivP)V frp11:h ~nfi thP drnnnlu nv1rH'7Art <>nnA.,..,.,..,.,.A nf ·------rJ--·- o---·-.... -rr•---- ·-·-···-.. J ..... _...,. ... , ........... •a. .. ...,. wi•&...,•.ac•J u.tU."'~""'"' ".t't'""u.1.~•'-'"' v.1.
the sample was probably the result· of precipitation of hydroxides from Fe-rich
percolating waters.
3.3.3 Sediment Metal Analysis
Metal analyses of four profundal sediment samples from Benson Lake revealed that
primarily copper and, to a lesser extent, arsenic were elevated in these sediments <Table .. .. - .. - . '
3-7). Sample BL2 had very elevated levels of Cu (1,0~ mg Kg-1) as compared to the
other Benson Lake samples (230 to 400 mg Kg-1). Iron was also somewhat enriched in
compared to BLSS 1-3 (200 to 220 mg Kg-1). Copper was extremely elevated (24,000 mg
Kg-1) in the land tailings sample but had lower concentrations of Zn (58 mg Kg-1), V ( 48
mg Kg-1) and Ni (13 mg Kg-1) in comparison to the profundal sediments. The Cu concentration in the land tailings greatly exceeded the Pacific Place Guideline level C of
500 mg Kg·I, indicating that the sediments are highly contaminated with respect to this
element. Iron was highly enriched in the land tailings sample (27%) and agrees well
with the petrographic anaiysis which indicated the presence of secondary precipitation of
Fe-oxides and the high percentage of magnetite,
Tne profundai sediment sample from Keogh Lake had significantiy iess Cu and As than
that observed in Benson Lake, however more Cr and Ni was present in the Keogh Lake
sample.
The methods used for the sequential extraction of sediment from Benson Lake tailings
and land disposed tailings are outlined in Section 2.3.3. Eight (8) different extractions
were used to assist with the determination of the metal associations with these
concern, some general comments can be made regarding the expected speciation of
metal forms in the tailings sediment.
The concentration of metals in the water-soluble phase is usually quite low, representing
only those ions which are loosely bound to the surface of the sediments. Similarly, the
3-17

Table 3·6
X·Ray Fluorescence (XRF) Analysis of Top 15 cm Layer of Sediments from Benson Lake (Values as %)
Major Constituents
Sample ID Fe20 3 MnO Ti02 CaO K20 Si02 Al20 3 MgO P20s
BLSS-1 (1) 10.31 0.13 1.10 3.85 0.89 46.92 13.99 3.06 0.23
BLSS-2 (2) 12.26 0.23 1.16 4.12 0.80 42.93 13.73 3.34 0.30
BLSS-3 (3) 14.03 0.14 1.05 6.48 0.64 43.61 12.42 3.90 0.26
BL2 - Tailings 22.82 0.24 0.60 11.71 0.39 45.23 8.54 4.87 0.15
Land Tailings 41.27 0.14 0.37 10.06 0.18 34.05 4.24 2.44 0.05
() Indicates station number.
Na20
2.58
2.20
1.89
1.08
0.37
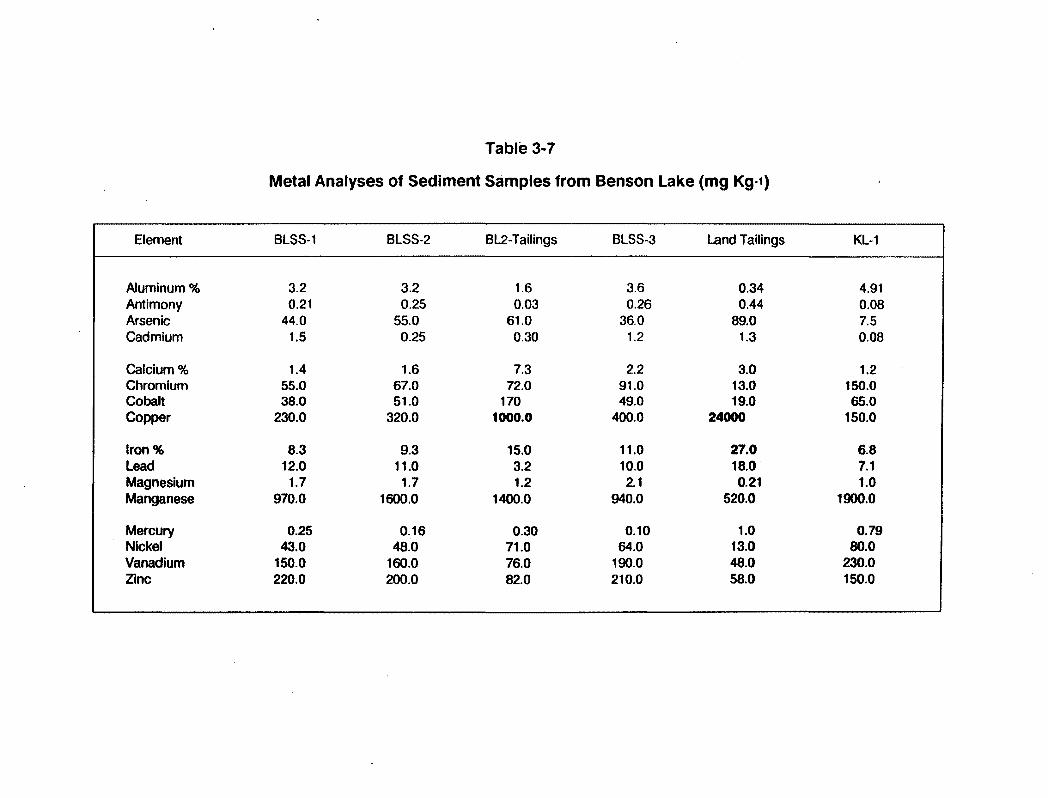
Table 3-7
Metal Analyses of Sediment Samples from Benson Lake (mg Kg-1)
Element BLSS-1 BLSS-2 BL2-Tailings BLSS-3 Land Tailings KL-1
Aluminum% 3.2 3.2 1.6 3.6 0.34 4.91 Antimony 0.21 0.25 0.03 0.26 0.44 0.08 Arsenic 44.0 55.0 61.0 36.0 89.0 7.5 Cadmium 1.5 0.25 0.30 1.2 1.3 0.08
calcium% 1.4 1.6 7.3 2.2 3.0 1.2 Chromium 55.0 67.0 72.0 91.0 13.0 150.0 Cobalt 38.0 51.0 170 49.0 19.0 65.0 Copper 230.0 320.0 1000.0 400.0 24000 150.0
Iron% 8.3 9.3 15.0 11.0 27.0 6.8 Lead 12.0 11.0 3.2 10.0 18.0 7.1 Magnesium 1.7 1.7 1.2 2.1 0.21 1.0 Manganese 970.0 1600.0 1400.0 940.0 520.0 1900.0
Mercury 0.25 0.16 0.30 0.10 1.0 0.79 Nickel 43.0 48.0 71.0 64.0 13.0 80.0 Vanadium 150.0 160.0 76.0 190.0 48.0 230.0 Zinc 220.0 200.0 82.0 210.0 58.0 150.0

RESULTS
exchangeable cation phase, which represents those metals adsorbed to the surfaces of
sediment by electrostatic or coulometric forces, usually does not have a large proportion
of metals associated with it. Nonetheless, cation exchange is an important metal
scavenging mechanism and may be more significant in sediments with high clay content
or significant quantities of organic matter. However, because the positively charged
metals are relatively weakly held to the surfaces they can be easily exchanged by other
cations. The use of excess ammonium ions in the extractant effectively displaces these
weakly held metals from the surface exchange sites.
The weak acid soluble phase is generally resigned to carbonates, whereby the metal ions
are liberated by the dissolution of metal carbonate or host carbonate at pH 5.0 with the
subsequent release of C02• Some Cu, Zn and Fe(II) oxides and hydroxides are also
marginally soluble at this pH.
The easily and moderately reducible phases will include, primarily, amorphous
manganese and ferric oxides and hydroxides respectively. Their solubility is greatly
increased in acid solution by the reduction from the higher to lower oxidation state.
Heavy metals such as As, Cr, Cu, Cd and Pb, which have co-precipitated with these
amorphous hydroxides or are covalently bound to their surface, would be liberated
simultaneously.
The difficultly reducible phase is often termed the non-silicate iron phase and includes
those crystalline forms of ferric and manganese oxides and hydroxides (e.g. B-FeOOH).
Metals which have co-precipitated or participated in lattice substitutions would be
released during this extraction.
The oxidizable phase includes species which are rendered soluble in acid solution by
oxidation with hydrogen peroxide. Most metal sulphides and organic metal compounds
are included in this category.
A direct comparison between subaqueous and land-disposed tailings behaviour was
examined in sequential extractions of sediments. Results from these experiments are
presented in detail in Table 3-8 and 3-9. As can be seen for the underwater tailings
sample, very small quantities of metals were released in the water-soluble, exchangeable
3-20

Table 3·8
Sequential Extraction of BL2 Tailings from Benson Lake
Water Weak Acid Reducible Phases Mass Soluble Exchange Soluble Oxidizable Residual Balance
Parameter Phase Cations Phase Easily Moderate Difficult Phase Phase (µg/g)
Arsenic 0.06 <0.01 <0.01 0.05 0.74 0.02 0.80 29.0 30.62 % 0.2 0.0 0.0 0.01 2.4 0.06 2.6 94.7
Cadmium <0.01 <0.01 <0.01 <0.01 <0.01 <0.01 0.03 0.19 0.22 % 0.0 0.0 o.o 0.0 o.o o.o 13.6 86.4
Cobalt 0.02 2.6 0.11 0.05 0.21 0.32 5.8 30 39.11 % o.os 6.6 0.28 0.13 0.54 0.82 14.8 76.7
Copper 0.20 0.06 0.04 <0.01 <0.01 0.61 46.0 38.0 84.91 % 0.23 0.07 0.05 o.o o.o 0.72 54.2 44.7
Lead <0.01 <0.01 <0.01 <0.01 <0.01 <0.01 0.11 0.27 0.38 % o.o 0.0 o.o o.o o.o 0.0 28.9 71.0
Mercury <0.01 <0.01 <0.01 <0.01 <0.01 <0.01 0.01 0.56 0.57 % o.o o.o o.o 0.0 o.o 0.0 1.7 98.2
Nickel 0.15 0.15 0.16 0.03 0.25 0.14 1.1 33 34.98 % 0.43 0.43 0.45 0.08 0.71 0.40 3.14 94.3
Zinc 0.10 0.04 0.16 0.12 0.27 0.56 2.2 45 48.45 % 0.21 0.08 0.33 0.24 0.55 1.12 4.5 92.87
Results are expressed as micrograms per dry gram of sediment foHowed by % of total.

Table 3-9
Sequential Extraction of Land Tailings near Benson Lake
Water Weak Acid Reducible Phases Mass Soluble Exchange Soluble Oxidizable Residual Balance
Parameter Phase Cations Phase Easily ~-~oderate Difficult Ph<:t<>O Dh"!lllirtn ,,,,..,_, ' llQ.;J'V 'ltQ.;t'O' VA>!:J/YI
Arsenic <0.01 <0.01 <0.01 0.02 3.2 1.4 0.02 40 44.64 % 0.0 0.0 0.0 0.04 7.2 3.1 0.04 89.6
Cadmium 0.01 <0.01 <0.01 <0.01 0.01 <0.01 <0.01 0.07 0.09 % 11.0 0.0 0.0 o.o 11.0 0.0 o.o 78.0
Cobalt 0.91 <0.01 <0.01 <0.01 0.50 0.09 0.05 26 27.55 % 3.3 o.o 0.0 o.o 1.8 0.33 0.18 94.4
Copper 260 0.52 3.0 0.17 51.0 0.48 160 12000 12475 % 2.1 0.004 0.02 0.001 0.41 0.004 1.28 96.2
Lead <0.01 <0.01 <0.01 <0.01 0.70 0.05 0.38 3.8 4.93 % 0.0 o.o 0.0 0.0 14.2 1.0 7.7 77.1
Mercury <0.01 <0.01 <0.01 <0.01 <0.01 <0.01 0.01 0.54 0.55 % 0.0 o.o o.o 0.0 o.o 0.0 1.8 98.2
Nickel 0.28 <0.01 0.01 <0.01 0.13 0.04 0.05 18 18.51 % 1.5 0.0 0.05 o.o 0.7 0.22 0.27 97.2
Zinc 1.0 0.05 0.03 0.02 1.6 0.47 0.22 38 41.39 % 2.4 0.12 0.07 0.05 3.86 1.13 0.53 91.81
Results are expressed as micrograms per dry gram of sediment followed by % of total.
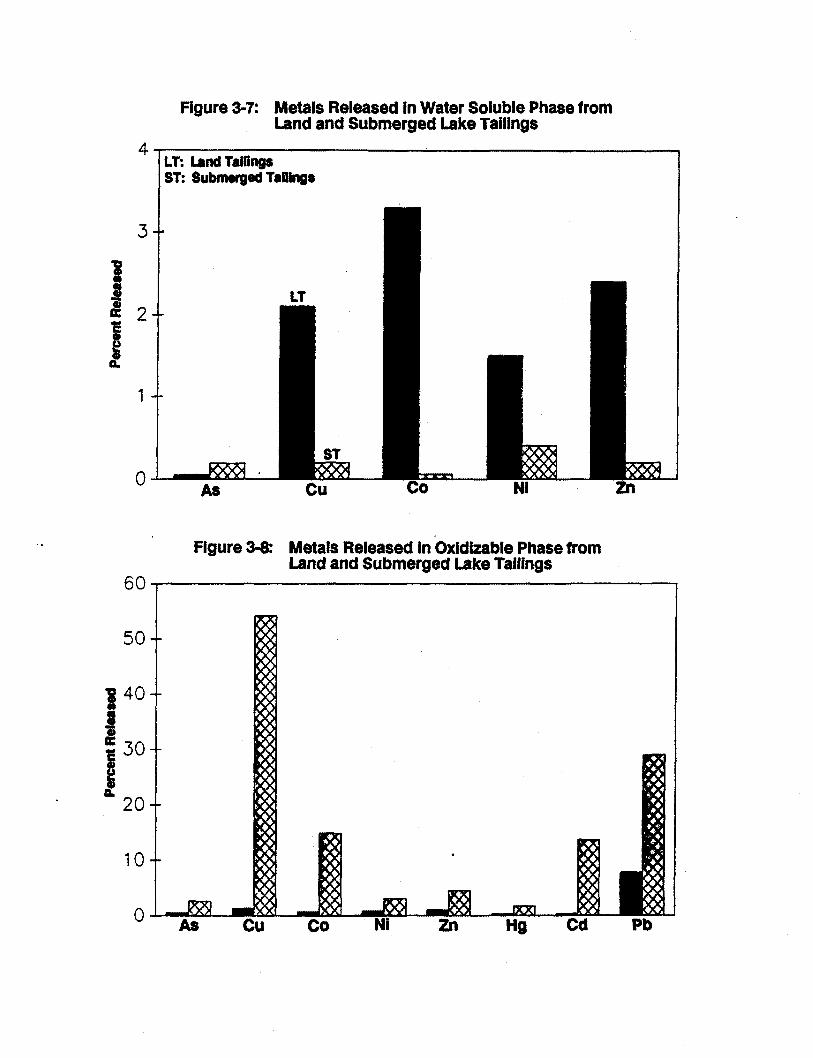
4
3
1 I J
2
1
50
J 40
I a: 30
I A. 20
10
Figure 3·7: Metals Released In Water Soluble Phase from Land and Submerged Lake Talllngs
LT: Land Tailings ST: Submerged Talllnge
Figure 3-8: Metals Released In Oxldizable Phase from Land and Submerged Lake Talllngs

RESULTS
cation and weak acid soluble phase. The exchangeable cation phase released moderate
amounts of Co in BU. In contrast, the moderate releases of Cd, Co, Cu, Ni and Zn
occurred in the water-soluble phase of the land taiiings (Figure 3-7).
The easily and moderately reducible phases will include amorphous manganese and
ferric oxides and hydrnxides respectively. Extremely minor releases ( < 0.75%) of an metals analyzed occurred in these phases in BU. Moreover, Cu was not released at all
in BU in these phases. Moderate releases of As, Cd and Pb occurred in the moderately
reducible phase from the land tailings sample, suggesting · that these metals are
associated with the secondary mineral precipitates. Petrographic analyses revealed that
ferric oxides were present in the land tailings sample. Arsenic and lead form strong
complexes with Fe-oxides and hydroxides and their association in this phase is therefore
not unexpected.
The oxidizable phase includes species which are rendered soluble in acid by oxidation
with hydrogen peroxide. For the subaqueous tailings sample, BU, significant quantities
of Cu (54%) and Pb (29%) were released in the oxidizable phase with moderate
releases of Cd (13.6%), Co (14.8%), Ni (3%) and Zn (4.5%). This is strongly contrasted
by the behaviour of those same metals from· the land tailings sample in the oxidizable
phase. As can be seen in Figure 3-8, only Pb (7%) was released in any significant
quantity in this phase from the land tailings sample. Oxidation of the samples with 30%
H20 2 releases organically bound metals and metal sulphides. The higher organic-C
content of BU (1.76%) compared to the land tailings (0.48%) suggests that metal
between metals and organic material range from weak (cation exchange), which results
in the ions being readily replaceable, to very strong ( complexation, chelation) and thus
indistinguishable from chemical bonds (Forstner and Wittmann 1983). The adsorptive
capacity of organic material arises from the ionization of functional groups (e.g. COO-),
thus resulting in a negative surface charge capable of binding divalent cations through
electrostatic forces. The absence of metal releases in the exchangeable ph3.$e in BU suggests that strong inner sphere compiexes are forming between the metais and the
organic materiaL
The adsorption of metais by organic matter in sediments has been the focus of much
research. The typical results of these studies are depicted below, with the extent of
retention decreasing from left to right:
3 ·24

Hg = Fe = Pb = Al = Cr = Cu > Cd > Zn > Ni > Co > Mn
at pH 5.8 (Evans 1989).
RESULTS
It can be summarized then that of the metals studied Hg, Fe, and Cu are very strongly
retained with Co and Mn the most weakly held (Evans 1989). This may partially explain
the moderate reiease of Co ( 6.6%) from the exchangeable phase. In both samples
however, most of the metals were released in the residual phase with the exception of
Cu in BL2 where roughly 50% was released in each of· the oxidizable and residual
phases (Tables 3-8 and 3-9). Typically, greater than 90% was released in the residual
phase suggesting that, in both samples, the metals were largely associated with the
biologically unreactive phase.
While inte1 pretation of sequential extractions is not without limitations, they do provide
an operational definition of the phases being investigated (Nirel and Morel 1990).
Detailed analyses of interstitial waters will be conducted in the summer of 1991 on
Benson Lake cores to substantiate and finalize the above conclusions.
3.4 Biota
3.4.1 Benthic Invertebrates
Benthic invertebrates were present in profundal sediments taken from the bottom of
Benson Lake in September 1990 (Tabie 3-10). 'Ibis is in direct contrast to previous
studies which showed that the benthos of Benson T ~ke was devoid of benthic orga.ttlsn1s
as a result of deep lake tailings disposal (Kussat et al. 1972; Hallam et al. 1974 ).
The mean density of benthic invertebrates in the profundal zone of Benson Lake in
September 1990 was 1,044.4 organisms/m2 (range = 300.0 to 2,400.0, n=3), which was
similar to the mean profundal density of around 1,118.7 organisms/m2 in nearby Keogh
Lake (a control). Densities in Benson Lake ranged from a high of 2,400.0 organisms/m2
at Site 1. in deep water ( 40 m) near the inlets of the Benson and Ra2in2 Rivers. to a low . . ' , - - ,
of 300.0 organisms/m2 at Site 2 in the deepest portion of the lake (50 m). Densities of
organisms at Site 3 (433.3 organisms/mi), near the outlet of the lake, were comparable
one location.
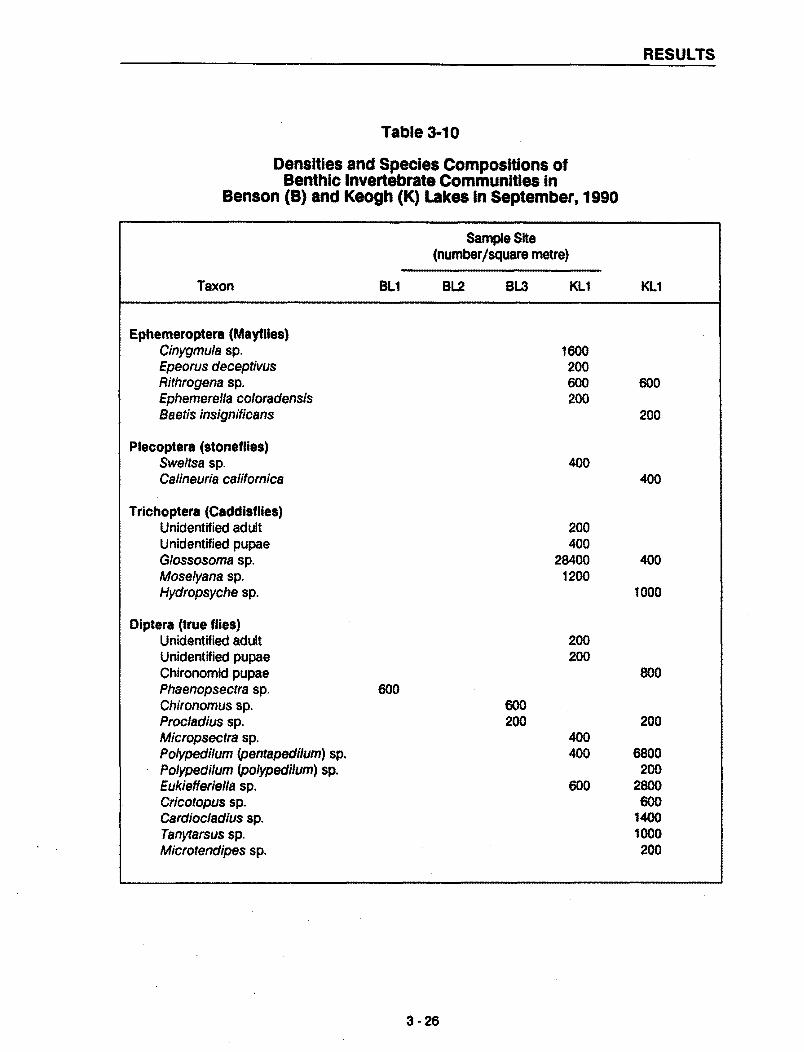
RESULTS
Table 3·10
Densities and Species Compositions of Benthlc Invertebrate Communities in
Benson (B) and Keogh (K) Lakes In September, 1990
Sample Site (number /square metre)
Taxon BL1 BL2 BL3 KL1 KL1
Ephemeroptera (Mayflies) Cinygmula sp. 1600 Epeorus deceptivus 200 Rithrogena sp. 600 600 Ephemerelfa coloradensls 200 Baetis insignificans 200
Plecoptera (stoneflles) Sweltsa sp. 400 Calineuria californica 400
Trichoptera (Caddisflies) Unidentified adult 200 Unidentified pupae 400 Glossosoma sp. 28400 400 Moselyana sp. 1200 Hydropsyche sp. 1000
Diptera (true flies) Unidentified adult 200 Unidentified pupae 200 Chironomid pupae 800 Phaenopsectra sp. 600 Chironomus sp. 600 Procladius sp. 200 200 Micropsectra sp. 400 Polypedilum Cpentapedilum) sp. 400 6800 Polypedilum Cpolypedilum) sp. 200 Eukiefferiella sp. 600 2800 Cricotopus sp. 600 Cardiocladius sp. 1400 Tanytarsus sp. 1000 Microtendipes sp. 200
3-26

RESULTS
Table 3-10 (cont.)
Densities and Species Compositions of Benthic Invertebrate Communities in Benson and Keogh Lakes In September, 1990
Sample Site (number /square metre)
Taxon BL1 BL2 BL.3 KL1 KL1
Tipulidae Hexatoma sp. 400
Simulidae Simulium sp. 200
Coleoptera (beetles) Heterlimnius sp. 200
Ostracoda (bivalves) 1200 400 600
Hydracarina (hydra) Torrenticola sp. 200
Turbelleria (flatworms) Tricladida 400
Oligochaeta (segmented worms) Limnodrilus sp. 1000 200 400 Tubifexsp. 600 200 600 Nais sp. 400 1400
Mollusca (molluscs) Pisidium sp. 200
Nematoda (nematode worms) 8600 400
Mean # Organisms per site 2400.0 300.0 433.3 2237.5 1000.0
# Taxa per site 5 4 6 16 18
Total# of Taxa 8 30
I Average Lake Density of Organisms 1044.4 1118.7
3-27

RESULTS
The diversity of organisms in Benson Lake was much lower than in the control lake
(Tabie 3-iO). Tne benthic community in Benson Lake was represented by only 8
different taxonomic groups compared to a total of 30 for Keogh Lake. The cornmunity
in Benson Lake was predominantly made up of burrowing tubificid oligocbaetes
(Limnodrilus sp. and Tubifex sp.), nematode worms and the epibenthic ostracod, a small
bivalved cnistacean that lives on the surface of the sediments (Tabie 3-iO). Oniy
ostracods and oligochaete worms were present at all three sample sites. Some dipteran
larvae were present at Sites 1 and 3. In contrast, the benthic invertebrate community in
Keogh Lake was predominantly comprised of epi-benthic insect pupae and larvae
represented by all of the major insect groups (Table 3-10). Oligochaete worms were
also present in Keogh Lake but they were represented by a different genus (Nais sp.).
Nematode worms and ostracods were not found.
The observed densities of benthic organisms in the profundal zone of both Benson and
Keogh Lakes in September 1990 were typical of the size of benthic communities in other
oiigotrophic iakes in Canada and the worid (Tabie 3-11), suggesting that the recovery of
Benson Lake's benthic community may now be complete. The composition of benthic
f~una in Benson Lake is typical of lakes which have become organically polluted
(despite the fact that all other indicators suggest that the lake is oligotrophic) and/or
suffer an acute reduction or elimination of oxygen in the profundal depths (Cook and
Johnson 1974; Wetzel 1979). In contrast, the organisms that make up the benthic
community structure in Keogh lake (Ephemeroptera, Plecoptera, Trichoptera, and
Diptera) are characteristic of shallow water communities which are generally restricted
to waters of relatively high ox-;gen content (Cook and Johnson 1974; Wetzel 1979). Oxygen depletion in the depths of Benson Lake cannot be ruled out as a factor in
determining the benthic community structure in this lake. Hallam et al. (1974) reported
that oxygen concentrations in the lake after fall overturn were uniform from surface to
bottom at 12.0 ppm (100% saturation at 6.0°C). However, on September 13 1990, fall
overturn was incomplete. Oxygen concentrations were uniform with depth and slightly
undersaturated (average 85% saturation) given prevailing water temperatures (Figures
3 - 3 to 3-5), but immediately above the sediment water interface, the dissolved oxygen
concentration was only 2.9 ppm (24% saturation at 4.5°C) compared to 8.8 ppm (95%
saturation at 17.2°C) at the surface. It is common to find an abundance of tubificid
3-28

*
-r .... a..1- ~ .... I GUllll:S .J• I I
RESULTS
All8P~ft.ft .......... ft.iftoll!l.!lil nftftel•·· ...... n .... -. .... IAlt. N ................. : ...... -rt-1..--a-"',, ""' Cl~'IO' nlUl ll'IO'I 1'-Cll IJ'IO'llOU J VI ua1HI11\i I IG\il VII IYlll:SI lli:SUICHlll:S;::t
in the Profundal Zone of Several Lakes of Varying Productivity
Average Numerical Density of Benthlc Fauna
Lake Name Status lnd/m2 (range) Source
Benson Lake ollgotrophlc 1044 (300-2400) This study
Keogh Lake oligotrophlc 1118 (1000-2237) This study
Lake Borrevann (Norway) eutrophic 1143-1598 Wetzel 1979
Lake Chud-Pskov (USSR) oligotrophic 407-1996
Trout Lake (Manitoba) oligotrophic 385 (19-1165) Rescan 1990d
Cliff Lake (Manitoba) oligotrophic 351 (19-1165) Wilson 1984
Southern Indian Lake Weirs & Rosen-(Manitoba) eutrophic 3327-5592 berg 1984
Lake Erie (Ontario) eutrophic Cook and Johnson 1974
West basin 7500 Central basin 2400 s:~~torn· n~~in A~n ._W"'"'"""''' ... n,.i1..,11t "TVWV
Lake Superior (Ontario) oligotrophic '-lQ? /1A.11Qn\ V'W'._ \ l"""T I IW'V/
~,.hol.,i,o .. rv4 ..,.VI IWIVl'V Wt~
Roth 1973
Saginaw Bay (Lake Michigan) eutrophic 4229 Cook and
Risley 1963
Lake Huron (Open Lake) oligotrophlc 720-2000 Teter 1960 Shrivastava 1974
Mandy Lake* meso-eutrophic 533 (87-1174) Rescan 1990d
Anderson Lake (Manitoba)•• meso-eutrophic 519 (109-1622) Rescan 1990c
Following cessation of tailings disposal after 45 years.
** Tailings are still being deposited In this lake.
3-29
I I·

RESULTS
oligochaetes, especially Tubifex sp., under these conditions of low oxygen saturation (Wetzel 1979).
Another factor which may explain the benthic community structure observed in Benson Lake and the divergent nature of the community structure in Keogh Lake is sediment
• • .a. .. .. • • • • • • • • • 1 • • compos1t10n. Among oentmc mverteoiates, morga.a-uc ana orgaruc partu::1e sue IS important in determining distribution, abundance and growth of these organisms (Cummins and Lauff 1969). Generally, the finer the particles, the smaller the organisms which can live in the interstitial spaces. The sediments in Benson Lake were comprised of extremely fine particles with roughly 80% being finer than 0.1 mm. This sediment composition is conducive to benthic invertebrate communities being dominated by oligochaetes, nematodes, and ostracods (Dr. D. Kathman, pers. comm.) which was observed in the profundai zone of Benson Lake (Tabie 3-10).
One factor confounding the above analysis is that the oxygen concentrations above the ..J' "" • 'V' 'L. T 1 1 ~1 "f nl't'I • .. ' .. ""' "'f'll"" ....... - ,., seu1meni.s m n..eogn .a..aice were 1ower \1.1 ppm or 070 samrauon at J.Yc; r1gure J-OJ
than in Benson Lake, yet the b~nthic community was comprised of organisms typically found only in well oxygenated environments. Moreover, the diversity of organisms in profundal environments is usually restricted to 4 to 6 species (Cook and Johnson 1974), but in Keogh Lake, the deep-water benthic community contained 30 different species (Table 3 -10). Many of the species were abundant and have not been documented as occurring in the profundal zone of lakes (Dr. D. Kathman, pers. comm.), and only two
classes of which ( chaoborus and flatworms) can be classified as profundal organisms. It is difficult to exp!aL11 the observed data for Keogh Lake benthos except to say that there may be some factor associated with the presence of the fish farm in the lake which is causing typically shallow water insects to deposit their eggs and larvae in open water
such that they sink to the bottom. Alternatively, excessive wave action may have stirred up littoral benthic invertebrate communities and resulted in the suspension and deposition of organisms into the deeper portion of the lake.
In summarv. it anoears that the benthic invertebrate community in Benson Lake ha~ re-.,, ... .. .. established itself to the point where the densities of organisms and the species
represented are typical of those found in the profundal zones of temperate, oligotrophic lakes having fine sediments. The profundal benthic invertebrate community in the control lake was atvPical and could not be used as a comoarison to confirm the normalcv .. .. ... .
3 -30

RESULTS
of the benthic recolonization of Benson Lake. It is suggested that the presence of a fish
farm in Keogh Lake has affected the benthic community composition in that lake.
3.4.2 Phytoplankton
The phytoplankton assemblages found in the water column of both Benson and Keogh
Lakes (Table 3-12) were characteristic ~f oligotrophic lakes (Hutchinson 1967; Wetzel
1979) and included such indicator organisms as the chcysophyceans (Acnanthes, Dinobryon ), chlorophyceans (Scenedesmus spp. and Chlorococcaceae ), and
Pyrrhophytes (Peridinium ). Numerically, the dorninant phytopbnlkters were the
Chlorophyta or green algae, and the Cyanophytes, or Blue-green algae. This type of
assemblage is common in coastal lakes in the late summer - early fall (Werring 1986; Wetzel 1979).
The dominant phytoplankton association in Benson Lake was a ChlorococcaceaeScenedesmus incrassatus-Anacystis sp. mix with a minor dominant association of
Gloeocapsa sp.-Chlamydomonas sp-Crucigenia quadrata. The dominant phytoplankton
assemblage in Keogh Lake was one of Chlorococcaceae-Euglenophyta with a minor
dominant association of Achnanthes minutissima-Chlamydomonas sp.-Merismopedia sp.
Densities of phytoplankton at three sites in Benson Lake ranged between 853 and 2,173
cells ml-t (0.8 to 2.2 x 10⁶ cells L-1) with a mean lake density of approximately 1529 cells
m!-1 (1.5 x 1()6 cells L-1; see Table 3-13). In contrast, the mean density of phytoplankton in Keogh Lake (3,263 cells ml-t ; Table 3-14) was approximately twice that of Benson
Lake. These values are within the range of densities for fall phytoplankton populations
in several oligotrophic coastal lakes in British Columbia (1-10 x 106 cells L-1; Werring
1986).
In general, the species composition of the net phytoplankton in Benson Lake in
September 1991 was similar to that of the control lake in that the community was
dominated by a green algae - blue-green algae assemblage. In addition, densities of
algal cells were typical of late summer densities in coastal lakes. Densities of net
phytoplankton in Keogh lake were almost twice that of Benson Lake, a phenomenon
which may be attributable to the presence of a fish farm (fertilization effect) on Keogh
Lake.
3-31

Table 3-12
Phytoplankton Taxa Found in Benson and Keogh Lakes
Taxa
CYANOPHYTA Anacystis sp. Gloeocapsa sp. Coelosphaerium sp. Dictyosphaerium sp. Merismopedia sp.
CHLOROPHYTA Ankistrodesmus sp. Chlamydomonas sp. Chlorococcaceae* Crucigenia quadrata Euglenophyta Mougeotia sp. Scenedesmus incrassatus S. bijuga Spondylosium sp. Staurodesmus sp.
CHRYSOPHYTA Achnanthes minutissima Cocconeis sp. Diatom Djnobryon divergens
PYRRHOPHYTA Peridinium **
OTHER TAX.A*** Cyst 1 Cyst2
PROTOZOA Ciliate Verticella sp.
Benson Lake
p p p p
p p p p p p p p p p
p
p p
p p
p p
Keogh Lake
p p p
p
p p
p
p p p
p p
RESULTS
"F" "' denotes the preienee of taxa In at ieaat some of the umpiea wiih ihat ietter deaignation, "-" denotes absence. * The taxa Chlorococcaceae Is a large taxa comprised of many dlsslmllar genera. All of the Chlorococcaceae counted as such are small coccold representatives of the group - possibly Chlorococcum. ** Mav be Glenodinium. *** The two distinct cysts present In the samples are undoubtedly of algae. It Is probable that these cysts are Pyrrhophytes, but they could also be encysted Trachelomonas or Euglenophytes.
3-32
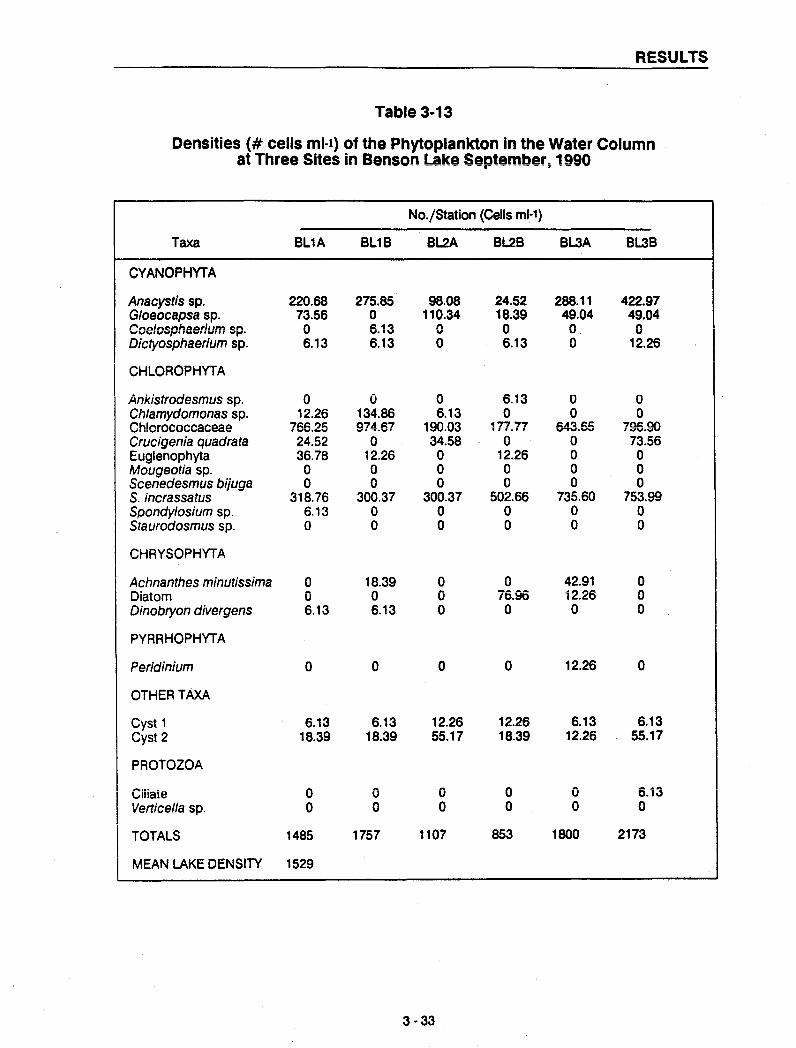
RESULTS
Table 3-13
Densities(# cells ml-1) of the Phytoplankton in the Water Column at Three Sites in Benson Lake September; 1990
No./Station (Cells ml-1)
Taxa BL1A BL1B B~ BL2B BL.3A BL.38
CYANOPHYTA
Anacystis sp. 220.68 275.85 98.08 24.52 288.11 422.97 Gloeocapsa sp. 73.56 0 110.34 18.39 49.04 49.04 Coelosphaerium sp. n ~ 1'll n n n n
" "'"'"' \# \# u u
I Dictyosphaerium sp. 6.13 6.13 0 6.13 0 12.26
CHLOROPHYT A I Ankistrodesmus sp. 0 0 0 6.13 0 0
1 · Chlamydomonas sp. 12.26 134.86 6.13 0 0 0 Ch!orococcaceae 7t::.t::. ?"- 07.11.t::.7 1on n'll 177.77 ~A'll ~"- "70£:: an ,...,,,,,._"' ..,, . ...,. . ..,, ,..,..,.""""' ~'-"•\J<J fi:IUoWU
Crucigenia quadrata 24.52 0 34.58 0 0 73.56 Euglenophyta 36.78 12.26 0 12.26 0 0 Mougeotia sp. 0 0 0 0 0 0 Scenedesmus bijuga 0 0 0 0 0 0 S. incrassatus 318.76 300.37 300.37 502.66 735.60 753.99 Spondylosium sp. 6.13 0 0 0 0 0 Staurodosmus sp. 0 0 0 0 0 0
CHRYSOPHYT A
Achnanthes minutissima 0 18.39 0 0 42.91 0 Diatom 0 0 0 76.96 12.26 0 Dinobryon divergens 6.13 6.13 0 0 0 0
PYRRHOPHYT A
Peridinium 0 0 0 0 12.26 0
OTHERTAXA
Cyst 1 6.13 6.13 12.26 12.26 6.13 6.13 Cyst 2 18.39 18.39 55.17 18.39 12.26 55.17
PROTOZOA
Ciiiate 0 0 0 0 0 6.13 Verticella sp. 0 0 0 0 0 0
TOTALS 1485 1757 1107 853 1800 2173
MEAN LAKE DENSITY 1529
3-33

RESULTS
Table 3-14
Densities (#ceiis mi-1) oi Phytopiankton in the Water Column at Two Sites in Keogh Lake
Station
Taxa KL1A KL1B
CYANOPHYTA
Anacystis sp. 85.82 0 Gloeocapsa sp. 12.26 0 Coelosphaerium sp. 6.13 24.52 Merismopedia sp. 196.16 220.68
CHLOROPHYTA
Chlamydomonas sp. 202.89 220.68 Chlorococcaceae 1888.04 1158.57 Euglenophyta 1244.39 331.02 Spondylosium sp. 0 0 Staurodesmus sp. 0 0
CHRYSOPHYTA
Achnanthes minutissima 220.68 465.88 Cocconeis 61.03 24.53 Diatom 49.04 30.65
PYRRHOPHYT A
Peridinium 6.13 6.13
OTHERTAXA
Cyst 1 0 12.26 "'·~·I) n 4" "<:! VJQI. '- "' ''·'u
TOTALS 3960 2507
MEAN L~KE DENSITY 3234
3 -34

RESULTS
3.4.3 Zooplankton
The early fall zooplankton community in Benson Lake was numerically dominated by
the cladocerans Holopedium gibberum and Eubosmina longispina (in that order) and by
cyciopoid copepods, (Table 3-15). Less dominant organisms included the cladoceran nnnhnin rr>f:Pfl thP r~Ji:\nnin rnnPnnn ninntnff1JJ<' lrnHri<'rlflM<'in .,.,..,:I """'"" •n+U'<>•<' 'Th .. - -r·····- . ----, ---- --.. -·-·- --r-y-- _ ... ,,,.V',, •• ...., J ........... .., ......... kl .... , U...l.U ~V.&J.J.\.t .1.Vl.1.1.V.J..,. .L.llV
cladoceran Alona sp. was rare. A similar assemblage was found in Keogh Lake (Table
3-16). However, in the control lake, Eubosmina longispina was the numerically
dominant cladoceran. Holopedium and daphnia were moderately abundant and present
in roughly equal numbers. In addition, a second calanoid copepod, Epischura nevadensis, which was not found in Benson Lake was present. Some of the less
dominant zooplankters included the predominantly littoral cladocerans Polyphemus pediculus and Scaphaloberis kingii, and the rotifers. Both Polyphemus and Scaphafoberis
are generally rare in coastal lakes, as evidenced by their low number in Keogh Lake.
Thus it is not surprising that they did not show up in Benson Lake samples, but that does
not exclude their presence there.
Ove.rall densities, and densities of individual zooplankton species, were significantly
lower in both Benson and Keogh Lakes than are commonly found during the fall in
coastal British Columbia lakes and in other lakes in Canada (Table 3-17). Whereas
autumn densities of zooplankton in most lakes are in the range of 20 to 200,000
organisms/m3, densities of zooplankton in Benson lake only ranged between 272 and
1,823 organisms/m3 and in Keogh iake between 8,349 and 12,961 organisms/m3. This
discrepancy is probably related to the method used for sampling zooplankton in the
study lakes. The plankton net employed only had a 13 cm diameter opening. Small
diameter plankton nets such as these set up a bow wave when hauled through the water.
Detection of the approaching bow wave elicits an escape response in highly motile
species of zooplankton allowing them to escape capture. In addition, smaller, less
motile organisms, such as rotifers, can be deflected around the net rather than being
drawn into it. As a result, true estimates of zooplankton abundance are often
underestimated when these types of nets are used. However, the data for Benson and
Keogh lakes are useful in that a comparison of relative, rather than actual, densities
hetween lakes can still be made.
The data indicate that relative abundances of zooplankton in vertical net hauls in
Benson Lake were approximately 7 times lower than in Keogh Lake (331 vs 12,961
3 ·35

Table 3-15
Benson Lake - Densities of Zooplankton Captured in Vertical and Horizontal Tows (individuals/m3)
Station Number Date Depth (m) Time Tow Volume (m3) Split
TAXON
ROTATORIA sp.
CLADOCERA Daphnia rosea Eubosmina longirostris Holopedium gibberum Aiona sp.
COPEPODA Diaptomus
franciscansis
"'··-·----:....1_ vy1.,;1uµu1u::;
Cafanoid copepodltes Copepod naUplii
OSTRACODA
NEMATODES
OLIGOCHAETES
CHIRONOMID LARVAE
Total (individuals/m3) Mean lake Density
VNH = Vertical Net Haul HNH:: Horizontal Net Haul
Vii Vim v
Vif Vim I-IV
I-IV
1 14/09/90
47 15:00 VNH 0.679
1
0
6 49 45 2
2 2 6
6 17
111
n :1
4
7
0
2
2
272
2 3 HNT1 14/09/90 14/09/90 14/09/90
60 38 14:45 15:15 12:55 VNH VNH HNT 0.532 0.430 7.04
1 1 0.0625
0 5 2
3 2 17 7 95 31
15 21 636 0 0 0
2 0 0 0 0 0 0 0 0
0 5 0 4 12 4
18 279 50
11 0 0 28 58 0
98 2 0
4 7 0
21 21 0
23 21 0
214 508 740 VNH HNT 331 1251
3 -36
RESULTS
HNT2 14/09/90
13:15 HNT 5.1
0.0312
0
50 176
1207 0
6 0
13
0 13
333
19 6
0
0
0
0
1823

Table 3-16
llal'U''lh I ~.,a - nan~i+i ... 8 ,.... "7AA_ .... _.,. __ "--a ........ =., ....... ~.I .. ,.. ....... - ......... g1u.-g VI '"'"'t"IGI 11\,VI I \o#G.1'UI ~u Ill
Vertical and Horizontal Tows (indivlduals/m3)
Station Number Date Depth (m) Time Tow Volume (m3) Split
TAXON
ROTATORIA sp.
CLADOCERA Daphnia rosea Eubosmina longirostris Polyphemus pediculus Scaphaloberis kingii Holopedium gibberum
COPE PO DA Diaptomus tranciscansis
Epischura nevadensis
Cyc!opoids
Calanoid copepodites Copepod nauplii
HARPACTICOIDS
ACARINA
Total (individuals/m3) I Mean Lake Density ·
VNH = Vertical Net Haul
HNH = Horizontal Net Haul
Vlf Vim v Vlf Vim v
V!f v !-!V
I-IV
1 17/09/90
40 15:45 VNH 0.453 0.0625
883
1095 5581
35 35
1095
71 0 0
35 0
35
212 848
2860
0 106
35
35
12961
3-37
1065
2 17/09/90
15:30 HNT 3.398 0.0313
414
28 5707
56 19 19
18 9 9 9 9
28
452 132
1271
104 85
0
0
8349
RESULTS

Table 3-17
Typical Fan Densities oi Some Crustacean Zoopiankton in a Coastal Lake in British Columbia
Density (#/m3) Source
Rotifer (planktonic) 200 to 300,000 Wetzel 1979
Cladocerons Daphnia rosea 4,000 - 5,000 Werring 1986 Halopedium gibberum 500-1,000 Werring 1986 Bosmina 20-25,000 Werring 1986
Copepods Diaptomus sp. 10 -15,000 Werring 1986 Cyciopoids 5 -10,000
RESULTS
I I
organisms/m3 in Benson and Keogh Lakes, respectively; see Tables 3-15 and 3-16).
Horizontal net tows from Benson Lake yielded approximately 4 times fewer organisms.
No ·comparisons can be made between present and past densities and/or species
compositions of zooplankton in Benson Lake as there are no historical data on
zooplankton population dynamics available.
In summary, it can be concluded that the zooplankton species composition in Benson
Lake in September 1990 was comprised of the same community dominants as in nearby
Keogh Lake, the control lake. The assemblages were the same as those which occur in
many coastal lakes in B.C. (Northcote and Clarotto 1975) differing only in their co
existing copepod species. Densities of zooplankton were between 4 and 7 times lower in
Benson Lake than in the control lake depending on the type of sampling method used.
The higher densities in Keogh lake may be related to the apparent fertilization effect of
the fish farm discussed previously.
3.4.4 Aquatic Vegetation
Aquatic vegetation is well established in the littoral zones of Benson Lake, particularly
along its southern and eastern shorelines (Figure 3-9). A submerged tailings mound is
3-38
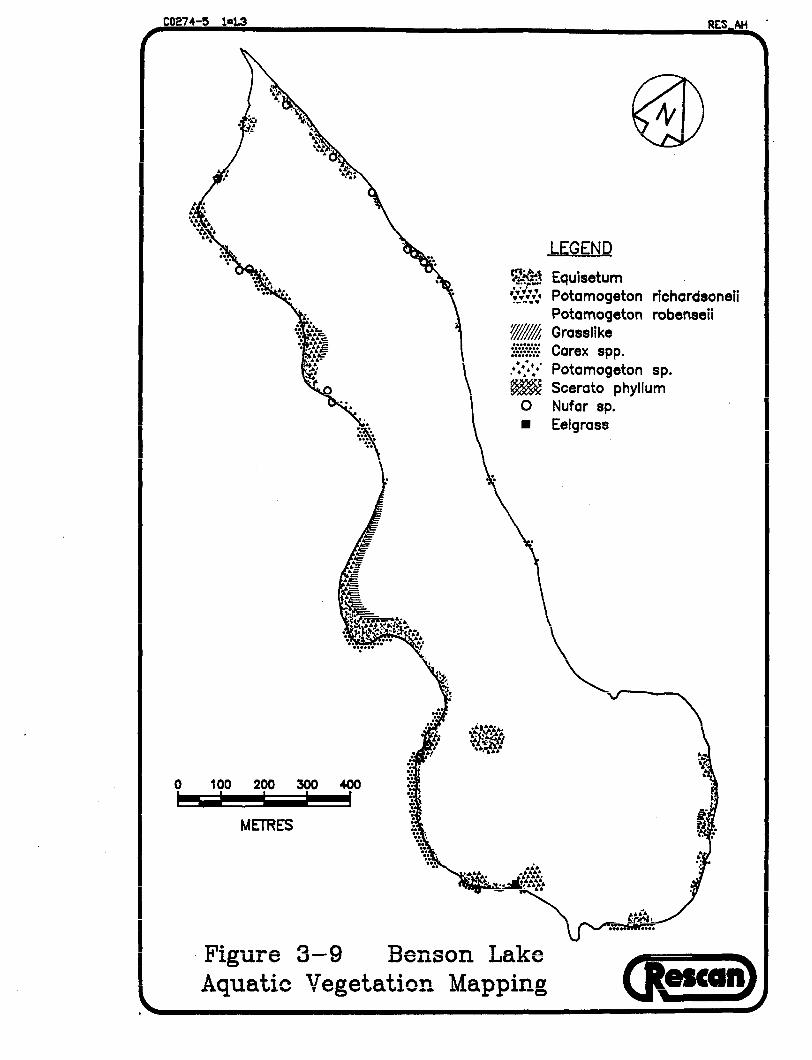
I
I
I
C027 4-~ 1•1.3
•·. . .. .. :.~:~ ·: ,t~
{ ~ ...
·~·· .... .. ..
0 100 200 300 400
METRES
·Figure 3-9
........ ................ ........
\
'D"- rt"- T o i,~ .UC.1..Li:)V.U. .LJQA~
RES AH
LEGEND
Equisetum Potamogeton richardsoneii Potamogeton robenseii Grass like Carex spp • Potomogeton sp. Sceroto phyllum Nufar sp. Eel gross
I
I
I
I
~~~. I ,......~ .. ~ ... ~.=... I
(J(escan))
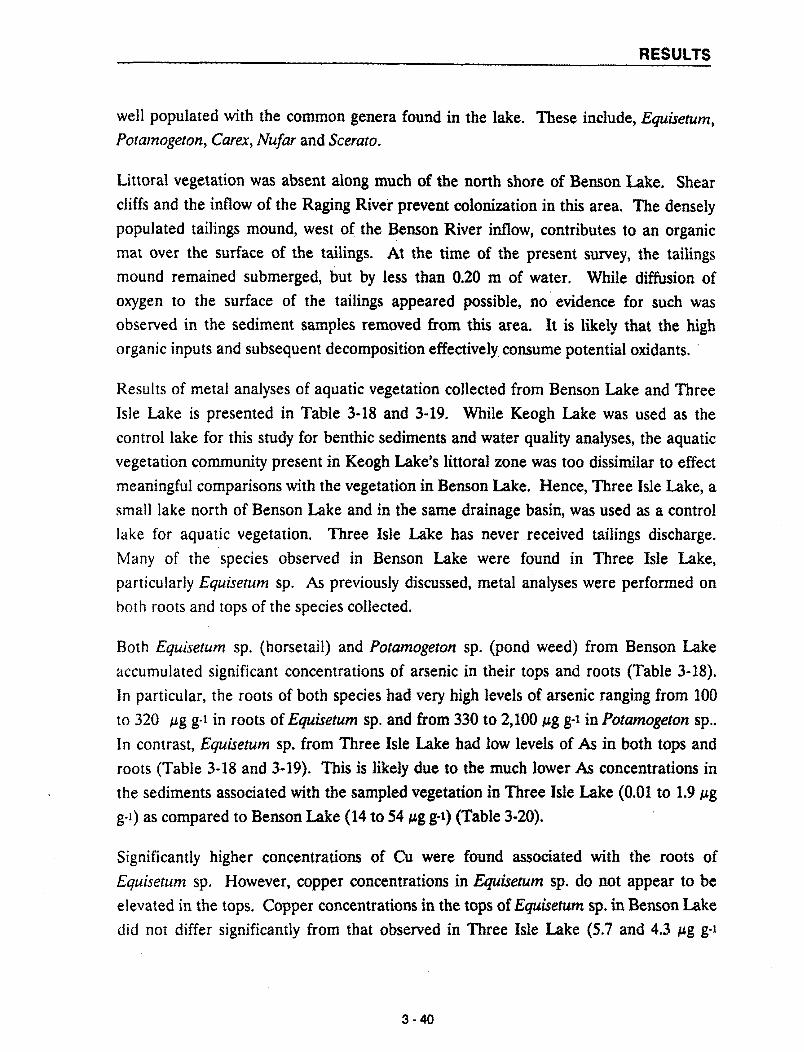
RESULTS
well populated with the common genera found in the lake. These include, Equisetum, Potamogeton, Carex, Nufar and Scerato.
Littoral vegetation was absent along much of the north shore of Benson Lake. Shear
cliffs and the inflow of the Raging River prevent colonization in this area. The densely
populated tailings mound, west of the Benson River inflow, contributes to an organic
mat over the surface of the tailings. At the time of the present survey, the tailings
mound remained submerged, but by less than 0.20 m of water. While diffusion of
oxygen to the surface of the tailings appeared possible, no· evidence for such was
observed in the sediment samples removed from this area. It is likely that the high
organic inputs and subsequent decomposition effectively consume potential oxidants.
Results of metal analyses of aquatic vegetation collected from Benson Lake and Three
Isle Lake is presented in Table 3-18 and 3-19. While Keogh Lake was used as the
control lake for this study for benthic sediments and water quality analyses, the aquatic
vegetation community present in Keogh Lake's littoral zone was too dissimilar to effect
meaningful comparisons with the vegetation in Benson Lake. Hence, Three Isle Lake, a
small lake north of Benson Lake and in the same drainage basin, was used as a control
lake for aquatic vegetation. Three Isle La.lee has never received tailings discharge.
Many of the species observed in Benson Lake were found in Three Isle Lake,
particularly Equisetum sp. As previously discussed, metal analyses were performed on
both roots and tops of the species collected.
Both Equisetum sp. (horsetail) and Potamogeton sp. (pond weed) from Benson Lake
accumulated significant concentrations of arsenic in their tops and roots (Table 3-18).
In particular, the roots of both species had very high levels of arsenic ranging from 100 to 320 µg g-t in roots of Equisetum sp. and from 330 to 2,100 µg g-1 in Potamogeton sp ..
In contrast, Equisetum sp. from Three Isle Lake had low levels of As in both tops and
roots (Table 3-18 and 3-19). This is likely due to the much lower As concentrations in
the sediments associated with the sampled vegetation in Three Isle Lake (0.01 to 1.9 µg
g-1) as compared to Benson Lake (14 to 54 µg g-1) (Table 3-20).
Significantly higher concentrations of Cu were found associated with the roots of
Equisetum sp. However, copper concentrations in Equi.setum sp. do not appear to be
elevated in the tops. Copper concentrations in the tops of Equisetum sp. in Benson Lake
did not differ significantly from that observed in Three Isle Lake (5.7 and 4.3 µg g-1
3-40

Sample Location
BL VEG 1
Bl VEG 2
BL VEG 3
BL VEG 4
TIL VEG 1
TILVEG
Table 3-18
Concentrations of Specific Metals In Benson Lake and Three Isle Lake Aquatic Vegetation
Metals µ.g g-1 (dry tissue)
Species As Cd Co Cu Hg Ni
Equisetum sp. Tops 3.3 0.08 2.6 7.6 0.02 2.8 Roots 150.0 0.12 4.7 29.0 0.03 4.2
Potamogeton sp. Tops 2.3 0.34 4.6 31 0.04 4.6 Roots 910 0.91 8.8 53 0.07 8.8
Equisetum sp. Tops 0.97 0.14 2.0 4.7 0.02 2.9 Roots 150.0 0.16 5.9 30.0 0.04 9.9
Potamogeton sp. Tops 1.9 0.45 2.0 31 0.13 5.6 Roots 420.0 0.37 17.0 180 0.25 16.0
Equisetum sp. Tops 1.9 0.04 0.53 6.8 0.04 2.4 Roots 100.0 0.58 16.0 380.0 0.09 12.0
Potamogeton sp. Tops 0.50 0.49 1.7 44.0 0.05 3.3 Roots 2100.0 0.16 21.0 44.0 0.16 7.1
Equisetum sp. Tops 2.5 0.04 2.0 3.7 0.02 2.8 Roots 320.0 0.14 8.2 110.0 0.04 3.3
Potamogeton sp. Tops 2.5 0.34 2.0 39.0 0.11 2.8 Roots 330.0 0.32 9.3 110.0 0.05 6.8
Equisetum sp. Tops 0.29 0.02 3.1 3.1 0.02 3.6 Roots 3.2 0.33 6.3 15.0 0.03 10.0
Equisetum sp. Tops 0.16 0.08 5.4 5.4 0.09 4.8 Roots 13.0 0.26 14.0 23.0 0.04 13.0
3 -41
RESULTS
Pb Zn
0.09 40.0 2.7 76.0
0.62 50.0 3.0 6o.o
0.04 39.0 4.1 130.0
1.5 70.0 4.9 86.0
0.08 29.0 3.8 63.0
0.09 41.0 0.31 43.0
0.03 35.0 1.1 48.0
0.69 45.0 8.5 47.0
0.03 24.0 0.83 63.0
0.33 36.0 1.8 55.0

RESULTS
Table 3-19
Mean Metal Concentrations In Tops and Roots of Equisetum sp. from Benson Lake and Three Isle Lake {Control)
Benson Lake Three Isle Lake
Element Tops Roots Tops Roots
As 2.2 180 0.23 8.1
Cd 0.08 0.25 0.05 0.29
,..,.. 1 D D "7 1 ,, 1n,, ....,.., ..... u.1 '·' 1u.c;.
Cu 5.7 1-:ta a A ':I ':ID ............. "ToU vu
Pb 0.06 2.9 0.18 ?~ ...... Hn 0.03 0.05 0.05 0.035 .... Ni 2.7 7.4 4.2 11.5
Zn 35.8 79.3 30.0 59
Numbers In bold represent elevated concentrations as compared to control
Values expressed as µ.9 9·1 (dry tissue)
respectively) despite the higher sediment copper concentrations in Benson Lake (110 to
800 µ.g g-1) compared to that in Three Isle Lake (95 to 100 µ.g g-t)(Table 3-20).
Conversely, Potamogeton sp. in Benson Lake had significantly higher concentrations of
Cu in their tops (36.25 µg g-1) than Equisetum sp. indicating highly variable results
between different species. Potamogeton sp. sampled from Benson Lake had higher Cu concentrations in their tops as compared to Potamogeton sp. sampled from Mandy Lake
and Anderson Lake in Manitoba, both of which are lakes which have been subjected to
subaqueous tailings disposal (Table 3-21). All other metals, with the possible exception nf Ni wPrP nrPIO:Pnt in lnwPr rnnrPntrl:ltinn~ in RPn1;nn T ~lrP th!:in in PithPr M!:innu nr -· .... , .... ___ r·-... -··· ........ _ ..... _, .. --··--.. ···-··-· ............ --·---·· ---.- .... _ ........... -····-.. ........... ~J v.a.
Anderson Lake.
Metal levels in tops and roots of two aquatic macrophytes, Equisetum and Potamogeton, has been examined from Benson Lake. Roots typical~y accumulated more metal than
3. 42

RESULTS
Table 3=20
Meta! Levels !n Sediments Associated with Aquatic Vegetation Samples
Metals µ.g g-1 (dry sediment)
Sample As Cd Co Cu Hg Ni Pb Zn
BL VSS *E1 20 0.60 29 180 0.17 37 5.9 180 BL VSS **P1 33 1.0 36 310 0.20 40 9.8 200
BLVSS E2 14 0.51 27 110 0.07 36 5.2 170 l''''U \ Jr. rt r""ll't. 43 0.36 53 850 .0.06 41 7.8 160 CL. V;;);;) r£
01 \I~~ C'.,., ,.,.., ,.. t!:>n ...... .. ...... ,.. ...... ""M 6.2 130 01.. v.;;i.;;i i;;..;> .;>I u.oo .:>~ ouu U.UI £'t
BL VSS P3 54 0.73 43 760 0.02 27 7.1 180
BLVSS E4 43 0.60 36 790 0.04 23 5.1 150 BL VSS P4 51 0.72 42 690 0.02 29 8.3 190
TIL VSS E1 0.01 0.07 56 110 0.19 150 1.7 140 TIL VSS E2 1.9 0.08 59 95 0.12 130 3.5 120
* Sediments associated with Equisetum sp. sample at BL VEG 1 ** Sediments associated with Potamogeton sp. sample at BL VEG 1
the tops and, in some instances, lOS times more metal accumulated in the roots. For
Equisetum sp. collected from Benson and Three Isle Lake, only As was found in greater
concentrations in the tops of plants removed from Benson as compared to the control.
Arsenic concentrations in the associated sediments were 31 times higher for Benson
Lake as compared to Three Isle Lake. While both sediment and root Cu concentrations
were higher for Equisetum sp. in Benson Lake, the corresponding Cu levels in the plant
tops were not significantly greater than that observed in Three Isle Lake for the same
species. These observations attest to the fact that plants can accumulate elevated levels
of metals in their roots, but that translocation from the roots to the shoots is minimal. In
fact, the high levels of some heavy elements in roots may be the result of binding on jOOt
exchange sites and/or membrane surfaces and may represent little or no actual uptake
(Romney and Wallace 1975).
3-43
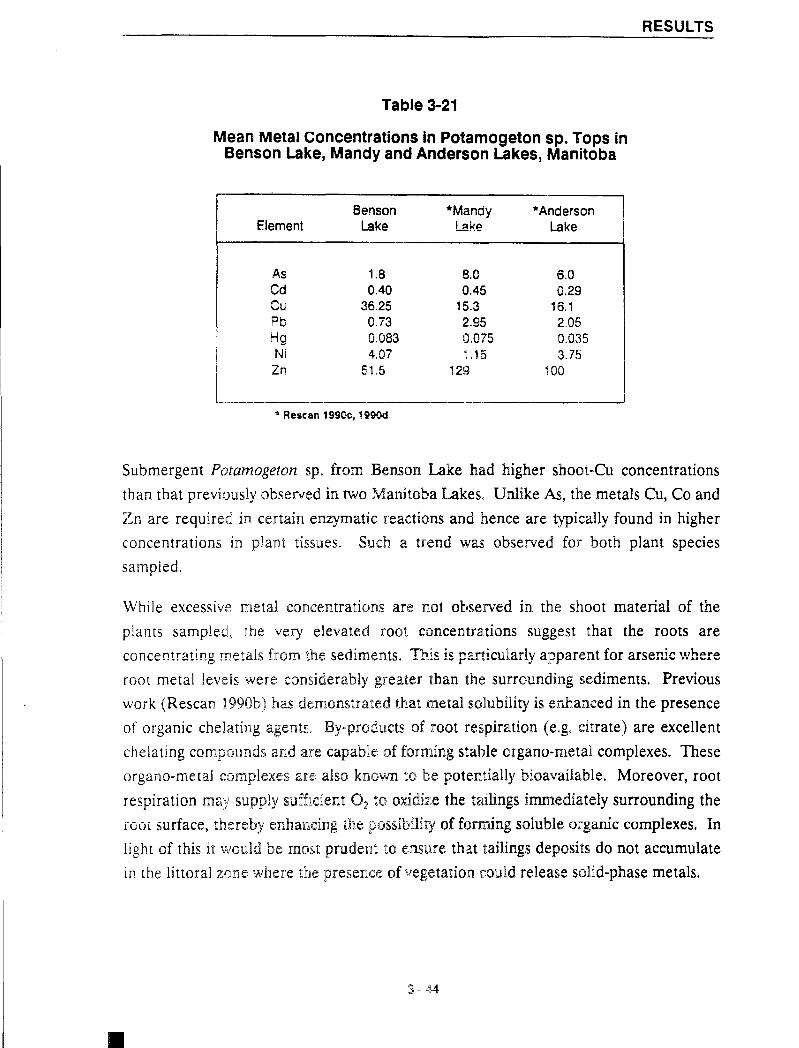
Table 3-21
Mean Metal Concentrations In Potamogeton sp. Tops in Benson Lake, Mandy and Anderson Lakes, Manitoba
Benson *Mandy *Anderson l Element Lake ll"lke Lake
As 1.8 8.0 6.0 Cd 0.40 0.45 0.29 Cu 36.25 15.3 16.1 Pb 0.73 2.95 2.05 Hg 0.083 0.075 0.035 Ni 4.07 1.15 3.75 Zn 51.5 129 100
* Rescan 1990<:, 1990d
RESULTS
Submergent Potamogeton sp. from Benson Lake had higher shoot-Cu concentrations
than that previously observed in two Manitoba Lakes. Unlike As, the metals Cu, Co and
Zn are required in certain enzymatic reactions and hence are typically found in higher
concentrations plant tissues. Such a trend was observed for both plant species
sampled.
While excessive metal concentrations are not observed in the shoot material of the
plants sampled, the very elevated root concentrations suggest that the roots are
root metal levels were considerably greater than the surrounding sediments. Previous
work (Rescan l 990b) has demonstrated that metal solubility is enhanced in the presence
of organic chelating agents. By-products of root respiration (e.g. citrate) are excellent
chelating compounds and are capable of forming stable organo-metal complexes. These
organo-metal complexes are also known w be potentially bioavailable. Moreover, root
respiration may supply sufficient 0 2 to oxidize the tailings immediately surrounding the
root surface, thereby enhancing the possibility of forming soluble organic compiexes. In
light of this it would be most prudent to ensure that tailings deposits do not accumulate
in the littoral zone where the presence of vegetation could release solid-phase metals .
•

RESULTS
... ~ ,. ..... _.~ -'·'+·-' r 1Sn
Gillnet sets in both Benson and Keogh lakes resulted in the capture of 7 rainbow trout
and 1 unidentified salmonid (probably arctic char, Salvelinus alpinus) from Benson Lake
and 2 rainbow and 1 cutthroat trout from Keogh Lake (Table 3-22).
Fish from Benson Lake were significantly larger, both in mean length (Pct~o.19) < 0.001)
and mean weight (Pct~ 0.7o) < 0.001), and had significantly higher condition factors (Pct~
o.i9> < 0.001) than fish from Keogh Lake. However, due to the small sample size from
Keogh Lake (n=3) these data should be interpreted with caution. Furthermore, mature
females (5) were captured in Benson Lake but not in Keogh Lake
The stomach contents of fish from both iakes suggest that aii fish whose stomachs
contained food (with the exception of one fish from Keogh Lake), were feeding, at least .
partially, on organisms commonly found in the water column and/or in, or on, the
benthos in the littoral zone (Table 3-22). Two of the fish from Benson Lake (BLl and
BL5) had been feeding on benthic organisms (the trichopteran Onocosmecus sp.,
gastropods, and bivalves) exclusively.
Metal body burden analyses of fish tissue and liver samples collected from the two lakes
show that the mean concentration of all of the metal species examined were higher in
the flesh of fish from Keogh Lake (control lake) than from Benson Lake (with the
exception of cadmium and cobalt) but were within the range of concentrations for the
same metals in fish tissues and livers from unpolluted Canadian waters (Table J .. 23). Alternatively, concentrations of arsenic, copper, cobalt, and cadmium were significantly
higher in the livers of fish from Benson Lake, suggesting that there may be some
bioaccumulation of these metals from the environment. However, the levels of all
metals in both the flesh and the liver from all fish sampled from both lakes were below
established guidelines for human consumption as set out by the Departments of Health
and Welfare Canada and Fisheries and Oceans Canada (Table 3-23; only four metals
are reguiated to-date. Tney are arsenic, zinc, mercury and iead [DFO 1985]).
3-45

Table 3-22
Condition Factors and Stomach Contents of Fish from Benson and Keogh Lakes
Condition I IV'atlnn 1 .. nnth Weight Factor a..'-'VU&l"'I I ..w••v••• (Sample 1.0) Species (mm) (g) Sex (C.F)* Maturity** Stomach Contents
Benson lake BL1 . RB 192 67 M 0.95 28 trlchopterons, assorted unldentlfed loose stomach contents.
BL2 RB 257 180 F 1.06 M 4 gastropods, 2 trlchopterons, loose stomach contents.
ftlft nn ...... ...... c .. 4ft 1 nesr.atorr.aph, 1 chlro.910.-nld adult, 3 coleoptara, 1 hJT.1EHioptarm Da..J nD tl!.IU 1 IU r '·'"' 1 formlcad, assorted unidentified Insect remains.
DIA RB ">&:.7 1an F 1.06 M c;nn rlatlnrarnnc ln111nhnl111 ("'.arlntli:anhnlA\ ,. trll'hnntarnn!ll .......... ...... ....,., --- _.. ______ -· ·- ,--........ __, --· ·---,.. .... .._,, - .. ·-· ·-... --· -· ._, coleopteron, assorted loose stomach contents.
BL5 RB 270 215 F 1.09 M 53 gasotropods, 1 bivalve, 7 trlchopterons.
BL6 RB 185 60 M 0.95 n/s
BL7 RB 260 195 F 1.11 M n/s
BL8 uo 245 165 F 1.00 M n/s
Ua.an I~ n\ 234.5(31.4) 146.5(59.5) 1 nl:\fn nA\ ···--·· , ___ , ··--,-·--1 Keogh Lake
Kl1 RB 195 70 M 0.94 empty
Kl2 RB 220 95 M 0.89 5 arachnids, 2 hemlpteron notonectlds, 1 hemlpteron adult, 1 hymenopteran, unidentified Insect remains.
KL.3 CT 200 75 M 0.94 1 ephemeropteron adult, 1 empheropteron nymph, 3 trichopterons, 3 arachnids, 2 hemlpterons, 3 dlpteron adult, 1 homopteron, assorted unidentified Insect remains.
I Mean (S.D) 205(13.2) 80.0(13.2) 0.92(0.03)
• CF• Weight (g)/Fork length (mm)' x 100,000 RB • Rainbow Trout CT • Cutthroat Trout ** i • immature; M • Mature UD = Unidentified

Table3-23
Metal Body Burden in Fish Tissue and Livers from Benson and K~ogh Lakes
Sample Species As Cu Co NI Zn Hg Cd Pb
BL1 RB 0.037 0.195 0.026 0.039 3.902 0.024 <0.002 0.020 BL2 RB 0.069 0.193 0.028 0.048 3.252 0.072 <0.002 <0.002 BL3 RB 0.080 0.202 0.017 0.026 3.252 0.022 <0.002 <0.002 ..... ... ... 0.022 0.176 0.009 0.007 2.818 0.098 <0.002 <0.002 DL"I MD
BLS RB 0.039 0.210 0.013 0.024 3.035 0.039 <0.002 0.007
Mean (S.D) 0.049 0.195 0.019 0.029 3.252 0.051 <0.002 0.007
KL1 RB 0.059 0.499 0.043 0.152 4.no 0.238 <0.002 0.039 KL2 RB 0.074 0.282 0.007 0.013 3.902 0.076 <0.002 0.054 KL3 CT 0.074 0.199 0.015 0.009 3.469 0.039 <0.002 0.011
Mean (S.D) 0.069 0.327 0.022 0.058 4.047 0.118 <0.002 0.035
BL 1·5Uver 0.520 32.520 0.210 0.013 21.680 0.061 0.128 0.002
KL 1·3Uver 0.139 4.770 0.035 0.011 23.848 0.082 0.017 0.002
Background Concentrations In fish flesh from unpolluted sources 0.2-0.5 0.5-1.53 0.12-0.17 4.7-17.2 <0.5 <0.06 0.04-1.31
Background concentrations In liver of fish from unpolluted sources 1.5-28.0 11-48 <0.06 0.12-3.2
Sources Demayo et al Demayo and Demayo et al Taylor and Reeder et al Reeder et al Demayo et al 1980 Taylor 1981 1980 Demayo 1980 1979 1979 1980
Cdn. Standard for Human Consumption 3.5 100 0.5 10
All ...... ..,, ........ ,,,., ,.1 (ppm) w9t w.lght. AB • A•lnbow Trout CT = Cutthroat Trout
4 - Conclusions
(flescan)
4.0 CONCLUSiONS
Historical disposal of reactive mine tailings in Be11son T ~ke had an LnJtial negative
impact on water quality and biological communities, particularly benthic, within the
lake. This impact appears to have been only temporary. The following summarizes the
most salient points of the present study which have led to the above conclusion.
Benson Lake water quality has been compared to that of Keogh Lake which has never
received tailings discharge. Both lakes are categorized as being oligotrophic on the basis
of their water quality. The lakes did not differ significantly in their concentration of
dissolved metals of environmental concern. Both lakes have anaerobic conditions near
the surface of their profundal sediments. This has been partially attributed to .·
decomposition of organic material in the top 5 cm of the lake sediments. Benson Lake
water quality is considered good and any negative impact resulting from previous tailings
deposition is no longer apparent.
Detailed petrographic and sediment metal analyses of submerged and land disposed
tailings revealed that lake tailings were mineralogically distinct from the land tailings.
Both iake and iand taiiings contained very eievated concentrations of copper. Suiphides,
while relatively sparse in the submerged tailings, showed no signs of post-depositional
oxidation. The chalcopyrite in the land tailings was also relatively fresh, however,
considerable iron-staining in the sample suggested percolation of iron-rich acid waters
had precipitatec;I secondary iron oxides.
Sequential extractions performed on the above samples indicated that the land tailings
released low levels of metals in the water soluble phase, whereas virtually no metals
were released from the same phase in the lake tailings sample. Most metals were
associated with the residual, biologically inactive phase in both samples. However,
significant quantities (5 to 55%) of metals were associated with the oxidizable phase in
the lake tailings sample. These results suggest that co11siderable binding of metals to
organic matter may be occurring in the lake sediments. Thus, metal scavenging by
organics may be preventing the efflux of metals from the benthic sediments to the
overlying water column.
4 -1
CONCLUSIONS
The observed densities of benthic organisms in Benson Lake were typicai of oiigotrophic
lakes in Canada and elsewhere. The benthic communitv in Benson Lake annears to - - -·cc - --- - - -
have re-established itself to pre-tailings deposition conditions. Phytoplankton and
zooplankton densities differed between· Benson and Keogh Lakes, with densities being
greater in the control lake. These differences are largely ascribable to a fertilization
effect on Keogh Lake resulting from operation of a fish farm. The species and densities
observed in both lakes were typical of coastal lakes in British Co_lumbia.
Metals, particularly As, were accumulated in the roots, and to a much lesser extent in
the tops, of Equisetum sp. in Benson Lake as compared to that observed in Three Isle
Lake for the same species. This may be a function of the significantiy higher sediment
As concentrations in Benson Lake. Copper did not accijmulate in the tops of Eq.,1,isetr.,1,m sp. in Benson Lake despite high root-Cu concentrations and high sediment-Cu levels.
While aquatic plants are not accumulating metals to harmful levels, the roots are
concentrating metals from the surrounding sediments. The potential for forming stable,
soluble organo-metal complexes and subsequent release to the water column is
therefore enhanced. This potential should be minimized in the future by ensuring that
the areal extent of tailings deposition in lakes is confined to the profundal zones, not in
Analyses of metal body burden in fish from Benson Lake indicated that all metals
waters. For most metals, fish from Benson Lake had lower tissue metal levels than
those from Keogh Lake. These results further support the general observation that
impacts related to tailings deposition in Benson Lake were temporary and are no longer
apparent.
4-2
References
{i(escan)
REFERENCES
Abbey, S. 1980. Studies in "standard samples" for use in the general analysis of silicate rocks and minerals, Part 6: 1979 Edition of "Useable" Values.
APHA 1985. Standard Methods for the Examination of Water and Wastewater.
American Public Health Association, Washington D.C.
Cook, D.G and M.G. Johnson. 1974. Benthic macroinvertebrates of the St. Lawrence Great Lakes. J. Fish. Res. Board Can. 31(5): 763-782.
Cook, G.W., and C. Risley. 1963. The distribution of phytoplankton and benthic fauna
of Lake Michigan. U.S. Dept. Health Educ. Welfare, Great Lakes - ID. Rive
Basins Proj., P.H.S. Region V. Chicago. 12 p.
Cummins, K. W. and G.H. Lauff. 1969. The influence of particle size on the
microdistribution of stream macrobenthos. Hydrobiologica. 34:145-181.
DFO. 1985. Guidelines for metals in fish for human consumption. Unpublished
report. Department of Fisheries and Oceans Canada Fish Inspection Branch, Vancouver, British Columbia.
Demayo, A, and :M.C. Taylor. 1981. Guidelines for Surface \Vater Qualit;. Volume I -Inorganic Chemical Substances - Copper. Environment Canada, Inland Waters
Directorate, Water Quality Branch, Ottawa, Canada.
Demayo, A, M.C. Taylor and S.W. Reeder. 1979. Guidelines for Surface Water
Quality. Volume I - Inorganic Chemical Substances - Arsenic. Environment
Canada, Inland Waters Directorate, Water Quality Branch, Ottawa, Canada.
Demayo, A, M.C. Taylor and S.W. Reeder. 1980. Guidelines for Surface Water
Quality. Voiume i - inorganic Cnemicai Substances -Lead. Environment Canada,
lriJand Waters Directorate, Water Quality Branch, Ottawa, Canada.
REFERENCES
Engler, R.M., J.M. Brannon and J. Rose. 1974. A practical selective extraction
procedure for sediment characterization. Presented. at the Symposium on
Chemistry of Marine Sediments, National Chemical Society Meeting, Atlantic
City, NJ.
Evans, LI. 1989. Chemistry of metal retention by soils. Environ. Sci. Technol. 23:1047-
1056.
Forstner, U. and G.T.W. Wittmann. 1983. Metal Pollution in the Aquatic Environment.
Springer-Verlag, New York.
Hallam, R., R. Kussat and M. Jones. 1974. A biological assessment of Benson Lake
following cessation of deep lake tailings disposal. Environmental Protection
Service Canada (Pacific Region) Surveillance Rpt BPS 5-PR-74-2.
Harvey, P.K., and B.P. Atkin. 1982. The estimation of mass absorption coefficients by
Compton scattering: extensions to the use of RhKa Compton radiation and
intensity ratios. Am. Mineral. 67: 534-537.
Hutchinson, G.E. 1967. A Treatise on Limnology. Volume II - Introduction to Lake
Biology and Limnoplankton. John Wiley and Sons, Inc. New York.
Hutchinson, G.E. 1957. A Treatise on Limnology. Volume I - Geography, Physics and
Chemistry. John Wiley and Sons, Inc. New York.
Kathman. D. 1991. Personal communication. Woodward Clyde and Associates.
Franklin, Tennessee, U.S.A.
Kussat, R.H., M. Jones and B. Lawley. 1972. A cursory evaluation of the deep lake
tailings disposal system at Cominco's Benson Lake operation. Department of the
Environment Canada, Fisheries Service Manuscript Report 1972 - 1.
Nielsen, LA. and D.L Johnson (eds.) 1983. Fisheries Techniques. American Fisheries
Society, Bethesda, Maryland. 468 p.
Nirel, P.M.V and P.M.M. Morel. 1990. Pitfalls of sequential extractions. Wat. Res.
24:1055-1056.
R-2

REFERENCES
Norrish, K. and J.T. Hutton. 1969. An accurate X-ray spectrographic method for the analysis of a wide range of geological samples. Geochim. Cosmochim. Acts 33:
431-453.
Northcote, T. G., and R. Clarotto. 1975. Limnetic macrozooplankton and fish
predation in some coastal British Columbia lakes. Verb. Internat. Verein. Limnol.
19: 2378-2393.
Pennak, R.W. 1978. Freshwater Invertebrates of the United States. 2nd Edition. John
Wiley and Sons.
Reeder, S.W., A. Demayo, and M.C. Taylor. 1979. Guidelines for Surface Water
Quality. Volume I - Inorganic Chemical Substances - Cadmium. Environment
Canada, Inland Waters Directorate, Water Quality Branch, Ottawa, Canada.
Reeder, S.W., A. Demayo, and M.C. Taylor. 1979. Guidelines for Surface Water Quality. Volume I - Inorganic Chemical Substances - Mercury. Environment
Canada, Inland Waters Directorate, Water Quality Branch, Ottawa, Canada.
Rescan. 1990a. A Preliminary Assessment of Subaqueous Tailings Disposal in Benson Lake, British Columbia. Prepared for Mine Env. Neutral Drain. Prog.
CANMET /Environment Canada.
Rescan. 1990b. Geochemical Assessment of Subaqueous Tailings Disposal in Buttle Lake, British Columbia. Prepared for Mine Env. Neutral Drain. Prog.
CANMET /Environment Canada.
Rescan. 1990c. A Preliminary Assessment of Subaqueous Tailings Disposal in
Anderson Lake, Manitoba. Prepared for Mine Env. Neutral Drain. Prog.
CANMET /Environment Canada.
Rescan. 1990d. A Preliminary Assessment of Subaqueous Tailings Disposal in Mandy
Lake, Manitoba. Consultants Report. Prepared for Mine Env. Neutral Drain.
Prog. CANMET /Environment Canada.
R-3

REFERENCES
Romney, E.M. and A Wallace. 1975. Roots of higher plants as a barrier to translocation of some metals to shoots of plants. /n: Biological Implications of Metals in the Environment. Fifteenth Annual Hanford Life Sci. Symp. Richland, Wash. USA
Schelske, C.L., and J.C. Roth. 1973. Limnological survey of lakes Michigan, Superior, Huron and Erie. Univ. Michigan Great Lakes Res. Div. Publ. 17: 1-108.
Shrivastava, H.N. 1974 Macrobenthos of Lake Huron. J. Fish: Res. Board. Can. Tech. Rep.449.
Taylor, M.C., A Demayo and S.W. Reeder. 1979. Guidelines for Surface Water Quality. Volume I - Inorganic Chemical Substances • Nickel. Environment Canada, Inland Waters Directorate, Water Quality Branch, Ottawa, Canada.
Taylor, M.C., and A Demayo. 1980. Guidelines for Surface Water Quality. Volume I -Inorganic Chemical Substances - Zinc. Environment Canada, Inland Waters Directorate, Water Quality Branch, Ottawa, Canada.
Teter, H.E. 1960. The bottom fauna of Lake Huron. Trans. Am. Fish. Soc. 89: 193-197.
Torke, B.G. 1974. An Illustrated Guide to the Identification of the Planktonic Crustaceans of Lake Michigan With Notes on Their Ecology. Special Report No. 17. University of Wisconsin.
Torke, B.G. 1976. A Key to the Identification of Cyclopoid Copepods of Wisconsin With Notes on Their Distribution and Ecology. Research Report 88. Department of Natural Resources, Wisconsin.
Ward, H.B., and G.C. Whipple. 1963. Fresh Water Biology. 2nd Edition. John Wiley
and Sons.
Weirs, AP., and D.M. Rosenberg. 1984. Effect of impoundment and river diversion on profundal macrobenthos of Southern Indian Lake, Manitoba, Canada. J. Fish. Aquat. Sci. 41(4): 638-648.
R-4

REFERENCES
Werring. J. 1986. Fertilization of an Oligotrophic Montane Lake Using Frequent Doses of High N:P Ratio Fertilizers: Effects on Phytoplanton and Zooplankton Community Structure. M.Sc .. Thesis, University of British Columbia, Vancouver, B.C.
Wetzel, R.G. 1979. Limnology. W.B. Saunders, Toronto.
Wilson, D. 1984. A background study of Trout (Embury) and Cliff Lakes, Manitoba. Envir. Workpl. Safety Health Wat. Stand. Studies Rep. #84-7: 40 pp.
R-5
Appendix A
Hydroiogic Data
(j\escan)

TableA-1
Estimated Inflow and Outflow Rates To/From Benson Lake September 13-17, 1991
Stream
Inflow Raging River Upper Benson River Craft Creek
Total Inflow
Outflow Lower Benson River
Total Outflow
A-1
Discharge (m3 s·1)
1.66 0.28 0.14
2.08
1.88
1.88
APPENDIX A

TableA-2
Lower Benson River Discharge
Distance from Left Bank Depth Velocity Discharge
{m) {m) (m s-1) (cum s-1)
0 0 0 0 2 0.2 0.03 0.009 3 0.4 0.06 0.0255 4 0.45 0.11 0.051 5 0.42 0.13 0.0783 6 0.55 0.23 0.13095 7 0.4 0.31 0.154375 8 0.4 0.34 0.098 9 0.54 0.15 0.0564 10 0.45 0.09 0.091575 11 0.55 0.28 0.1175 12 0.67 0.19 0.1281 13 0.72 0.23 0.156375 14 0.68 0.22 0.133 15 0.53 0.16 0.117975 16 0.6 o.23 0.138425 17 0.6 0.26 0.108 18 0.68 0.1 0.0832 19 0.55 0.16 0.083025 20 0.5 0.11 0.05775 21 0.35 0.11 0.0425 22 0.3 0.09 0.014625
I Total Discharge 1.875575
Discharge calculated as :E(DL+ 1-D)*({DepL+ 1+D)/2)*((VL+ 1 + V)/2)
D= Distance from left bank (m)
Dep=Depth
V= Velocity (m s·1)
n=wetted width of stream (m)
A-2
APPENDIX A

TableA-3
Raging River Discharge
Distance from left Bank Depth Velocity
(m) (m) (m s·1)
0 0 0 1 0.05 0 2 0.09 0.23 3 0.12 0.2 4 0.25 0.35 5 0.26 0.02 6 0.28 0.3 7 0.2 0.25 8 0.1 0.04 9 0.28 0.26 10 0.4 0.34 11 0.36 0.54 12 0.36 0.18 13 0.32 0.48 14 0.25 0.42 15 0.15 0.7 16 0.36 0.25 17 0.25 0.05 18 0.35 0.06 19 0.4 0.3 20 0.45 0.65 21 0.35 0.12 22 0.28 0.17 23 0.05 0
Total Discharge
Total Inflow
O= Distance from left bank (m)
Oep=Depth
V=Veloc:lty (m s·1)
n =wetted width of stream (m)
A-3
Discharge (cum s·1)
0 0.002875 0.01505 0.028875 0.034225 0.0408 0.07425 0.0348 0.0225 0.057 0.1496 0.1368 0.1188 0.153 0.1596 0.095 0.03825 0.016775 0.054 0.178125 0.163625 0.058 0.026775 0
1.65585
2.080288
APPENDIX A

TableA-4
Craft Creek Discharge
Distance from Left Bank Depth Velocitv -- - ---,,
(m) (m) (m s-1)
0 0 0 1 0.2 0
1.5 0.28 0.02 2 0.3 0.19
2.5 0.25 0.13 3 0.25 0.07
3.5 0.2 0.14 4 0.2 0.04
4.5 .0.2 0.03 5 0.2 0.06
5.5 0.2 0.05 6 0.25 0.14
6.5 0.15 0.24 7 0.1 0.09
7.5 0.05 0.03 8.4 0 0
Total Discharge
D= Distance from left bank (m)
Dep=Depth
n=wetted width of stream (m)
A-4
Discharae - ---- --- _,-(cum s-1)
0 0.001 0.0126 0.0232 0.01375 0.013125 0.010125 0.0035 0.0045 0.0055 0.0095 0.021375 0.0165 0.00375 0.000563 0
0.138988
APPENDIX A

TableA-5
Raging River Discharge
Distance from Left Bank Depth Velocity Discharge
(m) (m) (m s-1) (cum s·1)
0 0 0 0 2 0.05 0 0.0005 3 0.18 0.02 0.002875. 4 0.24 0.03 0.0042 .5 0.22 0.01 0.00575 6 0.03 0.04 0.0078 7 0.28 0.02 0.00725 8 0.04 0.03 0.0136 9 0.45 0.05 .0.017
10 0.45 0.03 0.02025 11 0.4 0.06 0.023375 12 0.44 0.05 0.0231 13 0.4 0.06 0.021 14 0.4 0.04 0.022 15 0.55 0.07 0.0285 16 0.5 0.05 0.021 17 0.4 0.03 0.01575 18 0.4 0.04 0.016 19 0.2 0.04 0.012 20 0.25 0.04 0.01125 21 0.2 0.06 0.007875 22 0.2 0.01 0.003 23 0.3 0.02 0.0025 24 0.35 0 0.00325 25 0.35 0.02 0.00525 26 0.5 0.01 0.00425 27 0.5 0.01 0.005 28 0.4 0.01 0.00225
Total Discharge 0.28545
Discharge celcu!eted as E(DL+ 1-DJ*((DepL+ 1+DJ/2)*((VL+ 1+VJ/2)
D =Distance from left bank (m)
Dep=Depth
V=Veloclty (m s·l)
n =wetted width of stream (m)
APPENDIX A
Appendix B
Water Quaiity Data
(J(escan)
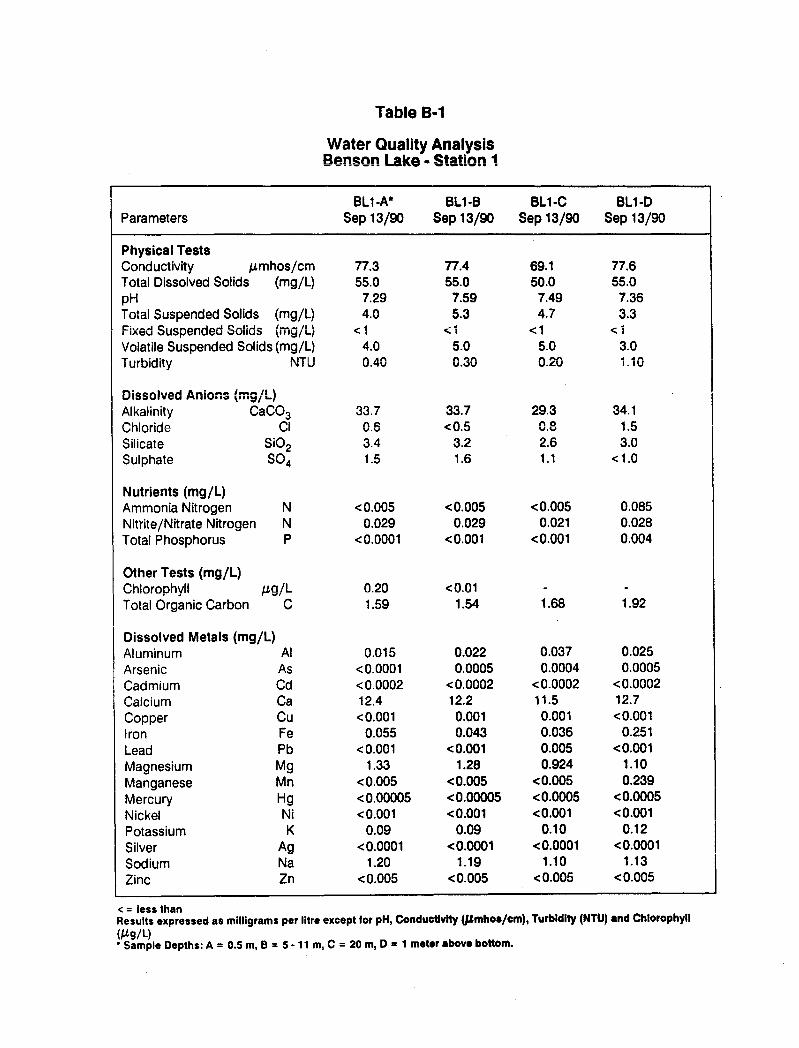
Table B-1
Water Quality Analysis Benson Lake - Station 1
BL1-A• BL1-B BL1-C BL1-D Parameters Sep 13/90 Sep 13/90 Sep 13/90 Sep 13/90
Physical Tests Conductivity µmhos/cm 77.3 77.4 69.1 77.6 Total Dissolved Solids (mg/L) 55.0 55.0 50.0 55.0 pH 7.29 7.59 7.49 7.36 Total Suspended Solids (mg/L) 4.0 5.3 4.7 3.3 Fixed Suspended Solids 1-- II\ -. <i <1 <1 \"'YI L./ c;. I
Volatile Suspended Solids (mg/L) 4.0 5.0 5.0 3.0 Turbidity 11.ITll n An n .,n " "'" i. iO ·~•u v ... v v.uv v . ..:::u
Dissolved Anions (mg/L) Alkalinity CaC03 33.7 33.7 29.3 34.1
Chloride f'I n~ ..-nc no 4 c '-'' "'" ....... u • .J u.u ......
Silicate Si02 3.4 3.2 2.6 3.0 Sulphate S04 1.5 1.6 1.1 <1.0
Nutrients (mg/L) Ammonia Nitrogen N <0.005 <0.005 <0.005 0.085
Nitrite/Nitrate Nitrogen N 0.029 0.029 0.021 0.028
Total Phosphorus p <0.0001 <0.001 <0.001 0.004
Other Tests (mg/L) Chlorophyll µg/L 0.20 <0.01 Total Organic Carbon c 1.59 1.54 1.68 1.92
Dissolved Metals (mg/L) Aluminum Al 0.015 0.022 0.037 0.025
Arsenic As <0.0001 0.0005 0.0004 0.0005
Cadmium Cd <0.0002 <0.0002 <0.0002 <0.0002
Calcium Ca 12.4 12.2 11.5 12.7
Copper Cu <0.001 0.001 0.001 <0.001
Iron Fe 0.055 0.043 0.036 0.251
Lead Pb <0.001 <0.001 0.005 <0.001
Magnesium Mg 1.33 1.28 0.924 1.10
Manganese Mn <0.005 <0.005 <0.005 0.239
Mercury Hg <0.00005 <0.00005 <0.0005 <0.0005
Nickel Ni <0.001 <0.001 <0.001 <0.001
Potassium K 0.09 0.09 0.10 0.12
Silver Ag <0.0001 <0.0001 <0.0001 <0.0001
Sodium Na 1.20 1.19 1.10 1.13
Zinc Zn <0.005 <0.005 <0.005 <0.005
<=less than Results expressed as milligrams per litre except for pH, Conductivity (µmhoa/cm), Turbidity (NTU) and Chlorophyll (/,Lg/L) • Sample Depths: A = 0.5 m, B = 5 • 11 m, C = 20 m, 0 = 1 meter above bottom.

Table B-2
Water Quality Analysts Benson Lake - Station 2
Bl.2-A" Bl.2-B Parameters Sep 13/90 Sep 13/90
Physical Tests Conductivity µmhos/cm 76.6 68.8 Total Dissolved Solids (mg/L) 55.0 50.0 pH 7.70 7.62 Total Suspended Solids (mg/l) <1.0 4.0 Fixed Suspended Solids (mg/L) <1 <1 Volatile Suspended Solids (mg/L) <1.0 4.0 Turbidity NTU 0.40 0.20
Dissolved Anions (mg/L) Alkalinity CaC03 33.8 29.7 Chloride Cl 0.6 0.7 Silicate Si02 3.3 2.6 Sulphate $04 1.4 1.3
Nutrients (mg/L) Ammonia Nitrogen N 0.005 <0.005 Nitrite/Nitrate Nitrogen N 0.021 0.046 Total Phosphorus p 0.003 <0.001
Other Tests (mg/L) Chlorophyll µg/L 0.01 0.12 Total Organic Carbon c 1.54 1.45
Dissolved Metals (mg/L) Aluminum Al 0.030 0.034 Arsenic As 0.0003 0.003 Cadmium Cd <0.0002 <0.0002 Calcium Ca 12.1 11.4 Copper Cu 0.001 0.003 Iron Fe 0.055 <0.030 Lead Pb <0.001 <0.001 Magnesium Mg 1.30 0.949 Manganese Mn <0.005 <0.005 Mercury Hg <0.00005 <0.00005 Nickel Ni <0.001 0.001 Potassium K 0.09 0.09 Silver Ag <0.0001 <0.001 Sodium Na 1.19 1.08 Zinc Zn <0.005 <0.005
<=Jess than
Bl.2-C Bl.2·0 Sep 13/90 Sep 13/90
68.7 78.4 . 50.0 55.0
7.59 7.45 2.0 10.7 1.0 <1 1.0 10 0.30 1.60
29.0 33.8 1.1 1.1 5.6 3.3 1.2 <1.0
0.006 0.096 0.039 0.034 0.001 0.012
. . 1.64 2.01
0.032 0.018 0.0003 0.0004
<0.0002 <0.0002 11.0 12.3 0.001 <0.001 0.039 0.215
<0.001 <0.001 0.947 1.10
<0.005 0.351 <0.00005 <0.00005 <0.001 <0.001
0.10 0.13 <0.0001 <0.0001
1.08 1.12 <0.005 <0.005
Results expressed as milligrams per litre except for pH, Conductivity (pmho1/cm), Turbidity (NTU) and ~hlorophyll (j.Lg/l)
Sample Depths: A = 0.5 m, B = 5 • 11 m, C = 20 m, D = 1 meter above bottom.
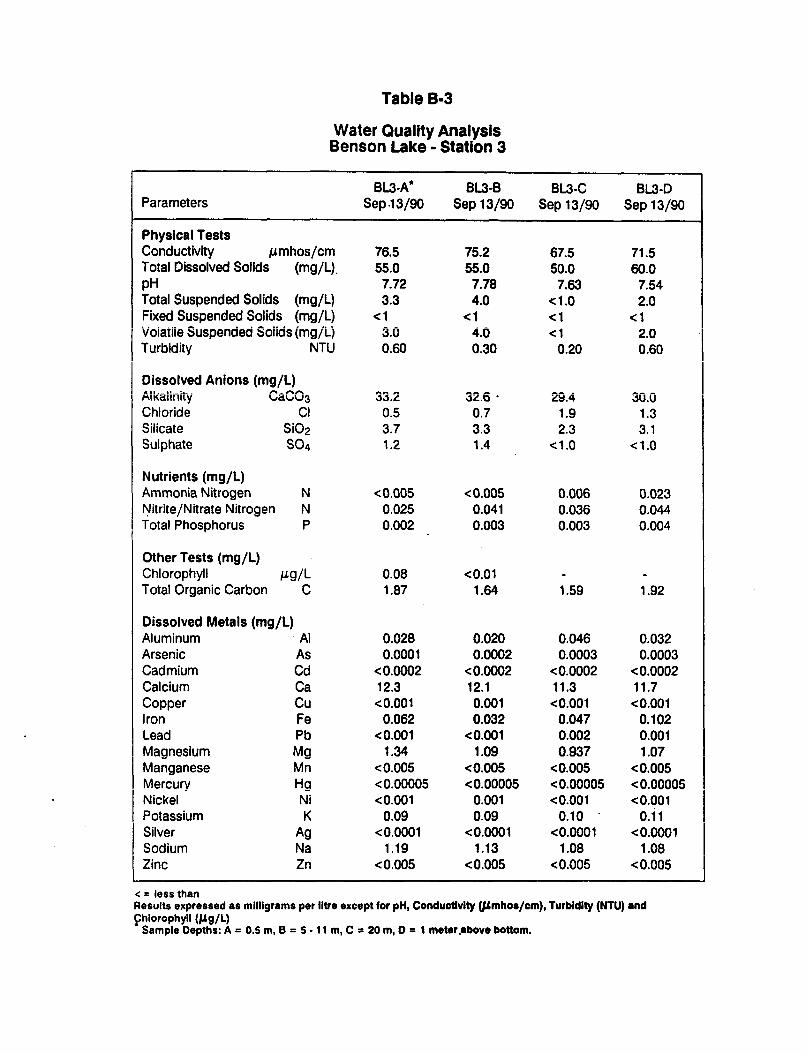
Table B-3
\A1 ... + ..... n ..... u ••• A ..... a. .... ; ... WW~U'WI ,,_"GIUJ rtllGIJ~I~
Benson Lake • Station 3
BL3-A* BL3-B BL3-C BL3-D Parameters Sep.13/90 Sep 13/90 Sep 13/90 Sep 13/90
Physical Tests Conductivity µmhos/cm 76.5 75.2 67.5 71.5 Total Dissolved Solids (mg/L). 55.0 55.0 50.0 60.0 pH 7.72 7.78 7.63 7.54 Total Suspended Solids (mg/L) 3.3 4.0 <1.0 2.0 Fixed Suspended Solids (mg/L) <1 <1 <1 <1 I Voiatiie Suspended Soiids (mg/L) 3.0 4.0 <1 2.0
·1 Turbidity NTU 0.60 0.30 0.20 0.60
I Dissolved Anions (mg/L) I A 11._I!._! ..... ,...._,.....,..... 33.2 32.6. 29.4 30.0 l'\1Ka11rnty 1.;a1.;u3
Chloride Cl 0.5 0.7 1.9 1.3 Silicate Si02 3.7 3.3 2.3 3.1 Sulphate S04 1.2 1.4 <1.0 <1.0
Nutrients (mg/L) Ammonia Nitrogen N <0.005 <0.005 0.006 0.023 Nitrite/Nitrate Nitrogen N 0.025 0.041 0.036 0.044 Total Phosphorus p 0.002 0.003 0.003 0.004
nth .. r T .... t .. lrnn /I \ """"' '""' I,_...,. • ...,. \Ill~/ .. ,
Chlorophyll µ.g/L 0.08 <0.01 T nti:il firni:ini,.. r.i:irnnn c 1.87 1.64 1.59 1.92 . -·-·-·::JI-"''""""--·--·· Dhi~nlvAtf MAtal~ Ima /I \ _____ ,.. .. __ ..... _ .. ___ , ••• l!/11 -1
Aluminum Al 0.028 0.020 0.046 0.032 Arsenic As 0.0001 0.0002 0.0003 0.0003 Cadmium Cd <0.0002 <0.0002 <0.0002 <0.0002 Calcium Ca 12.3 12.1 11.3 11.7 Copper Cu <0.001 0.001 <0.001 <0.001 Iron Fe 0.062 0.032 0.047 0.102 Lead Pb <0.001 <0.001 0.002 0.001 Magnesium Mg 1.34 1.09 0.937 1.07 Manganese Mn <0.005 <0.005 <0.005 <0.005 Mercury Hg <0.00005 <0.00005 <0.00005 <0.00005 Nickel Ni <0.001 0.001 <0.001 <0.001 Potassium K 0.09 0.09 0.10 0.11 Silver Ag <0.0001 <0.0001 <0.0001 <0.0001 Sodium Na 1.19 1.13 1.08 1.08 Zinc Zn <0.005 <0.005 <0.005 <0.005
<=less than Results expressed as mllllgrams per lltre except for pH, Conductivity (l.&mhoa/cm), Turbidity (NTU) and ~hlorophyll (IJg/L)
Sample Depths: A = 0.5 m, B = 5 - 11 m, C = 20 m, D = 1 meter ,above bottom.
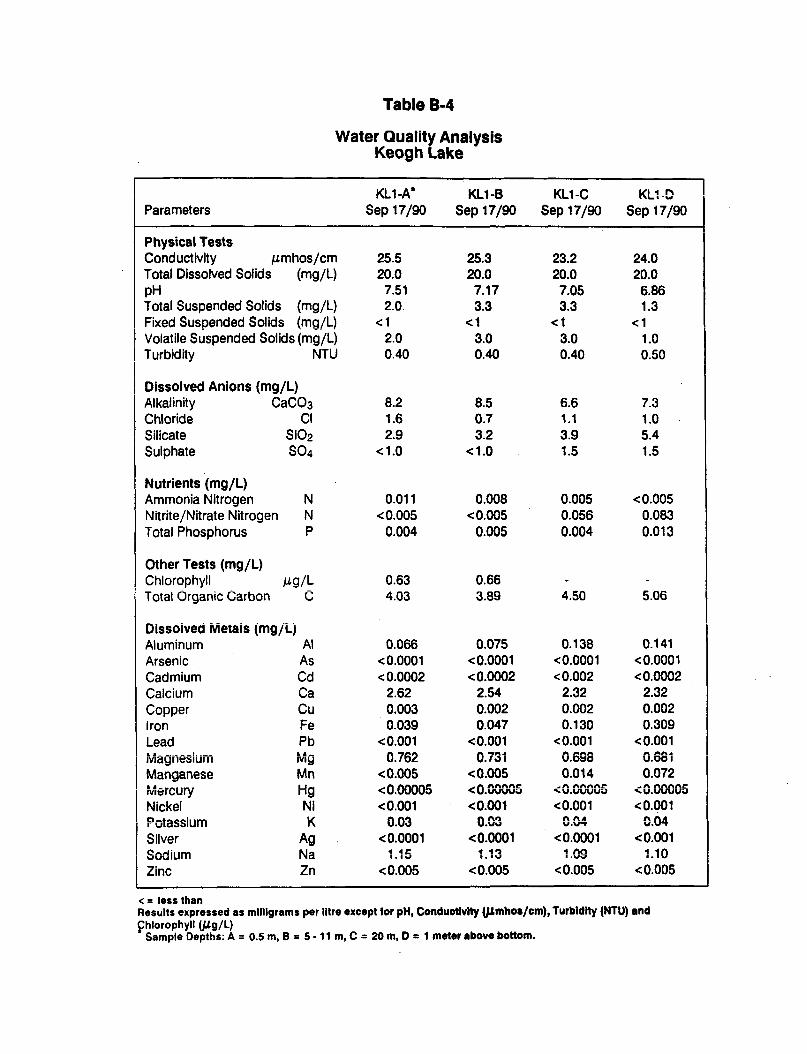
Table B-4
Water Quality Analysis Keogh Lake
KL1-A* t<'.L1-B Ill 1_f"' 1<1 1 _n . .._.-...., ''~1-w
Parameters Sep 17/90 Sep 17/90 Sep 17/90 Sep 17/90
Physical Tests Conductivity µmhos/cm 25.5 25.3 23.2 24.0 Total Dissolved Solids (mg/L) 20.0 20.0 20.0 20.0 pH 7.51 7.17 7.05 6.86 Total Suspended Solids (mg/L) 2.0 3.3 3.3 1.3 Fixed Suspended Solids (mg/L) <1 <1 <1 <1 Volatile Suspended Solids (mg/L) 2.0 3.0 3.0 1.0 Turbidity NTU 0.40 0.40 0.40 0.50
Dissolved Anions (mg/L) Alkalinity CaC03 8.2 8.5 6.6 7.3 Chloride Cl 1.6 0.7 1.1 1.0 Silicate Si02 2.9 3.2 3.9 5.4 Sulphate S04 <1.0 <1.0 1.5 1.5
Nutrients (mg/L) Ammonia Nitrogen N 0.011 0.008 0.005 <0.005 Nitrite/Nitrate Nitrogen N <0.005 <0.005 0.056 0.083 Total Phosphorus p 0.004 0.005 0.004 0.013
Other Tests (mg/L) Chlorophyll µg/L 0.63 0.66 Total Organic Carbon c 4.03 3.89 4.50 5.06
Dlssoived Metais (mg/L) Aluminum Al 0.066 0.075 0.138 0.141 Arsenic As <0.0001 <0.0001 <0.0001 <0.0001 Cadmium Cd <0.0002 <0.0002 <0.002 <0.0002 Calcium Ca 2.62 2.54 2.32 2.32 Copper Cu 0.003 0.002 0.002 0.002 Iron Fe 0.039 0.047 0.130 0.309 Lead Pb <0.001 <0.001 <0.001 <0.001 Magnesium ··- I\ .,~,... "*91\•
I\ "'"""' " ,..,,. ..
IVIY U.10£ U.f.> I u.~o u.001 Manganese Mn <0.005 <0.005 0.014 0.072 . ·----· ·-. LI- -""'I\ """"'~ .... " """"~ ....,1\ l'\f"U'U'\~ - " 1\1\.1\1'\~ 1V1~n;ury ny ... U.UUUU'1 ""U.UUUU'1 ... u.uvuuo ... u.uuuuo
Nickel Ni <0.001 <0.001 <0.001 <0.001 o-•---"·- v nn"2 nn"2 nnA nnA r VLQ;);:)IUI 11 " u.u., u,U\JI u.\r't u.u ...
Silver Ag <0.0001 <0.0001 <0.0001 <0.001 ~-,...i··- 11.1 .... 1 11: 1 4"2 4 no of 1n \,;JUUIUlll i~a ... .., '·'"" I .ug 1.1u
Zinc Zn <0.005 <0.005 <0.005 <0.005
<=less than Results expressed as milligrams per litre except for pH, Conductivity (#.&mho1/cm), Turbidity (NTU) and ~hlorophyll (µg/L)
Sample Depths: A = o.s m, B = 5 - 11 m, C = 20 m, D = 1 meter above bottom.

AppendixC
Particle Size Analysis
(Jlescan)

PROJECT N0.1921290 OR AWN REVlEWEO DATE OC'f-10-to
M.I. T. GRAIN SIZE SCALE Size of openin9, inches U.S. S. sieve Sile, meshes /inch
24 12 6 3 1Y2 3/4 3/a 4 10 20 40 60 IOO 200
1oon-rr-1T--r-~1--rn"1rrT""T""'T"""'""11 t---'-riiTrt""l-r--t""~-,,l'TTTT;-1 T""'1 -r-1~rrttt-r,--,r-r~r-~n-rTT'.,....,l"'"""t~..--~TM'"T"T~r-r~r----.
111 11 90 LEGEND:
SAMPLE BLSS1 80 t-t-t-t·-t--l!-~l-t-f-t-f-f--+--i---+---t+l-1· - ,- - - -- - -· - - - -- --
70 z <t J: .... 60
a:: w
50 z · - - ·- ---- --l!tt-1H-t--+-t--f-~!t+1H-l--+-t---+--
iL
.... 40 z w 0 a:: 30 w Q.
20 --il-f-1- - - - - --
'l-t-+-1-T-lt--H-t-rt·+-1~-t--tt I tf-t-lt-t--1-- -- · · - - -- ·-- r--- --~"
.. - .. --- ·-· ·-. - .. i'ir-.. 10 ·-
0 100 10 1.0 0.1 0.01 0.001 0 0001
GRAIN SIZE 1 mm I I
coarse t medium f-tine -I
BOULDER COBBLE coarse I medium I tine fine groined
SIZE SIZE GRAVEL Sil E SAN 0 SIZE SILT SIZE I CLAY SIZE
-z U> -N m c -U> -f :u m c -f -0 z
.,, lO c ..., (\)
0 I ....

PRO.IECT HO;~~.~.~ ........ OR AWN REVIEWED
M.I. T. GRAIN SIZE SCALE Size of openin9, inches U.S. S. sieve size, meshes /inch
24 12 100 '
6 I
l . 4· I
10 20 40 60 100 200 I ' ' '
I 90 t-t---4--li--;H-1-t-1-.f-.-1.-4--li--l+l-I· - - - --1---11·1 LEGEND:
80 ·--1 .. -
SAMPLE BLSS2
70 H-+-f-+--11--H++-++-t-+--'l--++++++-li--1- -- . .. -· ... ·- --- --z <(
J: .... 60
a: w so z -1·--il---H- · - ·· - - -1.----H-I
\ IL.
t- 401-1-+-1-4-ll--~w+~~+-l-4-l~-H-l+-4-+-l-.J.~.1-
z w u 0: 30H-+-t-+~lf---H+i-+i--l-+--lf---t-H-rf-+-~ w Q.
20 ... - _,_ - --- ...... -· --- - ---
I I
BOULDER COBBLE coarse I medium I fine
SIZE SIZE GRAVEL SIZE
- .....__ ---1 __ .. I
LO QI
GRAIN SIZE , mm I I
coarse I medium I fine
SAN 0 SIZE
0.01 0.001
I fine groined
SILT Sl·Z E I CLAY SIZE
0 0001
C) :u > z Ch -N m 0 -Ch -t :u -m c: -t -0 z
21 IO c .., Cl)
0 I
I\)
'------------------Golder Associates-----------------'----'

PROJECT ICO .... ,JJ.0 .... ••• ORAWN ......... 11£VIEWE~ ....... OAT£ ..... ~::?~~ .. .
Size of openin9, inches U.S. S. sieve size, meshes /inch
24 12 100
6 3 4 10 20 40 60 100 200 I I . I .
z <t J:
90
80
70
.... 60
er: w 50 z I.&.
.... 40 z LIJ 0 a: 30 w Q.
20
LEGEND• ........
.......
SAMPLE 0 ...
0 I I 111 ll 0
BOULDER COBBLE SIZE SIZE
. BL2 TAILS •
I 111 I
10
I I
coarse I medium I tine
GRAVEL SIZE
I .
1.0 :•
GRAIN SIZE I . I
coarse I medium I
I
0.1
mm
fine
SAN 0 SIZE
l
~
M. I. T. GRAIN SIZE SCALE
'~ lll
\ \ \
I
:)
\
' \
"' ~ ~,
': ~
0 01 0 .OOI
I fine ~rained
SILT SIZE CLAY SIZE
0 0001
G') ::c )>
z
"' -N m c
"' -f ::c -CD c -f -0 z
::!1 '° c .., ('1)
() • w

PAOJECT HO 8021298 DRAWN REVIEWED DATE ocr-10-to ··················· .......... ········ ················· .. .
M.1.T. GRAIN SIZE SCALE Size of opening, inches U.S. S. sieve size, meshes /inch
·::m 1 ·11 ~ 11r111 T(r · ·1i11ir11 r m11tll!~ll[l l-U_1_1J11H ~ ! , 11111111 1
1J I G) I
l+li+~-l~+I I I lt~~~~-1-l~I
80 ,_ SAMPLE : BLSS3
:D ~ -z
"' -10 N
., ~ I - .
~~I~~ I llllllll I llllllll l~m~~-~1111+1~~1111111 111111111
1
111
~--~ 1
1 ~ 11111 I 11111111 I 1111111 I I 11111111 I\ 11111111 I ~ so -· ··-- - - . ---·- m -~ c
-t \ ..... 40t-+-t-t--~t---+t-t-t--·~---t--t+H-+-+-t--+---t
z w u 0:: 30J..+-~--1- - . - r-r- - - ·J..1-1 .... -1---1--t-- . - -· -w
_,_
·-- - --"
I 11111~~ I I 11111111 I I a. _Jll 11 I 11111111 I 11111111 I 11111111 I 1111111 I lUrn-1-r-1-nnTr1n-1rrrn1-·1--1-11n1 ·1 rT-1-111r1 n · ·1-1111r1r~1-nrrm1-r-1 1
I 1111 I I Ill I LI I I I 111111111 II 11111 I I 1111111 I I 111111 l~I 1111 I I I ,_ .. - - --1- ,_. -· - - .. - - -· -iO ri~
0 100 10 1.0 0.1 0.01 0.001
GRAIN SIZE , mm
BOULOERICOBBLE I coarse I medium I fine l coarse ·Jmedium I fine j ____ fine__,,,gr,_oin_ed __ _
SIZE I SIZE I GRAVEL SIZE · 1 SANO SIZE I SILT SIZE I CLAY SIZE
-0 z
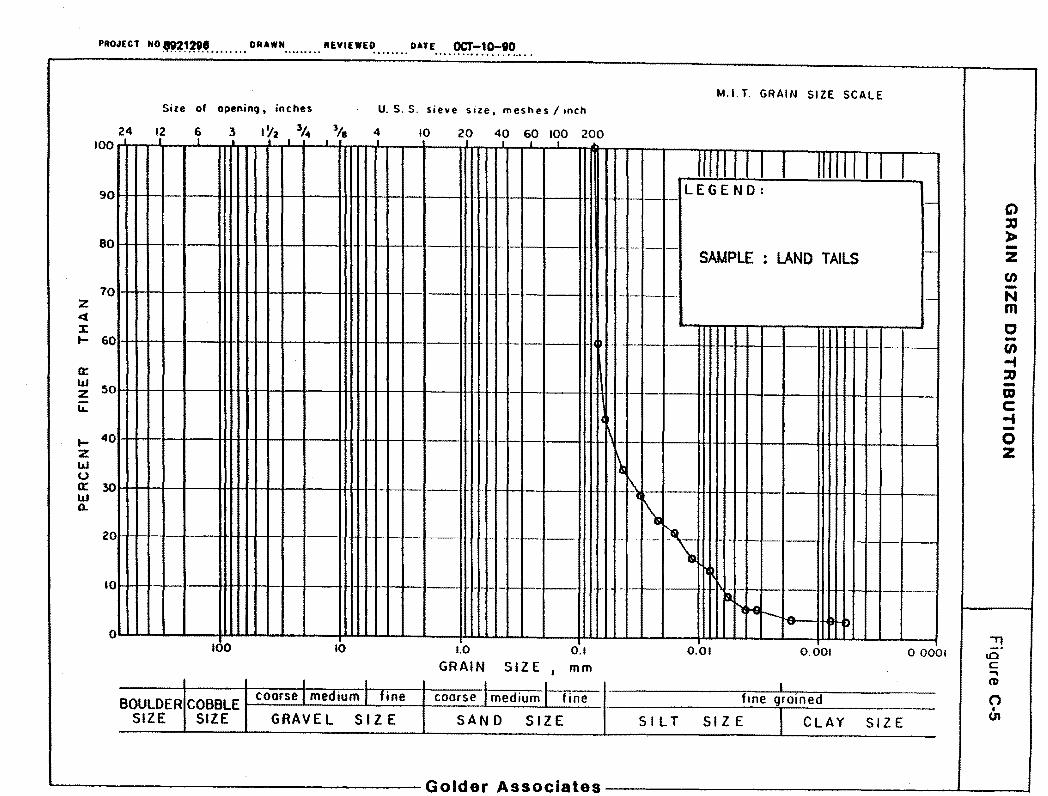
PROJECT Nomt~.~ ........ DRAWN········· REVIEWE~ ••••••. DlTE .•.. ~7~~~~ ... .
M.I. T. GRAIN SIZE SCALE Size of openin9, inches U.S. S. sieve size, meshes I inch
24 12 6 3 4 10 20 40 60 100 200 I I
z <(
J:
100
90
80
70
t- 60
0:::
w 50 z lL.
t- 40 z w 0 0::: 30 w 0..
20
10
0
I
100
BOULDER COBBLE SIZE SIZE
I I I
r- -
1- -· ~· --·
. -· --,- r--
10
I I coarse I meaium I tine
GRAVEL SIZE
I I I I
.. ,_ -
·- ,_ ......
-
-- ~ --
--·· .... . -- -· --
--· -•. - - r- r---
1.0 0.1
GRAIN SIZE 1 mm
coarse I medium I fine
SAND SIZE
II I 11 LEGE NO: - ,_
- . ·- -- - ,_ SAMPLE . LAND TAILS
,-. . - - - ......._ -· ,_
- t---
-
I
\ I\ ···- .. c -
\ .. [-\ - . - ,__ - -- _,_ - e---
~ ... I\
. r- ..... - --'91"l
~ r- ~ -
0.01 0.001 0 0001
. I fine groined
SILT SIZE I CLAY SIZE
C>
" )>
z (/) -N m c --CD c -4 -0 z
~
'° c ..., <D
0 • U1
"---------------------Golder Associates __________________ __._ __ ___,

PROJECT N0.~~.1.~~ ........ DRAWN REVIEWED DATE •••.. ~".".1.~"."~ ...
M. I. T. GRAIN SIZE SCALE Size of opening, inches U.S. S. sieve size, meshes I inch
24 12 6 3 1Y2 3/4 3/a 4 10 20 40 60 IOO 200 100 I I I I I I I I I I I
II I 11 90 LEGEND: - ,....._ -- ,_
C) :u l> 80 - .. -SAMPLE KEOGH - z . . "' -70 - - --- ---- . - -·- - -· - N z m <t
J: c -I- 60 - - . ·- IJP - -- - t'> -t
0: :u w 50 a; z - ·-·- --
ii: c: -4 -
I- 40 ·-- -- - ·- - -· 0 z ' z w & u i'cs '-0: 30 - -- - - - -- - ·- - r-w .. a. ·' 20 - -·- --- - -- - . - -- - - r-- ' - " - ·--- - -- - ._
Ill. ['l!
'\I) r--~ A 10 -
0 ,, 100 10 1.0 0.1 0.01 0.001 0.0001 cO
GRAIN SIZE mm c , ..... I I
coarse t medium I I C1>
BOULDER COBBLE coarse I meaium tine fine fine groined 0
SIZE SIZE GRAVEL SIZE SAND SIZE SILT SIZE CLAY SIZE 0,
G older Associates

Appendix D
Detailed Petrographic Analysis
. (Jlescan)

Sample: BLSS 1
Brown amorphous material Feldsoars
Amphihole Epidote Quartz
Sericite} Chlorite}
Carbonate Magnetite Hematite
Pyrite _ Pyrrhot!te ChaJcopyrite
22 45 12 4 2 8
1.5 3.0 0.2 0.2 0.1
trace
APPENDIX D
This material contained a high proportion of coarse organic debris, which was screened .
out (as was the ultra-fine portion) in order to faciiitate mounting. As a resuit, this
sample appears notably well-sized compared with others of the suite. It is mostly within
the particle size range of 40 - 120 µ.m.
The brown, translucent/opaque-flecked phase, considered to represent organic and Fe
hydroxide-rich sediment, is notably less prominent in this sample than others - almost
certainly because of the screening pretreatment. The other samples of the suite were
mounted "as is". To a minor degree this brOVv'D material occurs as pa.i"1ial rinis or coatings on mineral grains, or as diffuse impregnations of porous aggregate grains (such
as compact chlorite or sericite). For the most part, however, it is well segregated, and
the abundant mineral component consists of clean, discrete, monomineralic grains.
The predominant constituent is feldspar (probably mainly plagioclase ). This occurs as
particles ranging from fresh, well-twinned, to strongly turbid, sericitized and
saussuritized. A component of minutely felsitic material is also present.
Amphibole ranges from well-crystallized prismatic grains to minutely felted/fibrous
aggregates of secondary aspect.
Compared with most of the other sampies, garnet is relativeiy minor, and carbonate
relatively more abundant.
D • 1

APPENDIX D
Opaques, in total, are more abundant in this sample than in the other lake sediments.
They consist mairJy of magnetite, as free, irregular-shaped grairtS, 30 - 100 µ.m in size.
Sulphides are mainly pyrite and lesser pyrrhotite. Chalcopyrite is rare.
The sulphides typic~ l!y occur as individ1:1a! liberated grains. Rare cases of compositing
with silicates or encapsulation by organics are seen. The Fe sulphides are mainly fresh,
but a minor proportion show rims of oxidation to limonite. The chalcopyrite is
unaffected.
Sample: BLSS2
Brown amorphous material 38 - Feldspar 34
Amphibole 11 Chlorite 5
Quartz 5 Garnet 3
Epidote 1 Carbonate 1 Magnetite 1.5 Hematite} 0.2 Limonite}
Pyrite} 0.1 Pyrrhotite}
Chalcopyrite trace
This material has a predominant particle size range of 5 - 150 µm. A few larger
fragments of the amoi yhous organic-rich phase are also present.
The latter material (brown, translucent, isotropic, with dark opaque, possibly
ferruginous speckles), makes up a somewhat higher percentage in this sample than in
others of the suite.
The mineral grain component making up the remainder of the sample consists
principally of feldspar (plagioclase ), showing varying degrees of saussuritic alteration. A
minor component of quartz and some compact chloritic material are also present.
Garnet and epidote are notably less abundant in this sample than in many others of the
suite.
Sulphides, also, are notably minor. They consist of rare, tiny liberated grains, 5 - 30 µm
(rarely to 50 µm) in size, of pyrite, pyrrhotite and chalcopyrite. The Fe sulphides in this
0-2

APPENDIX D
sample occasionaIIy show partial marginal oxidation to limonite. The chalcopyrite is
aiways fresh.
Sample: BL 2 Tailings
Brown amorphous material 28 Quartz 4
Feldspar 19 Amphibole 32
Garnet 8 Epidote 6
Carbonate 0.5 Magnetite 2 pyrrhotite 0.3
Pyrite 0.1 Chalcopyrite 0.1
This material is bimodal in particle size. A considerable proportion is notably fine (in
the range 2 - 50 µm), but there are also more or less abundant, much coarser particles,
100- 200 µmin size (rarely to 500 µm).
Man~ of the coarsest particles are apparently aggregates of organic fluff, sometimes with
intermixed silt. They range from amorphous brown with opaque speckles, to greyish,
sub-opaque in appearance.
The fine fraction consists mainly of liberated mineral grains in proportions as estimated
above. Scattered, coarser grains of the same rrJnerals, to 200 µm in size, are also seen.
Opaques are of low abundance. They consist principally of magnetite, as liberated
anhedral grains 20 - 200 µm in size.
The most common sulphide is pyrrhotite. Very minor pyrite and chalcopyrite are also
seen. The sulphides occur mainly as liberated grains in the 5 - 50 µm size (occasionally
larger). Occasional composites of sulphides with garnet and other silicates are seen.
D-3

APPENDIX D
Sample: BLSS3
Brown amorphous material 30 Quartz 5
Plagioclase . 36 Amphibole i2
Garnet 8 Epidote 6
Carbonate trace Sphene trace
Magnetite 2.5 Hematite 0.2
Pyrite 0.1 Pyrrhotite 0.1
Chalcopyrite 0.1
This material has a particle size range of 5 - 150 µm, plus rare, coarser grains to 250 µm.
T .ike Lhe other samples, it consists predoI!'Jnant!y of the translucent, brown, amorphous
material which is thought to represent organic-rich sediment. This includes diffuse opaque spots (Fe, hydroxides?, carbon?), and sometimes incorporates a little silt-sized
mineral material. Occasional biogenic skeletal forms are also seen.
The remainder of the sample consists of liberated mineral grains which, in this case,
appear to be principally feldspar (plagioclase ). This is mostly fresh, but is sometimes
flecked with saussuritic alteration, or has intimately intergrown fibrous amphibole.
~,. .. _.....,,. ,t __ ,. ----=---• ------11 •. --•1..-- ------ £--- ---!-... A --1..!L.-1- ------- 1---VCUUl;L .l.U!U!;) }J!UU.l.UJl;UL7 !)CUC14UJ 14LUC1 \;Ui:Ll~C UCC !)Ji:LU!;). ~U}JlJJUUJC i:L}J}Jic;;i:LJ~ tic;;~~
prominent than in some of the other samples; it is partly well-crystallized, prismatic, and
partly as minutely f cited, compact aggregates.
Opaques are minor. They consist predominantly of magnetite, occasionally with
associated hematite or limenite. Sulphides - particularly Fe sulphides - are notably
sparse. They occur as scattered, tiny flecks and rare, larger individuals, to 50 µm, always
liberated, and always fresh.
0-4

Sample: Benson Land Tailings
Ga.met Epidote
Diopside Arnphibole
Feldspar Quartz
Limonite Magnetite
Chalcopyrite
10 10 6
20 2
15 5
20 12
This mateiial has a particle size range of 2 - 150 µm.
APPENDIX 0
It consists almost entirely of liberated mineral grains - principally calc silicates of skarnic
tjrpe (garnet, epidote, actinolite, diopside, and possible oli'Yine).
The strong orange-brown colour of the original sample suggested extensive oxidation of
sulphides and a high content of limonite. The thin section shows some fairly large grains
of "fluffy", earthy limonite but, for the most part, the limonite is found to be in a highly
dispersed form, as staining and surface coatings on silicate grains, and some intimate
impregnation of fibrous minerals. The overall content of limonite does not appear high.
This material has a high content of chalcopyrite, and it seems likely that it represents
pulverized mill feed - or even selected high grade - rather than tailings.
The chalcopyrite occurs as liberated angular particles, 5 - 100 µmin size. It is totally
fresh, and shows no sign of oxidation (to limonite) or secondary enrichment
(development to Fe-free Cu sulphides).
The abundance of magnetite (again, as fresh free grains), and the total absence of pyrite
or pyrrhotite, is a notable feature, inconsistent with the sulphide component seen in the
lake tailings and sediment samples. The dominance of quartz over plagioclase is
another distinctive feature.
No partially oxidized remnants of original Fe sulphides were seen, suggesting that the
diffuse limonite in this sample is of transported (hydrochemicaiiy redistributed and
precipitated) origin - perhaps derived from adjacent dumps or percolation of mine
drainage.
0-5