CONTRIBUTION OF BRANDING IN ENHANCING · PDF fileCONTRIBUTION OF BRANDING IN ENHANCING...
101
CONTRIBUTION OF BRANDING IN ENHANCING PERFORMANCE OF TOURISM SECTOR IN RWANDA ANN KALEMBE This Research project Report submitted to the Department of Business Administration in the School of Business in partial fulfilment of the requirement for the award of Master Degree in Business Administration (Marketing - Option) of Jomo Kenyatta University of Agriculture and Technology. 2015
Transcript of CONTRIBUTION OF BRANDING IN ENHANCING · PDF fileCONTRIBUTION OF BRANDING IN ENHANCING...
CONTRIBUTION OF BRANDING IN ENHANCING PERFORMANCE OF
TOURISM SECTOR IN RWANDA
ANN KALEMBE
This Research project Report submitted to the Department of Business Administration in the
School of Business in partial fulfilment of the requirement for the award of Master Degree in
Business Administration (Marketing - Option) of Jomo Kenyatta University of Agriculture and
Technology.
2015
i
DECLARATION
This Research project Report is my original work and has not been presented for a degree in any
other University.
Sign: ……………………….. Date: ………………….
ANN KALEMBE
HD333-C010-3919/2013
This Research Project Report has been submitted for examination with our approval as
University Supervisors.
Sign: ………………………………… Date: ……………………….
Dr. Mike A. Iravo (PhD)
Sign: ………………………………… Date: ……………………….
Dr. Jaya Shukla (PhD)

ii
DEDICATION
This research is dedicated to my dear son Antoine Kirabo. Mum loves you.
iii
ACKNOWLEDGEMENT
I would like to thank all my supervisors Dr. Mike Iravo and Dr. Jaya Shukla for the guidance andmotivation which helped me complete this project. I would also like to thank my family andfriends who stood by me during this challenging academic journey. May God Almighty blessyou all.

iv
ABSTRACT
Strong branding has become a very important factor that influences consumer’s perceptions of a
brand. This arises from understanding and managing the brand correctly to produce strong
attributes that influence consumers when making their choices. Considering the increasing
competition in the tourism industry, more governments have realized that branding can enhance
tourism and also become a powerful tool to differentiate their countries and obtain competitive
advantages by improving their image in tourism. The results have shown that the branding
campaign in tourism is generally well developed and the image promoted corresponds in great
measure with the one perceived by consumers. The value of this research concentrates on the fact
that branding can enhance the performance of tourism in any country. As a relatively new
concept, branding still lacks empirical academic research. This study offers an original insight
into branding as a tool in enhancing Tourism performance through image analysis. This research
focuses on the importance of these dimensions (brand awareness, Tourism brand loyalty,
Tourism brand image and perceived quality in enhancing the performance of the tourism sector
in Rwanda ) of customer-based brand equity on consumer’s perceptions of a Tourism brand. This
is based on the assumption that all these dimensions of customer based-Tourism brand equity
have had influence on consumer’s perceptions of the Tourism brand. However, this research
project report aimed to find out which among these three dimensions (brand image, brand loyalty
and perceived quality) appears to have the least brand equity in Tourism with respect to Tourism
brand awareness, Tourism brand image, and perceived quality and Tourism brand loyalty. A
structured questionnaire was constructed to provide answers to research questions. In this study,
fifty seven questionnaires were distributed, and all fifty realised. Despite the academic attention
to branding in Tourism, there seems to be no clear path for authorities to follow in establishing
their destinations as distinctive and strategic brands, A comprehensive research framework with
both qualitative and quantitative methods was used to suggest and assess these brand elements,
meanings, and assets for both supply and demand sides of the market. After data collection and
analysis, it was established that there is a relationship between branding and tourism
performance in Rwanda. And in conclusion therefore, the researcher established that branding
has a significant positive effect on Tourism Performance in Rwanda as this research project
shows.

v
TABLE OF CONTENTS
DECLARATION ............................................................................................................................. iDEDICATION................................................................................................................................ iiACKNOWLEDGEMENT .............................................................................................................. iiABSTRACT................................................................................................................................... ivTABLE OF CONTENTS................................................................................................................ vLIST OF FIGURES ..................................................................................................................... viii
LIST OF TABLES...................................................................................................................... x
ACRONYMS................................................................................................................................. xiDEFINITION OF TERMS ........................................................................................................... xiiCHAPTER 1: Introduction ............................................................................................................. 1
1.1 Background to the study. ...................................................................................................... 1
1.2 Statement of the problem...................................................................................................... 3
1.3 Objectives of the study: ........................................................................................................ 4
1.4 Research questions................................................................................................................ 4
1.5 Importance and justification of the study ............................................................................. 5
1.6 Scope of the study................................................................................................................. 5
1.6.1 Geographical Scope ........................................................................................................... 5
1.6.2 Content Scope ........................................................................................................................ 5CHAPTER 2: LITERATURE REVIEW ........................................................................................ 6
2.1 introduction........................................................................................................................... 6
2.2. Theoretical model framework.............................................................................................. 6
2.3 Conceptual framework........................................................................................................ 13
2.4 Review of Related Literature .............................................................................................. 14
2.5 Empirical Studies ................................................................................................................ 36
2.6 Critique of the existing literature relevant to the study ...................................................... 38
2.7 Research gaps ..................................................................................................................... 39

vi
2.8. Summary............................................................................................................................ 40
CHAPTER 3: RESEARCH METHODOLOGY .......................................................................... 413.1 Introduction......................................................................................................................... 41
3.2 Research design .................................................................................................................. 41
3.3 Target population ................................................................................................................ 41
3.4. Procedures for data collection............................................................................................ 42
3.5. Source of data .................................................................................................................... 42
3.6. Data Collection Methods ................................................................................................... 42
3.7.1 Questionnaire survey ....................................................................................................... 42
3.7.2 Document reviews ........................................................................................................... 43
3.8 Data Collection Instruments ............................................................................................... 43
3.8.1 Structured questionnaire ...................................................................................................... 433.9 Data analysis and presentation............................................................................................ 44
3.9.1 Quantitative data analysis .................................................................................................... 443.9.2 Qualitative data analysis ...................................................................................................... 45CHAPTER 4 ................................................................................................................................. 46
4.0 Research Findings and Discussion ..................................................................................... 46
4.1 Introduction......................................................................................................................... 46
4.2 Response Rate..................................................................................................................... 46
4.3. Demographic characteristics of respondents ..................................................................... 46
4.4.0 FINDINGS.................................................................................................................. 49
Figure 4.25: Why clients come to the company ................................................................... 664.4.1. Objective Four: Branding Challenges to Tourism Development in Rwanda ................ 67
4.4.2 Relationship between the variables and tourism performance ........................................ 68
CHAPTER 5 ................................................................................................................................. 705.0 SUMMARY, CONCLUSIONS & RECOMMENDATIONS............................................ 70
5.1 Introduction......................................................................................................................... 70

vii
5.2 Objective One: Components of Branding and How They Enhance .................................. 70
5.2.1. Branding components and how they enhance performance of the sector....................... 70
5.3 Objective Two: Branding Strategies Used In Rwandan Tourism...................................... 70
5.4 Objective Three: How Brand Awareness and Association in the....................................... 71
5.5 Objective four: branding challenges to tourism development in Rwanda .......................... 71
5.6 Conclusions......................................................................................................................... 72
5.7 Recommendations............................................................................................................... 72
5.8 Further Research areas........................................................................................................ 75
REFERENCES ............................................................................................................................. 76APPENDICES .............................................................................................................................. 82
Appendix 1 QUESTIONNAIRE .............................................................................................. 82
Appendix II: Members of RTTA .............................................................................................. 86

viii
LIST OF FIGURES
Figure 2-1: Model of Destination Branding.................................................................................. 10
Figure 2-2: Conceptual Framework. ............................................................................................. 13
Figure 2-3: Steps in common sense segmentation ........................................................................ 24
Figure 4.1: Sex of respondents...................................................................................................... 46
Figure 4.2: Age of respondents ..................................................................................................... 47
Figure 4.3: Length of service ........................................................................................................ 48
Figure 4.4: clients’ recognition of the brand ................................................................................. 49
Figure 4.6: Brand awareness enhances performance.................................................................... 50
Figure 4.7: clear commitments company makes to clients ........................................................... 51
Figure 4.8: Brand promise enhances performance ....................................................................... 52
Table 4.9: Clients repeatedly come for the same service.............................................................. 53
Figure 4.10: Brand commitment enhances performance .............................................................. 53
Figure 4.11: Service providers differ from each other substantially ............................................ 54
Figure 4.12: Brand positioning enhances performance ................................................................ 55
Figure 4.13: Clients relate with company service......................................................................... 56
Figure 4.14: Brand personality enhances performance................................................................. 56
Figure 4.15: Aspects of performance that brand components enhance ........................................ 57
Figure 4.16: responsibilities for marketing ................................................................................... 58
Figure 4.17: tourism products sold ............................................................................................... 59
Figure 4.18: Marketing tourism .................................................................................................... 59
Figure 4.19: Positioning Rwanda.................................................................................................. 61
Figure 4.20: Attitudes of the local people towards tourism.......................................................... 61

ix
Figure 4.21: Image of Rwanda...................................................................................................... 62
Figure 4.22: Period taken using the branding ............................................................................... 63
Figure 4.23: Awareness about the brand in use ............................................................................ 64
Figure 4.24: Effects of branding on the tourism industry............................................................. 65
Figure 4.25: Why clients come to the company ........................................................................... 66
Figure 4.26: clients........................................................................................................................ 66
Figure 4.27 (a): challenges of branding ........................................................................................ 67
Figure 4.27(b): how challenges are being handled ....................................................................... 68
Figure 4.28: Tourism future prospects.......................................................................................... 68
x
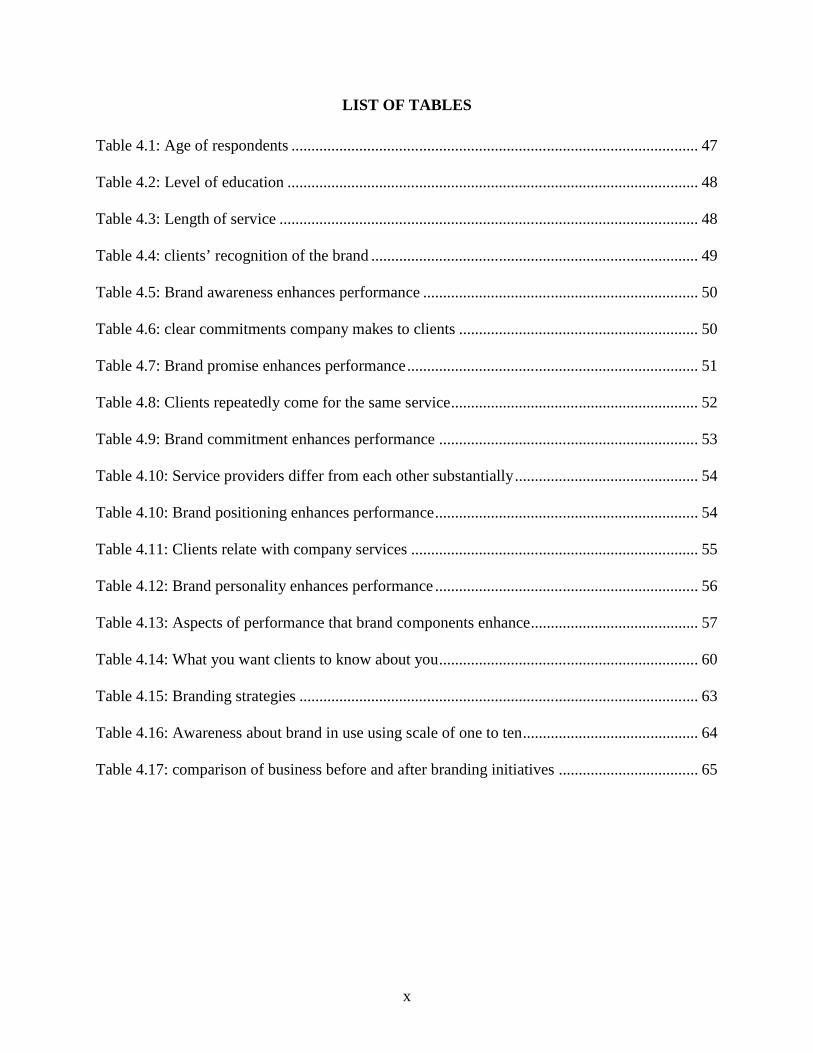
LIST OF TABLES
Table 4.1: Age of respondents ...................................................................................................... 47
Table 4.2: Level of education ....................................................................................................... 48
Table 4.3: Length of service ......................................................................................................... 48
Table 4.4: clients’ recognition of the brand .................................................................................. 49
Table 4.5: Brand awareness enhances performance ..................................................................... 50
Table 4.6: clear commitments company makes to clients ............................................................ 50
Table 4.7: Brand promise enhances performance......................................................................... 51
Table 4.8: Clients repeatedly come for the same service.............................................................. 52
Table 4.9: Brand commitment enhances performance ................................................................. 53
Table 4.10: Service providers differ from each other substantially.............................................. 54
Table 4.10: Brand positioning enhances performance.................................................................. 54
Table 4.11: Clients relate with company services ........................................................................ 55
Table 4.12: Brand personality enhances performance .................................................................. 56
Table 4.13: Aspects of performance that brand components enhance.......................................... 57
Table 4.14: What you want clients to know about you................................................................. 60
Table 4.15: Branding strategies .................................................................................................... 63
Table 4.16: Awareness about brand in use using scale of one to ten............................................ 64
Table 4.17: comparison of business before and after branding initiatives ................................... 65
xi
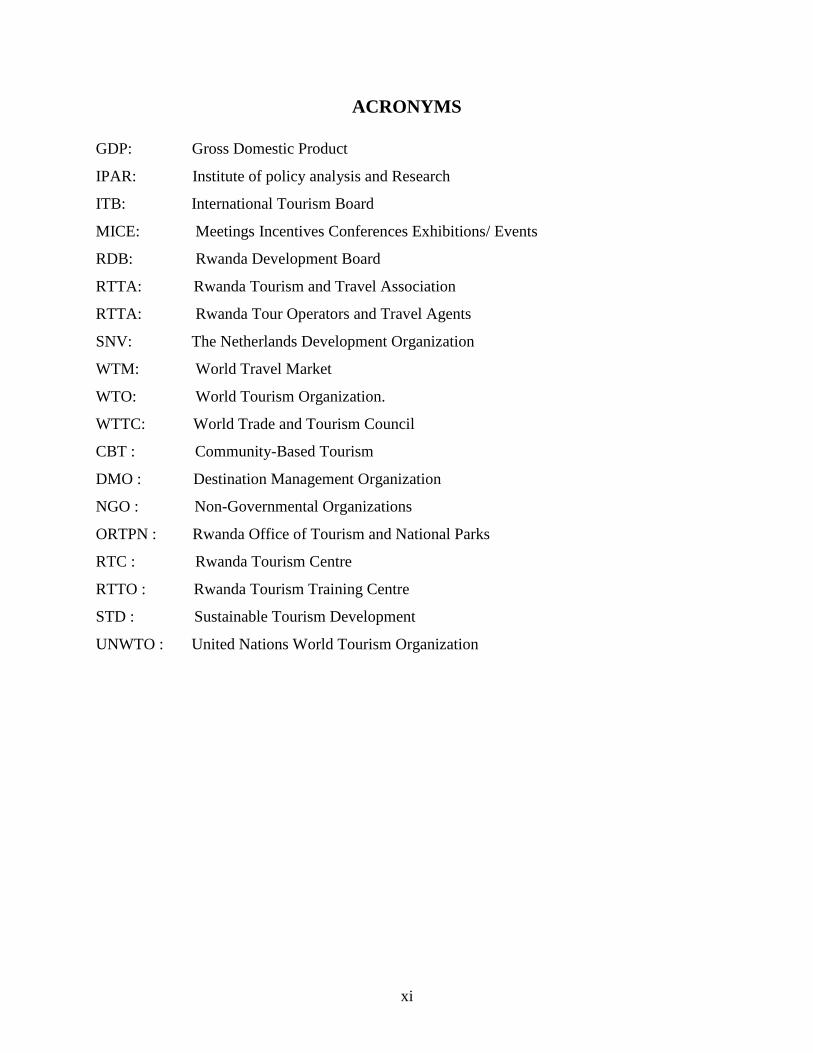
ACRONYMS
GDP: Gross Domestic Product
IPAR: Institute of policy analysis and Research
ITB: International Tourism Board
MICE: Meetings Incentives Conferences Exhibitions/ Events
RDB: Rwanda Development Board
RTTA: Rwanda Tourism and Travel Association
RTTA: Rwanda Tour Operators and Travel Agents
SNV: The Netherlands Development Organization
WTM: World Travel Market
WTO: World Tourism Organization.
WTTC: World Trade and Tourism Council
CBT : Community-Based Tourism
DMO : Destination Management Organization
NGO : Non-Governmental Organizations
ORTPN : Rwanda Office of Tourism and National Parks
RTC : Rwanda Tourism Centre
RTTO : Rwanda Tourism Training Centre
STD : Sustainable Tourism Development
UNWTO : United Nations World Tourism Organization
xii
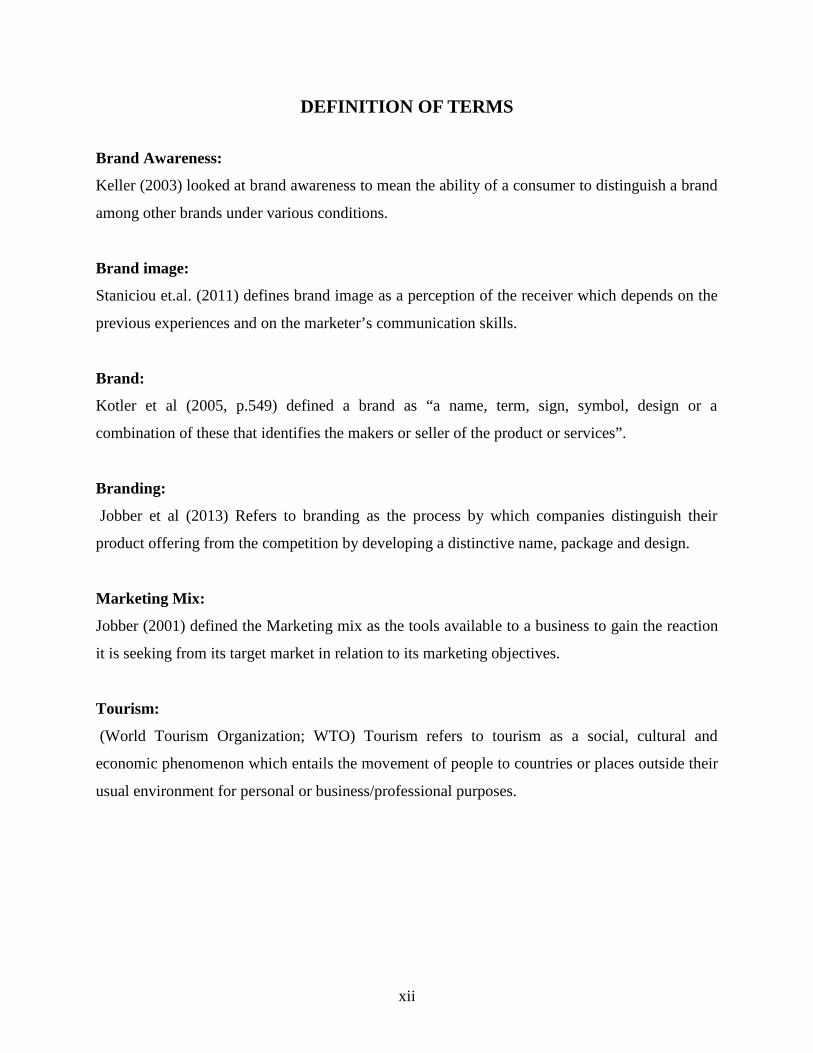
DEFINITION OF TERMS
Brand Awareness:
Keller (2003) looked at brand awareness to mean the ability of a consumer to distinguish a brand
among other brands under various conditions.
Brand image:
Staniciou et.al. (2011) defines brand image as a perception of the receiver which depends on the
previous experiences and on the marketer’s communication skills.
Brand:
Kotler et al (2005, p.549) defined a brand as “a name, term, sign, symbol, design or a
combination of these that identifies the makers or seller of the product or services”.
Branding:
Jobber et al (2013) Refers to branding as the process by which companies distinguish their
product offering from the competition by developing a distinctive name, package and design.
Marketing Mix:
Jobber (2001) defined the Marketing mix as the tools available to a business to gain the reaction
it is seeking from its target market in relation to its marketing objectives.
Tourism:
(World Tourism Organization; WTO) Tourism refers to tourism as a social, cultural and
economic phenomenon which entails the movement of people to countries or places outside their
usual environment for personal or business/professional purposes.

1
CHAPTER 1: Introduction
1.1 Background to the study.
Tourism is the world's largest civilian industry and accounts for nearly fourteen percent of the
world's GDP. David J. Saunders (2002). The World Trade and Tourism Council (WTTC) (2010)
assert that Travel and tourism has become a global industry, widely considered one of the fastest
growing sectors. For example: In 2009, the industry generated 9.4% of the world GDP and
employed over 235 million people worldwide (8.2% of all employment) (WTTC, 2010). The
WTTC (2010) has projected that the industry has a very high potential of generating revenue that
will increase the rate of growth by 4.4% per annum.
World Tourism Organization’s (WTO) (2010) also projects that the tourism industry will
continue to grow and by 2020 international arrivals are expected to increase by 200% to reach
over 1.56 billion. WTO (2010) further projects that of these worldwide arrivals, 1.2 billion are
expected to be intraregional while 0.4 billion covering long-haul travellers. WTUs’ (2010)
projections indicate that Europe will receive 717 million tourists, East Asia and the Pacific will
receive 397 million and the Americas will receive 282 million tourists. Africa the Middle East
and South Asia will record growth-rates of over 5 percent per year, compared to the world
average of 4.1 per cent.
Jevons (2005) attributes the growth and success of tourism to branding. Brands represent one of
the areas of implementation of marketing communication of the organization whose importance
has significantly grown in the recent years. If their value has initially been seen especially in
connection to the trade name of organizations’ products and services and primarily in the legal
context, brands and their employment are nowadays considered key factors to the success of the
organization in the market. Thus, the creation, development and employment of brands have
become activities that have exceeded the area of marketing communication and whose effects are
visible in the results of the marketing and overall activities of the organization. Brands tend to be

2
used in an increasingly diversified context more and more separated from the field of consumer
goods which it has provided the support for their current development .Jevons, (2005).
Anholt (2004) also notes that consumers gets ever easier, countries’ ability to compete against
each other for share of mind, share of income, share of talent and share of voice, is significantly
determined by the power of their brand image. Unless a country “stands for” something special
and different, there is little chance that this country will be able to compete successfully for any
of the precious attention.
According to Anholt (2005a), countries have always been brands, in the truest sense of the word.
Like any brand, nations have individual identities which are unique unto themselves. Jaworski &
Fosher, (2003); no two nations are alike. Based on their unique identities, many countries have
been branding themselves deliberately and systematically for centuries, even if the respective
vocabulary has only recently been adopted. Whereas the idea of branding nations is still
questioned by most people (Olins, 2002), the notion of brand management for countries has been
established as one of the key tools for attaining nation-wide competitiveness.
Govers, R., F.M. Go, and K. Kumar (2007) in Promoting Tourism Destination Image published
in the Journal of Travel Research emphasise that branding brings the tourism sector to the
forefront and to international attention. A case in point is the fact that Rwanda particularly is
well known for its mountain gorillas. First brought to international attention by the conservation
efforts of Dian Fossey in the 1960s and 70s, Rwanda’s gorillas have featured in numerous
documentaries and have in the recent past been visited, for example, by Bill Gates, Natalie
Portman and Ted Turner, who have all participated in the annual gorilla naming ceremony.
Rwanda and Uganda are the only two countries in the world where mountain gorillas can be
visited safely at the moment. In 2008, about 17,000 people visited the Volcanoes National Park
(VNP) to see the gorillas, a large increase from the late 1980s and an impressive recovery from
only 417 tourists in 1999 after the reopening of the park. Rwanda has also seen gorilla tourism as
a valuable conservation tool, enforcing strict rules for the habituation and trekking of gorilla
families. Tourists are willing to pay high fees for a limited number of permits, which are usually
sold out. The revenues from gorilla tourism provide funds to the national parks and facilitate
conservation activities. Five percent of park revenues are disbursed for community projects.

3
According to the Rwanda Tourism Policy (2009) Rwanda is in the process of implementing a
brand development policy will lead to the creation of a distinctive image and present a new
tourism positioning for Rwanda. The brand will be designed to highlight Rwanda’s competitive
advantages in the areas of wildlife/eco-tourism, activity and adventure travel, and conference and
business tourism. The main scope of the study is therefore to present an analysis on the
contribution of branding in enhancing performance of the tourism sector in Rwanda.
1.2 Statement of the problem
World over, growth in tourism has been significant. According to Song H, Dwyer L, Li G, CAO
Z. (2012). The dynamics of tourism, as an activity and as an industry, call for continuous efforts
in seeking new approaches, tools, and perspectives in order to acquire new knowledge and a
greater understanding of the discipline. Therefore, it is both necessary and useful to
comprehensively review the development of the research field in terms of where we were, where
we are, and where we should be. Very few such endeavours have been made in this regard.
Rwanda Development Board (RDB) reported that the country received $200 million in tourism
revenue and brought in a total of 666,000 tourists in 2010 alone. This is indeed a promising sign
for the small, landlocked country that regards its tourism industry as one of its most important
economic assets. According to the Rwanda Tourism Policy (2009), in 2008, the number of
foreign visitors to Rwanda reached just under one million from about 826,000 in 2007, an
increase of 30 per cent. Estimates indicate that tourism revenues significantly increased between
2007 and 2008, from $138 million to $209 million therefore showing that tourism has become
the largest foreign earner, contributing $290M in 2013. This has been a result of several
initiatives such as aggressive marketing campaigns and the good security the country enjoys.
“Just as companies have learned to ‘live the brand,’ countries should consider their reputations
carefully—because in the interconnected world, that’s what statecraft is all about” Risen (2005)
Although Rwanda has made considerable effort in improving the competitiveness of the tourism
sector, the sector is still shadowed by Rwanda’s past, which was characterized by the devastating
genocide of 1994, which cast a dark shadow to the industry. As a tool to create a positive image,
branding has been one of such initiatives aimed at improving the performance of the industry.
4
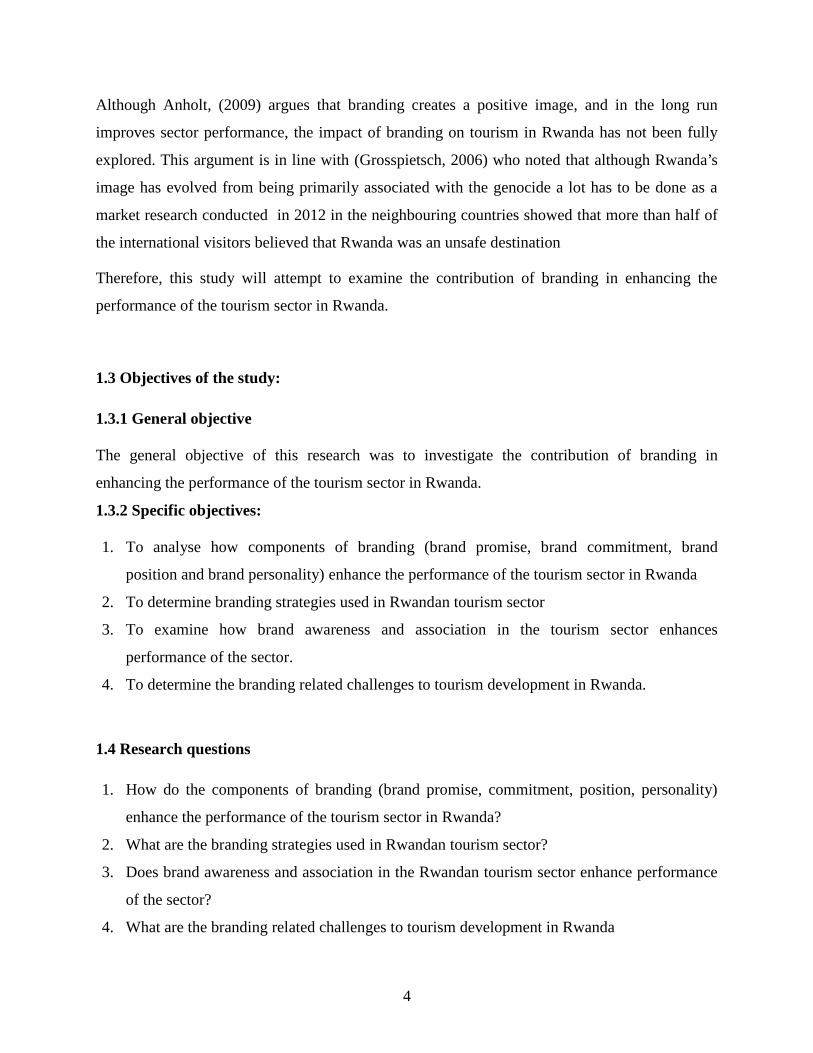
Although Anholt, (2009) argues that branding creates a positive image, and in the long run
improves sector performance, the impact of branding on tourism in Rwanda has not been fully
explored. This argument is in line with (Grosspietsch, 2006) who noted that although Rwanda’s
image has evolved from being primarily associated with the genocide a lot has to be done as a
market research conducted in 2012 in the neighbouring countries showed that more than half of
the international visitors believed that Rwanda was an unsafe destination
Therefore, this study will attempt to examine the contribution of branding in enhancing the
performance of the tourism sector in Rwanda.
1.3 Objectives of the study:
1.3.1 General objective
The general objective of this research was to investigate the contribution of branding in
enhancing the performance of the tourism sector in Rwanda.
1.3.2 Specific objectives:
1. To analyse how components of branding (brand promise, brand commitment, brand
position and brand personality) enhance the performance of the tourism sector in Rwanda
2. To determine branding strategies used in Rwandan tourism sector
3. To examine how brand awareness and association in the tourism sector enhances
performance of the sector.
4. To determine the branding related challenges to tourism development in Rwanda.
1.4 Research questions
1. How do the components of branding (brand promise, commitment, position, personality)
enhance the performance of the tourism sector in Rwanda?
2. What are the branding strategies used in Rwandan tourism sector?
3. Does brand awareness and association in the Rwandan tourism sector enhance performance
of the sector?
4. What are the branding related challenges to tourism development in Rwanda
5
1.5 Importance and justification of the study
Rwanda’s focus has mainly been in the European market but with the market in Europe almost
saturated, there is need to start focusing on new markets brands to stimulate the Industry. The
emergence of other World tourist destination has given the RTTA a new oversight on branding
of its Tourism industry which they should exploit to keep the industry thriving. The Justification
of this study is to create a competitive strategic marketing plan (Tourism branding) so that
Rwanda Tour and Travel association can attract new customers from other destinations and
hence benefit from new investment across the globe.
To government and policy makers, this study is a useful source of information. Government
planners and policy makers are going to benefit from the research findings so that to enhance
their annual tourism planning and focus in terms of improving revenue and employment
generation in Tourism Industry.
This study will also enable future researchers and academics as well as scholars find a source of
reference for their future research in a similar research area.
The research findings shall be be used by policy makers to design National policies that favour
the tourism sector. Policy makers will also be mindful of issues of branding as its impact on the
sector would be clearly documented.
1.6 Scope of the study
1.6.1 Geographical Scope
The study will be carried out in Kigali and in different tours and travel agencies in order to have
concrete and enough information to support this research.
1.6.2 Content Scope
The study will focus on the contribution of branding in enhancing performance of tourism sector
in Rwanda, The study will be deriving its constructs from Marketing and how it affects tourism
sector in Rwanda.

6
CHAPTER 2: LITERATURE REVIEW
2.1 introduction
Under this chapter the researcher brings out a critical review of the issues that have been
explored and studied both theoretically and empirically on the existing literature in relation to the
tourism sector in developing countries and elsewhere in the world and this will be done in line
with the specific objectives of the study. The purpose of this chapter is to identify the
knowledgeable gaps that this study intends to fill within branding in the tourism sector. The
chapter will also help position this study in the context of other studies conducted in the tourism
sector. The chapter will consider theoretical and conceptual framework of the study as well as
empirical data on branding in the tourism sector.
2.2. Theoretical model framework.
Kotler, Jatusripitak and Maesince, (1997) assert that International trade in a globalized economy
is a critical factor in economic growth of a nation. Progress of macro-economic development
involves several components of international trade. International tourism, which is major
component of international trade, can be used as a strategy for economic development in
developing countries (Jafari, 1974, p. 237-245).
In highly competitive world economy, an enormous role is played by global tourism environment
where developing a clear state identity is the key for being successful in this sector. Crockett and
Wood, (2004). This global tourism environment also offers likelihood for developing countries
to leave the poverty cycle by a global brand formation and maintaining a continuous wealth-
creation performance Morgan, Pritchard and Pride, (2004). In tourism management and
marketing, Schubert, Brida and Risso (2010, p. 377) clarify the role of tourism as a positive
influence on the long-term growth of small economies through various channels, e.g., foreign
exchange earnings, positive impacts in investments, human capital gatherings and stimulators in
various industries. Thus, focusing on tourism sector is crucial for developing countries. Tourism
industry’s competitiveness has a rising trend and calls for marketers to create a center of
attention for consumer-travellers Pike and Ryan, (2004). This issue also has reflections in

7
tourism and marketing researches. During the last five years, place branding has been one of the
newest research areas (Moilanen and Rainisto, 2009, p. 8), in spite of great popularity of
branding studies. The implication is that destinations are now in a challenge of branding. Indeed,
destinations can be counted as amalgams consisting mainly of tourism products and
they serve combined incentives to travelers (Buhalis, 2000, p. 97), so destination branding
involves branding of these products to consumer-travellers. Particularly concentrating on
destination researches in branding and tourism literature, there are not many studies deliberating
mobilizations and implementations through how local support can be analyzed and provided for
a brand (Ooi, 2004, p. 108). This fact proves that exiguous studies implemented in destination
identity compared to destination image. Pike (2009) indicated three research areas, which are
needed in destination branding: “destination brand identity development”, “destination brand
positioning” and “destination brand equity measurement and tracking”. The sequence of these
research areas also designates process of establishing a destination brand. Besides, Go and
Konecnik (2008, p. 178) states that demand-side perspective has been considered by vast
numbers of researchers in destination studies and there are still research gaps concerning with
identifying a brand for destination. Associating what Pike (2009) and Go and Konecnik (2008)
point out, brand identity development should be investigated more in order to contribute to
established.
2.2.1. Theories in the literature.
Aaker and Joachimsthaler (2000) constructed a planning model for analysis, development and
implementation of brand identity. Prior to development and implementation process, conducting
strategic brand analysis (customer, competitor and self-analysis) is advised to present required
features for planning. In attempt to highlight constructing tourism destination brand identity via
supplier side, Go and Konecnik (2008) introduced a theoretical framework for strategic brand
analysis by adjusting brand identity planning model. Aaker and Joachimsthaler, (2000) used
Slovenia as the case in that research and fundamental point of the view was formed by
considering the supplier side of tourism.
This framework matches with Pike’s (2009) notification on concerning research gaps in brand
identity construction in relation to supplier side perspective. However, Go and Konecnik (2008)
8
emphasize on the need for further improvements in practical and theoretical level. This study
appropriately focuses on developing a new strategic brand analysis within application to the
tourism destination identity framework by considering again supplier side perspective but in
different country range. For the incorporation of brand identity in marketing, Alsem and
Kosteljik (2008) explain that the identity paradigm will bridge the gap among marketing science
and practice; and might provide a balanced marketing paradigm mutually referring to supply and
demand side. This statement also proves that identity-based brand analysis by means of how
suppliers identify their brands will contribute to both practical and theoretical level.
Morgan and Pitchard (2000) highlighted the significance of destination branding they argued that
the battle for customers in the tourism industry will be fought not over price but over the hearts
and minds, indicating that branding will be the key to success.
Based on Richie and Richie (1998), later work made by Blain et al. (2005) resulted in the
definition of destination branding as “the set of marketing activities that (1) support the creation
of a name, symbol, logo, word, mark or other graphic that readily identifies and differentiates a
destination; that (2) consistently convey the expectation of a memorable travel experience that is
uniquely associated with the destination; that (3) serve to consolidate and reinforce the emotional
connection between the visitor and the destination; and that (4) reduce consumer search costs and
perceived risk”, all with the intent purpose of creating an image that influences consumers’
decisions to visit the destination in question, as opposed to an alternative one.
Hosany et al., (2006) and Park & Petrick, (2006) all agree that unlike many scientific
contributions in the field of product brands, the research line of tourism destination brands is still
in its infancy.
The question remains as to whether already embedded branding principles can be transferred to
destinations. Increasingly, there is a general agreement among academics and practitioners that
destinations can be branded in much the same way as consumer goods and services (e.g. Olins,
2002; Kotler & Gertner, 2002; Anholt, 2002; Papadopoulos & Heslop, 2002).
It is also vital to note that the vast majority of tourism destination studies have addressed and
examined the brand concept primarily from a demand-side perspective, adopting a consumer-
perceived image approach (e.g. Echtner & Ritchie, 1993; Baloglu & McCleary, 1999; Anholt,
9
2005). In contrast, only some years ago did researchers advocate the importance of a supply-side
managerial perspective on tourism destination branding (e.g. Cai, 2002; Hankinson, 2007; Blain
et al., 2005; Balakrishnan, 2008; 2009). Beyond research efforts particularly dealing with
destination branding, important input in the present study definitely stems from the work of top
academics in the branding field, with a research focus on brand building and the development
and maintenance of strong brands, without direct connotation of the tourism destination context
(e.g. Doyle, 1990; Aaker, 1996; Davis et al., 2002; Keller, 2008).
Nevertheless, a profound research work particularly focused on delineating the necessary steps
of a successful destination brand strategy seems indispensable. Indeed, a close examination of
the literature reveals a lack of clear definition of a successful destination brand strategy process,
very little careful attention to management issues and virtually no empirically tested theory.
Thus, in order to further contribute to the theoretical development of a destination branding
framework, we specially designed a qualitative study.
2.2.2 Model of Destination Branding
Cai (2002) proposed a conceptual model for Tourism branding with a focus on building the
identity of Tourism by creating dynamic linkages among the brand element mix: image building,
brand associations and marketing activities; the model highlights the importance of other
stakeholders of Tourism, apart from tourists (competitors, Tourism’s marketers)

10
Figure 2-1: Model of Destination BrandingSource: Cai 2002
As presented in Figure2-1, Cai’s model synthesizes the different approaches to Tourism
branding, linking the concepts from a consumer’s perspective to the Tourism marketer’s
perspective (Henderson, 2007). The process begins with the selection of brand elements (logo,
slogan etc.) to form strong brand associations that reflect the attributes (perceptual features
characterizing the Tourism), affective components (personal values and meanings related to the
benefits expected from the attributes) and attitudes of the image (overall impressions) (Cai,
2002). the image that marketers want to project is united to tourists’ images to build a strong
desired brand image consistent with the brand identity. Through marketing programs, marketing
communications and management of secondary associations, the brand identity is enhanced
through spreading activation, a concept introduced in 1983 by Anderson in referencing to
Brand ImageBuilding
Brand ElementMix
ManagingSecondary
Associations
MarketingCommunications
MarketingPrograms
AttributeComponents
AffectiveComponent
AttitudesComponent
BrandIdentity

11
memory, but which can also be applied to branding: to build a brand image one needs to ‘identify
the most relevant associations and strengthen their linkages to the brand’ (Cai, 2002: 723).
The four elements outside the circle represent the contextual preconditions of the Tourism branding
process.
Tourism image and Tourism branding in transition countries Aaker & Joachimsthaler (2000)
developed a model for brand leadership consisting of three steps; the model can also be applied
to Tourism branding: tourist analysis, competitor analysis and self-analysis. Each Tourism
product should design a systematic tourist analysis to identify new trends and understand
motivations for travelling. The second step is the analysis of the competitors (their advantages
and disadvantages, ways to improve competitiveness, find new niche markets). The last step
should be an analysis of the Tourism’s actual position in the market (Cai et.al. 2009).
The two models include both the tourists and the country’s marketer perspective. Cai argues that
Tourism branding process should include positioning and definition of target markets (basically a
competitor analysis in Aaker & Joachimsthaler’s model), Tourism’s size and composition (self-
analysis) and study of the perceived image (tourist analysis).
For this dissertation, Cai’s model will be used, as it is currently the most complete. It enables the
assessment of the difference between the projected image and the perceived image of Tourism
and provides the tools for building the desired image (consistent with the brand identity) through
marketing. Aaker & Joachimsthaler’s model does not include the marketing elements,
fundamental for matching of the perceived image with the promoted image.
According to O’Regan (2000:347), the image formation is ‘what ends up in people’s minds as a
result of everything they know about the physical characteristics of a product or service and all
the assumptions, associations, ideas and experiences (however erroneous) they have picked up
about that product, service or country over the years ‘.
There are two approaches to the destination image formation process: static and dynamic
(Baloglu & Mcleary, 1999). The first refers to the study of the relationship between image and
tourist behavior (e.g. satisfaction, destination choice). The dynamic approach studies the
structure and the formation of the destination image (Gallarza et. al., 2002).

12
Fakeye & Crompton (1991) developed a model of image formation based on three types of
image: organic, induced and complex. The organic image of a destination is formed as a result of
exposure to mass-media outputs, books and other non- touristic sources about a destination. The
organic image evolves after the contact with destination promotional sources; this image can be
formed even without previous visitation. The complex image is formed after visitation of the
place. The organic image tends to be very stable and is generally stereotyped. Marketers can
influence the induced image, but the overall, complex image is very difficult to change because
of the stability of the organic component.
13
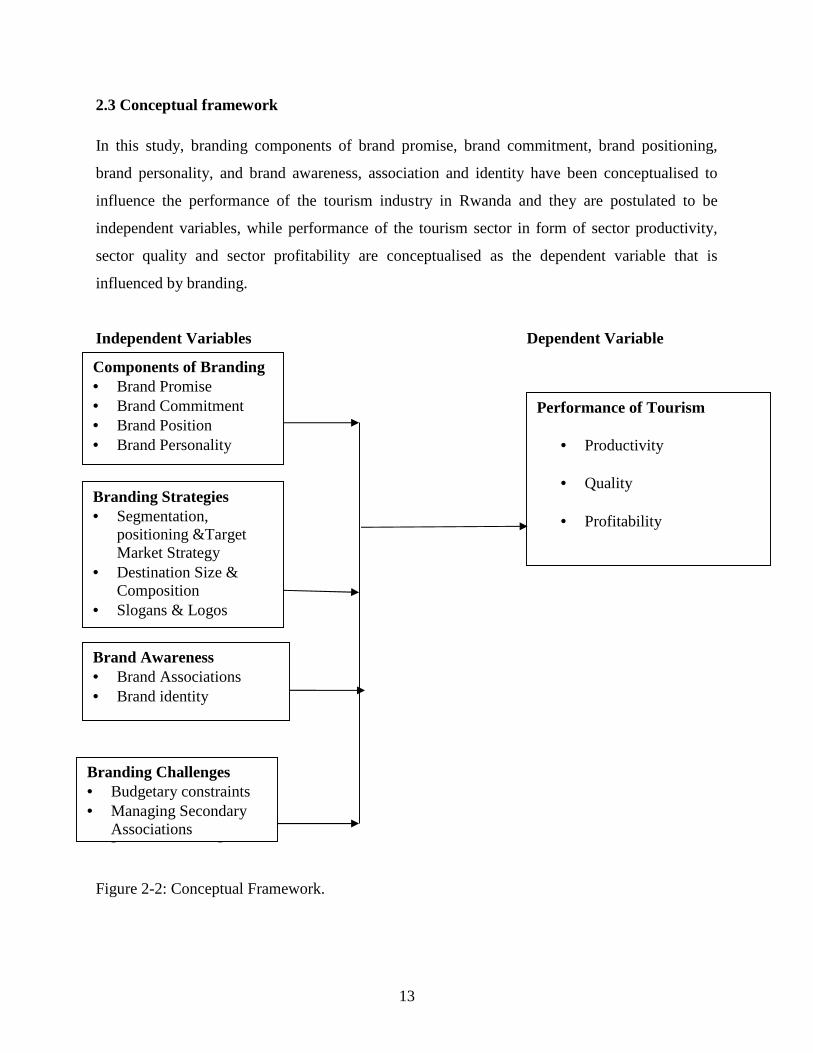
2.3 Conceptual framework
In this study, branding components of brand promise, brand commitment, brand positioning,
brand personality, and brand awareness, association and identity have been conceptualised to
influence the performance of the tourism industry in Rwanda and they are postulated to be
independent variables, while performance of the tourism sector in form of sector productivity,
sector quality and sector profitability are conceptualised as the dependent variable that is
influenced by branding.
Independent Variables Dependent Variable
Figure 2-2: Conceptual F
Figure 2-2: Conceptual Framework.
Components of Branding Brand Promise Brand Commitment Brand Position Brand Personality
Branding Strategies Segmentation,
positioning &TargetMarket Strategy
Destination Size &Composition
Slogans & Logos
Brand Awareness Brand Associations Brand identity
Performance of Tourism
Productivity
Quality
Profitability
Branding Challenges Budgetary constraints Managing Secondary
Associations

14
2.4 Review of Related Literature
2.4 Review of Variables
The objectives of the Tourism branding are mainly to differentiate Tourism from the
competitors, to increase the awareness and recognition amongst potential tourists, to create a
positive image for the Tourism and to create a strong brand and brand identity for the Tourism
(HTDB, 2009). Tourism branding can help to improve and increase (indirectly) the positive
image of the whole country through the promotion of tourism.
2.4.1 Analysis of Components of branding.
Aaker, (1991) identifies a brand as a distinguishing name and/or symbol (such as logo,
trademark, or package design) intended to identify the goods or services of either one seller or a
group of sellers, and to differentiate those goods or services from those of competitors. A brand
thus signals to the customer the source of the product, and protects both the customer and the
producer from competitors who would attempt to provide products that appear to be identical.
Brands provide the basis upon which consumers can identify and bond with a product or service
or a group of products or services (Weilbacher, 1995). From the customer’s point of view, a
brand can be defined as the total accumulation of all his/her experiences, and is built at all points
of contact with the customer (Kapferer, 2004). A successful brand is an identifiable product,
service, person or place, augmented in such a way that the buyer or user perceives relevant,
unique added values which match their needs most closely (Chernatony and McDonald, 1998).
Keller (2003a) acknowledges that consumer brand-knowledge can be defined in terms of the
personal meaning about a brand stored in consumer memory, that is, all descriptive and
evaluative brand-related information. Different sources and levels of knowledge such as
awareness, attributes, benefits, images, thoughts, feelings, attitudes, and experiences get linked to
a brand and its understanding by the consumer. The brand, in a sense, acts as a credible
guarantee for that product or service, allowing the consumer clearly to identify and specify
products which genuinely offer added value (Murphy, 1998). Powerful brands provide long-term
security and growth, higher sustainable profits, and increased asset value because they achieve
competitive differentiation, premium prices, higher sales volumes, economies of scale and
reduced costs, and greater security of demand (Temporal, 2000).

15
An important factor influencing the selection of a brand concept is consumer needs. According
to Park et al. (1986), many brands offer a mixture of symbolic, functional, and experiential
benefits. Functional needs are defined as those that motivate the search for products that solve
consumption related problems (e.g. solve a current problem, resolve conflict, and restructure a
frustrating situation). A brand with a functional concept is defined as one designed to solve
externally generated consumption needs. Symbolic needs are defined as desires for products that
fulfill internally generated needs for self-enhancement, role position, group membership, or ego
identification. A brand with a symbolic concept is one designed to associate the individual with a
desired group, role, or self-image. Experiential needs are defined as desires for products that
provide sensory pleasure, variety, and/or cognitive stimulation. A brand with an experiential
concept is designed to fulfill these internally generated needs for stimulation and/or variety.
A brand essence that is based on emotional and self-expressive benefits provides a higher-order
basis for relationships which can be less vulnerable to product-related changes or easily applied
to new contexts (Aaker and Joachimsthaler, 2000). A brand’s value proposition is a statement of
the functional benefits, emotional benefits, and self-expressive benefits delivered by the brand
that provide value to the customers. Functional benefits are the most common basis for a value
proposition, based on a product attribute that provides functional utility to the customer and
relate directly to the functions performed by the product for the customers. Emotional benefits
are positive feelings the customer has about the brand and is related to the experience of owning
and using the brand. Most functional benefits have a corresponding feeling or a set of feelings.
Self-Expressive benefits focus on person’s self- concept, aspirations, and provide a way for a
person to communicate his or her self-image.
Brands evolve over time. The first level pertains to express the identity of the producer (i.e.
label). The second level is known as functional superiority (perceived by customer as
differentiation). While the third level is referred to as emotional touch, fourth level pertains to
the Power of self-expression. At the top of the pyramid, the highest level (i.e. fifth level) is
known as cult.
16
To be able to develop a strong brand it is important to convince the customers a promise of value
and then ensuring that the promise is kept (Ward et al, 1999). A promise builds up an expectation
of some kind in any context and that is also the case in the business industry. Therefore, it is
important to meet customers’ expectations which are founded in the brand promise (Chong,
2007).
Brand “promise” is the essence of the benefits (both functional and emotional) that customers
can expect to receive from experiencing a brand’s products/services, which reflects the heart,
soul, and spirit of the brand (Knapp, 2000). Successful brands are those brands which adapt well
to the environment and thus survive and flourish in the long term in spite of competition they
face.
In the literature there are various ways of describing brand promise as well as the interpretations
of the concept of a brand. The interpretation of brand as a promise has been adopted of several
writers (Ambler & Styles, 1996; Punjaisri et al, 2008). This promise can be bundles of attributes
that someone buys and that provides satisfaction. The attributes may be real or illusory, rational
or emotional, tangible or intangible (Ambler & Styles, 1996). Deighton (1992) are viewing the
brand as a promise for future performance and has to be reached if the company wants the brand
to be trusted by the customers in the future. According to De Chernatony and Segal-Horn (2003)
brand promise is explained as how functional and emotional values should be combined to
position the brand and grow its personality. While Chong (2007) defines the concept as a
company’s set of corporate core values, i.e. the espoused and internalized values. These values
declare who the company is and what it stands for. In addition Ind (2003) explains brand promise
as an ideology aspect that may lead companies to be value based organizations. The ideology
states a purpose and an organizational direction. It works as a philosophy for the employees’ to
engage with. How the ideology is formulated and named is not relevant. The important is to
make it clear and truthful to the whole organization in order to realize business objectives. The
ideology will provide a framework for how to communicate and behave internally and externally
within the company (Ind, 2003).
When customer- facing employees have been familiar with the brand and understand the brand
promise, they might be able to establish a brand commitment (Thomson et al, 1999; Khan, 2009;
Mitchell, 2002; Dunn & Davis, 2003).
17
Brand commitment is defined in many ways but the most common and clear one is employees’
emotional attachment to the brand and its value. The psychological bond influences and drives
them to put extra effort to reach the brand goals (Thomson et al, 1999). The literature discusses
brand commitment with internal branding and is its origin in the attitude. Brand commitment
describes throughout the literature as a branch of a customer- facing employees’ attitude and how
the level of brand commitment results in the quality of brand promise delivery (Sager &
Johnston, 1989; Punjaisri & Wilson, 2007; Khan, 2009). Whereas another part discusses the
concept as a behavioral construct (Burmann & Zeplin, 2005; Burmann et al, 2009) and different
authors show investigations of measuring brand commitment associated with internal branding
(Thomson et al, 1999; Punjaisriet al, 2009a; 2009b; Kimpakorn & Tocquer, 2009).
According to Sager and Johnston (1989) De Chernatony (2002) and Ind (2003) brand
commitment is a key driver to get the customer- facing employees to live the brand throughout
the delivery of brand promise. When the employees feel passion and commitment towards the
brand, they will perform according to the brand promise (Burmann & Zeplin, 2005; Punjaisri &
Wilson, 2007). Research shows that companies that were reflected by high- committed
employees outperformed those companies who were low- committed (Ind, 2003). The extent to
which the employees’ are committed to the brand results in differentiation. It is likely to behave
in line with the brand by just understand the brand promise, but brand commitment is vital to get
a genuine and trustworthy delivery of it (Thomson et al, 1999; Ind, 2003).
Punjaisri et al (2009a) have made an empirical investigation regarding the relationship between
brand commitment and brand performance, i.e. the brand promise delivery. The investigation
measured the brand commitment among customer- facing employees. The literature empathize
brand commitment as an attitudinal dimension. It is understood as a mediator between
communicating the brand internally and the brand performance, i.e. how well the service
encounter meets the brand expectations. As well as a mediator between training the brand
internally and brand performance (Punjaisri & Wilson, 2007; 2011).
Several academics explain brand commitment as a behavioral construct. They attempt to present
a holistic and conceptual model for internal brand management, where brand commitment has an
essential role (Burmann et al, 2009).

18
Brand commitment is explained as a psychological process, which forces employees into the
behavior of living the brand. A study according to the conceptual model based on an empirical
investigation shows that brand commitment is a one- dimensional construct. The one
dimensional construct is characterized by two accumulated factors, identification and
internalization (Burmann et al, 2009). Identification with the brand measures employees’
perception of their constituent of the brand and company, which infer the extent to which the
employees’ perceive a relationship and association towards the brand and its success and
failures. Whereas, internalization measures how well the brand and its values have been
incorporated into the self- concept, i.e. it refers to what extent the employees have absorbed and
accepts the brand and its value into their thinking and behavior (Burmann & Zeplin, 2005;
Burmann et al, 2009).
The same empirical investigation shows that brand commitment has a positive effect on
customer- facing employees’ potential to live the brand (Burmann et al, 2009).
According to Vallaster & De Chenatony (2006) employees need to have a particular feeling of
belonging to the brand. There must be a moral and emotional relationship that goes beyond a
“normal” relationship to cause a strong emotionally desire to fulfill the brand promises.
Employees incorporate the brand values into their own value system and are therefore more
likely to work toward the brand success. It is easier to work towards something that is
incorporate in the own values.
Ambler and Barrow (1996) have another view of commitment and claim that employee’ brand
commitment varies by type of industry, such as hotel groups, financial institutions and airlines.
From the literature reviewed it is clear that different authors understand brand positioning
slightly differently. Literature shows that there is a development in understanding what
positioning means for brand management, moving from advertising strategy to core long-term
brand strategy determining consumer perception of the brand.
The word “positioning” was first used by Ries and Trout in 1969 in an article in Industrial
Marketing, Keegan & Schlegelmilch, (1999) describing a strategy for ´staking out turf’ or ´filling
a slot´ in the mind of target customers. Many authors associate the importance of positioning
19
with advertising concept of USP (Unique selling proposition). One of them, Rivkim & Trout,
(1996), associates positioning to a great extent to successful communication, leaving the
preceding process of developing the strategy for this communication (and positioning of a brand
or idea) aside, as demonstrated by his statement: “The term positioning means, that the company
concentrates on one idea or slogan, with which the consumer identifies himself” .
A. Ries and L. Ries (2002) stress also the importance of consumer: “Advertisers and agencies do
not position product. Consumers do. Companies need to determine what position their products
already occupy in the consumers mind and relative to other products: only than they can act to
reinforce or change that position.” The important object in positioning is not the producer
(marketer, advertiser) of the brand but the consumers.
Some other authors relate positioning closely to segmentation of the market and achieving
competitive advantage through differentiation. Kuss and Tomczak (1998) further understand
under positioning “achieving a competitive advantage throughout specific target group” while
according to Belch and Belch (1995) it is “the art and science of fitting the product or service to
one or more segments of the broad market in such a way to set it meaningfully apart from
competition”, This means, that consumer, or more specifically target audience and competition
are source of differentiation of a brand.
Kroeber-Riel and Esch (2000) relate positioning with consumer associations and brand image,
describing positioning as “measures leading to subjective customer perception of the offer,
which is differentiated from the competition and therefore preferred” Keller (1998) defines: “The
essence of positioning is that the brand has some sustainable competitive advantage or unique
selling proposition. Such a selling proposition gives consumer a compelling reason why they
should buy a particular product. Thus one critical success factor for the brand is that it has some
strongly held, favorably evaluated associations that function as a point of differentiation and are
unique to the brand and imply superiority over other competing brands”.
David Aaker (1996), one of the most respected authors on the topics of branding points that
“Brand position is part of the brand identity and value proposition that is to be actively
20
communicated to the target audience and that demonstrates an advantage over competing
brands”
The further development shifts positioning into category of strategic marketing tools as brought
by A. Tybout and B. Sternthal in Kellog on Branding “Brand positioning plays a key role in the
building and managing of a strong brand by specifying how the brand is related to consumer´s
goals.” (Tybout & Calkins, 2005, p. 25) The authors present the positioning statement composed
of four parts: targeted consumer, frame of reference, point of difference and reasons to believe.
Compared to other authors they put more emphasis on identification of the frame of reference as
a potential source of brand´s future growth.
Ries & Trout, (2001) explain that positioning is, despite his long history, a very contemporary
tool in strategic marketing. There are some common opinions about what positioning should
consist of, but there are also many uncertainties in how to achieve a clear and unique brand
position in consumers´ mind. P. Kotler points that “marketing is not a static discipline.
Marketing is a constantly changing discipline and positioning is one of those revolutionary
changes that keep the marketing field alive, interesting, exciting, and fascination”.
Sagar et.al, (2011) explain that the brand personality is the construct of the brand positioning.
Brand personality is the way a brand speaks and behaves, i.e. assigning the human personality
and traits to a brand so as to achieve differentiation (Bhatia, 2012). In the study of (Aaker, 1997)
brand personality is defined as the ‘personification of brand identity’. The ‘personification of
brand identity’ requires that the joining together the human psychological attributes and brand-
related attributes. The outcome is in the form of a symbol or metaphor or a sound which
“connects and develops” a relationship with customers. Personification of identity requires
identification of persons, animals, visual images, and colours which are in resonance with the
company’s identity and there are certain indicators of the brand personality mentioned by (Sagar
et.al, 2009) that may be used to measure the positioning of brand. The indicators are: Sincerity
about value delivery, Committed to brand value delivery, technically competent, Celebrity
Product involvement, Reliable. Distinct brand personality plays a key role in the success of a
brand. It leads customers to perceive the brand personality and develop a strong connection to

21
the brand (Doyle, 1990). A brand personality should be shaped to be long-lasting and consistent.
Besides, it should also be different from other brands and meet consumer’s demands (Kumar et
al., 2006). Hence, the consumers of those toys and video games are like the brand spokespersons
and become the basis for suppliers to build brand personality. With the specific brand
personality, consumers of varying personality traits will be attracted and their brand preference
will then be further developed. In addition, a company can maintain a good relationship with
customers through its brand personality (Aaker and Biel, 1993). Since brands have their own
particular personalities, consumers may treat brands as real human beings. In this case,
consumers will expect the people’s words, attitudes, behavior or thoughts and so on to meet their
respective personality traits (Aaker, 1996). Consumers may likely use the brand and products in
line with their own personality traits, in other words, all the marketing activities are aimed at
having consumers believe and recognize a brand personality, and reinforcing the communication
between the brand and the consumer (Govers and Schoormans, 2005), in order to enhance the
brand’s loyalty and equity.
Brand personality has become a widely discussed issue in recent years. It has been emphasized in
many brands and products, including durables goods, consumables goods, entertainment and
luxury goods, and so on (Kumar et al., 2006; Govers and Schoormans, 2005; Mengxia, 2007).
Consumers may have their own preference for the brand and product in compliance with their
brand personality and personality traits or their own concepts (Govers and Schoormans, 2005).
Brand personality mainly comes from three sources: the first one is the association consumers
have with a brand, secondly, the image a company tries hard to create, for example, using an
advertising spokesperson to create a corporate image, and the third is about the product
attributes, for example, product categories and distribution channels.
Personality is a useful variable in the consumer’s choice of brands. The brands selected by
consumers are usually in compliance with their own personalities. Hence, brand personality
offers the functions of self-symbolization and self-expression (Keller, 1993). It is indicated that
brand personality contains demographic features, such as gender, age and social class, and they
may be directly influenced by the image of the brand users, personnel and product

22
spokespersons, and indirectly affected by product attributes as well (Levy, 1959). Kotler and
Keller, (2005) asserted that consumers usually select brands having self-concept congruence.
However, sometimes, consumers will select a brand according to their ideal self-concept or the
social self-concept. Thus, brand personality may have the function of demonstrating and
expressing your own personality at the same time. (Karande et al., 1997) believed that product
designers and marketing personnel may benefit from the features of brand personality, because
they may develop their marketing plans according to the features. In addition, with brand
personality, a product can be differentiated from other brands.
2.4.2 The Tourism branding strategy
In the actual global environment, like companies, countries compete ‘to devise sources of
competitive advantages’. Brands are considered fundamental tools for differentiation and
therefore competitive advantages (Kotler & Gertner, 2002:253). Olins (2001).argues that
nowadays companies and countries are similar and learn from each other to create brands
looking for stability and prosperity
There are several steps to follow in a Tourism branding strategy, similar to the product branding:
Tourism audit, segmentation analysis, SWOT analysis, stakeholder engagement, consumer
perception research, competitor analysis, brand-building models, integration of the brand into
marketing activities, global versus local marketing campaigns and global brands versus target
segments (HTDB, 2009). As Aaker& Joachimsthaler (2000) argue, each Tourism destination
should do a self-analysis first, followed by a competitors’ analysis and research about tourists.
The promotion is a fundamental part of the branding strategy and the marketers have to focus on
marketing activities and advertising campaigns.
This project analyzes two of the main steps of the branding strategy: the consumers’ perception
research and the analysis of the image promoted (thorough the marketing activities, namely the
promotional video).
The consumers’ research is one of the most important parts of all the branding process. It’s
fundamental for a destination determining how potential visitors see it and which are the greatest
strengths and the weaknesses (HTDB, 2009). The research has to focus on the target segments
23
established in the anterior step of the process and include both visitors and non-visitors because
it would help to find gaps between perceptions about the destination and the reality.
For the branding of a destination, the sender projects the Tourism brand identity thorough all the
communication tools and promotion activities chosen to differentiate the Tourism from its
competitors (Quet.al. 2011).
Lovelock describes positioning as the process of establishing and maintaining a distinctive place
in the market for an organization and/or its individual product offerings (Lovelock 1991).
Lovelock argues that positioning services involves developing and communicating key product
attributes, and is not primarily about creating advertising images. In contrast to image, position
requires a frame of reference, which is provided by competitive destinations (Crompton 1992). I
Dolnicar (2008) introduces the concept of market segmentation as a strategy. He states (p. 6) that
“Market segmentation consists of viewing a heterogeneous market (one characterized by
divergent demand) as a number of smaller homogenous markets”. When segmenting a market,
groups of individuals are developed which are similar with respect to some personal
characteristic. The particular personal characteristic with respect to which similarity is explored
is the segmentation criterion or segmentation base. Segmentation criteria / bases can be socio-
demographics (for instance, old versus young tourists), behavioural variables (skiers versus
sightseers) or psychographic variables (tourists motivated by rest and relation versus those
motivated by action and challenges).
Dolnicar (2004a) concludes that common sense segmentation remains the most common form of
segmentation study conducted in academic (and most likely also industry) tourism research: 53
percent of all segmentation studies published in the last 15 years in the main outlet for tourism
segmentation research (the Journal of Travel Research) were commonsense segmentation
studies. Recent examples include
Kashyap and Bojanic (2000), who split respondents into business and leisure tourists and
investigates differences in value, quality and price perceptions, Israeli(2002), who compares
destination images of disabled and not disabled tourists, Klemm (2002), who profiles in detail
one particular ethnic minority in the UK with respect to their vacation preferences, and

24
McKercher (2002), who compares tourists who spend their main vacation at a destination with
those who only stop on their way through. Other commonsense studies are discussed in Dolnicar
(2005)
Figure 2-3: Steps in common sense segmentationSource: Dolnicor, (2008)
Destination image can be defined as ‘an attitudinal construct consisting of an individual’s mental
representation of knowledge (beliefs), feelings, and global impression about an object or a
destination’ (Baloglu& Mc Cleary, 1999:870) (for another definition, please refer to Glossary).
Henderson (2007) argues that destination image is multidimensional, with cognitive and
affective elements; it is a mix of information, feelings, beliefs, opinions, ideas, expectations and
perceptions about a certain place.
The image of a Tourism product is, consequently, fundamental for the selection process. Yan
(2008) and Anholt (2005) consider that a positive image could increase the international political
influence, restore international credibility and enhance a country’s reputation. More so than any
marketing or branding campaign, it’s fundamental for a nation to have a good reputation that
Step 1: Selection of the Segment Criterion(eg. Age, gender, $ spent, country of origin)
Step 2: Grouping respondents into segments by assigningeach respondent to the respective segment.
Step 3: Profiling of segments by identifying in which personalcharacteristics segments differ significantly.
Step 4: Managerial Assessment of the usefulness of themarket segments (and formulation of target marketingactivities).

25
could increase its competitiveness and enhance the economic, political and social development
(Anholt, 2009; Loo & Davies, 2006). Reputation is defined as ‘the aggregate of stakeholders’
images of a country over time’ (Passow et.al. 2005). Reputation changes very slowly and doesn’t
necessarily follow real changes (HTDB, 2009). Often, countries that fail to develop a good
reputation become the ‘victims’ of competitors and target markets that create stereotypes and
negative beliefs. Nowadays, considering recent world trends, there are several critical areas of
reputation on which countries need to focus: environmental credentials, technology and self-
improvement (ibid.). This last area is concerned with Tourism branding: countries have to
promote themselves and gain a reputation as Tourist destinations for personal advancement and
personal re- discovery It is more difficult to manage and build a good reputation for a country
than for a company because: countries are not free to choose the internal audience, the identity is
hard to change, they are democracies (while companies ‘dictatorships’ under the command of the
CEO), the government has limited power and is held accountable by the electorate, the
constitution is binding (Passow et.al., 2005)According to the Rwanda National Export Strategy,
Some smaller locations, such as Austin, Texas, had success with unique branding efforts. For
tourism purposes, Austin developed the memorable ―Keep Austin Weird campaign, and
immediately increased visitors by several hundred Thousand annually.
Slogans and logos are fundamental for the communication and enhancement of the brand image
and brand equity (Henderson, 2007). They are two of the elements that help a brand to
differentiate itself from competitors (other destinations).
The logos are efficient if they are used consistently over time; they are the symbol of a
destination and represent it.
The main purpose of a country slogan is to build brand image and brand awareness (Keller,
1993). There are two types of brand awareness: brand recall and brand recognition. Brand
recognition refers to the consumers’ capacity to discriminate the brand ‘as previously seen or
heard’. Brand recall refers to the consumer’s ability to retrieve the brand from memory when
given the product category, the needs fulfilled, a purchase or a usage situation. To increase the
brand awareness, the slogans need to be linked to the brand name and the meaning of the brand,
so a country brand (its name) should be always associated with the slogan to increase its

26
memorability. In most cases, effective slogans are memorable short phrases that refer to the core
benefits of destination brand.
2.4.3 Brand association awareness and identity
Aaker, (1991) explain that brand association is anything that is linked in memory to a brand. The
association reflects the fact that products are used to express lifestyles whereas other associations
reflect social positions, and professional roles. Still others will reflect associations involving
product applications, types of people who might use the product, stores that carry the product, or
salespeople who handle the product or even the country of origin. (Keller, 1998) defines brand
associations as informational nodes linked to the brand node in memory that contains the
meaning of the brand for consumers.
These associations include perceptions of brand quality and attitudes towards the brand. Keller
appears to hypothesize that consumer perception of a brand are multi-dimensional, yet many of
the dimensions they identify appear to be very similar. The image that a good or a service has in
the mind of the consumer-how it is positioned is probably more important to its ultimate success
than are its actual characteristics. According to (Aaker, 1991) there are at least nine brand
associations. The associations convey either the concept, or the meaning of the product in terms
of how it fulfills a customer’s need.
From a brand association perspective (Aaker, 1991) felt that brand equity is closely related to
brand association. “A brand association is anything linked in memory to a brand” (Aaker, 1996).
Keller, (1998) suggests that brand association can be divided into three major categories:
attributes (including product-related attributes and non-product-related attributes such as price,
brand personality, emotions and experience), benefits (what customers think the product or
service can do for them, including functional benefits, symbolic benefits and experiential
benefits) and attitudes (customers’ overall evaluations of the brand) The most powerful brand
associations are those that deal with the intangible or abstract traits of a product. Brand
association can assist with spontaneous information recall (Van Osselaer and Janiszewski, 2001)
and this information can become the basis of differentiation and extension (Aaker, 1996). Strong
association can help strengthen brand and equity. Similar to perceived quality, brand association
can also increase customer satisfaction with the customer experience (Aaker, 1991).

27
Atilgan et al, (2005) and Pappu, (2005) explain that brand awareness and brand associations tend
to be correlated. Moreover, high levels of brand awareness positively affect the formation of the
product’s brand image (association) (Ramos and Franco, 2005). Esch et al, (2006) discovered
that brand awareness tends to affects brand image (association).
From the literature above, we can assert that brand identity is a unique set of brand associations
implying a promise to customers and includes a core and extended identity. Core identity is the
central, timeless essence of the brand that remains constant as the brand moves to new markets
and new products. Core identity broadly focuses on product attributes, service, user profile, store
ambience and product performance. Extended identity is woven around brand identity elements
organized into cohesive and meaningful groups that provide brand texture and completeness, and
focuses on brand personality, relationship, and strong symbol association.
Aaker and Joachimsthaler, (2000) concluded that to be effective, a brand identity needs to
resonate with customers, differentiate the brand from competitors, and represent what the
organization can and will do over time. To excel, a brand image must be well planned, nurtured,
supported, and vigilantly guarded (Knapp, 2000). One key to successful brand-building is to
understand how to develop a brand identity – to know what the brand stands for and to
effectively express that identity (Aaker, 1996). A brand is a distinctive identity that differentiates
a relevant, enduring, and credible promise of value associated with a product, service, or
organization and indicates the source of that promise (Ward et al., 1999).
Companies that present a cohesive, distinctive, and relevant brand identity can create a
preference in the marketplace, add value to their products and services, and may command a
price premium (Schmitt and Simonson, 1997). When brand faces aggressive competition in
marketplace, brand personality and reputation of the brand help it distinguish from competing
offerings. This can result in gaining customer loyalty and achieve growth. A strong brand
identity that is well understood and experienced by the customers helps in developing trust
which, in turn, results in differentiating the brand from competition. A company needs to
establish a clear and consistent brand identity by linking brand attributes with the way they are
communicated which can be easily understood by the customers.

28
A conclusion that we can derive from the literature is that a set of brand associations can enable a
brand to develop a rich and clear brand identity. While some customers may attach greater
importance to functional benefits, emotional value helps the brand stand above others.
Another conclusion we note is that building brand associations requires a company to understand
its brand as well as competitors’ brands through customer research. Customer research should
study existing and prospective customers, former customers, industry experts, and
intermediaries. Brand strengths associated with beliefs and values are the most powerful and
most difficult to imitate.
Aaker and Joachimsthaler, (2000) further analysed that brand image is the perception in the mind
of the customers about the brand and its associations. In contrast to brand image (the brand’s
current associations), a brand identity is inspirational and may imply that the image needs to be
changed or augmented. In a fundamental sense, the brand identity represents what the
organization wants the brand to stand for. Meanwhile, Wee and Ming, (2003) noted that the
“brand as personality” stage marks an important transition phase since not all brands evolve into
consumer icons, especially if the consumers do not relate to, or believe in, the communications
of the brand, or they sense some inconsistencies with the brand’s communications.
Sherrington, (2003) helps us to understand that a brand’s personality provides a richer source of
competitive advantage than any functional feature can. Personality attributes help the brand to
achieve sustainable differentiation as they are more difficult to copy than functional features of
the product and service by the competition. Another advantage of the personality association is
that it establishes direct relationship with the customers.
2.4.4 Challenges of tourism branding
Besides the potential benefits a Tourism branding process can bring, there are also challenges to
consider.

29
The most significant of these is probably reaching balance in the representations of a country.
Tourism is often the most promoted sector, which can lead to an economy being affected by a
leisure-oriented image, especially if it is based on rural and traditional values (Dinnie, 2003).
Another challenge is objectivity. Marketers of smaller countries’ brands should try to present a
real image of a country and not to highlight limited achievements or historical facts important to
nationals but which aren’t interesting for the world population. They need to be objective and see
their country through the eyes of an indifferent consumer (HTDB, 2009). The difficulty of
achieving coordination between stakeholders (Pike, 2004) is also an important challenge for
developers of destination branding.
On the surface, it may be easy to understand why certain people do not take to a brand, or
welcome it with open arms, but what is going on underneath to explain this behavior? In their
article ‘‘the curious case of behavioural backlash: why brands produce priming effects and
slogans produce reverse priming effects’’, Laran et al. (2011) look into the differing effects of
brands and slogans, and how they can sway consumers. In order to do this, they create several
experiments to show the effects of ‘‘priming’’. This is the activity consumers undergo when
they interpret a brand. So, for example, when we walk through a mall and see the sign for the
Gap, we think ‘‘hmm, basic styles, reasonably priced, good quality, might be something I can
pick up in the sale’’. Different people will have different responses, but essentially they will
follow the status of the brand formulated by the brand itself, although this can go horribly wrong
of course if consumers do
Compared to more developed countries, small developing countries such as Rwanda face
budgetary and operational challenges while forging their national brands abroad.
As such, Rwanda will explore creative and cost efficient ways to create position and
communicate Brand Rwanda.
According to Nielsen et al (2010) since 2005, nearly US$ 428,248 has been directly invested in
community projects and used to empower communities. However, the value equates to a total
investment of only US$ 1.45 per person since its inception and an average of US$ 0.36 per
person per year.

30
According to the Rwanda National Export Strategy, Rwanda’s brand is not well established
internationally and suffers from unwanted associations. Rwanda often receives unfair press
through questionable sources. In a competitive global market, this association can hinder product
positioning in key exports markets. A positive brand must be established for Rwandan products
internationally in order to convey the true spirit of Rwanda.
Goeldner and Ritchie (2003) as cited in Booker (2012) note that fear and safety is one of the
barriers to travel. They further argue that “things unknown are often feared and in travel much is
often not familiar to the would be traveller. Wars unrest and negative publicity about the area
will create doubt and fear in the mind of the prospective traveller.
Egmond(2009) as cited in Booker (2012) points out that tourists stay away when a country or
region is not safe or is thought of as unsafe and there are downturns in visitor numbers due to
war, domestic riots and bomb attacks on tourist centres citing an example of Yugoslavia which
was lost as a tourist destination during the early 1990s.
Brand associations are “informational links of the attributes, benefits and attitudes about the
brand in the memory of a consumer and it reveals the meaning of the brand to the consumer”
(Sheena, 2012, 33). These associations, such as symbols, product attributes, or celebrity
spokespeople help brands identify in the consumer’s mind and create a strong relationship
between the consumer and the brand (Aaker, 1996).
2.4.5 Enhancing Tourism Sector Performance.
The contribution of branding on performance of the tourism sector will be measured in terms of
Productivity, Quality and Profitability. Variables like increased production and performance
enhanced quality of the sector and increased net income.
Tourism is one of the fastest growing sectors in the world; it plays a very important role in the
economy and stimulated the growth of other economy (Osman and Sentosa, 2013). The Travel
and Tourism industry outperformed the global economy in 2012; it grew faster than
manufacturing, retail, financial services and communications. The industry has grown its total

31
contribution to GDP by 3% and increased the number of jobs by five million to 260 million, and
therefore one in 11 of all jobs in the world are now supported by Travel and Tourism. More than
10% of all new jobs created in 2012 were from the industry. According to the World Travel and
Tourism Council‟s economic research, in 2012, Travel and Tourism’s total economic
contribution was US$6.6 trillion in GDP. This contribution represents 9% of total GDP (WTTC,
2013). Increases in wages and profits and improvements in public services, growth, and welfare
can be achieved by increases in competitiveness, driven by rising productivity (DTI 2002; Porter
and Ketels 2003). In tourism, as in other sectors of the economy, productivity refers to the
efficiency with which resources are used, by relating the quantity of inputs, notably employment
of labor and capital, to outputs. It can be quantified using three main measures. The first is output
per worker.
The second is output per hour of labor. Its main advantage is that it is not influenced by the
number of hours worked over a given period and, consequently, takes account of part-time work
and time not spent in paid employment. The third is termed total factor productivity and
measures output per unit of inputs. This measure has the advantage of taking account of other
inputs aside from labor and capital but must be estimated rather than directly measured. It is a
residual that remains after accounting for the contribution of labor and capital and requires
measures of the capital stock, which are often problematic in terms of data. Each measure gives
different insights. Output per worker is often used as the main measure because it is
straightforward to quantify, since the data—total output and employment—are readily available
and can be linked to the objective of raising total output growth.
The literature sheds light on the key variables that determine productivity and competitiveness.
The methodology of growth accounting explains that increases in productivity result from
increases in physical capital, workers’ skills (human capital), and total factor productivity (TFP)
(Porter and Ketels 2003). This factor is the part of productivity that cannot be directly attributed
to capital and labor, instead reflecting high levels of innovation, effective use of technology, and
a high level of entrepreneurship. At the economy-wide level, research has indicated that
increases in capital per worker are an important driver in France and Germany, while innovation
is more important in providing the United States with a competitive advantage relative to the
United Kingdom (Crafts and O’Mahony 2001).

32
Service quality is defined as what the customer gets out and is willing to pay for” rather than
“what the supplier puts in Ducker, (1991). In some earlier studies, service quality has been
defined to the extent where the service fulfils the needs or expectation of the customers (Lewis
and Mitchell, 1990; Dotchin and Oakland, 1994). While Zeithaml et al. (1996) has
conceptualized service quality as the overall impression of customers towards the service
weakness or supremacy. Therefore service quality frequently has been conceptualized as the
difference between the perceived services expected performance and perceived service actual
performance (Bloemer et al., 1999; Kara et al., 2005).
Parasuraman et al. (1988) introduced the SERVQUAL model to measure service quality
including 22 items in five dimensions: reliability, tangible, responsiveness, assurance, and
empathy. These dimensions have specific service characteristic link to the expectation of
customers. The SERVQUAL scale was developed in the marketing context and this was
supported by the Marketing Science Institute (Parasuraman et al., 1986). Even though this model
as an instrument has been used in various studies in across industries, the SERVQUAL has
received many criticisms from other scholars (e.g., Cronin and Taylor, 1992; Brown et al., 1993).
However, there are many researchers opposed the use of SERVQUAL to measure service quality
due to the industry characteristics differences. Other previous researches confirmed that
SERVQUAL instrument is applicable in tourism industry (Fick and Ritchie, 1991; Yuan et al.,
2005; Shaikh and Khan, 2011). Medlik and Middleton (1973) noted that „the tourist product is to
be considered as an amalgam of three main components of attractions, facilities at the destination
and accessibility of the destination'. In other words, the tourist product is 'not as airline seat or a
hotel bed, or relaxing on a sunny beach… but rather an amalgam of many components, or a
package'. While, Middleton and Clarke (2001) indicated that there are five main components in
the overall product, and they are: destination attractions and environment, destination facilities
and services, accessibility of the destination, images of the destination, and Price to the
consumer.
The destination image is a relatively recent addition to the field of tourism research (Abu Ali and
Howaidee, 2012). The image of tourist destinations is an element of major importance (Hunt,
1975; Chon, 1991; Echtner and Ritchie, 1991; Gartner, 1996; Buhalis, 2000; Laws et al., 2002;
Tasci and Gartner, 2007), ultimately influencing the final choice or behavioural intention (Chen
33
and Tsai, 2007). However, pioneering studies on the image of tourist destinations, dating from
the 1970s and also the 1980s present some theoretical and conceptual limitations (Fakeye and
Crompton, 1991; Echtner and Richie, 1993; Gartner, 1993; Gallarza et al., 2002). However,
several studies have illustrated that destination images do, indeed, influence tourist behaviour
(Hunt, 1975; Pearce, 1982). Lawson and Baud Bovy (1977) define the concept of destination
image as the expression of all objective knowledge, prejudices, imagination and emotional
thoughts of an individual or group about a particular location. Other authors define the image as
the sum of all beliefs, ideas and impressions that people associate with a destination (Crompton,
1979). Bigné et al. (2001) define destination image as the subjective interpretation of reality by
the tourist. Therefore, the image tourists have of a destination is largely subjective because it is
based on the perceptions each tourist has of all of the destinations they have been to or have
heard of (San Martín and Rodriguez, 2008). In other words, the destination image is evaluated by
the attributes of its resources and attractions (Stabler, 1995) which motivate tourists to visit that
destination (Alhemoud and Armstrong, 1996, Schneider and Sönmez, 1999; Gallarza et al.,
2002; Beerli and Martín, 2004). Those destinations with strong, positive images are more likely
to be considered and chosen in the travel decision process (Goodrich, 1978; Woodside and
Lysonski, 1989). As a result, destination image has an important role for travel decisions
(Schmoll, 1977; Moutinho, 1984; Woodside and Lysonski, 1989).
Customer satisfaction is defined as satisfaction based on an outcome that characterizes
satisfaction as the end-state resulting from the experience of consumption, or a process that
emphasizing the perceptual, evaluative and psychological processes contributing to customer
satisfaction (Varvara, 1997). This definition, assessment of satisfaction is made during the
service delivery process. Customer satisfaction can also be defined as feeling of the post
utilization that the consumers experience from their purchase (Westbrook and Oliver, 1991; Um
et al., 2006). It is the feeling of happiness or unhappiness as a result of comparing the perceived
performance of services or products with the expected performance. If the perceived
performance does not meet the expected performance, then the customer will feel disappointed
or dissatisfied (Kotler, 2008). A consumer is deemed to be satisfied upon the experience
weighted sum total produce a feeling of enjoyment when compared with the expectation (Choi
and Chu, 2001).
34
In tourism studies, customer satisfaction is the visitor‟s state of emotion after they experiencing
their tour (Baker and Crompton, 2000; Sanchez et al., 2006). Customer satisfaction is one the
most areas being researched in many tourism studies due to its importance in determining the
success and the continued existence of the tourism business (Gursoy et al., 2007). Destination
holiday’s customer satisfaction is the extent of overall enjoyment that the tourists feel, the result
that the tour experience able to fulfil the tourists‟ desires, expectation, needs and wants from the
tour (Chen and Tsai, 2007).
Tourism is a significant contributor to the Australian economy
Tourism is important to Australia’s economy — people are travelling further, and more
frequently for a range of reasons including leisure, business and education. In 2014, total tourism
spending contributed almost 3 per cent of Australia’s GDP — about one-third of this ($11
billion) was by international visitors. International tourism’s share of total service exports was
just over 60 per cent in 2014. The number of international visitors to Australia has more than
doubled over the past two decades.
Demand for international tourism in Australia has grown strongly over the past two decades —
the number of international visitors has increased from 2.5 million in 1992 to almost 6.7 million
in 2014. Tourism is expected to continue to be important to the Australian economy, with strong
growth projected in the number of international visitors travelling to Australia over the next
decade.
Important drivers of demand for international tourism include foreign household incomes, the
cost of travel and the relative price of tourism in Australia compared with other destinations. For
example, rising real incomes, particularly in emerging countries in Asia, have given many more
people the opportunity to travel for the first time. Globally, airfares have fallen significantly (by
about 60 per cent in real terms) over the past four decades, which has contributed to an increase
in demand for international air services.
Despite strong growth in the total number of visitors travelling to Australia, Australia’s market
share of global international visitors has declined, in line with most other developed countries.
Australia’s share of global international visitors declined from 0.7 per cent in the year ending
2000 to 0.6 per cent in the year ending 2013.

35
Research commissioned by Tourism Australia shows that the decline in Australia’s share of the
global tourism market is beginning to stabilise for some of its historically important source
countries, such as the United States and Singapore. Market share for visitors from key emerging
countries, such as China, remains heavily contested. China is the world’s fastest growing source
of international tourism, with expenditure increasing almost tenfold since the year ending 2000.
Visitors from China now lead the world in total international tourism expenditure. As a result,
there is strong competition amongst countries to attract visitors from China, with the national
tourism agencies of many countries (for example, the United States and the United Kingdom)
running international destination marketing and other programs focused on attracting visitors
from China. Other countries, including the United Kingdom, Thailand and India, have
implemented reforms to improve visa arrangements, particularly for visitors from emerging
Asian markets.
The actions of competitor countries to attract international visitors are beyond the influence of
the policies of governments in Australia, as are some other important factors that have a
significant influence on decisions to travel abroad, such as favourable exchange rates, or the
unique attributes of a destination that appeal to particular visitors. Nonetheless, there are actions
that can be taken by Australian governments to help facilitate the most efficient level of
investment in the international tourism industry.
A key role for governments is to ensure that their policies and regulations do not unnecessarily
impede the international tourism industry from adapting to changes in consumer preferences and
technology. As visitors’ preferences to undertake different activities or to travel to different
destinations within Australia change, there will be a need for tourism-related businesses to adapt
their tourism product offerings or make new investments. This can include private sector
investments in tourism-related infrastructure, such as accommodation or resorts, and visitor
attractions such as casinos and theme parks. Investment decisions in these areas can be strongly
influenced by development assessment and approval processes (including planning and zoning
processes) and the posture adopted by regulators when administering them.
36
2.5 Empirical Studies
Tourism branding is concerned with the promotion of the tourism of a country (Szondi, 2006),
contributes to the improvement of the overall image and to the creation of a strong brand
(Anholt, 2009). A Tourism brand ‘is the sum of perceptions that someone has about a place
(whether based on experience, hearsay or prejudice), which influence his attitude towards that
Tourism at an emotional level; exists in the eyes of the beholder. It has to be credible and real, it
cannot be manufactured’ (HTDB, 2009:8; for a complete definition and a definition of Tourism,
please refer to the Glossary). The product of tourism is an experience rather than a tangible
good’ (Gartner, 1986:636). In a highly competitive global environment, where people’s
awareness of different countries is limited, it is crucial for tourism to have a strong brand, an
appealing image at that. Tourism image and Tourism branding in transition countries
differentiates it from the other Tourism products, makes it known to the world and leads tourists
to choose it for their vacations. The decision process of a tourist for the selection of a vacation
place is very complex and this is one of the biggest challenges the Tourism branding has to
overcome (Cai, 2002).
In destination branding, the slogans are seldom similar, because it’s almost impossible to
summarize a destination’s personality and identity in only a few words. This can be prejudicial
for destinations, making distinction and differentiation in the eyes of potential tourists difficult.
The slogans are not essential; the most important visual element is the logo. If the logo is
visually strong, the slogans can be changed for different consumer segments or marketing
campaigns (HTDB, 2009).
A good image and a positive reputation are probably the most valuable assets a country can
possess. Every place has an image, but ‘those of nations and other places are not directly under
the marketer’s control’ (Papadopoulos& Heslop, 2002:295).
The first studies on destination image were done by Hunt in 1970s. Pike (2002) identified 142
papers written before 2000 that relate to the topic. Since then several authors address this topic
from different perspectives: image formation and elements (Baloglu & McCleary, 1999; Gartner,
1993; Gunn, 2001; Hall, 1999); image measurement (Echtner& Ritchie, 1993; Gartner, 1989);
and the role of image in tourists’ decision process (Baloglu, 1997; Goodall, 1990).

37
The brand identity reflects how all the brand’s elements contribute to the brand awareness and
image (Keller, 1998). This is a central part of the brand’s strategic vision because it gives
purpose and meaning to the brand (Aaker, 1997). The elements of a strong brand complete each
other and ‘serve to unify the entire process of image formation and building, which in turn
contributes to the strength and uniqueness of the brand identity’ (Cai, 2002:722).
Globalization and the increased use of the internet have made image and reputation (in short, its
brand) fundamental for any country seeking to be competitive in the international arena. ‘Smart
states build their brands around reputation and attitudes in the same way smart companies do’
(van Ham, 2001:4).
As opposed to image, which is changeable in short-term, reputation is considered a strategic
asset based on long-term impressions of the destination built around images and actions (Passow
et.al. 2005). Reputation comes from actions and from a place’s unique attributes (its identity), so
‘identity is the backbone of reputation’ (ibid: 311).
Different authors have described and analysed the levels and components of the image (Gartner,
1993; Gunn (2001) as cited in Cai, 2002; Phelps, 1986). The first to analyse the elements of
image was Gunn (1972) who identified two levels of image: organic (determined by family
tradition, mass media, books, education etc.) and induced (results after being exposed to
promotion campaigns made by the marketers to attract consumers). Fakeye and Crompton (1991)
developed a model to describe the relationship between organic, induced and complex images
(formed from organic and induced images) (for other classifications please refer to Appendix 1).
Considering previous studies done in the field (please refer to Appendix 2), Baloglu& McCleary
(1999) highlight that the image construct has both perceptual/cognitive (beliefs, knowledge about
a destination) and affective (feelings) evaluations and that the overall image about a place is
formed as a result of the interaction between the two.
Krippendorf (1982) argues that ‘the tourist goes to a destination to see the image rather than the
reality’ (p. 149). The same argument is also supported by Hunt (1975) who states that images of
destinations are often determined more by an area’s image projection than its tangible resources.
Therefore, the destination’s image plays an essential role in the tourism industry.
38
Destination image contributes to the formation of a destination’s brand and to its success. There
are two different images involved in the branding process: the projected (promoted by the
marketers) and the perceived image (received by the tourists) (Tasci & Kozac, 2006).
WTO has been promoting the use of sustainable tourism indicators since the early 1990s, as
essential instruments for policy-making, planning and management processes at destinations.
The new guidebook is the most comprehensive resource on this topic, the result of an extensive
study on indicator initiatives worldwide, involving 62 experts from more than 20 countries. The
new guidebook describes over 40 major sustainability issues, ranging from the management of
natural resources (waste, water, energy, etc.), to development control, satisfaction of tourists and
host communities, preservation of cultural heritage, seasonality, economic leakages, or climate
change, to mention just a few. For each issue, indicators and measurement techniques are
suggested with practical information sources and examples. The publication also contains a
procedure to develop destination-specific indicators, their use in tourism policy and planning
processes, as well as applications in different destination types (e.g. coastal, urban, ecotourism,
small communities). Numerous examples and 25 comprehensive case studies provide a wide
range of experiences at the company, destination, national and regional levels from all
continents.
2.6 Critique of the existing literature relevant to the study
Studies on tourism in Rwanda have been minimal. Most scholars that have investigated the field
of tourism have not been form Rwanda and thus conduct their studies with a foreign perspective.
For instance, Anna Spenceley (2009) studies the Rwandan tourism within the perspective of
Gorillas but in this study vital aspect like the attribution of Rwanda tourism to branding was
lacking. The researchers focused more on Rwanda’s reliance on the gorilla those other drivers of
tourism in Rwanda. For example Anna Spenceley (2009) did not investigate other aspects like
branding, cultural influence, other wildlife species, birding among others.

39
Another study on tourism by Cai (2002) critically examined branding but the focus was on
destination branding, emphasizes that the image formation process is only a step in the
destination branding process; the link between these phases is the brand identity. On one hand,
brand identity is created by the destination marketer and supported by the touristic attraction,
history, and people. However, on the other hand, (Staniciou et.al. 2011) notes that brand image
is a perception of the receiver and depends on the previous experiences and on the marketer’s
communication skills .The brand image is a reflection of the brand identity and plays an essential
role in the construction of the identity. The consumers acquire an image based on the brand
identity projected by the sender (destination marketers); the marketers determine and enhance the
identity based on the research done around the consumers’ image about a destination.
Peter Nijkamp (1998) in his study on Tourism, Marketing and Telecommunication emphasised
and recommended infrastructure development and market plan development. This study did not
consider that the development of roads and marketing plan alone may not contribute much as
tourists’ may choose to go to a destination that is remote with very poor roads at the expense of
the good road. It is important to appreciate that other factors other than roads and market plan
have the capacity to affect tourism marketing.
2.7 Research gaps
From the literature analysis it is clear that previous studies on the tourism sector in Rwanda have
focused on different aspects of the sector. For example the first set of study Anna Spenceley
(2009) focused on the Gorillas and gorilla traction and the revenue the gorilla has generated for
Rwanda and how Rwanda relies so much on the gorilla. This study did not consider branding as
a key component in the performance of the tourism sector. This study is therefore relevant in
filling the gap on contribution of branding to the performance of the tourism sector.
We also examine that another study on tourism by Cai (2002) critically examined branding but
the focus was on destination branding, not all components of branding. Although the study by
Cai (2002) examined the image formation process as a step in the destination branding process;
the link between these phases is the brand identity. On one hand, brand identity is created by the
destination marketer and supported by the touristic attraction, history, and people. Moreover
40
brand identity is not only created by the destination marketer but also by other components of
branding like the brand promise, brand position, brand personality and brand association which
aspects were ignored by Cai (2002) study. This study attempts to fill this gap and went ahead to
examine how branding affects tourism performance.
Staniciou et.al (2011) in his study further notes that brand image is a perception of the receiver
and depends on the previous experiences and on the marketer’s communication skills but
ignored to investigate the relationship between brand image and performance of the tourism
industry. It is also true that the brand image is a reflection of the brand identity and plays an
essential role in the construction of the identity but so what? Does it have any effect on
performance of the sector? Such important questions had to be answered.
Furthermore, Peter Nijkamp (1998) in his study on Tourism, Marketing and Telecommunication
emphasised and recommended infrastructure development and market plan development. Peter
Nijkamp (1998) concluded that good roads and good marketing plans would contribute to the
development of the tourism industry. But despite this we needed to examine other factors other
than roads and market plan that can influence performance of the tourism industry.
2.8. Summary
This chapter presented previous works in the field of tourism. The chapter specifically looked at
literature on branding including; destination branding, destination image among others.
The concepts and models highlighted from the review of the literature on destination branding in
tourism and destination image formation will be used to analyze Rwanda’s image as a tourism
destination and explore the relationship between the promoted and the perceived image.
Finally the researcher indicates the gap analysis and the conceptual framework of the study. This
involved gathering information from journals published on the thematic issues and also visiting
different stake holders in the tourism industry in Rwanda like Tour operators, travel agents,
hoteliers as well as ORTPN, RTTA, select hotels, airlines and RDB for information that could
build up the case for this study.

41
CHAPTER 3: RESEARCH METHODOLOGY
3.1 Introduction
This chapter presents the methodology that will be used during the study. It involves the
Research design, study population, sample size and selection, sampling techniques, data
collection methods, Data collection instruments, procedure of data collection and data analysis
techniques.
3.2 Research design
According to Kombo (2006) research design is an outline or plan that is used to generate answers to
research problems/questions. A research design is an arrangement of conditions of data collection
and analysis.
The research design employed self-administration of questionnaires to a sample of individuals. The
questionnaires were aimed at finding peoples’ attitudes, and opinion about how branding contributes
to performance of tourism in Rwanda. The researcher used both primary and secondary data.
Primary data was obtained using questionnaires while secondary data was gathered from the
documents available from text books, academic reports and journals.
3.3 Target population
Mugenda (2003) defines the population as a complete set of individuals, cases or objects with some
common observable characteristics. The target population was Tour operators who are members of
the umbrella body RTTA (37), Hoteliers (10), Airline staff (5), and RDB officials (5).
The Research was concentrated in Kigali since it has the largest number of tour operators and other
stakeholders in the tourism sector. The researcher carried out a census to reach the individuals
targeted the target population was not large.
The researcher also believes this target population provided diversity, representation; was really
accessible and very knowledgeable.

42
3.4. Procedures for data collection
An introductory letter was collected from the JKUAT offices authorising the researcher to go for
data collection. Self-administered questionnaires were delivered to the selected respondents for
completion. Available documents and journals were also reviewed.
3.5. Source of data
Data was collected from primary and secondary sources. Primary data was derived from the
questionnaires while secondary data was derived from available literature
3.6. Data Collection Methods
Data for the research was collected using two methods. These include self-administered
questionnaires and document review. Self-administered questionnaires were used since they
would enable the researcher obtain first-hand information from the field. Data was obtained
from respondent categories indicated. The type of data included social demographic
characteristics of the respondents (age, gender, level of education etc), perceptions about the
study variable etc. Document reviewing enabled the researcher obtain information on already
existing literature. This information was collected from reports, circulars, journals and internet.
3.7.1 Questionnaire survey
Self-administered questionnaires were used in the study targeting all respondents. Mugenda and
Mugenda (2005) states that questionnaires are used to obtain vital information about the
population and ensure a wide coverage of the population in a short time. In addition Sekaran
(2003) states that questionnaires are an efficient data collection mechanisms where the researcher
knows exactly what is required and how to measure the variables of interest. He further asserts
that administering questionnaires to number of interest simultaneously is less expensive and time
consuming and does not require much skill to administer as compared to conducting interviews.
Closed ended question were also used with detailed guiding instructions as regards the manner in
which respondents were required to fill them independently with minimal supervision. This was

43
made possible due to the fact that majority of the respondents were able to read and write and in
instances where the respondents were illiterate, a research assistant trained by the researcher was
used to translate questionnaire into the local language and fill them according to the responses
provided by the respondents. Closed ended questionnaire had pre-coded answers according to
themes from which respondents were asked to choose the appropriate responses. Respondents
were given ample time to fill and return questionnaires later when they were through.
3.7.2 Document reviews
The study involved carrying out library and office research where secondary sources about the
research questions were considered.
Documentary review checklist containing a list of documents to be reviewed was used to provide
necessary data for the study. The documents for review were obtained from offices, libraries,
organisations involved in the tourism industry, reports, newspapers, policies and regulations
guidelines, annual reports and online journals.
This information was useful for cross validating primary data and provide basis for explaining
certain concepts.
3.8 Data Collection Instruments
The data collection instruments included structured questionnaires and document review check
list.
3.8.1 Structured questionnaire
The researcher used close ended questionnaire for all respondents. The use of questionnaire
enabled the collection of data from a large number of respondents and also enabled respondents
give sensitive information without fear as their personal identity would not be needed on the
questionnaire. This supports Amin, 2005 (P.270)’s contention that questionnaires offer greater
assurance of anonymity thus enabling the respondents to give sensitive information without fear.
Rensis’ Likert scale statement having five category response continuum of 5 – 1 was used where
I meant “strongly disagree”, 2 meant “Disagree; 3 meant “No comment” 4 meant “Agree” and 5
meant “strongly agree” with assertion. This was designed to establish the extent to which
respondents are in agreement with statements and it was used to measure the variables under

44
study. In using this, each respondent would select a response most suitable to him / her in
describing each statement and the response categories which were weighed from 5 – 1 and
average for all items was computed accordingly.
3.8.2 Validity of the instruments
Mugenda and Mugenda (2003) defined validity as the degree to which the sample of test item
represent the content that it is designed to measure, that is, the instrument measures the
characteristic or trait it is intended to measure. This research adopted content validity which
refers to the extent to which a measuring instrument provides adequate coverage of the topic
under study. Burns (2000) proposes that several data collection methods enable the researcher to
avoid the deficiency that arises from using only one instrument for data collection. In connection
with these the researcher used questionnaires and document analysis. In addition the research
supervisor assessed the relevance of the content in the questionnaires and gave feedback to the
researcher. The questionnaires were also pre-tested to check for validity.
3.8.3 Reliability of instruments
Mugenda and Mugenda (2003) defined reliability as the extent to which a research instrument
yields findings that are consistent each time it is administered to the same subjects. To achieve
high level of reliability the research used a self-administration approach of data collection. Most
questionnaires were filled in the presence of the researcher to ensure that the right people filled
the questionnaires. This made the research findings more objective and dependable.
3.9 Data analysis and presentation
3.9.1 Quantitative data analysis
The quantitative data involved information from the questionnaires only. Data from the field
was too raw for proper interpretation. It was therefore vital to put it into order and structure it, so
as to derive meaning and information from it. The raw data obtained from questionnaires was
cleaned, sorted and coded. The coded data was entered into the Computer, checked and
statistically analysed using the statistical package for social scientists (SPSS) software package
to generate descriptive and inferential statistics. Karl Pearson’s Coefficient of Correlation was

45
then used to establish the relationship between variables. Descriptive analysis was applied to
describe the primary variable and associated indicator items related to the study objectives.
The results were presented inform of tables and charts then discussed in relation to objectives of
the study. Conclusion and recommendations were also drawn in relation to the set objectives of
the study.
3.9.2 Qualitative data analysis
Qualitative data was collected using document reviews with the help of documentary checklist.
Content analysis was used to edit the data and re-organize it into meaningful shorter sentences.
The data was analysed and organized based on patterns, repetitions and commonalities into
themes based on the study variables. The data then was used to reinforce information got from
questionnaires to draw conclusion and recommendations
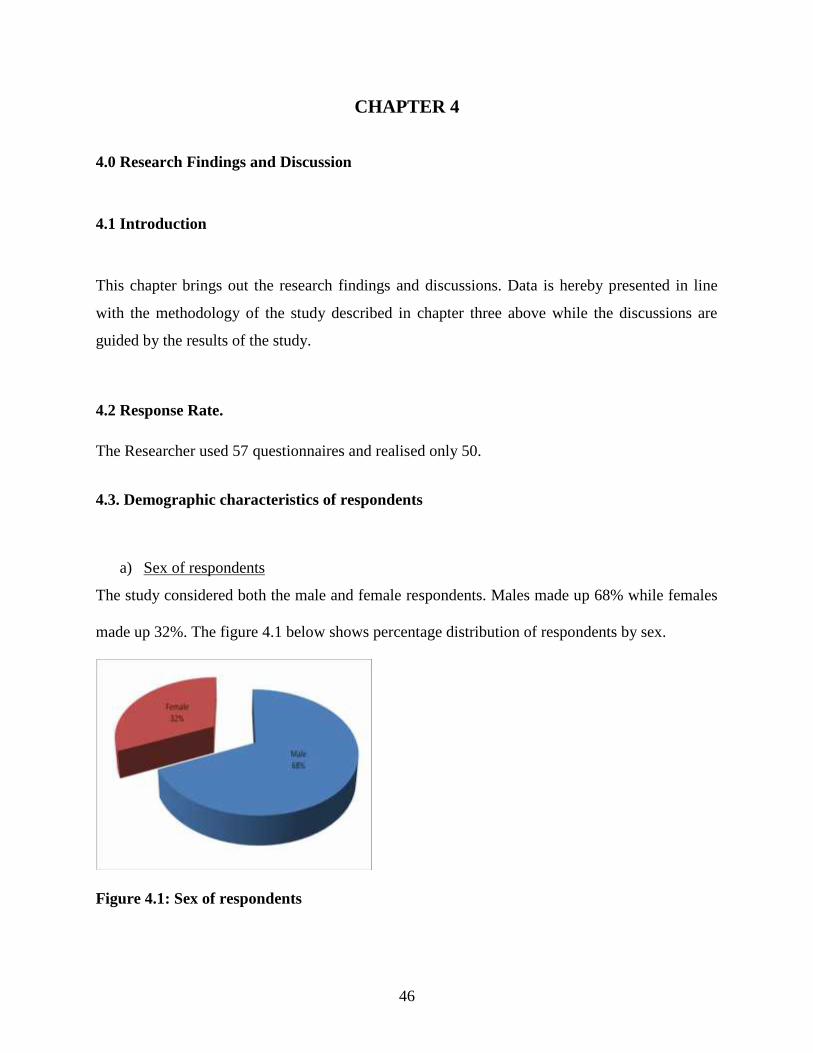
46
CHAPTER 4
4.0 Research Findings and Discussion
4.1 Introduction
This chapter brings out the research findings and discussions. Data is hereby presented in line
with the methodology of the study described in chapter three above while the discussions are
guided by the results of the study.
4.2 Response Rate.
The Researcher used 57 questionnaires and realised only 50.
4.3. Demographic characteristics of respondents
a) Sex of respondents
The study considered both the male and female respondents. Males made up 68% while females
made up 32%. The figure 4.1 below shows percentage distribution of respondents by sex.
Figure 4.1: Sex of respondents
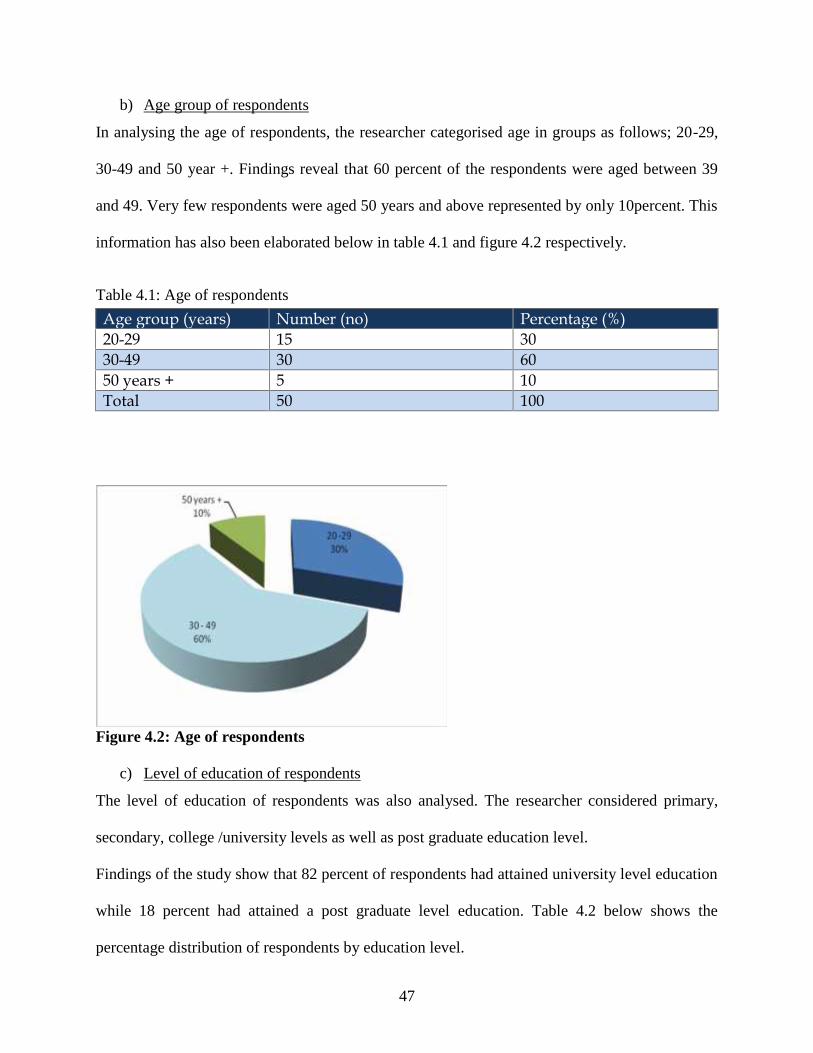
47
b) Age group of respondents
In analysing the age of respondents, the researcher categorised age in groups as follows; 20-29,
30-49 and 50 year +. Findings reveal that 60 percent of the respondents were aged between 39
and 49. Very few respondents were aged 50 years and above represented by only 10percent. This
information has also been elaborated below in table 4.1 and figure 4.2 respectively.
Table 4.1: Age of respondents
Age group (years) Number (no) Percentage (%)20-29 15 3030-49 30 6050 years + 5 10Total 50 100
Figure 4.2: Age of respondents
c) Level of education of respondents
The level of education of respondents was also analysed. The researcher considered primary,
secondary, college /university levels as well as post graduate education level.
Findings of the study show that 82 percent of respondents had attained university level education
while 18 percent had attained a post graduate level education. Table 4.2 below shows the
percentage distribution of respondents by education level.

48
Table 4.2: Level of education
Level of Education Number (no) Percentage (%)Primary 00 00Secondary 00 00University/Collage 41 82Post graduate 9 18Total 50 100
d) Length of service
The researcher further analysed the length of period respondents had served. The researcher
categorised the period in terms of years as follows: 1 – 5 years, 5 – 10 years, and 10 years +.
Findings show that a larger proportion of the respondents had worked between 5 – 10 years. This
proportion was represented by 75 percent while a little proportion had worked more than 10
years represented by 4 percent.
Table 4.3 and chart 4.3 below illustrated the percentage distribution of respondents by the period
of service in the respective work places.
Table 4.3: Length of service
Length of service(years)
Number (no) Percentage (%)
1 – 5 11 225 – 10 37 7410 years + 2 4Total 50 100
Figure 4.3: Length of service
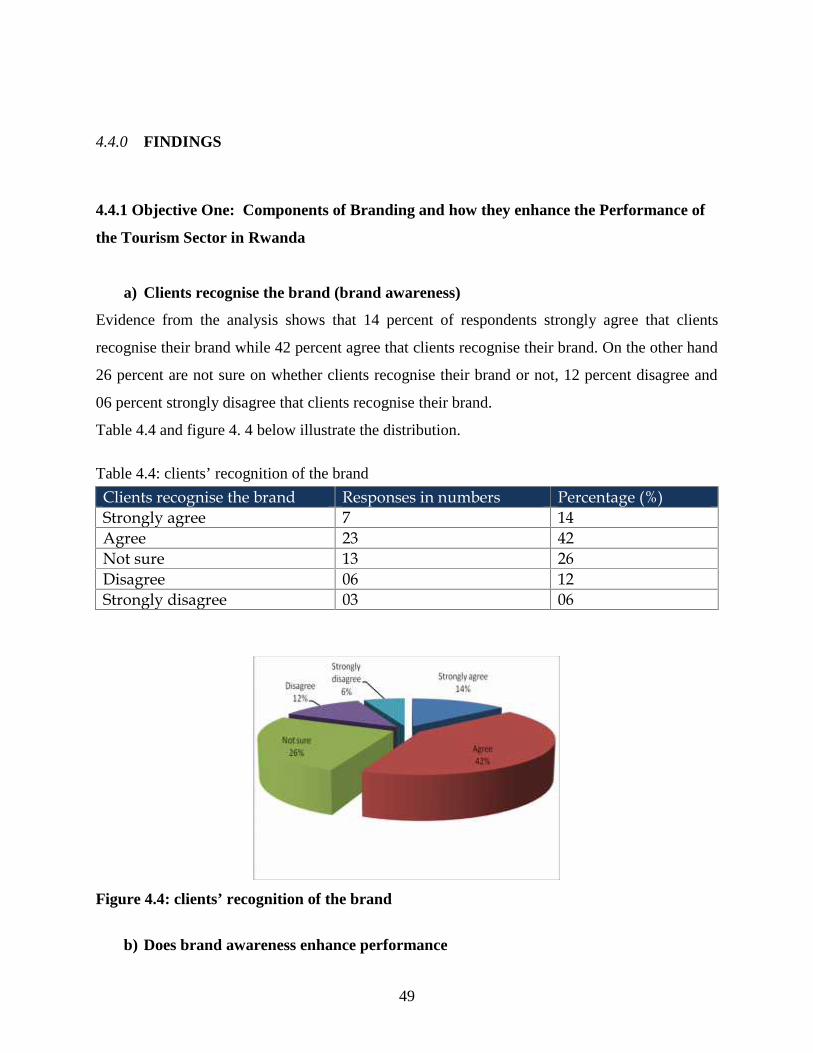
49
4.4.0 FINDINGS
4.4.1 Objective One: Components of Branding and how they enhance the Performance of
the Tourism Sector in Rwanda
a) Clients recognise the brand (brand awareness)
Evidence from the analysis shows that 14 percent of respondents strongly agree that clients
recognise their brand while 42 percent agree that clients recognise their brand. On the other hand
26 percent are not sure on whether clients recognise their brand or not, 12 percent disagree and
06 percent strongly disagree that clients recognise their brand.
Table 4.4 and figure 4. 4 below illustrate the distribution.
Table 4.4: clients’ recognition of the brandClients recognise the brand Responses in numbers Percentage (%)Strongly agree 7 14Agree 23 42Not sure 13 26Disagree 06 12Strongly disagree 03 06
Figure 4.4: clients’ recognition of the brand
b) Does brand awareness enhance performance

50
As seen in figure 4.5 and table 4.6 below, brand awareness enhances performance of the tourism
sector. 32 percent strongly agree as 48 percent agree to the fact that brand awareness enhances
performance. Only 10 percent are not sure as 2 percent disagree.
Table 4.5: Brand awareness enhances performance
Clients recognise the brand Responses in numbers Percentage (%)Strongly agree 16 32Agree 24 48Not sure 5 10Disagree 4 8Strongly disagree 1 2
Figure 4.6: Brand awareness enhances performance
c) There are clear Commitment the Company makes to the clients (Brand promise)
Findings on brand promise reveal that there are clear promises the companies make to the clients
and these promises are here called brand promise. 54 percent of the respondents agree that there
are clear promises made to the clients against only 8 percent that disagree.
Table 4.6 and figure 4.7 below elaborate the percentage distribution of brand promise.
Table 4.6: clear commitments company makes to clients
Clients recognise the brand Responses in numbers Percentage (%)Strongly agree 16 12Agree 24 54

51
Not sure 5 24Disagree 4 8Strongly disagree 1 2
Figure 4.7: clear commitments company makes to clients
d) Brand promise enhances performance
It is right to say that brand promise enhances performance. Findings from the study reveal that52 percent of respondents strongly agree that a clear brand promise will enhance performance.This is against only 2 percent that strongly disagree.
The detailed percentage distribution is illustrated in table 4.7 and figure 4.8 below.
Table 4.7: Brand promise enhances performance
Clients recognise the brand Responses in numbers Percentage (%)Strongly agree 26 52Agree 20 40Not sure 2 4Disagree 1 2Strongly disagree 1 2
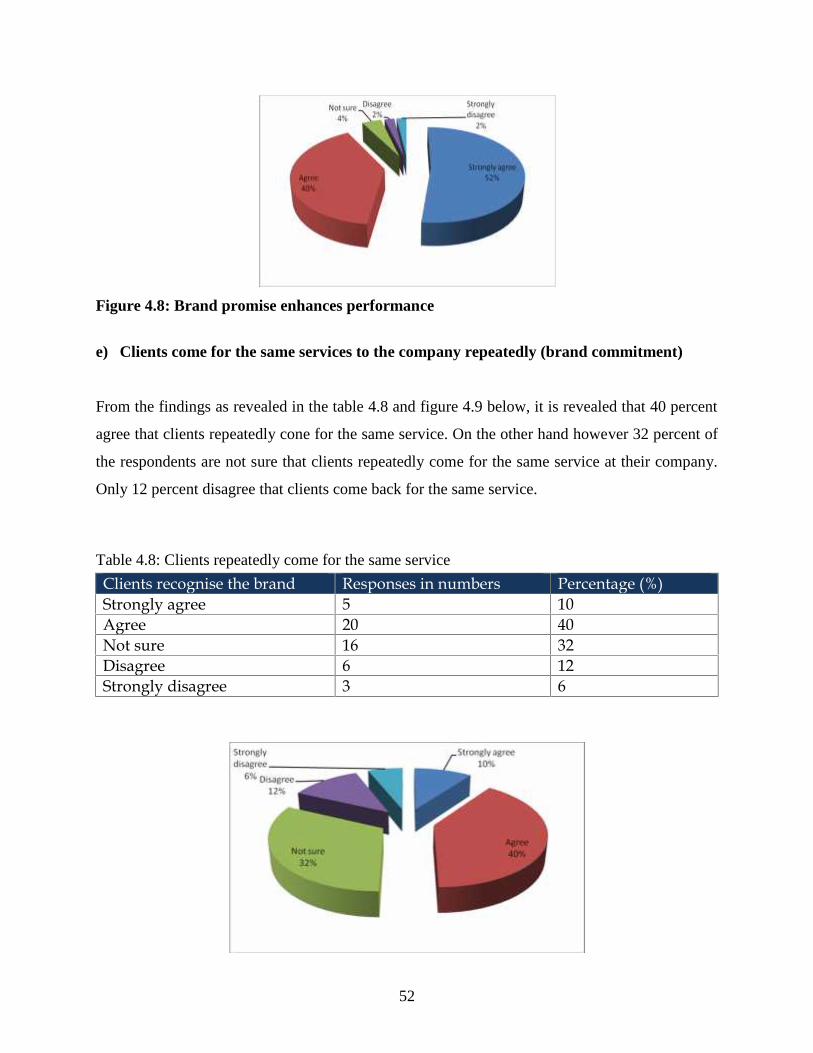
52
Figure 4.8: Brand promise enhances performance
e) Clients come for the same services to the company repeatedly (brand commitment)
From the findings as revealed in the table 4.8 and figure 4.9 below, it is revealed that 40 percent
agree that clients repeatedly cone for the same service. On the other hand however 32 percent of
the respondents are not sure that clients repeatedly come for the same service at their company.
Only 12 percent disagree that clients come back for the same service.
Table 4.8: Clients repeatedly come for the same service
Clients recognise the brand Responses in numbers Percentage (%)Strongly agree 5 10Agree 20 40Not sure 16 32Disagree 6 12Strongly disagree 3 6
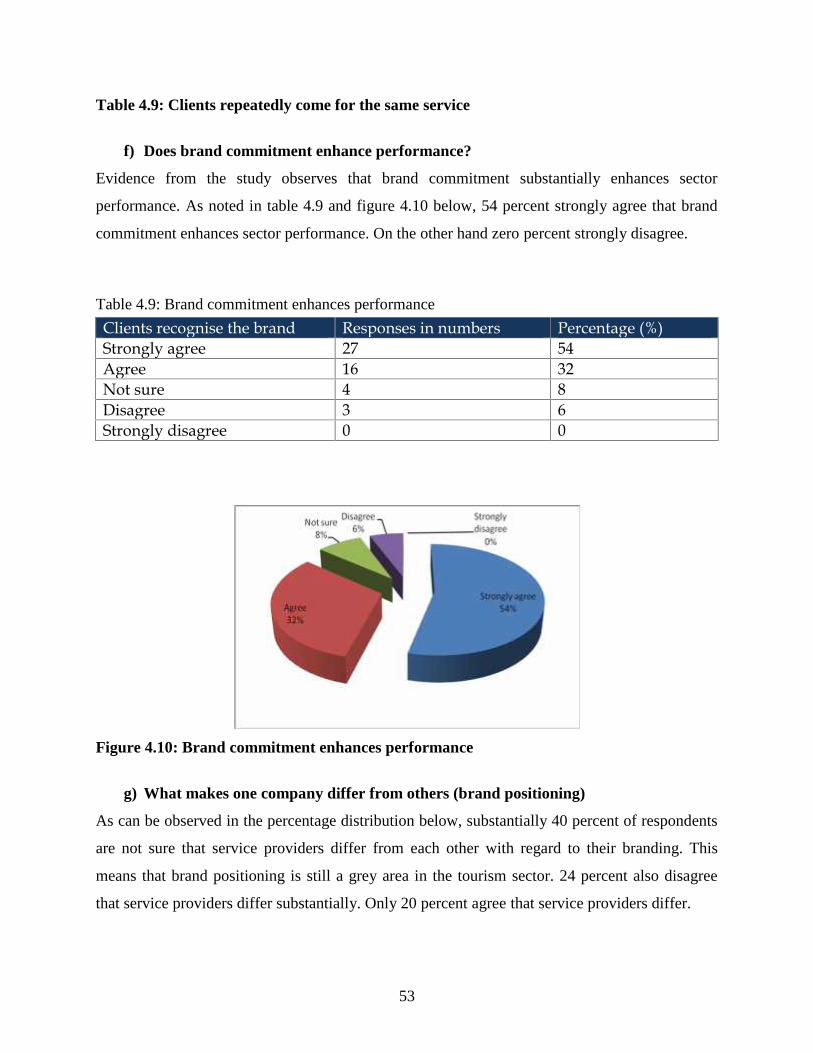
53
Table 4.9: Clients repeatedly come for the same service
f) Does brand commitment enhance performance?
Evidence from the study observes that brand commitment substantially enhances sector
performance. As noted in table 4.9 and figure 4.10 below, 54 percent strongly agree that brand
commitment enhances sector performance. On the other hand zero percent strongly disagree.
Table 4.9: Brand commitment enhances performance
Clients recognise the brand Responses in numbers Percentage (%)Strongly agree 27 54Agree 16 32Not sure 4 8Disagree 3 6Strongly disagree 0 0
Figure 4.10: Brand commitment enhances performance
g) What makes one company differ from others (brand positioning)
As can be observed in the percentage distribution below, substantially 40 percent of respondents
are not sure that service providers differ from each other with regard to their branding. This
means that brand positioning is still a grey area in the tourism sector. 24 percent also disagree
that service providers differ substantially. Only 20 percent agree that service providers differ.

54
Table 4.10: Service providers differ from each other substantially
Clients recognise the brand Responses in numbers Percentage (%)Strongly agree 4 8Agree 10 20Not sure 20 40Disagree 12 24Strongly disagree 4 8
Figure 4.11: Service providers differ from each other substantially
h) Does brand positioning enhances performance
Generally respondents do not think that brand positioning enhances performance of the tourism
sector so much. Only 16 percent agree and 4 percent strongly agree that brand positioning
enhances performance. This is against the 48 percent who are not sure that brand positioning
enhances performance as another 24 percent disagree to brand positioning enhancing
performance.
Table 4.10 and figure 4.12 below show the percentage distribution related to this aspect.
Table 4.10: Brand positioning enhances performance
Clients recognise the brand Responses in numbers Percentage (%)Strongly agree 2 4Agree 8 16Not sure 24 48Disagree 12 24
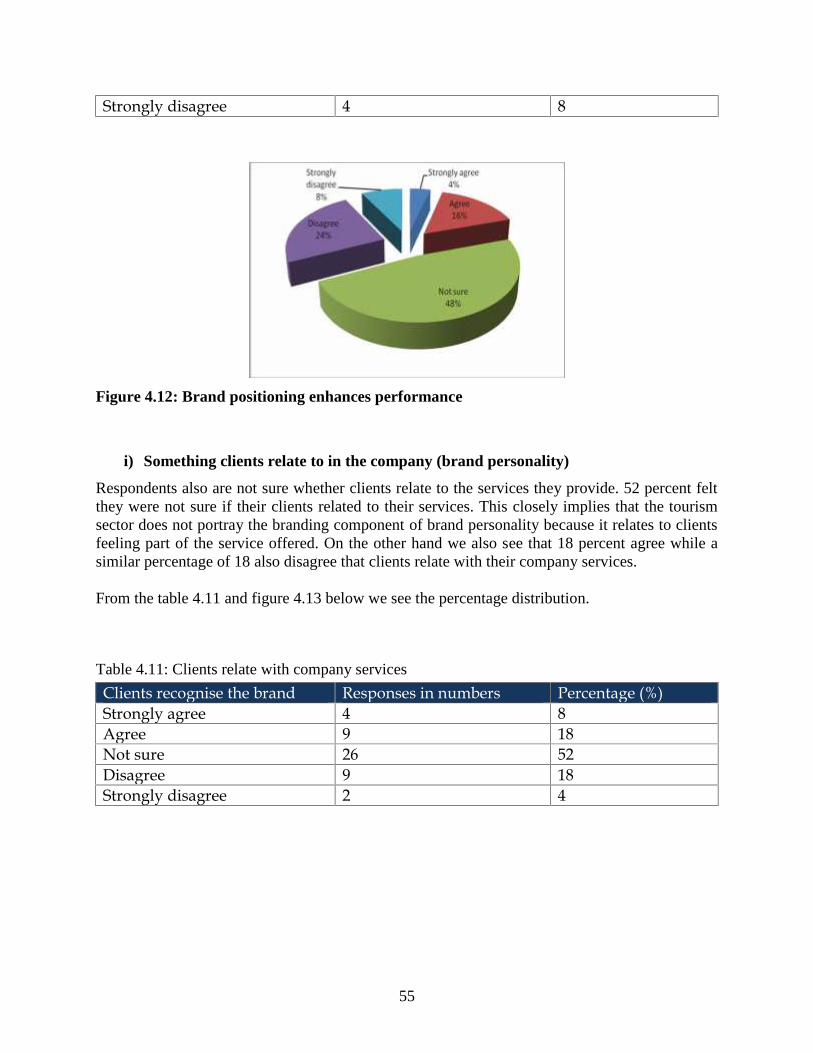
55
Strongly disagree 4 8
Figure 4.12: Brand positioning enhances performance
i) Something clients relate to in the company (brand personality)
Respondents also are not sure whether clients relate to the services they provide. 52 percent feltthey were not sure if their clients related to their services. This closely implies that the tourismsector does not portray the branding component of brand personality because it relates to clientsfeeling part of the service offered. On the other hand we also see that 18 percent agree while asimilar percentage of 18 also disagree that clients relate with their company services.
From the table 4.11 and figure 4.13 below we see the percentage distribution.
Table 4.11: Clients relate with company services
Clients recognise the brand Responses in numbers Percentage (%)Strongly agree 4 8Agree 9 18Not sure 26 52Disagree 9 18Strongly disagree 2 4

56
Figure 4.13: Clients relate with company servicej) Does brand personality enhance performance
Evidence as documented in table 4.12 and figure 4.14 below demonstrate that brand personalityenhances productivity. Statistics reveal that 46 percent agree to brand personality enhancingperformance as another 42 percent strongly agree. Only 4 percent disagree.
It is also clear that although respondents felt there was minimal brand personality in theircompanies, they suggested that it can enhance performance.
Table 4.12: Brand personality enhances performance
Clients recognise the brand Responses in numbers Percentage (%)Strongly agree 21 42Agree 23 46Not sure 3 6Disagree 2 4Strongly disagree 1 2
Figure 4.14: Brand personality enhances performance

57
k) Aspect of performance that brand components enhance
Respondents believe that the major aspect of performance that is influenced by branding is
profitability of the sector. With proper branding strategies, companies can enhance their
performance with regards to mainly profitability. This view is supported by the 64 percent of the
respondents while another 24 percent felt productivity is also enhanced.
Table 4.13 and figure 4.15 below shoe percentage distribution of aspects of performance that
branding enhances.
Table 4.13: Aspects of performance that brand components enhance
Aspects Responses in numbers Percentage (%)Productivity 12 24Profitability 32 64Quality 6 12
Figure 4.15: Aspects of performance that brand components enhance
4.2.2. OBJECTIVE TWO: BRANDING STRATEGIES USED IN RWANDAN
TOURISM SECTOR
a) Responsibility for marketing
Responsibilities of marketing in the tourism sector were also investigated. The researcher asked
who takes leadership in marketing at the work places of the respondents. Findings show that
marketing managers took lead 48 percent and executive directors also took lead in other
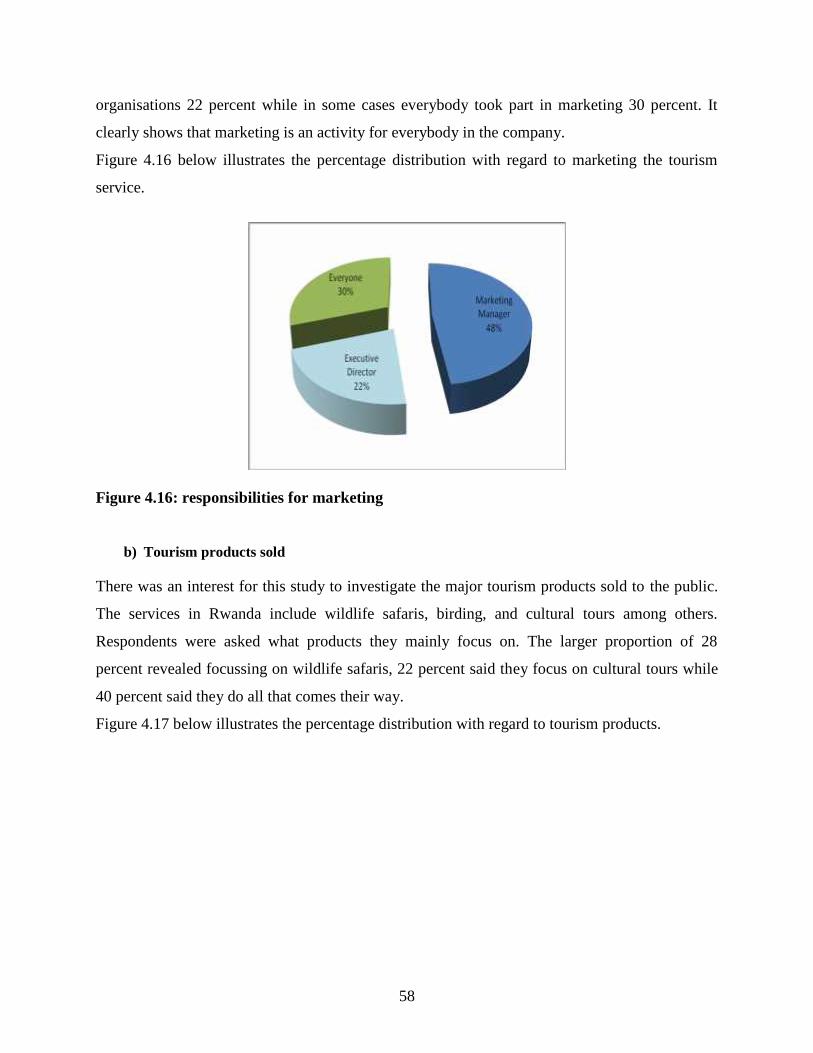
58
organisations 22 percent while in some cases everybody took part in marketing 30 percent. It
clearly shows that marketing is an activity for everybody in the company.
Figure 4.16 below illustrates the percentage distribution with regard to marketing the tourism
service.
Figure 4.16: responsibilities for marketing
b) Tourism products sold
There was an interest for this study to investigate the major tourism products sold to the public.
The services in Rwanda include wildlife safaris, birding, and cultural tours among others.
Respondents were asked what products they mainly focus on. The larger proportion of 28
percent revealed focussing on wildlife safaris, 22 percent said they focus on cultural tours while
40 percent said they do all that comes their way.
Figure 4.17 below illustrates the percentage distribution with regard to tourism products.
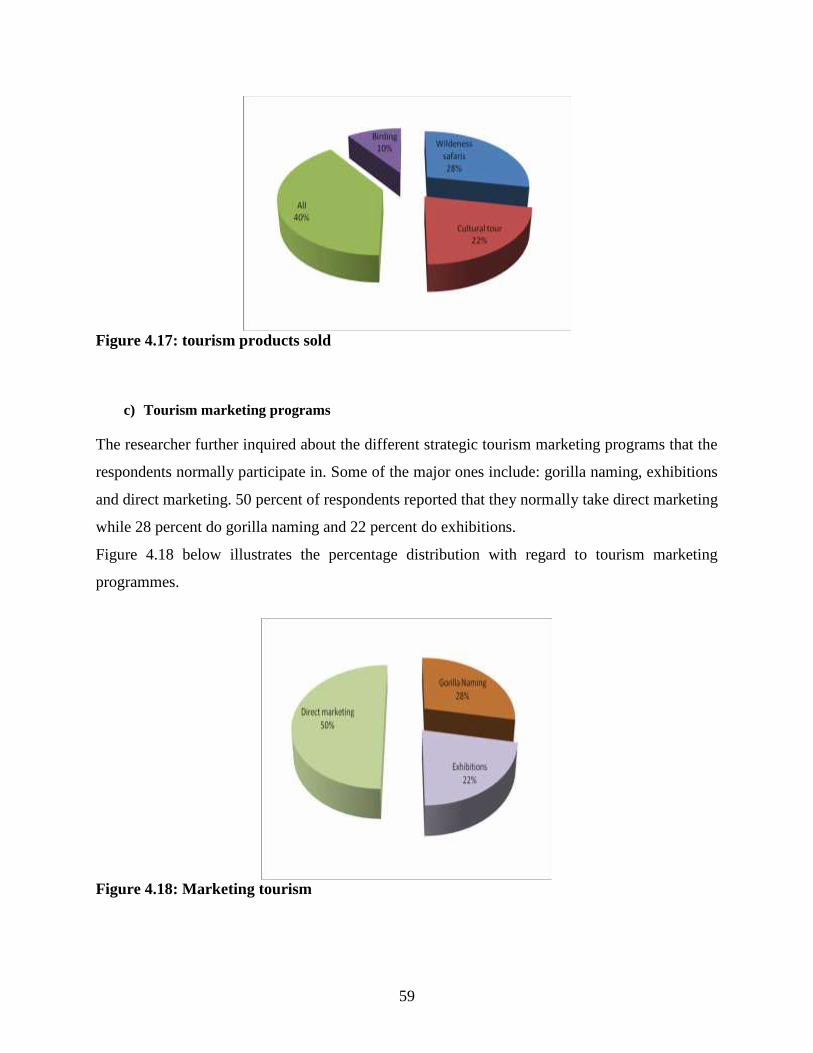
59
Figure 4.17: tourism products sold
c) Tourism marketing programs
The researcher further inquired about the different strategic tourism marketing programs that the
respondents normally participate in. Some of the major ones include: gorilla naming, exhibitions
and direct marketing. 50 percent of respondents reported that they normally take direct marketing
while 28 percent do gorilla naming and 22 percent do exhibitions.
Figure 4.18 below illustrates the percentage distribution with regard to tourism marketing
programmes.
Figure 4.18: Marketing tourism
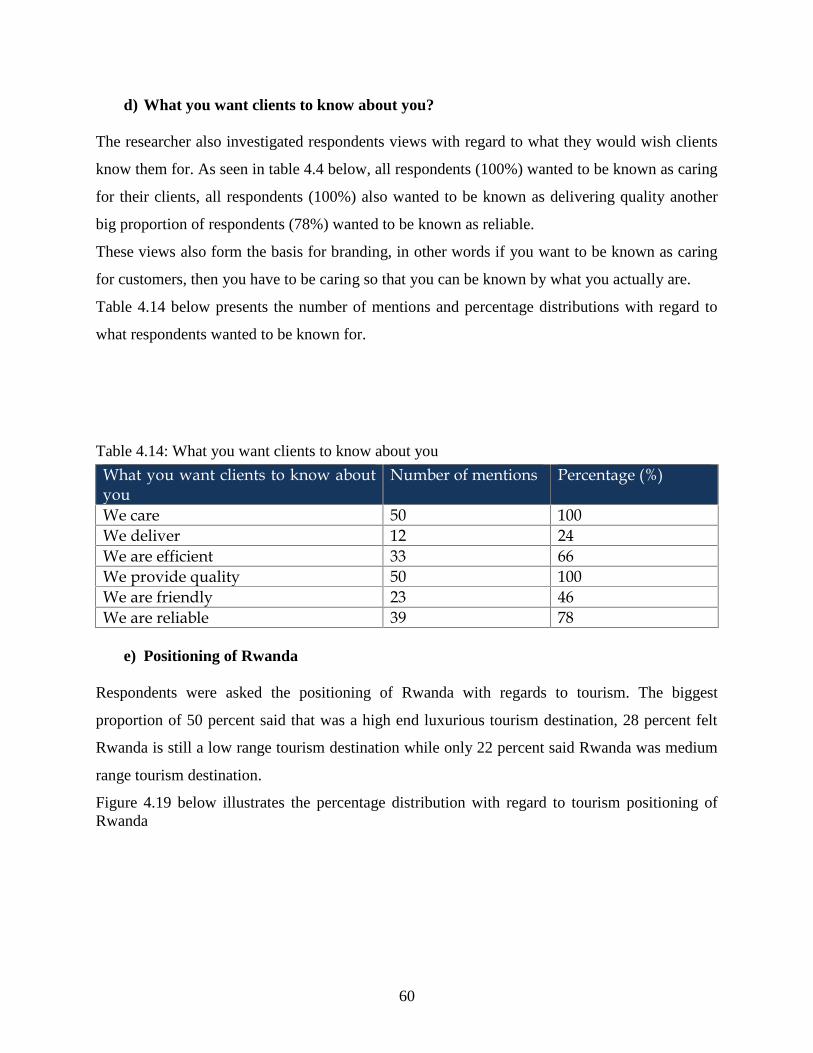
60
d) What you want clients to know about you?
The researcher also investigated respondents views with regard to what they would wish clients
know them for. As seen in table 4.4 below, all respondents (100%) wanted to be known as caring
for their clients, all respondents (100%) also wanted to be known as delivering quality another
big proportion of respondents (78%) wanted to be known as reliable.
These views also form the basis for branding, in other words if you want to be known as caring
for customers, then you have to be caring so that you can be known by what you actually are.
Table 4.14 below presents the number of mentions and percentage distributions with regard to
what respondents wanted to be known for.
Table 4.14: What you want clients to know about you
What you want clients to know aboutyou
Number of mentions Percentage (%)
We care 50 100We deliver 12 24We are efficient 33 66We provide quality 50 100We are friendly 23 46We are reliable 39 78
e) Positioning of Rwanda
Respondents were asked the positioning of Rwanda with regards to tourism. The biggest
proportion of 50 percent said that was a high end luxurious tourism destination, 28 percent felt
Rwanda is still a low range tourism destination while only 22 percent said Rwanda was medium
range tourism destination.
Figure 4.19 below illustrates the percentage distribution with regard to tourism positioning ofRwanda

61
Figure 4.19: Positioning Rwanda
f) Attitudes of the locals towards tourism
The views of the local people on tourism were also investigated. The researchers asked what
respondents thought were the views of the local Rwandans on tourism. Findings show that 72
percent of the locals actually think tourism is for the foreigners and they therefore do not need to
get involved.
Figure 4.20 below illustrates the percentage distribution with regard to local people’s views orperceptions on tourism.
Figure 4.20: Attitudes of the local people towards tourism

62
g) Image of Rwanda on the international scene
The image of a country normally has a big impact on its tourism potential. The image of a
country as looked at in the literature review is also a result of perceptions developed by branding.
The researcher also sought to find out what the perceptions on Rwanda in the international scene
would be. Findings show that Rwanda is known for the 1994 genocide 48% while another 40%
said that Rwanda is known as a progressive country.
Figure 4.21 below illustrates the percentage distribution with regard to image of Rwanda on theinternational scene.
Figure 4.21: Image of Rwanda
4.4.3. OBJECTIVE THREE: HOW BRAND AWARENESS AND ASSOCIATION IN THE
TOURISM SECTOR ENHANCE PERFORMANCE OF THE SECTOR.
a) Branding strategies used – what is at the fore front?
Respondents’ branding strategies were also analysed. Key strategies looked at included: name of
company as a brand, the product as a brand, emotional connection between the people and the
product the companies sell, no brand strategy, provision of many services, and then labels.
Findings reveal that companies mainly used their name and products as their brands. Clients
knew them by their names and products. Both these aspects were supported by 100% as can be
seen in table 4.15 below.

63
Table 4.15: Branding strategies
Strategy Number of mentions Percentage (%)Name of company 50 100The product we sell 50 100We try to make people identify withus
06 12
No brand 00 00We promote many products 9 18We put labels and stickers 3 6
b) Period taken using this branding strategy
To effectively determine the effect of branding on the performance of the tourism sector, it was
proper to understand how long the respondents have used the current brands. The researcher
asked how long the respondents had used the particular brands.64% had been using their current
brands for over five years, while 30% for more than 5 years.
Figure 4.22 below clearly shows the period the respondents have used the brands they currently
use.
Figure 4.22: Period taken using the branding
c) Awareness about the brand in use
The level of awareness about the brands in use was also investigated. The researcher asked therespondents to use a scale of one to ten in this investigation. From the findings 44 percent ofrespondents rated their brand awareness level between four and six out of ten, while 32 percent

64
scored a scale between one and three of ten. 22 percent rated their brand awareness betweenseven and nine out of ten as only 2 percent felt they are at ten out of ten with their brandawareness.
Table 4.16 below and figure 4.23 below illustrate the numbers and percentage distribution of thefindings.
Table 4.16: Awareness about brand in use using scale of one to ten
Scale out of ten Numbers Percentage (%)Scale between (one and three of ten) 16 32Scale between (four and six of ten) 22 44Scale between (seven and nine of ten) 11 22Scale between (ten of ten) 1 2
Figure 4.23: Awareness about the brand in use
d) Comparison of business before and after using the brand
An analysis of the business performance before the current branding strategy and after also was
done. Looking at table 4.17 below we see that before current branding most incomes were
medium at 44% but after branding incomes went high as reported by 42%, before current
branding customer satisfaction was low as shown by the highest percentage of 24% but after the
branding went high as recorded by the 94%, the same applies to business growth, business
expansion, the arrival of new clients and the return of old clients. This justifies the effect of
branding on business performance in the tourism sector.

65
Table 4.17: comparison of business before and after branding initiatives
Aspects tocompare
Before branding After brandingHigh Medium Low Normal High Medium Low Normal
Income 16% 44% 24% 00 42% 8% 00 00Customersatisfaction
13% 22% 24% 7% 94% 36% 00 48%
Business growth 22% 24% 48% 00 72% 42% 00 00Businessexpansion
4% 10% 72% 00 68% 22% 36% 26%
New customers 14% 24% 46% 00 32% 36% 4% 00Old customers 29% 12% 40% 00 60% 26% 2% 00
e) Effect of branding to tourism industry
Respondents also thought that branding makes a positive impact on their business. Tourism does
better with branding than without branding. Respondents reported positive effects of branding on
their tourism sector.
Figure 4.24: Effects of branding on the tourism industry
f) Why clients come to us
Respondents were asked why they thing clients come to them and the highest number of 27
which is (54%) said it was because of their name. Other 9, (18%) said that their reliability was
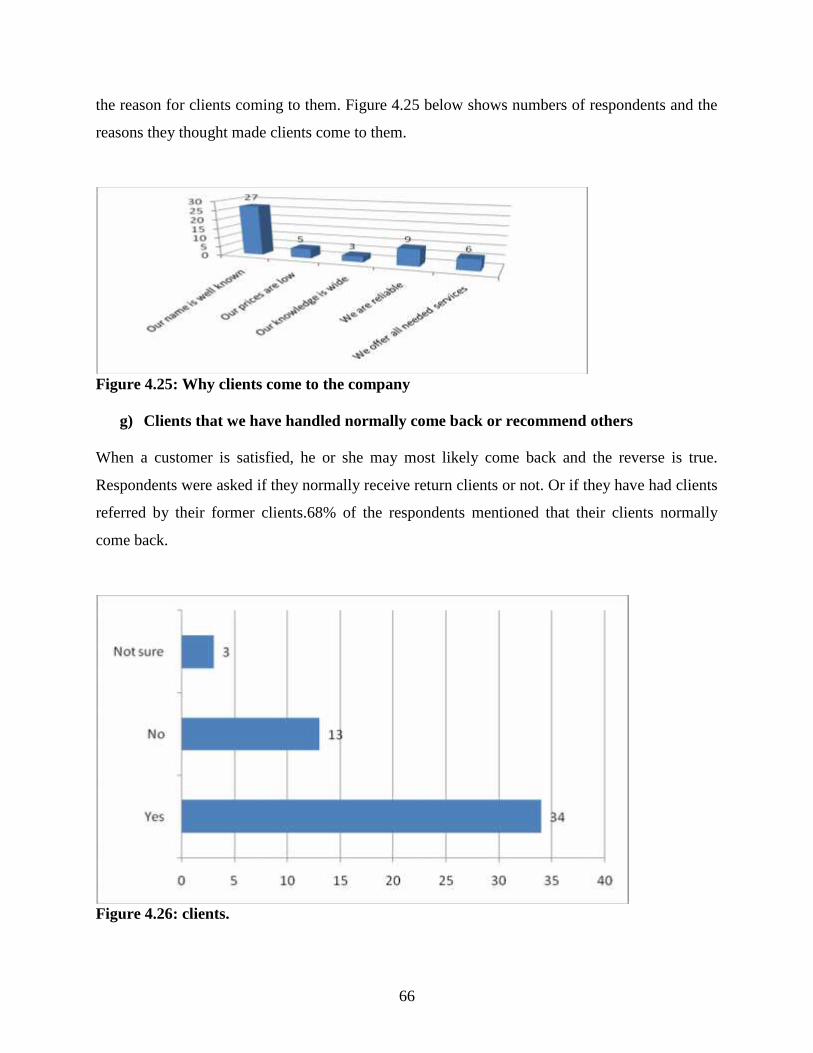
66
the reason for clients coming to them. Figure 4.25 below shows numbers of respondents and the
reasons they thought made clients come to them.
Figure 4.25: Why clients come to the company
g) Clients that we have handled normally come back or recommend others
When a customer is satisfied, he or she may most likely come back and the reverse is true.
Respondents were asked if they normally receive return clients or not. Or if they have had clients
referred by their former clients.68% of the respondents mentioned that their clients normally
come back.
Figure 4.26: clients.
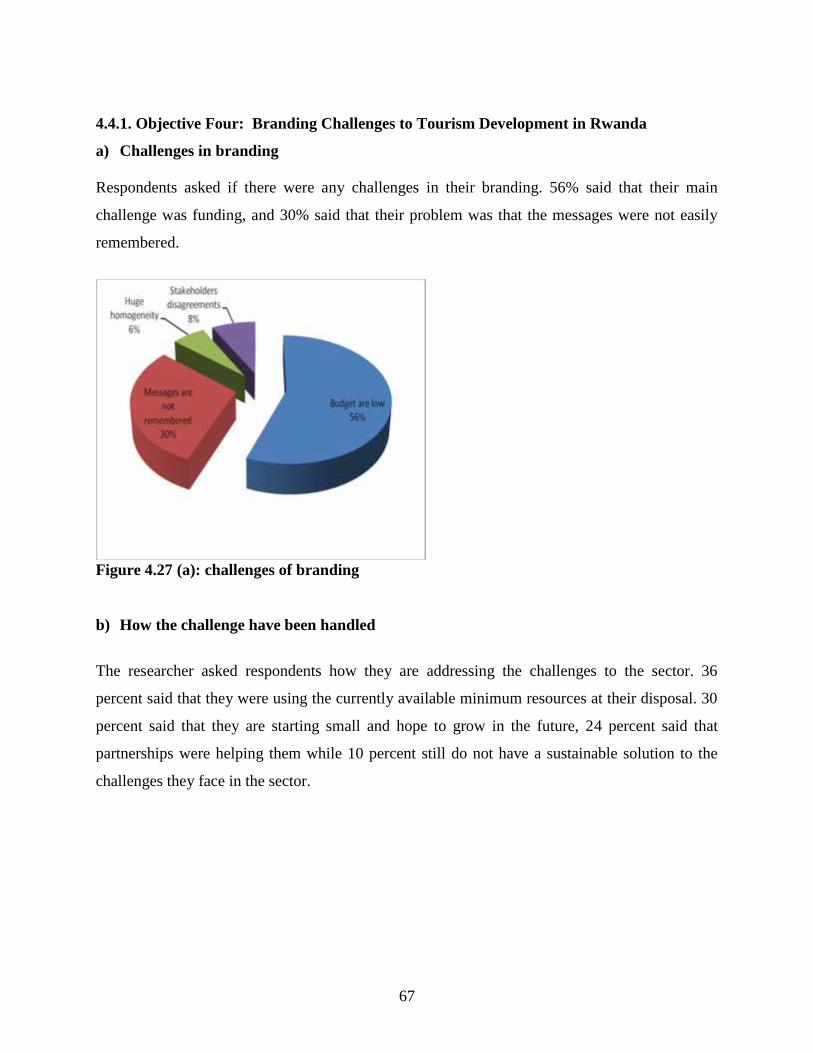
67
4.4.1. Objective Four: Branding Challenges to Tourism Development in Rwanda
a) Challenges in branding
Respondents asked if there were any challenges in their branding. 56% said that their main
challenge was funding, and 30% said that their problem was that the messages were not easily
remembered.
Figure 4.27 (a): challenges of branding
b) How the challenge have been handled
The researcher asked respondents how they are addressing the challenges to the sector. 36
percent said that they were using the currently available minimum resources at their disposal. 30
percent said that they are starting small and hope to grow in the future, 24 percent said that
partnerships were helping them while 10 percent still do not have a sustainable solution to the
challenges they face in the sector.
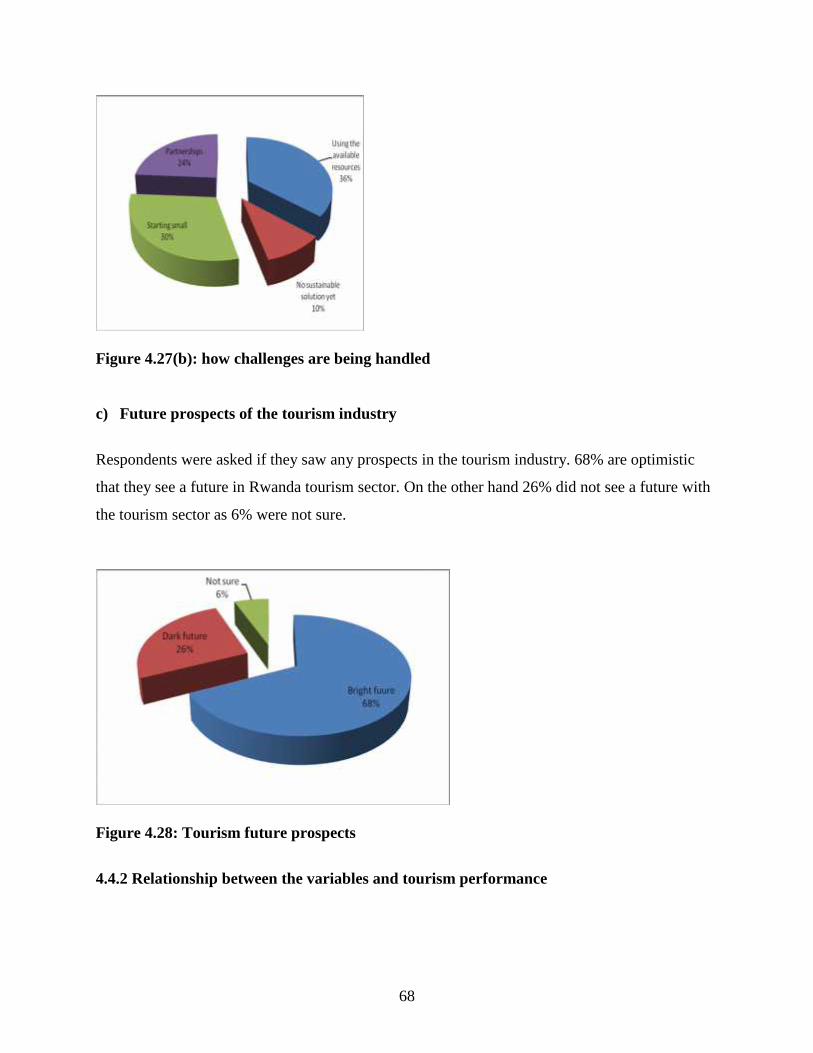
68
Figure 4.27(b): how challenges are being handled
c) Future prospects of the tourism industry
Respondents were asked if they saw any prospects in the tourism industry. 68% are optimistic
that they see a future in Rwanda tourism sector. On the other hand 26% did not see a future with
the tourism sector as 6% were not sure.
Figure 4.28: Tourism future prospects
4.4.2 Relationship between the variables and tourism performance

69
4.4.2.1 The correlation test for relationship between independent variables and dependent
variable
An analysis of relationship between the variables was analysed using the statistical package
SPSS based on Pearson’s correlation.
A test for the relationship between brand promise, brand commitment, brand positioning, brand
personality, and brand awareness with performance of the tourism sector was done using Pearson
correlation test statistics.
The findings revealed statistical significant relationships between brand promise of 0.309 and p-
value = 0.003; brand commitment with correlation coefficient = 0.245and p- value = 0.021;
brand positioning = 0.325 and p-value = 0.002; brand personality =0.015 and p-value=0.889 and
brand association of 0.375 with strong significance p-value of 0.000.
Correlations
Brand
promise
Brand
commitment
Brand
positioning
Brand
personality
Brand
association
Relationship
between
branding and
performance
of tourism
sector
Pearson
Correlation
.309** .245* .325** .015 .375**
Sig. (2-tailed) .003 .021 .002 .889 .000
N 89 89 90 88 90
**. Correlation is significant at the 0.01 level (2-tailed).
This means that there is a significant relationship between elements of branding like brand
Promise, brand commitment, brand positioning, brand personality, brand association and tourism
performance in Rwanda. As conclusion branding has a significant positive effect on Tourism
Performance in Rwanda as this research project shown.

70
CHAPTER 5
5.0 SUMMARY, CONCLUSIONS & RECOMMENDATIONS
5.1 Introduction
This chapter expresses the summaries, conclusions and recommendations of the study. Data is
summarised in line with the objectives of the study described in chapter one of this thesis.
5.2 Objective One: Components of Branding and How They Enhance the Performance of
the Tourism Sector in Rwanda
5.2.1. Branding components and how they enhance performance of the sector.
It was established that clients are able to recognise Rwanda as a tourism brand because of the
presence of brand components like brand awareness, brand promise, brand commitments and
brand positioning which all in different measures enhance the performance of the tourism sector
in Rwanda. The researcher discovered that a lot still has to be done when it comes to brand
positioning as clients sometimes do not distinguish specific services that can be directly
attributed to a particular company. Clients are not sure that service providers differ from each
other with regard to their branding. Still regarding clients, there is no substantial evidence that
clients come back to the company for the same services. Most respondents are not sure if at all
the clients come back to the company for the same services.
5.3 Objective Two: Branding Strategies Used In Rwandan Tourism Sector
5.3.1 Branding strategies used in Rwandan tourism sector
Marketing managers are the ones who are mainly responsible for marketing in their respective
companies represented by 48 percent with the largest product being the wildlife tours. Direct
marketing has been employed by most if not all the target companies to reach the potential and
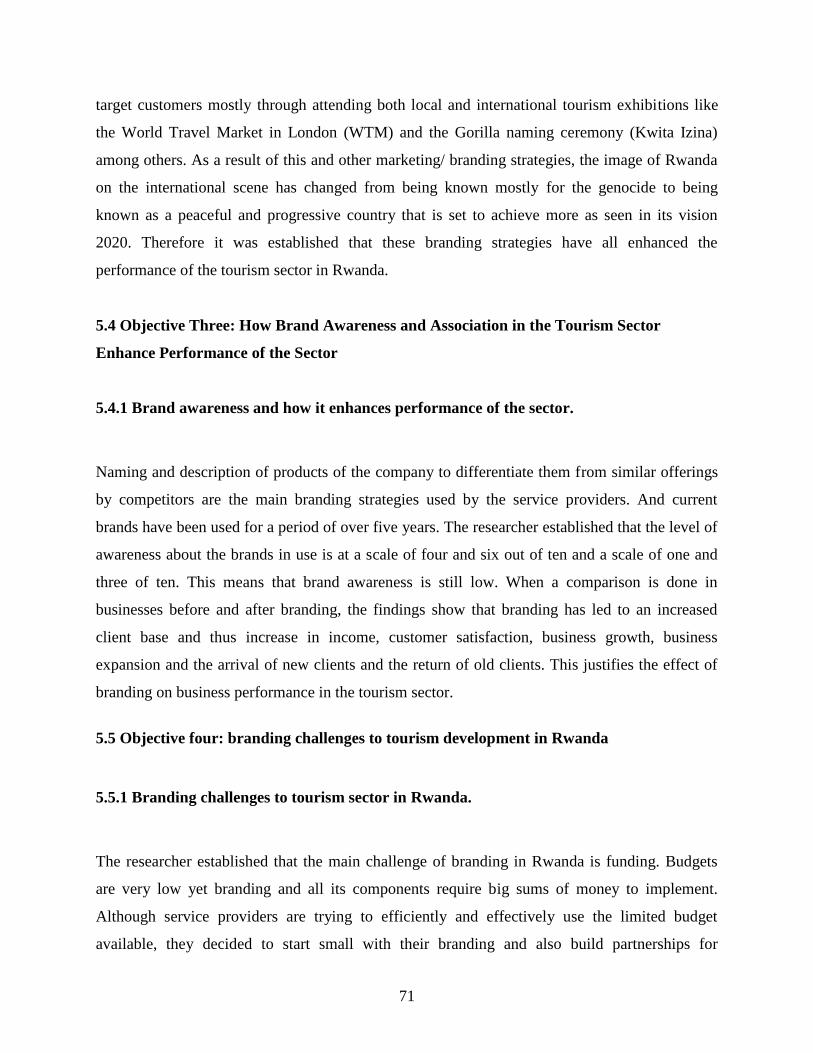
71
target customers mostly through attending both local and international tourism exhibitions like
the World Travel Market in London (WTM) and the Gorilla naming ceremony (Kwita Izina)
among others. As a result of this and other marketing/ branding strategies, the image of Rwanda
on the international scene has changed from being known mostly for the genocide to being
known as a peaceful and progressive country that is set to achieve more as seen in its vision
2020. Therefore it was established that these branding strategies have all enhanced the
performance of the tourism sector in Rwanda.
5.4 Objective Three: How Brand Awareness and Association in the Tourism Sector
Enhance Performance of the Sector
5.4.1 Brand awareness and how it enhances performance of the sector.
Naming and description of products of the company to differentiate them from similar offerings
by competitors are the main branding strategies used by the service providers. And current
brands have been used for a period of over five years. The researcher established that the level of
awareness about the brands in use is at a scale of four and six out of ten and a scale of one and
three of ten. This means that brand awareness is still low. When a comparison is done in
businesses before and after branding, the findings show that branding has led to an increased
client base and thus increase in income, customer satisfaction, business growth, business
expansion and the arrival of new clients and the return of old clients. This justifies the effect of
branding on business performance in the tourism sector.
5.5 Objective four: branding challenges to tourism development in Rwanda
5.5.1 Branding challenges to tourism sector in Rwanda.
The researcher established that the main challenge of branding in Rwanda is funding. Budgets
are very low yet branding and all its components require big sums of money to implement.
Although service providers are trying to efficiently and effectively use the limited budget
available, they decided to start small with their branding and also build partnerships for
72
marketing as the tourism industry in Rwanda portrays a great prospect and if the actors in the
sector take their branding forward, then the sky is surely the limit for the sector in Rwanda. But
the strong point is that the actors in the sector are energised and moving forward.
5.6 Conclusions
Tourism like any other trade flourishes with proper marketing and proper marketing strategies.
From this study it is true that marketing managers were the lead persons in marketing and were
sometimes supported by the executive directors. The team involved in marketing was indeed
limited based on the need and importance that marketing holds to the sector. The main focus is
put on wildlife tours as a tourism product which has limited the potential to venture into
promoting many other potential tourism products like birding, village walks, cultural tours and
many others.
While analysing Rwanda as a destination, it was established that a lot of work and public
relations has to be done on the international scene to get it past the Genocide era although now
Rwanda has positioned itself as a progressive country that is developing faster than all the other
East African countries. However, still in comparison with other East African countries, Rwanda
is a more expensive destination where the local population still believes that tourism is only for
the foreigners so a lot has to be done to get rid of this perception through brand awareness
especially as it brings the tourism sector to the forefront and to international attention (Govers,
R., F.M. Go, and K. Kumar 2007). The current level of success of the tourism sector in Rwanda
has linkages to branding and this has brought Rwanda to the global fore front.
5.7 Recommendations
In order to enhance the brands and effectively market the tourism sector, the task of marketing
and branding should not be left for only the marketing managers. All members of the sector
should play an active role on marketing and promoting the brand. Several creative ways can be
developed to popularise the brand and all the team should be active participants in this process.
Budgets should be increased for the marketing and branding ideas to flourish.
73
Tour operators need not stick to only wildlife safaris because this is what every other tour
operator is doing. This in fact explains the poor performance in brand positioning. A company
needs to come out and market a specific service that will be attributed to it so that it will be well
positioned in that particular service. For example a company may position itself as one that
provides village walking services. That means such a company becomes a king in this service.
There is need to diversify the tourism branding strategies used in Rwanda. Right now mainly
naming and description of products of the company are used and it has not let to maximum brand
awareness. There are several other branding strategies that are ignored. For example there is a
limitation in building a brand identity that easily relates to clients, building a lifestyle platform
that inspires local people and international ones alike to communicate hope and embrace the
sector as well as use of images and unique messages.
There is a need to segment the tourism market in Rwanda. Market segmentation can be
applied by any unit operating in tourism industry that is the hotels, travel agencies, tourist
attractions, restaurants, and local charities. The stake holders should be able to realize that the
benefit of market segmentation lies in a tourist destination being able to specialize on the
needs of a particular group and become the best in catering for this group. In doing so the
destination gains a competitive advantage because competition can be reduced from the global
market to tourism destinations specializing on the same segment. Secondly efforts can be
focused on improving the product in a specific way rather than trying to provide all things to
all people at high cost. Thirdly, marketing efforts can be focused by developing the most
effective message for the segment targeted and by communicating the message through the
most effective communication channel for the segment.
Tour operators should develop tour packages for the locals at affordable prices so that the locals
can also get involved in tourism. This will serve to change the perception of the locals that
tourism is only for the foreigners mostly the Europeans. Involvement of the locals will also serve
as a conservation tool as the locals will know the value of tourism based on their experience.
Although the researcher established that community tourism is being practiced primarily by the
local communities with activities like village walks, pastoralist heritage tours among others a lot

74
still has to be done as all this is still at small scale so a lot still has to be done to involve the local
communities in tourism.
The stakeholders in the tourism sector should clarify goals to be achieved by their tourism
branding strategies. Often times goals are vague or multi focused and not achievable, not
measurable for replication and may sometimes lead to unintended results. A mechanism should
be put in place to measure effectiveness of the strategies that have been implemented and
subsequently identify problem areas that need further follow up.
The findings show that there are still budgetary constraints and most of the stake holders
cannot afford to brand as they would wish. The researcher recommends the stakeholders to
have realistic expectations regarding the funding and duration required to achieve the proposed
plan. There is also a need for effective capital investment support, financial and other
incentives for product development. Emphasis is needed on investment and financing that is
able to develop and promote quality and sustainable tourism products, minimize revenue
leakage, and provide significant beneficial impact to local communities.
Stakeholders in the tourism sector have to continuously carry out both competitor analysis and
SWOT analysis. Competitor analysis is an important part of a strategic planning process. The
key of competitor analysis is to find ways of differentiating from competition. In addition, it is
also the best way learn from competitors and strengthen own business. Therefore, it is
necessary make competitor analysis and finds the competitive advantages of self.
There is an acute shortage of trained manpower in Rwanda and the tourism sector is no
exception. The approach and implementation of capacity building and the development of human
resources has so far been fragmented. The quality of tourism professionals, including hotel
employees, guides, waiters and other key personnel is inconsistent and below par when
compared with regional competitors. The training facilities currently operated have poor
equipment, limited books and internet, inconsistent curricula, and a lack of qualified staff.
Tourism is a people-to-people activity where human interaction plays an important role. The
75
government should therefore speed up plans to create a tourism training institute which will give
hands on skills to the human resources in the tourism industry.
5.8 Further Research areas.
Despite all that has been done to revive the tourism industry in Rwanda, there is still a very long
way to go. There are so many areas that have not been tackled yet they need to be dealt with as a
matter of urgency. Rwanda has shown over reliance on a single tourism product as also seen in
Nielsen et al (2010) that there is over reliance on gorilla tourism. Therefore further research
should be carried out in the area of product diversification and how it can help in making
Rwanda a more competitive tourist destination in the region.
76
REFERENCES
Aaker, A. (1996). measuring brand equity across products and markets. Califonia.
Aaker, D. .. (2004). brand portofolio strategy. New york: free press.
Adamovicz, A. J. (2000). tourism impact modeling for resource extraction regions. Journal oftourism research.
Amin, M. (2005). social science research conception, methodology and analysis. kampalauganda: makerere university.
Amstrong. (2001). principles of marketing. New Jersey: Prentice hall.
Anholt, S. (2004). branding places and nations. brand management , p 213 - 304.
Anholt, S. (2005). Nation brand index. Advertising research , p 296 - 304.
Anholt.S. (2002). Forward. Journal of brand management , p 229 - 239.
Arcese, B. C. (1995). are intergrated conservation development projects sustainable. worlddevelopment.
Archer, F. J. (1991). progress in tourism, recreation and hospitality management . London:Belhaven.
Assaf, A. (2010). air transport benchmarking report . Vancouver : air transport research society .
Balakrishnan, M. (2009). strategic branding of destinations. European journal of marketing ,p611 - 629.
Baloglu, S. e. (1999). a model of destination image formation. Annals of tourism research , p 868- 897.
Beerli, A. a. (2004). tourists, characteristics and the percieved image of tourism destination.tourism management , p 623 - 636.
Bigne, E. S. (2001). tourism image, evaluation of variables and after perchase behavior . tourismmanagement , p 607 - 616.
Blain, C. L. (2005). destination branding. journal of travel research , p 328 - 338.
Blake A, M. a. (2003). quantifying the impact of foot andmouth diseas on tourism and the UKeconomy. Tourism Economics , p 449 - 465.
Brown.S. (2003). teaching old brands new tricks. journal of marketing , p 19-33.
77
Burns., R. (2000). Introduction to research methods (4th edition). NSW: Longman.
Bush, G. (2009). personal communication. woods hall research centre.
Cai, L. (2002). cooperative branding for rural destinations. annals of tourism research , p 720 -742.
Caldwell, N. a. (2004). the difference between branding a country, region and city. journal ofbrand management , p 50 - 61.
Campos J, L. G. (2005). service quality and competitiveness in the hospita;ity sector . Tourismeconomics , p 85-103.
Chaudhuri, A. (2001). the chain of effect from brand trust to brand performance. jornal ofmarketing , p 81-93.
council, T. a. (2007). travel and tourism perfoemance report for Rwanda. Kigali.
Crouch G, a. B. (1999). Tourism competitiveness and societal prosperity . Journal of businessresearch , p 137-152.
Curtis, J. (2001). branding a state; the evolution of brand oregon. journal of vacation marketing ,p 75-81.
Dave, B. J. (1999). productivity consequencies of hotel strategies- cornell hotel and restaurant.un published .
Dave, M. (2006). communicating destination brand image. Euro CHRIE Congress. Thesaloniki -Greece.
Davis, S. M. (2003). building a brand driven business. New york : free press .
Dawes J, M. K. (2009). consideration sets for financial service brands . journal of financialservices marketing , p 190-202.
De Chematony, L. (1999). brand management through narrowing the gap between brand identifyand brand reputation. journal of marketing management , p 157-179.
Deeray, M. (2010). evaluating the performance and scale characteristics of the australianrestaurant industry. Hospitality and tourism research .
Desai, K. a. (2002). the effect of ingredient branding strategies on host brand extebility. jornal ofmarketing , p 73-93.
Dwyer, P. L. (2003). tourism contribution to a state economy. Tourism economics , p 431-448.
78
Echtner, C. &. (1993). the measurement of destination image . journal of travel research , p 3-13.
Echtner, C. a. (1999). measuring and measurment of destination image. journal of tourismstudies , p 2 - 12.
Echtner, C. e. (1993). measurement of destinaytion image and empirical assessment . travelresearch , p 3 - 13.
Economics, T. (2004). evaluating tourism's economic effects: new and old approaches. Tourismmanagement , p 307-317.
Evans, N. (2009). marketing plan for Rwanda tourism. China.
Ewing, J. M. (2004). developing and validating a multidimentional non profit brand orientationscale. journal of travel research , p 841-853.
Fawcett, B. G. (2007). an economic study of mountain gorillas in virunga.
Fazio, R. H. (1992). development and strength of category brand association. journal ofconsumer psychology , p 1-13.
Gartner, W. (1993). image formation process. travel and tourism marketing , p 191 - 215.
Gartner, W. (1993). image formation process. New york: haworth press.
Gartner, W. (1986). temporal influence on image change. journal of tourism research .
Ghodeswar, B. (2008). building brand identity in competitive markets. journal of product andbrand management , p 4-12.
Goldsmith, R. e. (2000). the impact of corporate credibility and celebrity credibility on consumerreaction to advertisements and brands. journal of advertising , p 43-54.
Grace, D. O. (2005). examining the effect of service brands communications and brandevaluation. journal of product and brand management , p 106-116.
Grifith, B. .. (1995). dynamic counter data models of technological innocation. Economicjournal.
Grossmann, G. a. (1991). innovation and growth in the global economy. Cambridge: MIT press.
Gwinner, K. E. (1999). building brand image through event sponsership. journal of advertising ,p 47-57.

79
Hana, S. &. (2008). an analysis of terminology used in place branding. journal of brandmanagement , p 61-75.
Hankinson, G. (2005). destination beand images. journal of service marketing , p 24-32.
Hankinson, G. (2001). location branding. journal of brand management , p 127-142.
Hawkinson, G. (2007). the manegement of destination beands. journal of brand management , p240-254.
Horrigan, D. (2009). branded content . international scientific conference. Rhides Island-Greece.
Hosany, S. e. (2006). destination image and destination personality. journal of business research, p 638-642.
Hunt, J. D. (1975). image as a factor in tourism development. journal of travel research , p 1-7.
Industry, D. o. (2002). small and medium enterprise statistics. Department of trade and industry .
Kapferer, J.-N. (2012). the new strategic brand management. London: Kogan page.
Kelle, K. L. (2006). brands and branding.
Kelle, K. L. (2000). building and managing corporate brand equity. Oxford: oxford universitypress.
Kelle, K. L. (1998). measuring customer based brand equity. journal of brand management , p989-1010.
Keller, K. L. (2009). strategic brand management . New York USA.
Kerr, G. (2006). from destination brand to location brand. journal of brand management , p 276-283.
Kimpakorn, N. T. (2010). service brand equity and employee brand comitment. journal ofservice marketing , p 378-388.
Knox, S. (2004). positioning and branding your organisation . journal of product and brandmanagement , p 105-115.
Kotler. (2002). country as a brand. journal of brand management , p 249-261.
Kotler, L. P. (2009). Marketing management. London: Pearson education.
Laitamaki, J. M. (2008). drivers of globalisation in tourism industry. annual TTRA europeconference. Helsinki-Finland.
80
Mansfield. (1992). from motivation to actual travel. tourism research (vol 19).
Olins, W. (2002). excellence in destination branding. journal of brand management , p 241-248.
O'Shaughnessy, J. (2000). treating the nation as a brand. jornal of macro marketing , p 56-64.
Papadopoulos, N. &. (2002). country equity and country branding. journal of brand management, p 294-314.
Park, C. e. (1986). strategic brand concept-image management. journal of marketing , p 135-145.
Pike, S. (2005 ). tourism destination branding complexity . jornal of product and brandmanagement , p 258-259.
Pitchard, A. &. (1998). mood marketing - the destination branding strategy. jornal of vacationmarketing , p 215-229.
R.Burtler. (2008). seasonality in the tourism sector. Oxford: Baum and Lundtorp.
Rao, D. L. (2000). The price competitiveness of trade and tourism. Turism management , p 9 -22.
Robers, C. a. (2003). productivity, output and failure: a comparison of Taiwanese and Koreanmanufacturers. Economic journal , p 113:485-510.
Sala-i-maratin, B. J. (2003). growth and competitive index. global competitive report.
sanders, D. J. (2002). analysing trends from a marketing perspective. Napal.
Saura, G. M. (2002). destination image: towards a conceptual framework. tourism research , p56 - 78.
Spurr, D. L. (2003). inter- industry effects of tourism growth. Tourism management .
Statistics, C. B. (1979). Statistical abstracts:. Nairobi: central bureau of statistics.
Sugiyarto, G. N. (2005). competitiveness indicators in the travel and tourism industry. Tourismeconomics , p 25-44.
Temporal, P. (2010). Advanced brand management. London: world page.
Thomas, E. A. (2000). modeling the benefits of training to business performance in leisureretailing.
81
Trade, D. o. (2002). productivity and cometitiveness indicators. Department of trade andindustry.
Treasury, H. (2000). productivity in UK - evidence and government approach. London: HMtreasurer.
Urde, M. (1999). brand orientation . jornal of marketing management , p 117-133.
Ward, S. L. (1999). what high tech managers need to know about brands. Cambridge: harvardbusiness .
Wee, T. a. (2003). Laveraging on symbolic values and meaning in branding. journal of brandmanagement , p 208-218.
82
APPENDICES
Appendix 1 QUESTIONNAIRE
ANN KALEMBEJOMO KENYATTA UNIVERSITY OF
AGRICULTURE AND TECHNOLOGYMBA STUDENT
KIGALI RWANDAE-mail: [email protected]
Tel: +250782556107.
Dear Respondent,Re: MBA Research Questionnaire.I am currently collecting data in order to complete my MBA Project/ research entitled“Contribution of branding in enhancing performance of the tourism sector in Rwanda”I humbly request you to answer the questions and would like to inform you that this research ispurely an academic research and its purpose is only to collect views concerning the above topic.I assure you that information provided shall be kept confidential and will be only used for this
research.
Your co-operation in completing this questionnaire will be highly appreciated.Yours Sincerely,
Ann Kalembe
PART A- SECTION A. General Information.Please tick where appropriate (√)
1. Identification
NAME(S) …………………………………………………………………………………………
JOBTITLE…………………………………………………………………………………………
TELEPHONE NUMBER ………………………………………………………………………….
EMAIL…………………………………………………………………………………………......
Designation/ Department. ………………………………………………………………………..
2. GenderMale ( )Female ( )
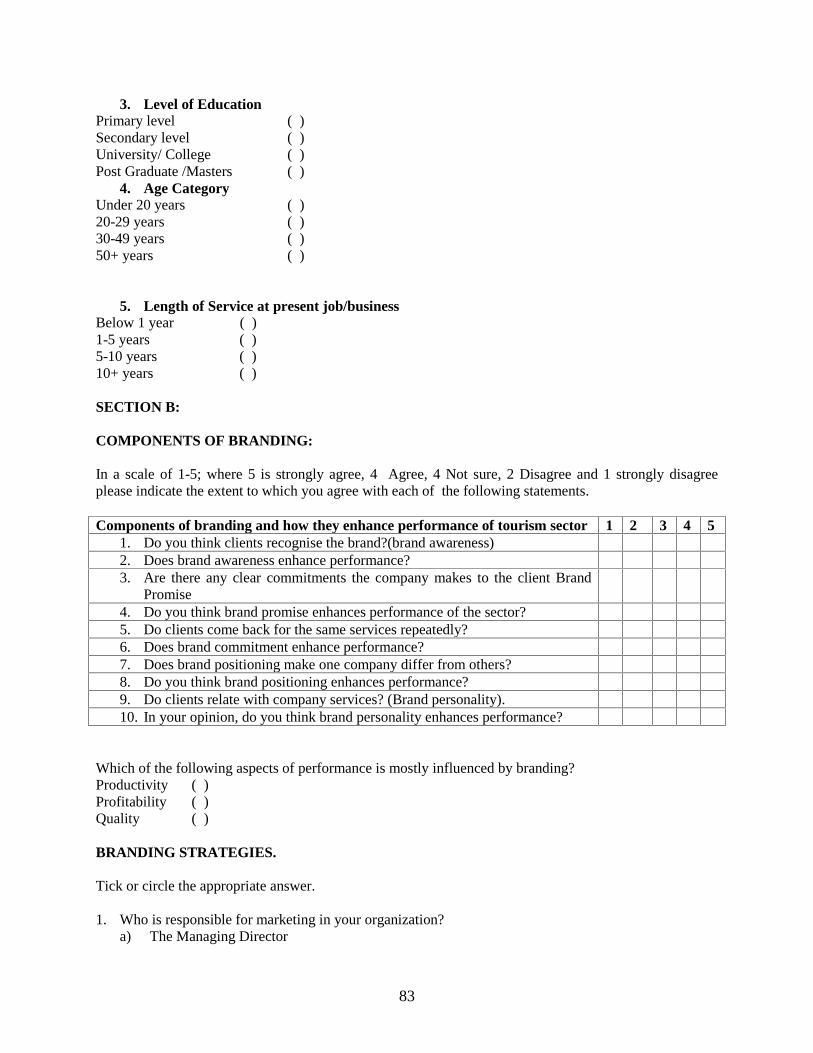
83
3. Level of EducationPrimary level ( )Secondary level ( )University/ College ( )Post Graduate /Masters ( )
4. Age CategoryUnder 20 years ( )20-29 years ( )30-49 years ( )50+ years ( )
5. Length of Service at present job/businessBelow 1 year ( )1-5 years ( )5-10 years ( )10+ years ( )
SECTION B:
COMPONENTS OF BRANDING:
In a scale of 1-5; where 5 is strongly agree, 4 Agree, 4 Not sure, 2 Disagree and 1 strongly disagreeplease indicate the extent to which you agree with each of the following statements.
Components of branding and how they enhance performance of tourism sector 1 2 3 4 51. Do you think clients recognise the brand?(brand awareness)2. Does brand awareness enhance performance?3. Are there any clear commitments the company makes to the client Brand
Promise4. Do you think brand promise enhances performance of the sector?5. Do clients come back for the same services repeatedly?6. Does brand commitment enhance performance?7. Does brand positioning make one company differ from others?8. Do you think brand positioning enhances performance?9. Do clients relate with company services? (Brand personality).10. In your opinion, do you think brand personality enhances performance?
Which of the following aspects of performance is mostly influenced by branding?Productivity ( )Profitability ( )Quality ( )
BRANDING STRATEGIES.
Tick or circle the appropriate answer.
1. Who is responsible for marketing in your organization?a) The Managing Director

84
b) The Marketing Departmentc) Everybody
2. Identify some of the tourism products that you sell.a) Wilderness safarisb) Cultural tours/safarisc) Birding and avian tourism
3. Please identify which tourism marketing programs or campaigns your company/ organization engagein?
a) The kwita izina( Gorilla Naming ceremony)b) Exhibitions at different tourism fares across the globec) Direct marketing to tourists and tour operators globally
4. Over time Rwanda has positioned itself as aa) High end/luxury destinationb) Mid-range destinationc) Low range/ Budget destination
5. What is the image of Rwanda on the international scene?a) It is viewed in terms of the genocide of 1994b) It is viewed as a poor countryc) It is viewed as a fast developing and progressive country with good security
6. What are the attitudes of the locals towards tourism?a) They think tourism is a “Foreigner’s (white man’s) thingb) They think tourism is a waste of valuable time.c) They simply do not care.
BRAND AWARENESS AND ASSOCIATION
What are the branding strategies used? (Tick where appropriate).
Name of Company ( )The product we sell ( )We try to make people identify with us ( )No brand ( )We promote many products ( )We put labels and stickers. ( )
How long have you used your branding strategy?1 year and below ( )
2-5 years ( )5 Years and above ( )

85
BRAND RELATED CHALLENGES.
What Challenges Exist?Pursuing your destination tourism brand strategy and market identity has challenges:
a) Brand messages aren’t always believed or rememberedb) Image based marketing suffers from huge homogeneityc) Resources are limited. Budgets are low. Competition is highd) Stakeholders (governments, businesses & locals) disagreeHow have the challenges been handled?
a) Partnershipsb) Starting smallc) Using available resourcesd) No sustainable solution yet.
What do you think are the future prospects in the tourism industry?a) Bright Futureb) Dark Futurec) Not Sure
What challenges do you face in your tourism business?………………………………………………………………………………………………………………Do you believe the small size of Rwanda as a country affected tourism growth? If Yes, please explain.………………………………………………………………………………………………………………
Is there any additional information that you would like to share?……………………………………………………………………………………………………………

86
Appendix II: Members of RTTA
1. Sunrise Eco-tours(
2. International Tours and Travel (ITT)
3. Attractive Safaris
4. Bizidanny Tours & Safaris
5. Eagle Ride
6. Gerry Tours & Safaris
7. Intore Expedition
8. JK Safaris
9. Songa Africa
10. EOS Visions Rwanda
11. Virunga Expeditions
12. ITA
13. Jambo Tours Rwanda
14. Individual Tours
15. Amber Expeditions
16. Uber Luxe Safaris
17. New Dawn Associates
18. Amahoro Tours
19. East Africa Eco Explorer
20. Primate Safaries
21. Mapendano Voyages
22. Rickshaw Travels
23. Rwanda Eco-Tours
24. The Far Horizon
25. Thousand Hills Expeditions
26. Vava Tours
27. Volcanos Safaris
28. Wildlife Tours - Rwanda
29. Let’s go Tours Rwanda Ltd
87
30. Concord magic Safaris
31. FCm Charleston Travel Rwanda Ltd
32. United Travel and Safaris
33. Achut Ltd
34. The Country Inn Tours
35. Terra Incognita eco-tours
36. Promocar Ltd
37. Umubano Tours

88