Contribution from Poland
14
EMEP Assessment Report Poland Final version Edited by Grażyna Mitosek Authors: Grażyna Mitosek Anna Degórska Jacek Iwanek Gabryela Przybylska Krzysztof Skotak The report has been prepared in the Institute of Environmental Protection in Warsaw. The work has been contracted by the Ministry of Environment and financed by the National Fund for Environmental Protection. Warsaw 2004 Contents 1. Introduction ..................................................................................................................................................... 176 2. Scope and sources of information presented in the report............................................................................... 176 3. Emission of air pollutants in Poland and its changes in 1980-2000 ................................................................ 177 3.1. Sulphur dioxide ....................................................................................................................................... 177 3.2. Nitrogen dioxide ...................................................................................................................................... 177 3.3. Ammonia ................................................................................................................................................. 178 3.4. Nonmethane volatile organic compounds ............................................................................................... 178 3.5. Heavy metals: lead, cadmium, mercury .................................................................................................. 179 3.6. Concluding remarks on emission changes in Poland............................................................................... 180 4. Air pollution and its changes in Poland........................................................................................................... 180 4.1. Sulphur compounds ................................................................................................................................. 180 4.1.1. Sulphur dioxide ................................................................................................................................ 181 4.1.2. Sulphur compounds in ambient air and precipitation at Polish EMEP stations ............................. 181 4.2. Nitrogen compounds ............................................................................................................................... 182 4.2.1. Nitrogen dioxide .............................................................................................................................. 182 4.2.2. Nitrogen compounds in ambient air and precipitation at Polish EMEP stations ............................ 183 4.3. Acidity of precipitation............................................................................................................................ 184 4.4. Ozone ...................................................................................................................................................... 185 5. Transboundary transport of sulphur and nitrogen compounds in the light of EMEP modelling results.......... 186 6. Concluding remarks on air quality in Poland .................................................................................................. 187 References and data sources................................................................................................................................ 188
Transcript of Contribution from Poland

EMEP Assessment Report Poland
Final version
Edited by Grażyna Mitosek
Authors: Grażyna Mitosek Anna Degórska Jacek Iwanek Gabryela Przybylska Krzysztof Skotak
The report has been prepared in the Institute of Environmental Protection in Warsaw.
The work has been contracted by the Ministry of Environment
and financed by the National Fund for Environmental Protection.
Warsaw 2004
Contents 1. Introduction..................................................................................................................................................... 176 2. Scope and sources of information presented in the report............................................................................... 176 3. Emission of air pollutants in Poland and its changes in 1980-2000 ................................................................ 177
3.1. Sulphur dioxide ....................................................................................................................................... 177 3.2. Nitrogen dioxide...................................................................................................................................... 177 3.3. Ammonia ................................................................................................................................................. 178 3.4. Nonmethane volatile organic compounds ............................................................................................... 178 3.5. Heavy metals: lead, cadmium, mercury .................................................................................................. 179 3.6. Concluding remarks on emission changes in Poland............................................................................... 180
4. Air pollution and its changes in Poland........................................................................................................... 180 4.1. Sulphur compounds ................................................................................................................................. 180
4.1.1. Sulphur dioxide................................................................................................................................ 181 4.1.2. Sulphur compounds in ambient air and precipitation at Polish EMEP stations ............................. 181
4.2. Nitrogen compounds ............................................................................................................................... 182 4.2.1. Nitrogen dioxide .............................................................................................................................. 182 4.2.2. Nitrogen compounds in ambient air and precipitation at Polish EMEP stations............................ 183
4.3. Acidity of precipitation............................................................................................................................ 184 4.4. Ozone ...................................................................................................................................................... 185
5. Transboundary transport of sulphur and nitrogen compounds in the light of EMEP modelling results.......... 186 6. Concluding remarks on air quality in Poland .................................................................................................. 187 References and data sources................................................................................................................................ 188
EMEP Assessment Report – Part II
176 1. Introduction
The report has been prepared in the Institute of Environmental Protection in Warsaw, as Polish contribution to the EMEP Assessment Report. The national assessment considers the air and precipitation pollutants included in the EMEP monitoring program. Special attention has been paid to SO2, NO2 and O3, for which both Polish and UE air quality standards are established.
Topics presented and discussed in the report are: the national emissions of selected air pollutants and their changes during the last two decades against a background of the European trends; assessment of the present state of air quality (selected parameters) in Poland and its comparison to other European countries; assessment of air quality changes based on data from stations operated under the State Environmental Monitoring Programme.
2. Scope and sources of information presented in the report Information on emissions in Poland is based on official Polish emission data submitted to the UNECE/EMEP database. At present, the data is prepared by the National Emission Centre in the Institute of Environmental Protection in Warsaw, closely cooperating with other institutes and experts as well as with the Ministry of Environment. Information on air and precipitation pollution comes from Polish EMEP stations and the National Network of Basic Stations (NNBS) - both operated under the State Environmental Monitoring Programme SEMP (coordinated by the State Inspectorate for Environmental Protection).
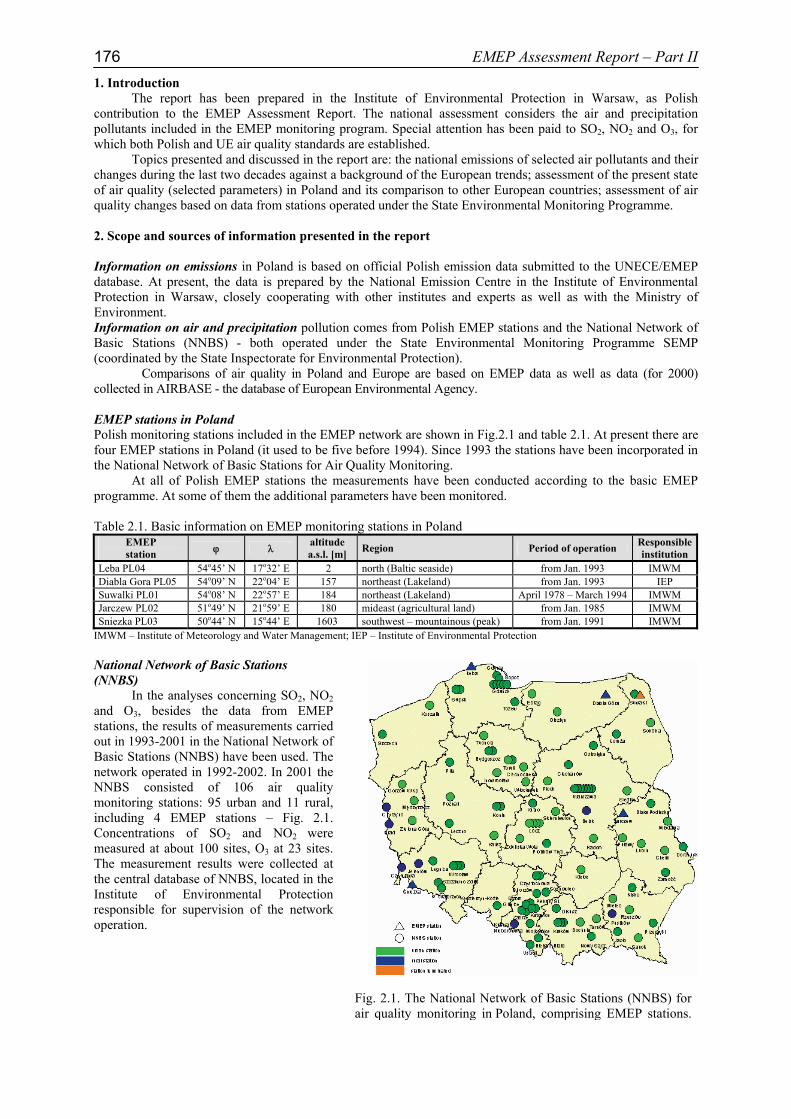
Comparisons of air quality in Poland and Europe are based on EMEP data as well as data (for 2000) collected in AIRBASE - the database of European Environmental Agency. EMEP stations in Poland Polish monitoring stations included in the EMEP network are shown in Fig.2.1 and table 2.1. At present there are four EMEP stations in Poland (it used to be five before 1994). Since 1993 the stations have been incorporated in the National Network of Basic Stations for Air Quality Monitoring.
At all of Polish EMEP stations the measurements have been conducted according to the basic EMEP programme. At some of them the additional parameters have been monitored. Table 2.1. Basic information on EMEP monitoring stations in Poland
EMEP station ϕ λ
altitude a.s.l. [m] Region Period of operation Responsible
institution Leba PL04 54o45’ N 17o32’ E 2 north (Baltic seaside) from Jan. 1993 IMWM Diabla Gora PL05 54o09’ N 22o04’ E 157 northeast (Lakeland) from Jan. 1993 IEP Suwalki PL01 54o08’ N 22o57’ E 184 northeast (Lakeland) April 1978 – March 1994 IMWM Jarczew PL02 51o49’ N 21o59’ E 180 mideast (agricultural land) from Jan. 1985 IMWM Sniezka PL03 50o44’ N 15o44’ E 1603 southwest – mountainous (peak) from Jan. 1991 IMWM
IMWM – Institute of Meteorology and Water Management; IEP – Institute of Environmental Protection
National Network of Basic Stations (NNBS)
In the analyses concerning SO2, NO2 and O3, besides the data from EMEP stations, the results of measurements carried out in 1993-2001 in the National Network of Basic Stations (NNBS) have been used. The network operated in 1992-2002. In 2001 the NNBS consisted of 106 air quality monitoring stations: 95 urban and 11 rural, including 4 EMEP stations – Fig. 2.1. Concentrations of SO2 and NO2 were measured at about 100 sites, O3 at 23 sites. The measurement results were collected at the central database of NNBS, located in the Institute of Environmental Protection responsible for supervision of the network operation.
Fig. 2.1. The National Network of Basic Stations (NNBS) for air quality monitoring in Poland, comprising EMEP stations.

Contribution from: Poland
177
3. Emission of air pollutants in Poland and its changes in 1980-2000 3.1. Sulphur dioxide
The main sources of SO2 emission in Poland are combustion processes in energy production, domestic heating and manufacturing industry.
Emission of SO2, on the level of 1511 ktonnes in 2000, accounted for about 6% of total SO2 emission in EMEP region. This rather considerable contribution is connected with the country dimension, population as well as structure of fuel consumption.
Between 1980 and 2000 the national SO2 emission decreased by more than 63%, from 4100 ktonnes to
1511 ktonnes. Character of emission changes in Poland was similar to observed in some neighbouring countries – Czech Republic and Ukraine (Fig. 3.1). Significant SO2 emission reduction in Poland has been observed since 1990 – the rate of reduction during the successive years in Poland was like the rate for total sulphur dioxide emission in EMEP area (Fig. 3.2).
The observed emission changes in Poland resulted from emission reduction in all emitting sectors. The reduction was a consequence of structural changes in industry due to economy transformation on one hand and of the abatement measures on the other one.
National total SO2 emission in Poland in 2000 was below the target values of the second sulphur protocol and the Gothenburg protocol with respect to 2005 (agreed as 2173 ktonnes). Now it approaches the target value for 2010 (1397 ktonnes) – see table 3.1.
3.2. Nitrogen dioxide
The main contributors to nitrogen oxides (as NO2) emission to air in Poland are combustion processes in energy production and manufacturing industry (50% in 2000) and road transport (27%). Due to a fast growing number of cars and problems with traffic fluency in urban areas, the road transport has significant and growing influence on NOx concentrations in air in Polish cities.
National total emission of nitrogen oxides (as NO2) in 2000 amounted to 838 ktonnes and was on the
0.0
0.2
0.4
0.6
0.8
1.0
1.2
1980
1981
1982
1983
1984
1985
1986
1987
1988
1989
1990
1991
1992
1993
1994
1995
1996
1997
1998
1999
2000
2010
Gothenburg Prot.
Poland
Total EMEP
SO2 emission changes in relation to 1980 [-]
0
1000
2000
3000
4000
5000
6000
7000
8000
9000
1980
1981
1982
1983
1984
1985
1986
1987
1988
1989
1990
1991
1992
1993
1994
1995
1996
1997
1998
1999
2000
0
10000
20000
30000
40000
50000
60000
70000PolandCzech RepublicGermanyUkraineTotal EMEP
SO2 emission in the countries [Gg] Total EMEP SO2 emission [Gg]
Fig. 3.1. Trends of SO2 emissions [ktonnes] in Poland, in the selected neighbouring countries, and total EMEP in 1980-2000
Fig. 3.2. Relative changes in SO2 emissions in Poland and total EMEP in 1980-2000 (values related to 1980 emissions)
0
500
1000
1500
2000
2500
3000
3500
4000
1980
1981
1982
1983
1984
1985
1986
1987
1988
1989
1990
1991
1992
1993
1994
1995
1996
1997
1998
1999
2000
0
5000
10000
15000
20000
25000
30000
PolandCzech RepublicGermanyUkraineTotal EMEP
NO2 emission in the countries [Gg] Total EMEP NO2 emission [Gg]
0.0
0.2
0.4
0.6
0.8
1.0
1.2
1.4
1980
1981
1982
1983
1984
1985
1986
1987
1988
1989
1990
1991
1992
1993
1994
1995
1996
1997
1998
1999
2000
2010
Gothenburg Prot.
Poland
Total EMEP
NO2 emission changes in relation to 1980 [-]
Fig. 3.3. Trends of NO2 emissions [ktonnes] in Poland, in the selected neighbouring countries, and total EMEP in 1980-2000
Fig. 3.4. Relative changes in NO2 emissions in Poland and total EMEP in 1980-2000 (values related to 1980 emissions)

EMEP Assessment Report – Part II
178 average level in Europe. At present Poland accounts for about 4% of total NOx emission in EMEP region (in the period of 1980-2000 it accounted for 4.0-5.7%).
Between 1980 and 2000 total national emission of NOx dropped by 32%, from 1229 ktonnes to 838 ktonnes respectively. Changes in Poland were similar to observed in the neighbouring countries – (Fig.3.3). Compared with the total emission in EMEP region, NOx emission in Poland during the last few years have shown faster decrease (Fig. 3.4). Over the last decade, considerable emission reduction has taken place from large sources of energy production sector, resulting from abatement measures in this sector.
In 2000 NO2 emission in Poland has already reached the target level for 2010 from Gothenburg protocol (tab. 3.1). Due to the expanding transport and traffic, it may be difficult to keep the emission below the target by that time.
3.3. Ammonia
Predominant source of ammonia emitted into air in Poland is agriculture (accounting for 94% of total emission in 2000) – animal husbandry and, to a smaller extent, the use of nitrogenous fertilizers.
The national NH3 emission in 2000 amounted to 322 ktonnes (4.5% of total in EMEP region) and represented the average level in Europe.
Since 1989 a gradual decrease in NH3 emission has occurred in Poland, similar to that observed in some
neighbouring countries (Fig. 3.5). The national emission dropped from 550 ktonnes in 1980 do 322 ktonnes in 2000 (by about 41%). Rate of the decline in Poland was higher than of total emission in EMEP (Fig. 3.6).
The decrease in ammonia emission in Poland, being a consequence of its changes in agriculture sector,
results from a decrease in livestock. Ammonia emission reduction expected from Poland under Gothenburg protocol has been achieved – the
national emission is below the target for 2010 (tab. 3.1). 3.4. Nonmethane volatile organic compounds
NMVOC emitted to air originate mainly from fuel combustion (in 2000 in Poland about 70% including combustion in engines). Significant NMVOC sources are solvent use (26% of anthropogenic emission) and road transport (24%).
National total emission in 2000 was 599 ktonnes and contributed 3.3% to the total emission in EMEP region. NMVOC emission in Poland is of an average level compared to other European countries.
Between 1980 and 2000 emission in Poland was reduced by 42%, from 1036 ktonnes to 599 ktonnes respectively. In the eighties no decreasing trends occurred in Poland. It was similar in the neighbouring countries. At the same time the total NMVOC emission in EMEP region showed upward tendencies (Fig. 3.7).
Emission reduction occurring in the ninetieths in Poland was slower than in the case of total emission in EMEP region, however the reduction achieved over
0
250
500
750
1000
1980
1981
1982
1983
1984
1985
1986
1987
1988
1989
1990
1991
1992
1993
1994
1995
1996
1997
1998
1999
2000
0
1000
2000
3000
4000
5000
6000
7000
8000
9000
10000
PolandCzech RepublicGermanyTotal EMEP
NH3 emission in the countries [Gg] Total EMEP NH3 emission [Gg]
0.0
0.2
0.4
0.6
0.8
1.0
1.2
1980
1981
1982
1983
1984
1985
1986
1987
1988
1989
1990
1991
1992
1993
1994
1995
1996
1997
1998
1999
2000
2010
Gothenburg Prot.
Poland
Total EMEP
NH3 emission changes in relation to 1980 [-]
Fig. 3.5. Trends of NH3 emissions [ktonnes] in Poland, in the selected neighbouring countries, and total EMEP in 1980-2000
Fig. 3.6. Relative changes in NH3 emissions in Poland and total EMEP in 1980-2000 (values related to 1980 emissions)
0
500
1000
1500
2000
2500
3000
3500
1980
1981
1982
1983
1984
1985
1986
1987
1988
1989
1990
1991
1992
1993
1994
1995
1996
1997
1998
1999
2000
0
5000
10000
15000
20000
25000
30000
PolandCzech RepublicGermanyUkraineTotal EMEP
VOC emission in the countries [Gg] Total EMEP VOC emission [Gg]
Fig. 3.7. Trends of NMVOC emissions [ktonnes] in Poland, in the selected neighbouring countries, and total EMEP in 1980-2000

Contribution from: Poland
179
the whole period of 1980-2000 in Poland was bigger than total EMEP. NMVOC emission in Poland in 2000 was lower than the target value of Gothenburg protocol for 2010
(determined as 800 ktonnes - tab.3.1). 3.5. Heavy metals: lead, cadmium, mercury
Emission of heavy metals from the first priority group: lead, cadmium and mercury in Poland belongs to the highest among European countries reporting data to UNECE/EMEP. It should be stressed that differences between the countries result in some cases from inventory methodology applied in the assessments of heavy metal emissions.
The largest contributors to emission of heavy metals into air in Poland are combustion processes of solid fuels for energy production purposes. Large heavy metals amounts originate from industrial processes (metallurgy – in case of cadmium and lead, and cement production in case of mercury).
Between 1990 and 2000 lead emission in Poland dropped by 53% in relation to 1990, (i.e. more than twice), cadmium by 45% and mercury by 23% (Fig. 3.8, tab. 3.2).
3.6. Concluding remarks on emission changes in Poland During the last two decades in Poland, like in many other European countries, air pollutant emissions
have decreased substantially. The emission reduction has been a consequence of abatement measures undertaken as a result of obligations imposed on the countries by particular protocols to the LRTAP Convention. Additional factor generating emission changes in Poland and in other countries of Central and Eastern Europe were structural changes in industrial sector resulting from economy transition (including emission reduction due to closing down of some industrial plants particularly harmful to the environment).
Changes in national total emissions observed in Poland between 1980 and 2000 are illustrated by data given in tables 3.1 and 3.2. Emission reduction achieved by Poland so far meet the targets of Gothenburg protocol (table 3.1). Table 3.1. Emissions of: SO2, NO2, NH3, NMVOC and CO in Poland in: 1980, 1990 and 2000, and the percentage of reductions: expected (according to Gothenburg protocol) and achieved
Emission [Gg] Percentage of reduction Pollutant 1980 1990 2000 2010* Expected* Achieved in 1990-2000
SOx (as SO2) 4100 3210 1511 1397 56.0% 52.9% NOx (as NO2) 1229 1280 838 879 31.0% 34.5% NH3 550 512 322 468 8.0% 37.1% NMVOC 1036 831 599 800 4.0% 27.9% CO 7406 7406 3463 - - 53.2% * according to Gothenburg protocol Table 3.2. Emission reductions of selected heavy metals and POPs in Poland in 1990-2000
Emission Pollutant 1990 2000
Percentage of reduction in 1990-2000
Cd [Mg] 91.6 50.4 45.0% Hg [Mg] 33.3 25.6 23.1%
Heavy Metals HM
Pb [Mg] 1371.7 647.5 52.8% Dioxins and furans [g] 529.1 333.4 37.0% HCB [Kg] 62.1 46.3 25.4% POPs PAH [Mg] 159.2 167.3 -5.1%
0
10
20
30
40
50
60
70
80
90
100
1990
1991
1992
1993
1994
1995
1996
1997
1998
1999
2000
0
200
400
600
800
1000
1200
1400
1600
Cadmium (Cd) Mercury (Hg) Lead (Pb)
Cd, Hg emission in Poland [Mg] Pb emission in Poland [Mg]
Fig. 3.8.. Trends of emissions of heavy metals: Pb, Cd, Hg [tonnes] in Poland in 1990-2000

EMEP Assessment Report – Part II
180 4. Air pollution and its changes in Poland 4.1. Sulphur compounds 4.1.1. Sulphur dioxide Trends
Significant reduction of SO2 emission to air has led to considerable improvement of air quality in Poland as regards sulphur compounds. A distinct result of the emission decline is decrease in SO2 concentrations in air, observed in the second half of ninetieths at the stations belonging to the National Network of Basic Stations (NNBS), both in cities and beyond them (Fig. 4.1) The downward tendencies can also be seen from long term data series of SO2 concentrations at particular EMEP stations (presented in chapter 4.1.2).
Noticeable changes in SO2 concentrations can also be seen in the most polluted regions in Poland - Upper
Silesia and so called Black Triangle. Annual mean SO2 concentrations at Czerniawa monitoring station in the Black Triangle region dropped from 48 µg/m3 in 1990 to 8 µg/m3 in 2001 (Fig. 4.2). Distinct lowering tendency of SO2 concentrations has occurred during the past few years at the whole Polish area of the Black Triangle. The improvement is a result of common actions and measures undertaken by cooperating parties: Poland, Czech and Germany as well as the considerable reduction of sulphur emission in Europe. Present state
At present SO2 does not cause problems as air pollutant in Poland. At some areas the higher concentrations may occur locally – however these are local problems, whose scale is incomparably lower than in the eighties and before.
Annual mean SO2 concentrations in urban areas (apart from Silesia Agglomeration) were usually lower than 20 µg/m3. In 2001 no exceedances of SO2 standards (daily and yearly) determined in the UE directive (1999/30/EC) and new Polish regulations were registered at urban sites of NNBS.
Concentrations of SO2 measured at NNBS stations in rural areas are much below the limit values both for health protection and ecosystem protection, determined in the UE directive and new Polish law.
0 5 10 15 20 25 30
MadridAthensKrakow
BratislavaBrussels
PragueWarsaw
Agl. GdanskPoznan
LodzLondon
ZurichVienna
WroclawBerlin
AmsterdamLisbon
CopenhagenHelsinki
Roma
SO2 concentration [µg/m3]
Fig. 4.3. Annual mean SO2 concentrations in the largest Polish and selected European cities in 2000
Fig. 4.2 Annual mean SO2 concentration trends at Czerniawa station (Black Triangle) in 1990-2001
Fig. 4.1.Changes in annual mean SO2 concentrations (averaged over the NNBS sites belonging to the groups: urban, rural, and EMEP stations-without Śnieżka) against a background of emission trends in Poland
0
10
20
30
40
50
1990
1991
1992
1993
1994
1995
1996
1997
1998
1999
2000
2001
concentration [µg/m3]
0
2
4
6
8
10
12
14
16
18
20
22
24
26
1980
1985
1990
1991
1992
1993
1994
1995
1996
1997
1998
1999
2000
2001
0
500
1000
1500
2000
2500
3000
3500
4000
4500
5000
Urban stations
Rural stations
EMEP stations
Total SO2 emissionin Poland
emission [Gg/year]concentration [µg/m3]

Contribution from: Poland
181
Poland against a background of Europe Despite a considerable improvement, concentrations of SO2 in towns of Upper Silesia (Silesia
Agglomeration) are still higher than in many other European cities. SO2 levels in other big cities in Poland (with population above 250 thousands) are not much different from measured in large European cities. Most of Polish big cities may be regarded as medium-polluted with SO2 in Europe (Fig. 4.3).
Regional background SO2 concentrations, away from inhabited areas, in Poland are close to occurring in other countries of Central Europe, particularly in Czech and Slovakia, and somewhat higher than in Western Europe. 4.1.2. Sulphur compounds in ambient air and precipitation at Polish EMEP stations
The earlier discussed changes in sulphur oxides emissions to the atmosphere have been reflected in sulphur dioxide and sulphate concentrations at Polish EMEP stations. The highest values of the mentioned parameters were observed in 1985-1988, while the lowest in the year 2000 (Fig. 4.4). During that period the annual average concentrations of S-SO2 observed in north-eastern and middle-eastern Poland decreased by about 80 % and the corresponding concentrations of S-SO4 by about 75 %. In the initial phase of measurements at Suwalki station (1979-1984) the concentrations of sulphur were lower by 40 % in average than in the period of the highest pollution level ever observed.
In the years 1976-1977 the sulphur content in precipitation in north-eastern (Suwalki) and south-western regions (Sniezka, mountain station in the Black Triangle) was comparable and amounted to ca. 2 mgS/l. Until the beginning of eighties it increased by about a dozen % or so in Suwalki area and by more than 80 % at Sniezka station. The decline in sulphur concentration started earlier in precipitation than in the air, just at the beginning of eighties. After the 20 years period the average annual concentrations in north-eastern region were lower by ca. 70 % and in south-western by ca. 80%.
A decline of sulphur load deposited with precipitation to the ground, similarly as sulphates concentrations in precipitation, began in the early eighties. Between 1980 and 2000 the wet deposition decreased by 76 % in north-eastern region and dropped by 81 % in south-western.
The monitoring results at EMEP stations indicate a decreasing tendency in air pollution with oxidized sulphur compounds in all regions under investigation. Trends of sulphate concentrations in precipitation and wet deposition of sulphur are most evident. Among the considered regions the middle-eastern Jarczew region show the most explicit trends, with declining tendency for oxidized sulphur compounds in air, precipitation and wet deposition, examined since 1985.
In 2000 the annual mean concentrations and wet deposition values where the lowest or almost the lowest in the following data series: since the end of seventies in north-eastern region, since the half of eighties in middle-
0
3
6
9
12
15
1976
1977
1978
1979
1980
1981
1982
1983
1984
1985
1986
1987
1988
1989
1990
1991
1992
1993
1994
1995
1996
1997
1998
1999
2000
0
500
1000
1500
2000
2500LebaDiabla GoraSuwalkiJarczewSniezkaemission PL
concentration [µg S-SO2/m3] emission [Gg S/year]
0
1
2
3
4
5
6
1976
1977
1978
1979
1980
1981
1982
1983
1984
1985
1986
1987
1988
1989
1990
1991
1992
1993
1994
1995
1996
1997
1998
1999
2000
LebaDiabla GoraSuwalkiJarczewSniezka
concentration [µg S-SO42-/m3]
0
1
2
3
4
5
1976
1977
1978
1979
1980
1981
1982
1983
1984
1985
1986
1987
1988
1989
1990
1991
1992
1993
1994
1995
1996
1997
1998
1999
2000
LebaDiabla GoraSuwalkiJarczewSniezka
concentration [mg S-SO42-/l]
Fig. 4.4.Annual mean concentrations of oxidized sulphur compounds in air (µgS/m3) and precipitation (mgS/l) at Polish EMEP stations.

EMEP Assessment Report – Part II
182
02468
101214161820222426
1980
1985
1990
1991
1992
1993
1994
1995
1996
1997
1998
1999
2000
2001
0
200
400
600
800
1000
1200
1400
1600
Urban stations
Rural stations
EMEP stations
Total NO2 emissionin Poland
emission [Gg/year]concentration [µg/m3]
Fig. 4.5.Changes in annual mean NO2 concentrations (averaged over the NNBS sites belonging to the groups: urban, rural, and EMEP stations-without Śnieżka) against a background of emission trends in Poland
eastern region, since 1993 and 1994 in northern (sea-side) region and, in south-western region (Sudety Mountains) since 1981 in precipitation and since 1991 in air.
Dominating directions of air inflow in Poland in 1985-2000 were W, NW and SW. Sulphur content in air masses coming from these specific sectors (as well as from N) shows a declining tendency for SO2 and sulphate in aerosol in all regions.
Annual average concentrations of oxidised sulphur compounds measured at Polish EMEP stations in 2000
amounted to: for sulphur dioxide 1.0-2.2 µgS/m3, sulphate in aerosol 0.7-1.6 µgS/m3, sulphate in precipitation 0.6-0.8 mgS/l and wet deposition 0.3-0.7 gS/m2year. In comparison with the background concentrations in other European countries the Polish data are medium or high.
The SO2 concentrations at EMEP sites in Poland in 2000 accounted for 4-11% (for Jarczew and Diabla Gora respectively) of the limit value for ecosystem protection according to the new Polish and the UE standards. During the whole period of measurements at Polish EMEP sites (table 2.1) the highest yearly mean concentration was in Jarczew in 1985 (the first year of measurements at the site) and accounted for 50% of the present limit value. Wet sulphur deposition of 0.5 gS/m2/year in 2000 was exceeded only at Sniezka station (by 40%). 4.2. Nitrogen compounds 4.2.1. Nitrogen dioxide
Trends Downward trend in NO2
emission in Poland is less pronounced than for SO2. Concentration changes of NO2 in ambient air over the years are also smaller. However, in comparison with the eighties, a distinct improvement in air quality with regard to NO2 has taken place, both in urban and rural areas. The positive changes can be seen, among others, from long-term measurements carried out since the eighties at some EMEP stations in Poland (discussed in chapter 4.2.2).
Fig. 4.5 illustrates annual mean NO2 concentrations at urban, rural, and EMEP stations (average values for the NNBS sites belonging to the particular groups) in 1993-2001 against a background of long-term emission trends in Poland. It is
worth to notice the NO2 concentration decrease in the period of 1996-98, accompanying the considerable NO2 emission reduction in Poland at that time (mainly from energy sector). Present state
Measurements carried out at the National Network of Basic Stations show that in 2001 at more than half of urban monitoring sites, located beyond a direct influence of road traffic, annual mean NO2 concentrations were lower than 20 µg/m3, i.e. half of the annual limit value for health protection according to the UE directive (1999/30/EC) and new Polish air quality standards. Since a few years no exceedances of the limit values for annual NO2 concentrations have been stated at the NNBS stations. In the vicinity of streets wit intensive traffic, NO2 concentrations are usually higher and exceedances of the limit values may occur.
Due to traffic emissions, NO2 concentrations in urban areas are usually higher
0 5 10 15 20 25 30 35 40 45 50
London
Roma
Madrid
Amsterdam
KrakowBrussels
Lodz
Zurich
Prague
Vienna
BratislavaWroclaw
Poznan
CopenhagenLisbon
Agl. GdanskBerlin
Warsaw
NO2 concentration [µg/m3]
Fig. 4.6.Annual mean NO2 concentrations in the largest Polish and selected European cities in 2000 (Averaged values from non traffic stations).

Contribution from: Poland
183
than in the rural ones. NO2 concentrations in rural areas since a few years are much lower than the limit values (UE and Polish) regarding both health and ecosystem protection. Even at the areas of Upper Silesia and the Black Triangle, regarded as most polluted in Poland, NO2 rural concentrations during the past few years have been much below the considered limit values
Poland against a background of Europe
Air pollution by NO2 in Polish cities is at present less serious problem than in many other European cities (Fig. 4.6). The main reason for this is much higher contribution of road transport to NOx emissions in the UE countries and climatic conditions in some of them. Regional background NO2 concentrations in Poland are on the medium level compared to other European countries. 4.2.2. Nitrogen compounds in ambient air and precipitation at Polish EMEP stations Oxidised nitrogen compounds
Dynamics of changes in annual mean concentrations of oxidized nitrogen compounds in ambient air and precipitation (Fig. 4.7) and their wet deposition monitored at EMEP stations in Poland is weaker than observed for sulphur compounds (Fig. 4.4). However, decreasing tendencies have been recorded at the stations.
In the end of nineties, annual mean concentrations of nitrogen dioxide NO2 and nitrates in air were by about 35% lower than in the second half of eighties. Declining tendency of the concentrations in this period is clearly seen at Jarczew site with long term data series. It is also confirmed by joint data series from two stations located in north-eastern Poland: Suwalki and Diabla Gora.
Since around 1994 only slight changes have been observed at all Polish EMEP stations. In the last two years considered, the concentrations of oxidized nitrogen increased at some stations.
Annual concentration roses for NO2, different to SO2, are balanced – in different regions where EMEP stations are located the NO2 concentrations were not much different, independently of air mass inflow direction. Only at the sea-side station Leba, the air inflow from land, particularly from S and SW directions, resulted in higher NO2 concentrations. At all EMEP stations, independently of time period, mass inflow from south sector was accompanied by increased nitrates content in air.
Precipitation monitoring data from stations Suwalki and Jarczew show that the lowering tendency of nitrates content in precipitation started from 1986, and after fifteen years resulted in drop by 30% and 40% respectively at the mentioned stations. At the mountain station Sniezka, the nitrate concentrations show noticeable inter-annual variations with no clear trend - however during the past two decades a slight decrease
0.0
0.5
1.0
1.5
2.0
1976
1977
1978
1979
1980
1981
1982
1983
1984
1985
1986
1987
1988
1989
1990
1991
1992
1993
1994
1995
1996
1997
1998
1999
2000
LebaSuwalkiJarczewSniezka
concentration [µg N-NO3-/m3]
0
2
4
6
8
10
1976
1977
1978
1979
1980
1981
1982
1983
1984
1985
1986
1987
1988
1989
1990
1991
1992
1993
1994
1995
1996
1997
1998
1999
2000
0
100
200
300
400
500
LebaDiabla GoraSuwalkiJarczewSniezkaemission PL
concentration [µg N-NO2/m3] emission [Gg N/year]
0.0
0.5
1.0
1.5
1976
1977
1978
1979
1980
1981
1982
1983
1984
1985
1986
1987
1988
1989
1990
1991
1992
1993
1994
1995
1996
1997
1998
1999
2000
LebaDiabla GoraSuwalkiJarczewSniezka
concentration [mg N-NO3-/l]
Fig. 4.7. Annual mean concentrations of oxidized nitrogen compounds in air (µgN/m3) and precipitation (mgN/l) at Polish EMEP stations.

EMEP Assessment Report – Part II
184 tendency can be seen. In the nineties, differences in the nitrates level between the stations located in lowlands and the mountain station Sniezka increased, opposite to sulphate concentrations in precipitation.
Nitrate load deposited to the ground with precipitation in the lowland regions of Poland for over 20 years was about 0.3-0.4 Mg N/km2year. In the upper part of Sudety Mountains it was about 1.0 Mg N/km2year on the average.
In comparison with other EMEP stations, annual average NO2 concentrations at Polish stations in northern and south-western Poland (about 1.0-1.7 µgN/m3 in 2000) were close to observed at other EMEP sites in Central Europe. North-eastern part of Poland belonged to areas of low NO2 level, while middle-eastern with concentrations of 3.0 µgN/m3 – represented background pollution level typical of Western Europe.
Average nitrate concentrations in precipitation at Polish lowland EMEP stations were around 0.5 mgN/l and were close to measured at other EMEP stations in Central Europe. At the mountain station Sniezka the concentrations of about 1.1 mgN/l were among the highest in Europe.
In relation to the actual Polish ambient air quality standards, annual mean NO2 concentrations in 2000 at
EMEP station in middle-eastern part of Poland accounted for 25% of the limit value for ecosystem protection (established for NOx), at the remaining areas where EMEP stations are located – for 7-14%. At the stations operated in 1985, Suwalki and Jarczew, the concentrations accounted for 37% and 43% of the limit value respectively. Ammonium ions
Intensity and character of changes of annual mean concentrations of ammonium ions in air and precipitation (Fig. 4.8) and their wet deposition are similar to observed for oxidized sulphur compounds (Fig. 4.4).
Declining tendencies have occurred for ammonium ion concentrations in air and precipitation as well as
for the sum of ammonium and ammonia (measured since 1992). In the period of 1985-2000 annual mean ammonium ion concentrations decreased in air by around 75%. In precipitation it decreased by 60-70% in eastern regions and by about 75% in south-western. Wet deposition of reduced nitrogen in 2000 accounted for 35% of its value of 1985 in the east and only 23% at Sniezka station.
Long time data series show the highest concentrations of ammonium ions in air at Jarczew station, located at typical agriculture region. The highest content of reduced nitrogen in precipitation in majority of years was found at Sniezka station – where the annual mean wet deposition in 1985-2000 was 1.1 Mg/km2year (at other EMEP sites in Poland it was around 0.5 Mg/km2year).
Annual average concentrations of ammonium ions at Polish EMEP stations in 2000 amounted to: in aerosol 0.58-1.57 µgN/m3, in air 0.87-2.38 µgN/m3, in precipitation 0,46-0,72 mg/l. Wet deposition of reduced nitrogen ranged from 0.30 to 0.47 Mg/km2year. 4.3. Acidity of precipitation
Changes in annual mean pH values at Polish EMEP stations are shown in Fig. 4.9. Since mid eighties till the end of nineties the precipitation acidity decreased by 2.5 times in middle-eastern Poland and by 3 times at Sniezka station. Average pH value changed from below 4.0 to around 4.4 at Sniezka and from 4.1-4.5 in eastern Poland to around 4.6. In north-eastern region the long term trends show weaker but favourable tendencies.
0
1
2
3
4
5
6
1976
1977
1978
1979
1980
1981
1982
1983
1984
1985
1986
1987
1988
1989
1990
1991
1992
1993
1994
1995
1996
1997
1998
1999
2000
Leba
Suwalki
Jarczew
Sniezka
concentration [µg N-NH4+/m3]
0
1
2
3
1976
1977
1978
1979
1980
1981
1982
1983
1984
1985
1986
1987
1988
1989
1990
1991
1992
1993
1994
1995
1996
1997
1998
1999
2000
LebaDiabla GoraSuwalkiJarczewSniezka
concentration [mg N-NH4+/l]
Fig .4.8. Annual mean concentrations of ammonium ions in air (µgN/m3) and precipitation (mgN/l) at Polish EMEP stations

Contribution from: Poland
185
Wet deposition of hydrogen ions show significant changes with downward tendency only at mountainous region of south-western Poland (Sniezka station at Black Triangle area). Hydrogen load dropped from around 140 mg/m2 in 1981 to ca. 40 mg/m2 in 2000 (since 1990 it was below 60 mg/m2, except for 1995). In other regions the wet deposition approximated to 20 mg/m2 with some inter-annual changes.
In 2000 the values of pH in precipitation at Polish EMEP stations were about 4.5 at Diabla Gora and Sniezka and 4.6 at Jarczew and Leba. Wet deposition of hydrogen ions was around 13 mg/m2 in middle-east-eastern and northern regions, about 20 mg/m2 in north-eastern and 36 mg/m2 at mountain station Sniezka.
4.4. Ozone
Ozone data series in Poland are much shorter than for sulphur and nitrogen compounds. Ozone monitoring at Polish EMEP stations started in 1996, and at the stations belonging to NNBS in 1994.
Very high ozone concentrations are not detected in Poland. However every year a few or a dozen or so episodes are observed, lasting for a few days, when higher ozone concentrations occur at the same time at rather large area. Increased ozone concentrations usually happen from April till August. Under conditions conducive to ozone formation, an exceedance of information threshold of 180 µg/m3 (determined in the UE directives and in the new Polish regulations) may occur. In 2001 two cases of the exceedance were recorded, both in south-western Poland (not at EMEP station). No exceedances of alarm threshold (240 µg/m3) were detected.
High ozone concentrations, above the information level (180 µg/m3), occur in Poland less frequently than in most countries in Central and Southern Europe, and more frequently than in Northern Europe. Concentration levels in the
biggest cities in Poland are comparable with detected in cities of Western and Central Europe and lower than in Southern Europe (Fig. 4.10).
Fig. 4.11 shows
AOT40 and AOT60 values averaged for all EMEP sites in a country, (calculated according to EMEP method). Average AOT in Poland is lower than in Austria, Czech Republic and Switzerland, much lower than in Southern Europe: Greece, Malta, Slovenia and
0
5000
10000
15000
20000
25000
30000
35000
40000
45000
50000
Aus
tria
Belg
ium
Switz
erla
nd
Cze
ch R
epub
lic
Ger
man
y
Den
mar
k
Est
onia
Spai
n
Finl
and
Fran
ce
Uni
ted
King
dom
Gre
ece
Hun
gary
Irela
nd
Italy
Latv
ia
Mal
ta
Net
herla
nds
Nor
way
Pola
nd
Por
tuga
l
Rus
sian
Fed
erat
ion
Swed
en
Slov
enia
Slo
vaki
a
AOT40AOT40 correctedAOT60AOT60 corrected
AOT concentration [µg/m3*h]
Fig. 4.11 Average AOT values (April-September 2000) based on EMEP monitoring data (Data source: EMEP/CCC)
3.0
3.5
4.0
4.5
5.019
7619
7719
7819
7919
8019
8119
8219
8319
8419
8519
8619
8719
8819
8919
9019
9119
9219
9319
9419
9519
9619
9719
9819
9920
00
LebaSuwalki + Diabla GoraJarczewSniezka
unit [pH]
Fig .4.9. Annual mean pH values at Polish EMEP stations
Fig. .4.10. The 99.9th percentile of 1-hr ozone concentrations at urban background stations in 2000 (based on Airbase data).
0 50 100 150 200 250 300
Athens
Roma
Berlin
Prague
Bratislava
Zurich
Katowice
Lubljana
Vienna
Warsaw
Amsterdam
Gdynia
London
Krakow
Gdansk
Stockholm
O3 concentration [µg/m3]

EMEP Assessment Report – Part II
186 higher than in Western Europe and Scandinavian countries.
Annual pattern of ozone concentrations and frequency of occurrence of high concentrations, above or close to the threshold values, differ considerably from year to year, mainly due to variations of the meteorological parameters determining ozone formation and depletion in the atmosphere. Thus it is difficult to find a definite tendency of changes in high concentrations. It seems, however, that over the 6 years considered (1996-2001) some decline in maximum concentrations and their frequencies can be seen (Fig. 4.12). The lowering trend is not explicit. Opposite, increasing trends, also very slightly outlined, can be seen in case of annual mean ozone concentrations in Poland.
5. Transboundary transport of sulphur and nitrogen compounds in the light of EMEP modelling results
In terms of transboundary transport of air pollutants, EMEP modelling results are the main source of information on pollutant fluxes transported over long range in Europe. For many countries EMEP calculations are the only source of information on transboundary exchange of pollutants. The modelling results of transboundary transport of oxidized sulphur, oxidized nitrogen and reduced nitrogen obtained from EMEP MSC-W models for Poland show that in the total budget of mass of air pollutants transported across Polish borders, both import and export of the pollutants constitute a significant amount in comparison with the national emissions. Sulphur
According to EMEP modelling results, in 1998 around 640 ktonnes of sulphur (in form of oxidized sulphur compounds) was deposited in Poland. About 360 ktonnes (56%) originated from domestic emission sources and about 280 ktonnes (44%) – from other countries. At the same time, considerable amount of oxidized sulphur emitted in Poland moved out across the borders or to the free troposphere. Out of 950 ktonnes of emitted sulphur, about 38% was deposited in Poland. The remaining 62% was exported beyond the country. Oxidized nitrogen
Oxidized nitrogen deposition calculations show that in 1998 about 240 ktonnes of nitrogen deposited at Polish territory. Only 84 ktonnes (35%) originated from domestic sources and as much as 156 ktonnes (65%) from external sources. On the other hand, out of the national emission of oxidized nitrogen amounting to 302 ktonnes (as N) only 28% was deposited in the country, while 72% was transported with air masses outside Poland (to other countries or to the free troposphere). Reduced nitrogen
According to deposition estimations of reduced nitrogen, in 1998 about 276 ktonnes (as N) was deposited in Poland. In comparison with sulphur and oxidized nitrogen, the share of national emission sources in reduced nitrogen deposition was larger - they accounted for 67% (186 ktonnes). The remaining 33% (90 ktonnes) of reduced nitrogen originated from outside sources. Comparison of emission of reduced nitrogen (305 ktonnes as N) with the deposited amount shows that 61% of emitted compounds remained in Poland. About 39% was transmitted across borders and deposited in other countries or moved to free troposphere. It can be seen that deposition of reduced nitrogen is much more connected with its emission from nearby sources and the transboundary transport’s role is weaker than for sulphur and oxidized nitrogen.
As can be seen from EMEP calculations, since many years Poland has held the position of a net-exporter (the
country whose export of the considered sulphur and nitrogen compounds is bigger than their import). The largest amounts of sulphur and nitrogen compounds imported to Poland in 1998 originated first of all
from Germany and Czech Republic and also from Ukraine (reduced nitrogen).The pollutants exported from Poland were transmitted mainly to Russia, Ukraine and Belarus as well as to Scandinavian countries Fig. 5.1-5.2
Similar pattern of exchange (export and import) of pollutants between Poland and the neighbouring countries was obtained from EMEP calculations for the preceding years. The pattern, showing the directions of transboundary pollutant fluxes over Poland, results from domination of westerly and south-westerly winds in Central Europe.
The amounts of sulphur and nitrogen deposited in Poland due to transboundary transport (inflow) and emissions from internal sources, calculated for succeeding years, sometimes show substantial differences. The differences undoubtedly result from significant reductions in SO2 emissions in some countries (particularly Germany and Ukraine as well as in Czech Republic and Russia) and from inter-annual variability of meteorological parameters. Not less crucial are in this case the changes in EMEP models, introduced after 1996, and transition from Lagrangian to Eulerian model, aimed at improvement of assessment of transboundary air pollution.
0
20
40
60
80
100
120
140
160
180
200
1996
1997
1998
1999
2000
2001
Urban stations
Rural stationsEMEP stations
concentration [µg/m3]
Fig. 4.12 The 99.9th percentile of 1-hr ozone concentrations averaged over each group of NNBS stations

Contribution from: Poland
187
According to EMEP estimations, in the period of 1980-1998 a significant decrease in sulphur deposition in
Poland occurred. Total deposition of sulphur compounds was reduced twice, in this the deposition from external sources (import) decreased by above 60% (in relation to the year 1980) and the deposition from domestic sources dropped by about 40%. Sulphur emission reduction in Poland over the considered period was above 60% (see chapter 3).
Deposition of oxidized and reduced nitrogen in Poland, according to EMEP modelling results, did not change considerably between 1980 and 1998 (decreased by a few percent). The changes in calculated depositions are evidently smaller than in NOx and NH3 emissions in Poland over that period. 6. Concluding remarks on air quality in Poland
Substantial reduction of air pollutant emissions over the past two decades has evidently resulted in general improvement of air quality in Poland. Dynamics of the observed changes in air pollution concentrations is however differentiated – depending on pollutants and areas.
Distinct concentration reductions occurred in case of SO2 - both in urban areas and beyond them. Particularly favourable changes took place at areas belonging to most polluted in Poland – Upper Silesia and the Black Triangle. In the latter case, the improvement was a result of SO2 emission reduction not only in Poland but also in Germany and Czech Republic.
Present state of ambient air quality in Poland may be qualified as good. Air pollution monitoring carried out under the State Environmental Monitoring Programme shows that SO2, NO2 and CO concentrations have been rather low during a few recent years. Exceedances of the limit values have not been detected or have occurred rarely. In the latter case, their appearance is local and limited to areas directly influenced by emission sources (e.g. nearby city street canyons with intensive traffic).
Despite considerable emission reduction and visible concentration decline, particulate matter in ambient air still remains a problem. Concentrations of PM10 are still high and rather frequently exceed limit values, particularly in urban areas. Another pollutant whose concentrations frequently reach high values in Poland is ozone. Both of the pollutants still create significant, unsolved problems in many other European countries.
References and data sources
1. G. Mitosek: Executions of the Convention on long range transboundary air pollution commitments on the EMEP Programme- coordination and supervision. Report for 2002. IOŚ, Warszawa 2003
2. Olendrzyński K., Fudała J., Hławiczka S., Cenowski M, KachniarzM., Kargulewicz I., Dębski D., Skośkiewicz J.: Emission Inventory of SO2, NO2, NH3, CO, PM, HMs, NMVOCs and POPs in Poland in 2000. UN ECE - EMEP/Poland-Report /2002. IOŚ 2002
3. Skotak K., Iwanek J., Mitosek G., Prządka Z.: Zanieczyszczenie powietrza w Polsce w 2001 roku na podstawie pomiarów krajowej sieci stacji podstawowych (Air pollution in Poland in 2001 in the light of
Deposition of oxidised sulphurfrom internal sources
3 6 3 . 6
Germany
Slovakia
Ukraine
Belarus
LithuaniaRussianFederation
Scandinavian countries( Norway, Sweden)Finland,
57.3
37.3
80.4
9.9
93.9
21.2
109.4
27.7 2.0
0.8
8.617.7
2.1
2.2
Czech Republic28.9
39.2
Fig. 5.1. Deposition of oxidised sulphur [103t(S)/year] resulting from emission in Poland and imported to Poland, according to EMEP calculations for 1998 (based on Eulerian Acid model).
8 3 . 9
3.09.6
2.2
26.40.8
7.0
1.9
25.3
4.3 5.7
22.0
5.6
1.1
16.9
8.0
50.2
Scandinavian countries( Norway, Sweden)Finland,
Germany
Slovakia
Ukraine
Belarus
LithuaniaRussianFederation
Czech Republic
Deposition of oxidised nitrogenfrom internal sources
Fig. .5.2. Deposition of oxidised nitrogen compounds [103t(N)/year] resulting from emission in Poland and imported to Poland, according to EMEP calculations for 1998 (based on Eulerian Acid model).

EMEP Assessment Report – Part II
188 monitoring data from National Network of Basic Stations). IOŚ/PIOŚ, Biblioteka Monitoringu Środowiska BMŚ, Warszawa 2002
4. Degórska A., Prządka Z., Śnieżek T.: Monitoring tła zanieczyszczenia atmosfery na Stacji Puszcza Borecka – raport roczny 2000 (Background air pollution monitoring at Puszcza Borecka-Diabla Gora – annual report 2000). IOŚ, Warszawa 2001
5. Przybylska G.: Monitoring tła zanieczyszczenia atmosfery w Polsce – raport roczny 2000 (Background air pollution monitoring in Poland. Annual Rep. 2000). IMGW, Warszawa 2001
6. Mitosek G., Skotak K., Iwanek J., Siwek U., Prządka Z.: Ocena stanu zanieczyszczenia powietrza w Polsce w 1998 roku na podstawie pomiarów w sieci podstawowej (Evaluation of air pollution in Poland in 1998 based on monitoring data from NNBS). IOS/PIOŚ, Biblioteka Monitoringu Środowiska, Warszawa 1999.
7. G. Mitosek, K. Skotak, J. Iwanek: Assessment of Air Quality in Poland in the Light of the European Union Standards. IOS/ PIOŚ, BMŚ, Warszawa 1998
8. G.Mitosek: Transgraniczne przenoszenie zanieczyszczeń powietrza w świetle badań EMEP (Transboundary transport of air pollutants in the light of EMEP estimates); ss. 80-100 w: Praca zespołowa: Zanieczyszczenie powietrza w Polsce w 1995 roku. Wyd. PIOŚ, BMŚ, Warszawa 1997.
9. G. Mitosek, Z. Bednarek, Z. Prządka, U. Siwek: Raport o stężeniach zanieczyszczeń powietrza w Polsce w 1993 roku na podstawie pomiarów w sieci podstawowej (Report on air pollutant concentrations in Poland in 1993 based on monitoring results from NNBS). IOŚ/PIOŚ, BMŚ, Warszawa 1994.
Data sources − Monitoring data from the National Network of Basic Stations NNBS for 1993-2001, collected in the
Central Database of NNBS in the Institute of Environmental Protection IEP in Warsaw. (The network, supervised by the Institute, is a part of the State Environmental Monitoring Programme, coordinated by the Chief Inspectorate for Environmental Protection CIEP)
− Regional air quality monitoring data, prepared by WIOS for preliminary air quality assessment in 2001, collected in database in the Institute of Environmental Protection in Warsaw (under contract with CIEP)
− EMEP data and reports: http://www.emep.int − Database of European Environmental Agency EEA: http://eea.eu.int