Contrails, Cirrus Trends, and Climate - NASA · 15 APRIL 2004 MINNIS ET AL. 1671 q 2004 American...
15
15 APRIL 2004 1671 MINNIS ET AL. q 2004 American Meteorological Society Contrails, Cirrus Trends, and Climate PATRICK MINNIS Atmospheric Sciences, NASA Langley Research Center, Hampton, Virginia J. KIRK AYERS,RABINDRA PALIKONDA, AND DUNG PHAN Analytical Services and Materials, Inc., Hampton, Virginia (Manuscript received 3 July 2003, in final form 28 October 2003) ABSTRACT Rising global air traffic and its associated contrails have the potential for affecting climate via radiative forcing. Current estimates of contrail climate effects are based on coverage by linear contrails that do not account for spreading and, therefore, represent the minimum impact. The maximum radiative impact is estimated by assuming that long-term trends in cirrus coverage are due entirely to air traffic in areas where humidity is relatively constant. Surface observations from 1971 to 1995 show that cirrus increased significantly over the northern oceans and the United States while decreasing over other land areas except over western Europe where cirrus coverage was relatively constant. The surface observations are consistent with satellite-derived trends over most areas. Land cirrus trends are positively correlated with upper-tropospheric (300 hPa) humidity (UTH), derived from the National Centers for Environmental Prediction (NCEP) analyses, except over the United States and western Europe where air traffic is heaviest. Over oceans, the cirrus trends are negatively correlated with the NCEP relative humidity suggesting some large uncertainties in the maritime UTH. The NCEP UTH decreased dramatically over Europe while remaining relatively steady over the United States, thereby permitting an as- sessment of the cirrus–contrail relationship over the United States. Seasonal cirrus changes over the United States are generally consistent with the annual cycle of contrail coverage and frequency lending additional evidence to the role of contrails in the observed trend. It is concluded that the U.S. cirrus trends are most likely due to air traffic. The cirrus increase is a factor of 1.8 greater than that expected from current estimates of linear contrail coverage suggesting that a spreading factor of the same magnitude can be used to estimate the maximum effect of the contrails. From the U.S. results and using mean contrail optical depths of 0.15 and 0.25, the maximum contrail–cirrus global radiative forcing is estimated to be 0.006–0.025 W m 22 depending on the radiative forcing model. Using results from a general circulation model simulation of contrails, the cirrus trends over the United States are estimated to cause a tropospheric warming of 0.28–0.38C decade 21 , a range that includes the observed tropospheric temperature trend of 0.278C decade 21 between 1975 and 1994. The magnitude of the estimated surface temperature change and the seasonal variations of the estimated temperature trends are also in good agreement with the corresponding observations. 1. Introduction Condensation trails, or contrails, generated from high-altitude aircraft exhaust may affect climate because they can persist for many hours. Like their natural coun- terparts, these anthropogenic cirrus clouds reflect solar radiation and absorb and emit thermal infrared radiation causing a radiative forcing that depends on many fac- tors, especially contrail optical depth and coverage (Sas- sen 1997; Meerko ¨tter et al. 1999). Cloud radiative forc- ings are balanced by changes in variables such as surface and atmospheric temperatures, cloud cover, and precip- itation (Hansen et al. 1997). Instantaneously, contrail radiative forcing can warm the atmosphere and warm Corresponding author address: Dr. Patrick Minnis, NASA Langley Research Center, MS 420, Hampton, VA 23681. E-mail: [email protected] or cool the earth’s surface, apparently reducing the di- urnal range of surface temperature (Travis et al. 2002). Although highly variable and uncertain, this forcing is generally positive when averaged over time (Minnis et al. 1999; Ponater et al. 2002; Meyer et al. 2002), re- sulting in a net warming of the troposphere and surface (Rind et al. 2000). The expected 2%–5% per annum growth (Penner et al. 1999) of worldwide jet air traffic through 2050 necessitates a more accurate assessment of contrail climate effects. Current estimates of contrail radiative forcing only consider linear contrails young enough to be differen- tiated from natural cirrus clouds in satellite images. Those diagnoses of radiative forcing represent the min- imum impact because they do not include the additional cloud cover resulting from the spread of aging linear contrails into natural-looking cirrus clouds (Minnis et al. 1998; Duda et al. 2001) and from any other cirrus
-
Upload
truongmien -
Category
Documents
-
view
217 -
download
0
Transcript of Contrails, Cirrus Trends, and Climate - NASA · 15 APRIL 2004 MINNIS ET AL. 1671 q 2004 American...

15 APRIL 2004 1671M I N N I S E T A L .
q 2004 American Meteorological Society
Contrails, Cirrus Trends, and Climate
PATRICK MINNIS
Atmospheric Sciences, NASA Langley Research Center, Hampton, Virginia
J. KIRK AYERS, RABINDRA PALIKONDA, AND DUNG PHAN
Analytical Services and Materials, Inc., Hampton, Virginia
(Manuscript received 3 July 2003, in final form 28 October 2003)
ABSTRACT
Rising global air traffic and its associated contrails have the potential for affecting climate via radiative forcing.Current estimates of contrail climate effects are based on coverage by linear contrails that do not account forspreading and, therefore, represent the minimum impact. The maximum radiative impact is estimated by assumingthat long-term trends in cirrus coverage are due entirely to air traffic in areas where humidity is relativelyconstant. Surface observations from 1971 to 1995 show that cirrus increased significantly over the northernoceans and the United States while decreasing over other land areas except over western Europe where cirruscoverage was relatively constant. The surface observations are consistent with satellite-derived trends over mostareas. Land cirrus trends are positively correlated with upper-tropospheric (300 hPa) humidity (UTH), derivedfrom the National Centers for Environmental Prediction (NCEP) analyses, except over the United States andwestern Europe where air traffic is heaviest. Over oceans, the cirrus trends are negatively correlated with theNCEP relative humidity suggesting some large uncertainties in the maritime UTH. The NCEP UTH decreaseddramatically over Europe while remaining relatively steady over the United States, thereby permitting an as-sessment of the cirrus–contrail relationship over the United States. Seasonal cirrus changes over the UnitedStates are generally consistent with the annual cycle of contrail coverage and frequency lending additionalevidence to the role of contrails in the observed trend. It is concluded that the U.S. cirrus trends are most likelydue to air traffic. The cirrus increase is a factor of 1.8 greater than that expected from current estimates of linearcontrail coverage suggesting that a spreading factor of the same magnitude can be used to estimate the maximumeffect of the contrails. From the U.S. results and using mean contrail optical depths of 0.15 and 0.25, themaximum contrail–cirrus global radiative forcing is estimated to be 0.006–0.025 W m22 depending on theradiative forcing model. Using results from a general circulation model simulation of contrails, the cirrus trendsover the United States are estimated to cause a tropospheric warming of 0.28–0.38C decade21, a range thatincludes the observed tropospheric temperature trend of 0.278C decade21 between 1975 and 1994. The magnitudeof the estimated surface temperature change and the seasonal variations of the estimated temperature trends arealso in good agreement with the corresponding observations.
1. Introduction
Condensation trails, or contrails, generated fromhigh-altitude aircraft exhaust may affect climate becausethey can persist for many hours. Like their natural coun-terparts, these anthropogenic cirrus clouds reflect solarradiation and absorb and emit thermal infrared radiationcausing a radiative forcing that depends on many fac-tors, especially contrail optical depth and coverage (Sas-sen 1997; Meerkotter et al. 1999). Cloud radiative forc-ings are balanced by changes in variables such as surfaceand atmospheric temperatures, cloud cover, and precip-itation (Hansen et al. 1997). Instantaneously, contrailradiative forcing can warm the atmosphere and warm
Corresponding author address: Dr. Patrick Minnis, NASA LangleyResearch Center, MS 420, Hampton, VA 23681.E-mail: [email protected]
or cool the earth’s surface, apparently reducing the di-urnal range of surface temperature (Travis et al. 2002).Although highly variable and uncertain, this forcing isgenerally positive when averaged over time (Minnis etal. 1999; Ponater et al. 2002; Meyer et al. 2002), re-sulting in a net warming of the troposphere and surface(Rind et al. 2000). The expected 2%–5% per annumgrowth (Penner et al. 1999) of worldwide jet air trafficthrough 2050 necessitates a more accurate assessmentof contrail climate effects.
Current estimates of contrail radiative forcing onlyconsider linear contrails young enough to be differen-tiated from natural cirrus clouds in satellite images.Those diagnoses of radiative forcing represent the min-imum impact because they do not include the additionalcloud cover resulting from the spread of aging linearcontrails into natural-looking cirrus clouds (Minnis etal. 1998; Duda et al. 2001) and from any other cirrus

1672 VOLUME 17J O U R N A L O F C L I M A T E
FIG. 1. Hypothetical annual relative humidity probability distri-bution at flight altitudes with T 5 2508C. Neither persistent contrailsnor cirrus clouds would occur for Rhi , 100% (area A). Cirrus cloudsand persistent contrails can form when Rhi . 100%, but the prob-ability of forming cirrus through natural nucleation processes in-creases as humidity rises (area C) leaving the potential for devel-opment of additional cirrus coverage from contrails (area B) via nu-cleation from mixing of moist jet engine exhaust with ice-saturatedambient air. The portion of area B that is converted from clear air tocloudy air should rise as the cumulative flight path length increasesover a given area with growing air traffic. Areas B and C correspondto Rh between 60% and 100%.
clouds initiated by aerosols generated from aircraft ex-haust (Jensen and Toon 1994). To reduce the uncertaintyin the climatic effects of aircraft-induced cirrus clouds,it is necessary to determine the maximum change incirrus coverage due to the combination of linear con-trails and the cirrus clouds derived from them and fromexhaust aerosols (Penner et al. 1999). The ratio of thatcombination to the linear contrail coverage is denotedas the spreading factor f s.
Increases in cirrus coverage or decreased sunshinehave been linked to jet air traffic over parts of the con-tiguous United States (see Changnon 1981; Sassen1997) and Alaska (Nakanishi et al. 2001) for manyyears. Trends in regional cirrus frequency of occurrenceare strongly correlated with high-altitude airplane fuelconsumption between 1982 and 1991 (Boucher 1999).Previous studies confirm the expected outcome of in-creased air traffic, but are limited to small regions or totime periods too short for minimizing the impact of the11-yr cycle in cloud cover (Udelhofen and Cess 2001).In this study, a 25-yr surface observation dataset is usedto examine the longer-term global trends in cirrusamounts, relate them to the expected contrail coverageto estimate f s, and then compute the maximum regionalcontrail-induced radiative forcing and regional temper-ature changes.
2. Background
Contrails occupy a fairly special niche in atmosphericthermodynamics because they form and produce iceclouds at ambient relative humidities that are less thanthose required for most natural cirrus cloud formation(Gierens et al. 1999). The presence of cirrus or persistentcontrails depends on many factors such as temperatureT, humidity, vertical velocity, and cloud condensationand freezing nuclei. The primary variable, however, isrelative humidity. The complex dynamical processes ini-tiating cirrus formation ultimately must produce the nec-essary water vapor. The most familiar moisture variable,relative humidity with respect to liquid water (Rh), ismeasured with radiosonde-borne hygrometers and usedin weather analyses. For cirrus processes, the relativehumidity with respect to ice (Rhi) is the relevant quan-tity. It exceeds Rh for a given specific humidity at T ,08C. For T , 2398C, Rh . 100% typically correspondsto Rhi . 150%. Although cirrus clouds form naturallythrough heterogeneous or homogeneous nucleation atlow temperatures when the ambient Rhi is around140%–160% (Sassen and Dodd 1989), or less when theair contains many nucleation aerosols (Strom et al.2003), they will persist as long as Rhi exceeds 100%.Contrails can form and develop into cirrus clouds whenT , 2398C and Rhi . 100% because, in many instanc-es, aircraft exhaust temporarily raises the local Rh above100% as it mixes with the ambient air causing nucleationof liquid droplets that freeze instantly. Therefore, con-trails can add to the natural cirrus coverage when
T , 2398C and Rhi . 100% and no natural cirrus cloudis already present (Fig. 1). If Rhi , 100%, contrails canform but will not persist.
At flight altitudes, conditions that can support con-trail-generated cirrus clouds exist 10%–20% of the timein clear air and within existing cirrus (Gierens et al.1999; Jensen et al. 2001). Additionally, cirrus may format lower supersaturations on aerosols derived from jetaircraft than on aerosols from natural sources (Jensenand Toon 1994). Therefore, high-altitude air traffic hasthe potential for increasing cirrus coverage and thick-ening existing cirrus clouds by generating additional icecrystals. If other relevant variables are steady over time,then cirrus coverage should increase where air traffic issignificant.
3. Data
The surface-based cloud data consist of quality-con-trolled surface synoptic weather reports from land sta-tions and ships filtered by Hahn and Warren (1999).Reports from automated weather stations and those withobvious errors and inconsistencies were eliminated fromthe dataset. The filtered observations include amountsfor low, middle, and high clouds as well as associatedweather conditions, solar zenith angle, and relative lunarilluminance. Values of frequency of occurrence,amount-when-present, and total cloud amount were cal-culated using the methods outlined in Hahn and Warren(1999). The cirrus amount is calculated by multiplying

15 APRIL 2004 1673M I N N I S E T A L .
TABLE 1. Boundaries of the air traffic regions (ATR). Land–otherregions (LOR) and Ocean–other regions (OOR) consist of any landor ocean area that is not contained in any of the other land or oceanATRs, respectively.
ATR Latitude Longitude
Western Asia (WASIA)Europe (EUR)Western Europe (WEUR)United States of America (USA)Land–other regions (LOR)North Atlantic (NA)North Pacific (NP)Ocean–other regions (OOR)
358–708N358–708N408–608N308–508N708S–708N358–708N358–708N708S–708N
908E–1808308W–408E108W–158E508–1308W1808708W–208E1208E–1108W1808
amount-when-present by frequency of occurrence, acomputation that implicitly assumes that the clouds arerandomly overlapped. Annual and seasonal mean cirrusand total cloud amounts were calculated over land andocean regions between 1971 and 1995. The originalsurface-based cloud dataset includes 1996. However, thenumber of surface stations in the United States graduallydeclined from 225 in 1971 to 110 in 1995. It droppedto 20 in 1996, drastically affecting the sampling pat-terns. Thus, only data prior to 1995 were used here toensure that the data were a fair representation of thecountry as a whole.
Data from multiple stations within a single grid-boxfor a given month were averaged first for each site andthen with the means from the other stations to yield amonthly grid box average. Annual means for land werecalculated for 38 grid boxes having a minimum of 60valid observations and 10 valid upper-level cloud ob-servations for a minimum of 15 yr. Annual means forocean were calculated for 58 grid boxes having a min-imum of 30 valid observations and 5 valid upper-levelcloud observations per month with a minimum of 7months of data per year. Only data taken between 708Nand 708S were used to calculate averages for the airtraffic regions that are defined in Table 1.
Monthly mean cirrus and cirrostratus fractions fromthe International Satellite Cloud Climatology Project(ISCCP; Rossow and Schiffer 1999) D2 dataset weresummed to provide total cirrus coverage (CCI) on a 2503 250 km2 grid for 1984–96 as a consistency check onthe surface observations. Only daytime data taken be-tween July 1983 and June 1991 and between July 1993and June 1996 were used here to minimize the impactof the Mount Pinatubo eruption on the satellite retriev-als. The CCI averages were computed using only thesame grid boxes that were included in the surface airtraffic region analyses.
Annual mean relative humidities with respect to liq-uid water at 300 hPa were computed on a 2.58 grid fromthe National Centers for Environmental Prediction(NCEP) reanalyses. RH(p) is used to indicate the annualmean computed from the instantaneous values, Rh(p)at pressure p. For brevity, the variable RH3 is used torepresent RH(300 hPa). RH3 values are used to evaluate
the changes in upper-tropospheric humidity (UTH) thatcan affect cirrus variability (Kistler et al. 2001). Themean annual distribution of expected linear contrail cov-erage (ECON) on a 2.88 grid is based on a parameter-ization of contrail formation tuned to satellite obser-vations of linear contrails using air traffic data from1992 and applied to 10 yr of global numerical weatheranalyses of relative humidity and temperatures at se-lected pressure levels (Sausen et al. 1998). The air trafficdata are based on the assumption of great circle routesbetween two airports.
4. Results and discussion
a. Cirrus trends
Linear trends, DCC/Dt, in annual mean cirrus cov-erage (CC) with time, t, were computed for each gridbox having averages for more than 15 yr. Values of CCincreased over the United States, the North Atlantic andPacific, and Japan (Fig. 2a), but dropped over most ofAsia, Europe, Africa, and South America. Increases arealso evident around coastal Australia, sub-Saharan west-ern Africa, and over the South Atlantic west of Africa.Areas with no trends were insufficiently sampled. Manyof the trends are statistically significant at the 90% con-fidence level (Fig. 2b). The largest concentrated in-creases occurred over the northern Pacific and Atlanticand roughly correspond to the major air traffic routesreflected in the ECON distribution (Fig. 2c). IncreasedCC over the United States and around Australia andJapan coincides with relatively well-traveled routes.Over Europe, the CC trends are mixed, while DCC/Dtis negative over South American routes. The coincidentNCEP RH3 dropped dramatically over Europe andnortheastern Asia and less so over the northeastern Unit-ed States, much of Asia, and the temperate ocean regions(Fig. 2d). RH3 rose over much of the Tropics, northernChina, and southwestern United States and adjacent wa-ters.
Although there appears to be close correspondencebetween many air traffic routes and increased CC, somedifferences exist between the local maxima in DCC/Dtand ECON. Assuming that contrails caused the changesin CC, then such differences could arise from slightdiscrepancies in gridding, idealization of air routes, andcontrail movement. Contrails often advect hundreds ofkilometers as they develop. Thus, their region of originmay differ from the area with maximum change in CC.To reduce this regional noise, the data were groupedinto larger areas of contrail influence. The boxes in Fig.2c show the air traffic regions while the remaining areasconstitute the other-region categories (see Table 1). Thewestern European region (WEUR) is a subset of theEuropean region (EUR). If contrails induce more cirruscoverage, then the largest effects should occur over theUnited States and WEUR where ECON is greatest (Ta-ble 2).

1674 VOLUME 17J O U R N A L O F C L I M A T E
FIG. 2. Trends in cirrus coverage and 300-hPa relative humidity (1971–95) and estimated 1992 linear contrail coverage. (a) Trends incirrus coverage for all regions with more than 15 yr of data. (b) Subset of (a) for all regions having trends significant at the 90% confidencelevel according to Student’s t test. (c) Estimated linear contrail coverage. Black and white boxes determine the boundaries for the land andocean air traffic regions, respectively. Only observations taken from land stations and from ships are used for the land and ocean air trafficregions, respectively. (d) Trends in annual mean NCEP relative humidity at 300 hPa.
TABLE 2. Contrails, mean cirrus cover, and cloudiness trends (% decade21) over air traffic regions from surface (CC) and ISCCP (CCI)data. The numbers in parentheses indicate the interannual variability in CC. The 1971–75 trends in CC are all significant at the 99% confidencelevel, except over WEUR where no trend is apparent.
Region1992 ECON
(%)Mean CC 1971–95
(%)CC trend1971–95
Total cloud trend1971–95
CC trend1983–95
CCI trend1983–95
WASIAEURWEURUSALORNANPOOR
0.080.601.521.750.090.320.160.13
36.2 (1.0)18.5 (1.3)19.8 (1.4)29.2 (1.1)24.5 (0.5)15.3 (0.7)15.7 (0.8)14.4 (0.6)
20.921.2
0.01.0
21.60.70.90.7
20.720.420.7
0.521.4
0.00.81.2
22.020.4
1.80.3
21.50.31.60.8
22.10.00.92.3
20.60.2
20.40.1
The yearly air traffic region CC averages (Fig. 3) roseover the United States, remained steady over WEUR,and decreased over EUR, western Asia (WASIA), andthe land–other regions (LOR), which include all landareas not included in the land air traffic regions. Valuesof CC also increased over the North Pacific (NP) andNorth Atlantic (NA) as well as over the ocean–otherregions (OOR). Interannual variability in CC (Table 2)
is greatest over Europe and least over the LOR. Trendsin CC computed from the data in Fig. 3 are mostly ofthe same sign as the total cloud cover trends (Table 2)and can account for most of the total cloud cover changeover WASIA, the LOR, and the NP. The increase in CCover the United States is compensated by slight de-creases in other cloud types, while the opposite is truefor EUR. Because CC is based on the assumption of

15 APRIL 2004 1675M I N N I S E T A L .
FIG. 3. Annual variation of CC over (a) five land regions [WASIA, WEUR, LOR, ERA, and United States (USA)]and (b) ocean regions (NA, NP, and OOR).
random overlap, that is, CC 5 Ci(1 1 OC), the totalcloud coverage is
TC 5 Ci 1 OC, (1)
where OC is other cloud coverage and Ci is the actualobserved cirrus coverage. Using the original annualmeans of CC and TC for the United States, it can beshown that OC decreased by only 0.65% between 1971and 1995, while Ci rose from 20.1% to 21.9%. Thus,the trend in OC is only 20.3% decade21. Over WEUR,the 0.7% decade21 drop in total cloudiness is likely dueto a decrease in low and midlevel cloud cover becauseCC remained constant. Total cloudiness increased morethan CC over the OOR while DCC/Dt over the NAappears to have been compensated by decreases in othercloud types.
The growth in ISCCP cirrus coverage over the UnitedStates greatly exceeds that from the surface observations(Table 2). Conversely, the CCI changes over the LORand WEUR are less than half of those in CC. Exceptover the NA, the ocean CCI trends are small comparedto those from the surface data. Discrepancies betweenthe two trends are expected given the differences insampling and observation techniques. Over the NP,DCC/Dt is positive but the ISCCP trend is negative,perhaps reflecting the difficulty in detecting cirrus fromthe visible and infrared satellite data when low cloudsare prevalent underneath the cirrus. From atlases ofcloud co-occurrence (Warren et al. 1986, 1988), it wasfound that the chance of cirrus occurring over stratus,midlevel clouds, and nimbostratus is 20%–40% morelikely over the NP than over the NA. Additionally, cirrusoccurs without any other clouds present nearly twice asoften over the NA than over the NP. Conversely, cirrusoccurs 20% more often over cumulus clouds, whichhave large areas of clear between them, in the NA thanin the NP. Thus, any trends in cirrus coverage detected
over the NP with the ISCCP data are likely to be di-minished in magnitude relative to those over the NA.The surface observations account for the overlap effectsby applying a random overlap correction, but do notmisclassify cirrus as some other cloud type. Except forthe NP case, the sign of DCC/Dt is consistent with theISCCP trends for the period common to both suggestingthat the trends are not artifacts of the observation meth-ods.
The frequency of clear-sky observations was alsocomputed for the land air traffic regions. Over the Unit-ed States and WASIA, the frequency of clear skieschanged by 21.3% and 1.8% decade21, respectively.Over EUR and WEUR, clear-sky frequency decreasedby 0.6% and 0.7% decade21, respectively. Thus, overthe United States, the increase in cirrus coverage wasaccompanied by fewer totally clear skies indicating thatboth the amount and frequency of cirrus coverage in-creased during the period.
The seasonal variations in CC and CCI trends overthe United States (Fig. 4a) are generally consistent withthe seasonal variations of contrail occurrence frequency(Minnis et al. 2003), satellite contrail coverage (Pali-konda et al. 1999, 2004), and ECON. The greater springand winter trends are accompanied by maxima incontrail frequency and coverage while all five quantitiesdip during summer. The greatest discrepancies in therelative seasonal values occur during fall when the CCtrend drops slightly, a change more in line with thesurface-based contrail frequency variation than withchanges in the other quantities. Over WEUR, DCC/Dtaveraged 1.0% decade21 during summer and fall and21.0% decade21 during winter and spring (Fig. 4b), aseasonal variation differing from the satellite-based con-trail coverage (Meyer et al. 2002) and ECON. OverWASIA, EUR, and the LOR, DCC/Dt was negative dur-ing all seasons except for summer over WASIA. Max-

1676 VOLUME 17J O U R N A L O F C L I M A T E
FIG. 4. Seasonal trends in cirrus and contrail amounts and frequencies over (a) the United States and (b)WEUR. The ISCCP and CC lines are cirrus trends. The ECON lines correspond to expected contrail coveragefor 1992. Satellite denotes mean linear contrail coverage derived from satellite data during the mid-1990s.Surface data denote persistent contrail frequency observed from the surface during the 1990s. The U.S. winterand spring trends are significant at the 99% confidence level compared to 84% for summer and fall. Only thesummer CC trend over WEUR is significant at the 99% confidence level, while the winter and fall trends aresignificant at the 84% confidence level. The WEUR spring trend is not statistically significant. If cirrus coverageis increasing because of contrail generation, then it should increase proportionately with contrail coverage. Thisidea is borne out by data over the United States, but not over WEUR.
imum DCC/Dt occurred during spring, summer, and fallover the NA, NP, and OOR, respectively.
Because the number of observing sites over the Unit-ed States decreased during the period, the sensitivity ofthe CC trends to the number of years sampled was ex-amined to ensure that the 15-yr requirement for usinga grid box in the regional analysis did not introduce anyartificial trend in the results. The U.S. trends were com-puted using 20-, 24-, and 25-yr requirements reducingthe number of U.S. grid boxes from 104 to 99, 67, and43, respectively. The corresponding U.S. trends were0.95%, 1.18%, and 1.11% decade21 indicating that thesampling uncertainty is on the order of 10%–12%. Thenumber of observing sites was generally more stableover other land areas.
b. Humidity impact
Most contrails form between 200 and 300 hPa whereoften T , 2398C. The lowest pressure with Rh reportedin the NCEP reanalyses is 300 hPa. When Rhi 5 100%,the minimum threshold for cirrus and contrail formation,Rh should be about 68% at 2408C and 60% at 2508C(Fig. 1). Given the known biases and uncertainties inradiosonde Rh measurements at low temperatures (Sas-sen 1997; Miloshevich et al. 2001), a more conservativeestimate of the formation threshold would be 40% at2408C, and less at lower temperatures. Thus, persistentcontrails are likely to form if Rh . 40% and T , 2398Cas measured from radiosondes, while cirrus clouds aremore likely to form at a higher Rh threshold (Ponater
et al. 2002). The annual frequency of Rh . 40% at highaltitudes should provide a measure of how often cirrusor contrails form or how much area they cover duringa given year. Although only the annual mean value ofRh at 300 hPa (RH3) is available from the NCEP data,Minnis et al. (2003) showed that it was highly correlatedwith the frequency of Rh(300 hPa) . 40% over theUnited States. Figure 5 shows the regression of RH3with the annual frequency of Rh(300 hPa) . 40% fromradiosonde data at 78 locations in the ComprehensiveAerological Research Data Set (CARDS; see Eskridgeet al. 1995). It yields a squared linear correlation co-efficient R2 of 0.94 and shows that RH3 is an excellentpredictor of the frequency of humidity levels conduciveto contrail and cirrus formation at 300 hPa. Comparisonswith radiosonde data (Minnis et al. 2003) show that RH3is also highly correlated with the frequencies ofRh(250 hPa) and Rh(200 hPa) greater than 40%, yield-ing R2 values of 0.74 and 0.52, respectively. Thus, RH3can be used as a measure of the long-term variations inthe frequency of persistent contrail conditions withinthe typical contrail altitude range.
Radiosondes at a given location may give accurateprofiles of Rh instantaneously, but are subject to con-siderable error in the long term because of instrumentchanges and variations in reporting practices (Elliot andGaffen 1991; Gaffen 1993). Over land, NCEP incor-porates radiosonde data, adjusting the profiles when nec-essary to maintain consistency with the model physics(Kistler et al. 2001). Over oceans, only radiosonde datafrom islands and coastlines are assimilated by NCEP;

15 APRIL 2004 1677M I N N I S E T A L .
FIG. 5. Variation of RH3 with the frequency of occurrence ofRh(300 hPa) . 40% from CARDS rawinsonde data from 77 stations,1971–2000. Contrail formation and cirrus persistence are highly prob-able if Rh(300 hPa) . 40%. Thus, RH3 can serve as a predictor forcirrus persistence.
TABLE 3. Trends in mean 300-hPa relative humidity from NCEP:1971–95.
Air traffic regionTrend in RH3(% decade21)
Mean temperature(K)
WASIAEURWEURUSALORNANPOOR
23.225.026.220.221.221.821.721.3
223.1225.7226.7230.5230.4227.6230.0235.4
no other maritime humidity data are used. Comparisonsof NCEP RH3 values with those from other sourcesyield mixed results, but CARDS and NCEP are posi-tively correlated at statistical significance levels of 88%over WASIA and 99% over WEUR, EUR, and LOR(see appendix A). There is no correlation between thetwo parameters over the United States (see appendix A).NCEP and CARDS are most consistent over Europewhere the negative RH3 trend (Fig. 2d) is strongest. TheNCEP data used here are currently the best availableestimate of UTH over land for the study period (seeappendix A).
Trends in RH3, DRH3/Dt, are negative everywhereexcept over the United States (Table 3), where the trendis insignificant. Mean temperatures at 300 hPa are below2398C everywhere except over the OOR (Table 3). Fig-ure 6 shows scatterplots of and linear regression fits toRH3 and CC data over the land regions. The lack of aRH3–CC correlation over the United States (Fig. 6c)and WEUR (Fig. 6b) indicates that the cirrus variationcannot be explained by the NCEP UTH trends. How-ever, RH3 explains 39%, 46%, and 33% of the variancein CC over WASIA (Fig. 6a), EUR (Fig. 6b), and theLOR (Fig. 6d), respectively, where ECON is relativelysmall. The slopes of the respective linear fits (Fig. 6)are 0.3, 0.2, and 0.6%CC (%RH3)21, suggesting thatCC is less sensitive to changes in RH3 over EUR, whereECON is relatively large, than over the LOR. Overocean, CC and RH3 are negatively correlated with R2
ranging from 0.30 to 0.39 highlighting the large un-
certainty in UTH over the oceans. Hereafter, only hu-midity impacts over land are considered.
The trend in total cirrus coverage CC can be estimatedas the sum of the trend in contrail cirrus and the de-pendence of natural cirrus coverage cnat on RH3,
DCC Dc DRH3 DECONnat5 1 f , (2)sDt DRH3 Dt Dt
where DECON/Dt is estimated from ECON (Table 2)and the growth in air traffic (ECON is assumed to bezero in 1970 for WASIA and the LOR). Values of CCincreased over the United States despite no change inRH3, while it remained relatively steady over WEURas RH3 plummeted. Between 1970 and 1995, air trafficincreased by factors of 3.7 and 5.2 over the United Statesand Europe (Penner et al. 1999), respectively, aug-menting the respective contrail-forming potentials byapproximately 15% and 21% each year relative to 1970air traffic. If the frequency distribution of Rh remainedsteady throughout the period, then CC should have in-creased over those regions. Additional air traffic eachyear would produce more contrail cirrus for 100% ,Rhi , 140% (area B in Fig. 1) while natural cirruscoverage would remain constant, resulting in a net in-crease in CC as seen for the United States. If the fre-quency of Rh . 40% decreased each year as indicatedby RH3, then natural cirrus coverage would decreaseproportionately as seen for the LOR, EUR, and WASIA.A simultaneous rise in air traffic would produce pro-portionately more contrail cirrus for 100% , Rhi ,140%. In that instance, CC should decrease at a smallerrate than expected for aircraft-free conditions. Theamount of counterbalancing would depend on the ab-solute annual increase in flights and the reduction ratein RH3. Over WEUR, the greater number of flights isapparently sufficient to offset the decrease in RH3, whileover WASIA and the LOR, the smaller amount of airtraffic would have less impact and is probably insuffi-cient to offset the drop in RH3. Large interannual chang-es in RH3 can affect the occurrence of both cirrus andcontrails (Minnis et al. 2003), but over the long term,increases in air traffic should offset some of the reduc-tion in CC caused by decreases in RH3.
Assuming that ECON increased linearly with air traf-fic, the correlation between ECON and CC is negative

1678 VOLUME 17J O U R N A L O F C L I M A T E
over the LOR, WASIA, and EUR and near zero overWEUR. A fit to the U.S. data for ECON increasing by15% yr21 relative to 1971 yields R2 5 0.42. This degreeof correlation is comparable to that between RH3 andCC over LOR and EUR. Thus, over the one air trafficregion where RH3 appears to be essentially invariant,air traffic can account for changes in CC as well as RH3can in the air traffic regions where RH3 changes sig-nificantly. Over WEUR, a two-parameter fit using RH3and ECON to predict CC yields a negligible increase(0.0006 to 0.014) in R2 relative to the correlation in Fig.6b suggesting that the interannual variability is too largeor the dramatic decrease in RH3 during the period hadan inordinate impact on the frequency distributions ofRhi.
Any conclusion about the role of aircraft in the U.S.CC trends must consider all of the evidence rather thanthe humidity trends alone because of the uncertaintiesin RH3. Prior to 1994, few measurements were takenover the United States when T , 2408C. However, CCand RH3 are also uncorrelated over WEUR, where RH3is consistent with both satellite and radiosonde obser-vations (see appendix A) and ECON is comparable tothat over the United States. This similarity supports theabsence of an RH3 trend over the United States. Theseasonal variations in the U.S. CC trends from bothsurface and satellite data have the same general char-acteristics as the magnitudes of the trends in contrailcoverage. No statistically significant seasonal trendswere found in RH3 over the United States, further sug-gesting that relative humidity is not responsible for theCC trends. Given the positive CC trends in the surfaceand satellite observations, the seasonal consistency be-tween contrails and DCC/Dt, the lack of an RH3 trend,an increase in cirrus frequency, and the known impactsof contrails on cirrus coverage, it is concluded that airtraffic is most likely responsible for the 1% decade21
growth in CC over the United States. It appears thatcirrus coverage would have diminished over WEURwithout the continually increasing high-altitude air traf-fic. In a similar vein, CC probably would have decreasedmore over WASIA, the remainder of Europe, and theLOR without contrails. Air traffic probably contributedto the increase of CC over the studied ocean areas. How-ever, without improved estimates of UTH over theocean, it will be difficult to determine the magnitude ofthat impact.
Based on the air traffic increase, the estimated linearcontrail coverage rose by 0.55% decade21 over the Unit-ed States compared to the 1% decade21 growth rate inCC. Assuming that the remaining CC increase is due tospreading contrails not detected by satellite analysis, f s
5 1.8. If the U.S. case is representative, the maximumimpact of linear contrails plus the extra contrail-inducedcirrus clouds should be roughly twice that determinedfor ECON. If the ECON values differ from the actuallinear contrail coverage as derived from satellites, thenf s would change accordingly. Assuming that f s 5 1.8
for all land areas, the change of natural cirrus with thechange in RH3 over EUR, WASIA, and the LOR isestimated to be 0.3, 0.3, and 1.4% (%RH3)21, respec-tively. The value for the United States cannot be de-termined because RH3 was invariant.
c. Climate effects
As of 1999, the ‘‘best’’ estimate of maximum netglobal radiative forcing, FNET 5 0.017 W m22, at thetop of the atmosphere computed for ECON was basedon a contrail optical depth t of 0.3 and the occurrenceof contrails only at a pressure level of 200 hPa (Minniset al. 1999). Recent studies indicate that, on average, tis less than 0.30 and the mean contrail pressure is closerto 225 hPa. From satellite measurements, Meyer et al.(2002) found a mean linear contrail optical depth of0.11 over Europe. Ponater et al. (2002) determined the-oretically that the mean global linear contrail opticaldepth is 0.15 at 250 hPa and is greater over the UnitedStates than over Europe. Using satellite data taken overthe Midwest, Duda et al. (2004) derived average contrailoptical depths of ;0.20 over the life cycles of contrailsthat developed into cirrus clouds. In a detailed manualanalysis of satellite data over the northeastern UnitedStates, Minnis et al. (2002) derived a mean optical depthof 0.26 for a large area of contrails from initiation todissipation. A similar result (mean t of 0.26) was foundby Palikonda et al. (2004) using an automated analysisof linear contrails over the entire United States usingdata from two satellites during all of 2001. Given thevariability in theory and observations, the value of theglobal mean contrail optical depth remains uncertain butis probably between 0.15 and 0.25 and is likely to belarger over the United States than over Europe.
A new estimate of the potential global radiative forc-ing by contrails and the resulting cirrus clouds can bemade using this new range of optical depths and thespreading factor. Retaining the contrail pressure of 200hPa assumed by Minnis et al. (1999), the maximumvalue of FNET (t 5 0.25) including both linear contrailsand the resulting contrail-generated cirrus clouds wouldincrease to 0.0255 W m22 because f s would more thancompensate for the reduction in t from 0.30 to 0.25.Increasing the pressure to 225 hPa would reduce theestimate slightly because the temperature difference be-tween the two levels is approximately 3.5 K. Using t5 0.15 would reduce the forcing to 0.0153 W m22. Theminimum global estimate of FNET for linear contrails(Marquart and Mayer 2002) is 0.0032 W m22, a valuethat would almost double if f s is considered. Thus, forthe combination of contrails and aged-contrail cirruscoverage, the global FNET for 1992 air traffic is mostlikely between 0.006 and 0.0255 W m22 assuming thatf s is globally representative.
The immediate response to FNET is warming of theatmosphere below the contrail and cooling or warmingof the surface depending on the time of day (Meerkotter

15 APRIL 2004 1679M I N N I S E T A L .
FIG. 6. Correlation of RH3 and mean annual CC, 1971–95, for (a) WASIA, (b) Europe, (c) USA, and (d)LOR.
TABLE 4. Tropospheric and surface temperature trends, computed using the observed cirrus trends (cirrus) over the United States and fromradiosonde date (labeled Angell) over North America between 208 and 508N from Angell (1999). Computed results are given for two contrail-cirrus optical depths.
DTa/Dt (8C decade21) DTs/Dt (8C decade21)
Cirrus
t 5 0.15 t 5 0.25 Angell
Cirrus
t 5 0.15 t 5 0.25 Angell
WinterSpringSummerFallAnnual
0.250.260.130.120.19
0.410.440.220.210.32
0.460.320.170.190.29
0.210.230.110.100.16
0.350.380.180.170.27
0.430.380.150.130.27
et al. 1998). Long-term responses to aircraft-inducedcirrus have been estimated by inserting small percent-ages of cirrus into a general circulation model (GCM)at various time steps along the air traffic routes and thenrunning the model to equilibrium (Rind et al. 2000).The GCM results account for many of the feedbacksand the redistribution of the radiative energy in the sys-tem. For a 1% change in absolute cirrus coverage witht 5 0.33, the GCM yielded surface temperature changes(DTs) of 0.438 and 0.588C over the globe and NorthernHemisphere, respectively. The GCM mean tropospheric
temperature between 3 and 10 km, DTa, rose by;0.788C. The regional variation in DCC/Dt (Table 3)and in the RH3 trends would prevent a direct applicationof the GCM results to estimate the global temperatureimpact of contrail-induced CC changes. Estimation ofthe temperature impact of DCC/Dt is more straightfor-ward over the United States because the UTH is rela-tively steady and the CC trend accounts for most of thetotal cloudiness trend.
The contrail–cirrus effect on the surface and tropo-spheric temperatures over the United States is estimated
1680 VOLUME 17J O U R N A L O F C L I M A T E
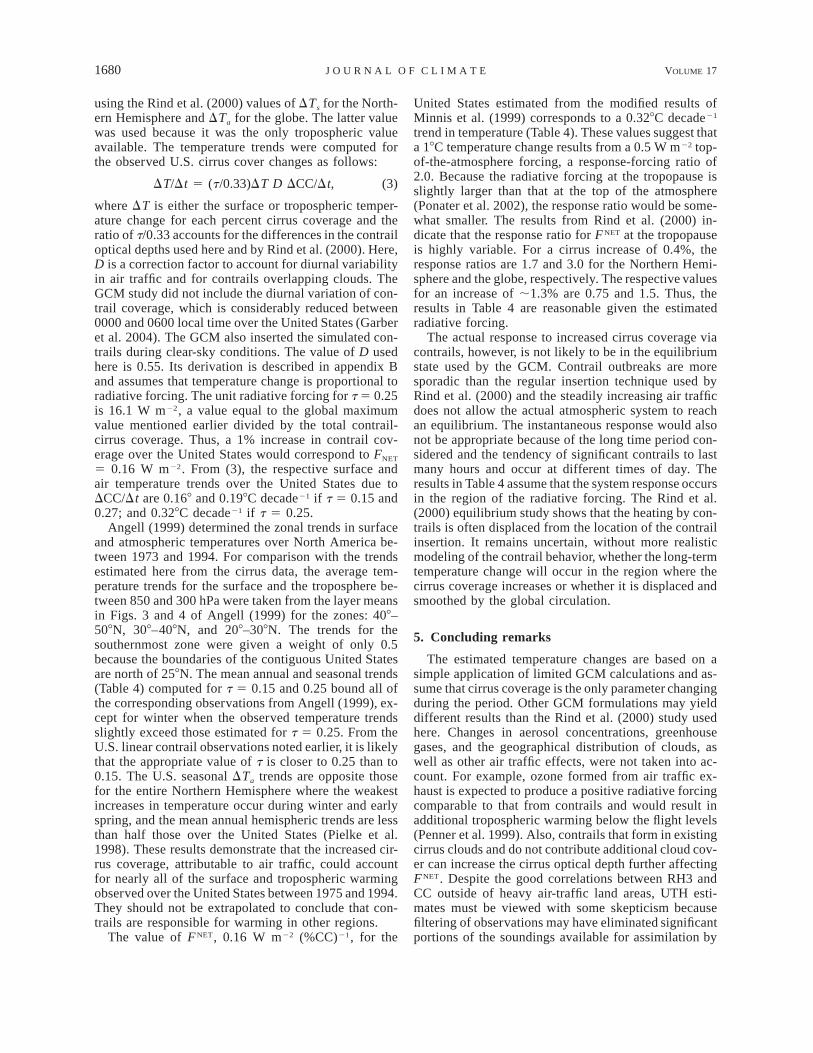
using the Rind et al. (2000) values of DTs for the North-ern Hemisphere and DTa for the globe. The latter valuewas used because it was the only tropospheric valueavailable. The temperature trends were computed forthe observed U.S. cirrus cover changes as follows:
DT/Dt 5 (t/0.33)DT D DCC/Dt, (3)
where DT is either the surface or tropospheric temper-ature change for each percent cirrus coverage and theratio of t/0.33 accounts for the differences in the contrailoptical depths used here and by Rind et al. (2000). Here,D is a correction factor to account for diurnal variabilityin air traffic and for contrails overlapping clouds. TheGCM study did not include the diurnal variation of con-trail coverage, which is considerably reduced between0000 and 0600 local time over the United States (Garberet al. 2004). The GCM also inserted the simulated con-trails during clear-sky conditions. The value of D usedhere is 0.55. Its derivation is described in appendix Band assumes that temperature change is proportional toradiative forcing. The unit radiative forcing for t 5 0.25is 16.1 W m22, a value equal to the global maximumvalue mentioned earlier divided by the total contrail-cirrus coverage. Thus, a 1% increase in contrail cov-erage over the United States would correspond to FNET
5 0.16 W m22. From (3), the respective surface andair temperature trends over the United States due toDCC/Dt are 0.168 and 0.198C decade21 if t 5 0.15 and0.27; and 0.328C decade21 if t 5 0.25.
Angell (1999) determined the zonal trends in surfaceand atmospheric temperatures over North America be-tween 1973 and 1994. For comparison with the trendsestimated here from the cirrus data, the average tem-perature trends for the surface and the troposphere be-tween 850 and 300 hPa were taken from the layer meansin Figs. 3 and 4 of Angell (1999) for the zones: 408–508N, 308–408N, and 208–308N. The trends for thesouthernmost zone were given a weight of only 0.5because the boundaries of the contiguous United Statesare north of 258N. The mean annual and seasonal trends(Table 4) computed for t 5 0.15 and 0.25 bound all ofthe corresponding observations from Angell (1999), ex-cept for winter when the observed temperature trendsslightly exceed those estimated for t 5 0.25. From theU.S. linear contrail observations noted earlier, it is likelythat the appropriate value of t is closer to 0.25 than to0.15. The U.S. seasonal DTa trends are opposite thosefor the entire Northern Hemisphere where the weakestincreases in temperature occur during winter and earlyspring, and the mean annual hemispheric trends are lessthan half those over the United States (Pielke et al.1998). These results demonstrate that the increased cir-rus coverage, attributable to air traffic, could accountfor nearly all of the surface and tropospheric warmingobserved over the United States between 1975 and 1994.They should not be extrapolated to conclude that con-trails are responsible for warming in other regions.
The value of FNET, 0.16 W m22 (%CC)21, for the
United States estimated from the modified results ofMinnis et al. (1999) corresponds to a 0.328C decade21
trend in temperature (Table 4). These values suggest thata 18C temperature change results from a 0.5 W m22 top-of-the-atmosphere forcing, a response-forcing ratio of2.0. Because the radiative forcing at the tropopause isslightly larger than that at the top of the atmosphere(Ponater et al. 2002), the response ratio would be some-what smaller. The results from Rind et al. (2000) in-dicate that the response ratio for FNET at the tropopauseis highly variable. For a cirrus increase of 0.4%, theresponse ratios are 1.7 and 3.0 for the Northern Hemi-sphere and the globe, respectively. The respective valuesfor an increase of ;1.3% are 0.75 and 1.5. Thus, theresults in Table 4 are reasonable given the estimatedradiative forcing.
The actual response to increased cirrus coverage viacontrails, however, is not likely to be in the equilibriumstate used by the GCM. Contrail outbreaks are moresporadic than the regular insertion technique used byRind et al. (2000) and the steadily increasing air trafficdoes not allow the actual atmospheric system to reachan equilibrium. The instantaneous response would alsonot be appropriate because of the long time period con-sidered and the tendency of significant contrails to lastmany hours and occur at different times of day. Theresults in Table 4 assume that the system response occursin the region of the radiative forcing. The Rind et al.(2000) equilibrium study shows that the heating by con-trails is often displaced from the location of the contrailinsertion. It remains uncertain, without more realisticmodeling of the contrail behavior, whether the long-termtemperature change will occur in the region where thecirrus coverage increases or whether it is displaced andsmoothed by the global circulation.
5. Concluding remarks
The estimated temperature changes are based on asimple application of limited GCM calculations and as-sume that cirrus coverage is the only parameter changingduring the period. Other GCM formulations may yielddifferent results than the Rind et al. (2000) study usedhere. Changes in aerosol concentrations, greenhousegases, and the geographical distribution of clouds, aswell as other air traffic effects, were not taken into ac-count. For example, ozone formed from air traffic ex-haust is expected to produce a positive radiative forcingcomparable to that from contrails and would result inadditional tropospheric warming below the flight levels(Penner et al. 1999). Also, contrails that form in existingcirrus clouds and do not contribute additional cloud cov-er can increase the cirrus optical depth further affectingFNET. Despite the good correlations between RH3 andCC outside of heavy air-traffic land areas, UTH esti-mates must be viewed with some skepticism becausefiltering of observations may have eliminated significantportions of the soundings available for assimilation by

15 APRIL 2004 1681M I N N I S E T A L .
FIG. A1. Comparisons of annual mean 300-hPa relative humidities over CARDS sites within the air traffic regions(a) WASIA, (b) EUR, (c) USA, and (d) LOR. The dashed line shows the absolute value of the difference betweenthe two estimates of RH3.
the NCEP model. Better measurements of UTH, clouddistributions, and contrail properties, and more precisespecification of flight paths and improved parameteri-zations of cirrus and contrail formation in GCMs areneeded to more rigorously determine the contrail climateimpacts. This study indicates that contrails already havesubstantial regional effects where air traffic is heavy.As air travel continues growing in other areas, the im-pact may become globally significant.
Acknowledgments. Many thanks to D. Young and D.Duda for critical reviews, U. Schumann and D. Faheyfor their comments, K. Gierens for providing the contraildistributions, C. Hahn for assistance with the cirrus data,D. Doelling for assistance in analyzing the radiosondedata, and D. Minnis for continued encouragement. Thisresearch was supported by the NASA Office of EarthScience Pathfinder Program under NRA-99-OES-04.
APPENDIX A
Evaluation of Relative Humidity Data
When compared with satellite estimates of UTH, ra-diosonde measurements of Rh are overestimated for theformer Soviet Union and China and underestimated overthe United States and western Europe (Soden and Lan-zante 1996). The satellite–radiosonde discrepancieswere attributed to the use of different types of humidityinstruments. Relative to the CARDS values, the NCEPreanalyses reduced RH3 over Asia (Fig. A1a) and in-creased RH3 over Europe (Fig. A1b) and the UnitedStates (Fig. A1c). Over other parts of the globe, RH3increased by ;15% compared to the CARDS values(Fig. A1d). The NCEP trends are consistent with theCARDS data over Europe and the rest of the globe.Over the United States, the CARDS data show a rise

1682 VOLUME 17J O U R N A L O F C L I M A T E
FIG. A2. Correlations of RH3 data shown in Fig. A1.
in RH3 with year, while the NCEP RH3 shows no sig-nificant trend. The U.S. CARDS RH3 values are prob-ably the least reliable of considered datasets, however,because only 65% of the 104 419 soundings taken be-tween 1971 and 2000 that had a valid Rh at 400 hPaalso had a valid Rh at 300 hPa. Furthermore, only 25%of the 400-hPa valid soundings had a valid Rh when T, 233 K. Prior to October 1993, Rh was not reportedfor T , 233 K and it was set equal to 19% wheneverthe measured value was less than 20% (Elliott et al.1998). Most of the valid cold Rh values occurred after1993 when reporting practices began to include Rh atall levels regardless of temperature (Elliott et al. 2002).A variety of other problems plague the U.S. radiosonderecord (Eskridge et al. 1995; Elliott et al. 1998, 2002).Since the NCEP reanalysis adjusts values to achievemodel consistency and computes Rh(300 hPa) for alltemperatures, it is not surprising that the NCEP andCARDS RH3 trends are different. Valid Rh(300 hPa)values occurred 84%, 77%, and 77% of the time overWASIA, Europe, and the rest of globe, respectively, inthe CARDS data when T(300 hPa) , 233 K and Rh(400hPa) was valid.
The CARDS and NCEP RH3 values are well corre-lated over EUR, WEUR, and OOR, but not over WASIAor over the United States (Fig. A2). Over Asia, RH3from NCEP and CARDS diverge after 1986 resultingin the diminished correlation between NCEP and theCARDS RH3. Documentation of the radiosonde datataken over WASIA (Elliott and Gaffen 1991) does notindicate any significant changes around 1986. However,the statistically significant decrease in CC over WASIA(Table 2) supports the negative trend in RH3 suggestingthe possibility of some unreported changes in instru-mentation or reporting practices in one or more report-ing countries. The lack of correlation over the UnitedStates is not surprising because the CARDS profiles lackvalues for most of the cold seasons as discussed earlier.
The greatest values of CC occur over WASIA sug-gesting that RH3 should be larger there than in any otherair traffic region. Because the dry bias in the measure-ments depends on temperature, the measurements and,hence, the NCEP RH3 values would be lower than overother regions because the 300-hPa temperature (Table2) is 7 K less than anywhere else. An empirical cor-rection formula (Minnis et al. 2002) indicates that at

15 APRIL 2004 1683M I N N I S E T A L .
FIG. A3. The 1985–96 trends in RH3 from (a) ECMWF and (b)NCEP reanalyses.
223 K, the measured Rh would be nearly 21% less thanthe true value at ice saturation compared to that at 230K, which would be only 14% less than the correspond-ing true value at ice saturation. If such biases hold forthe NCEP data, then approximately 7% should be addedto the RH3 values over Asia resulting in the Asian val-ues exceeding their U.S. counterparts. Given the poorstate of UTH measurements and their use in assimilationmodels, it is not expected that the absolute value ofRH3 will be highly accurate for a given region.
Trends in RH3 and in the average RH between 300and 500 hPa were computed for 1979–98 for compar-ison with satellite-derived values of UTH (Bates andJackson 2001). A comparison with Fig. 1 from Batesand Jackson (2001) indicates that the NCEP trends aregenerally opposite in sign to those from the satellitedata over most land areas. Better agreement was foundover the oceans. The trends in RH3 from NCEP werealso compared to those from the European Centre forMedium Range Forecasts (ECMWF) monthly TropicalOcean Global Atmosphere (TOGA) Global Tropospher-ic Analyses for 1985–96 (Fig. A3) when ECMWF dataare available (ECMWF 1995). In general, the ECMWFtrends are more extreme than their NCEP counterparts.They agree in sign over Europe, western Asia south of508N, and over much of the NP and NA. The trends areopposite in sign over many other areas including the
United States and Australia. The NCEP trends are onlysignificant at the 90% confidence level over the westernUnited States, Europe, Siberia, China, and Australia.The ECMWF trends are significant over the easternUnited States, Europe, China, southern Asia, Siberia,and Australia. Thus, the two datasets show some sig-nificant disagreement. Both datasets were correlatedwith CC for the various air traffic regions. The valuesof R2 for the ECMWF RH3 were all less than 0.12 andnone of the correlations were statistically significant.
The only UTH data available for 1971–96 are fromCARDS or NCEP. ECMWF reanalyses are not yet avail-able for the entire time period. Of all of the data avail-able for any significant time period, only the NCEP RH3values show significant correlations with CC for areaswhere contrails should play a minor role in cirrus cov-erage. The correlations over ocean are significant but ofthe wrong sign. Further study is needed to understandthis behavior over oceans. The CARDS data are avail-able only over a limited number of sites and overall arenot correlated with CC any better than the NCEP data.Thus, because of data quality, consistency, and cover-age, the NCEP dataset is the best available for com-parison with the CC trends. From all of the availableevidence, however, it appears that the NCEP data overland make the most sense and, therefore, constitute themost appropriate UTH dataset for the study period orany significant portion of it.
APPENDIX B
Determination of Diurnal and Cloud CorrectionFactor for Estimating Contrail-Induced
Temperature Changes
If it is assumed that radiative forcing is directly pro-portional to a temperature change, then radiative forcingvalues can be used to establish the desired correctionfactor D to account for the lack of an air traffic diurnalcycle and the absence of contrail–cloud overlap in theRind et al. (2000) estimates of temperature change dueto contrails. Here, D is estimated using the global ra-diative forcing results for t 5 0.3 in Table 1 from Minniset al. (1999), which included an air traffic diurnal cycleand overlapping clouds and contrails. The shortwave(SW), longwave (LW), and net radiative forcings fromMinnis et al. (1999) are 5 20.008, 5 0.025,SW LWF Fd d
and 5 0.017 W m22, respectively.NETF d
The absence of a diurnal cycle in the GCM resultsonly affects the longwave forcing. Air traffic over theUnited States during the night is roughly 42% of thatduring the day (Garber et al. 2004). Assuming that dayand night are 12 h each and that the unit nighttime LWradiative forcing over land ( ) is 90% of that duringLWFnite
the day due to heating and cooling of the surface, thetotal LW forcing accounting for a diurnal cycle in airtraffic is
LW LW0.025 5 0.5F 1 0.5 3 0.42 3 0.9F , (B1)day day

1684 VOLUME 17J O U R N A L O F C L I M A T E
where is the daytime LW forcing. Solving (B1)LWFday
yields 5 0.0363 W m22 and 5 0.0326 W m22.LW LWF Fday nite
If the air traffic was constant as in Rind et al. (2000),then the total radiative forcing would be
LW LW LWF 5 0.5 F 1 0.5 F .r day nite (B2)
Thus, 5 0.0345, a value that is 38% greater thanLWF rd
that for a day–night ratio of 2.4. Assuming random cloudoverlap, the SW and LW radiative forcings from Minniset al. (1999) can be approximated as
SW SW SWF 5 F (1 2 A ) 1 A F and (B3)d clr c c cld
LW LW LWF 5 F (1 2 A ) 1 A F , (B4)d clr c c cld
respectively. The subscripts, cld and clr refer to cloudyand clear areas, respectively, and AC is the mean cloudfraction. The relative clear and cloudy forcings wereestimated using the results from Fig. 5 of Meerkotter etal. (1999) that show the unit radiative forcings for aclear scene and for the same scene with a low-levelcloud. The unit SW forcings for the clear and cloudyscenes are 214 and 22 W m22, respectively. Thus,
SW SWF 5 0.14 F .cld cld (B5)
Assuming an average cloud height of 5 km over theUnited States and a linear variation of with cloudLWF cld
height, the unit LW radiative forcing at 5 km in theMeerkotter et al. (1999) would be 31 W m22 comparedto 57 W m22 for the clear case and
LW LWF 5 0.54 F .cld clr (B6)
Substituting (B5) and (B6) into (B3) and (B4), respec-tively, and assuming AC is 50%, and are 20.0140SW LWF Fclr clr
and 0.0325 W m22, respectively. Thus, in the absence ofcloud cover and the air traffic diurnal cycle,
LW LWF 5 1.38F , and (B7)r clr
SW SWF 5 F . (B8)r clr
The equivalent net forcing for the GCM case, , isNETF r
the sum of (B7) and (B8), which produces a value of0.0309 W m22. The correction factor D is simply theratio of to , which yields a value 0.55.NET NETF Fd r
REFERENCES
Angell, J. K., 1999: Variation with height and latitude of radiosondetemperature trends in North America, 1975–94. J. Climate, 12,2551–2561.
Bates, J. J., and D. L. Jackson, 2001: Trends in upper-tropospherichumidity. Geophys. Res. Lett., 28, 1695–1698.
Boucher, O., 1999: Air traffic may increase cirrus cloudiness. Nature,397, 30–31.
Changnon, S. A., 1981: Midwestern cloud, sunshine and temperaturetrends since 1901: Possible evidence of jet contrail effects. J.Appl. Meteor., 20, 496–508.
Duda, D. P., P. Minnis, and L. Nguyen, 2001: Estimates of cloudradiative forcing in contrail clusters using GOES imagery. J.Geophys. Res., 106, 4927–4937.
——, ——, ——, and R. Palikonda, 2004: A case study of the de-
velopment of contrail clusters over the Great Lakes. J. Atmos.Sci., in press.
ECMWF, cited 1995: The description of the ECMWF/WCRP LevelIII—A global atmospheric data archive. [Available online athttp://www.ecmwf.int/products/data/archive/descriptions/od/toga/.]
Elliott, W. P., and D. J. Gaffen, 1991: On the utility of radiosondehumidity archives for climate studies. Bull. Amer. Meteor. Soc.,72, 1507–1520.
——, R. J. Ross, and B. Schwartz, 1998: Effects on climate recordsof changes in National Weather Service humidity processingprocedures. J. Climate, 11, 2424–2436.
——, ——, and W. H. Blackmore, 2002: Recent changes in NWSupper-air observations with emphasis on changes from VIZ toVaisala radiosondes. Bull. Amer. Meteor. Soc., 83, 1003–1017.
Eskridge, R. E., O. A. Alduchov, I. V. Chernykh, P. Zhai, A. C.Polansky, and S. R. Doty, 1995: A Comprehensive AerologicalReference Dataset (CARDS): Rough and systematic errors. Bull.Amer. Meteor. Soc., 76, 1759–1775.
Gaffen, D. J., 1993: Historical changes in radiosonde instruments andpractices. WMO/TD-No. 541, World Meteorological Organiza-tion, 123 pp.
Garber, D. P., P. Minnis, and P. K. Costulis, 2004: A USA commercialflight track database for upper tropospheric aircraft emissionstudies. Proc. European Conf. on Aviation, Atmosphere, andClimate, Friedrichshafen at Lake Constance, Germany, Institutfur Physik der Atmosphare, DLR, in press. [Available online athttp://www-5pm.larc.nasa.gov/sass/pub/conference/Garber.AAC.03.pdf.]
Gierens, K., U. Schumann, M. Helten, H. Smit, and A. Marenco,1999: A distribution law for relative humidity in the upper tro-posphere and lower stratosphere derived from three years ofMOZAIC measurements. Ann. Geophys., 17, 1218–1226.
Hahn, C. J., and S. G. Warren, 1999: Extended edited synoptic cloudreports from ships and land stations over the globe, 1952–1996.NDP026C, Carbon Dioxide Information Analysis Center, OakRidge National Laboratory, Oak Ridge, TN, 80 pp.
Hansen, J., M. Sato, and R. Ruedy, 1997: Radiative forcing andclimate response. J. Geophys. Res., 102, 6831–6864.
Jensen, E., and O. Toon, 1994: Ice nucleation in upper troposphere:Sensitivity to aerosol number density, temperature, and coolingrate. Geophys. Res. Lett., 21, 2019–2022.
——, and Coauthors, 2001: Prevalence of ice-supersaturated regionsin the upper troposphere: Implications for optically thin ice cloudformation. J. Geophys. Res., 106, 17 253–17 266.
Kistler, R., and Coauthors, 2001: The NCEP–NCAR 50-Year Re-analysis: Monthly means CD-ROM and documentation. Bull.Amer. Meteor. Soc., 82, 247–267.
Marquart, S., and B. Mayer, 2002: Towards a reliable GCM estimationof contrail radiative forcing. Geophys. Res. Lett., 29, 1179, doi:10.1029/2001GL014075.
Meerkotter, R., U. Schumann, D. R. Doelling, P. Minnis, T. Nakajima,and Y. Tsushima, 1999: Radiative forcing by contrails. Ann. Geo-phys., 17, 1070–1084.
Meyer, R., H. Mannstein, R. Meerkotter, U. Schumann, and P.Wendling, 2002: Regional radiative forcing by line-shaped con-trails derived from satellite data. J. Geophys. Res., 107, 4104,doi:10.1029/2001JD000426.
Miloshevich, L. M., H. Vomel, A. Paukkunen, A. J. Heymsfield, andS. J. Oltmans, 2001: Characterization and correction of relativehumidity measurements from Vaisala RS80-A radiosondes atcold temperatures. J. Atmos. Oceanic Technol., 18, 135–156.
Minnis, P., D. F. Young, L. Nguyen, D. P. Garber, W. L. Smith Jr.,and R. Palikonda, 1998: Transformation of contrails into cirrusduring SUCCESS. Geophys. Res. Lett., 25, 1157–1160.
——, U. Schumann, D. R. Doelling, K. Gierens, and D. Fahey, 1999:Global distribution of contrail radiative forcing. Geophys. Res.Lett., 26, 1853–1856.
——, L. Nguyen, D. P. Duda, and R. Palikonda, 2002: Spreading ofisolated controls during the 2001 air traffic shutdown. Preprints,

15 APRIL 2004 1685M I N N I S E T A L .
10th Conf. on Aviation, Range, and Aerospace Meteorology,Portland, OR, Amer. Meteor. Soc., J9–J12.
——, J. K. Ayers, S. P. Weaver, and M. L. Nordeen, 2003: Contrailfrequency over the United States from surface observations. J.Climate, 16, 3447–3462.
Nakanishi, S., J. Curtis, and G. Wendler, 2001: The influence ofincreased jet airline traffic on the amount of high level cloudinessin Alaska. Theor. Appl. Climatol., 68, 197–205.
Palikonda, R., P. Minnis, D. R. Doelling, P. W. Heck, D. P. Duda, H.Mannstein, and U. Schumann, 1999: Contrail climatology overthe USA from MODIS and AVHRR data. Preprints, 10th Conf.on Atmospheric Radiation, Madison, WI, Amer. Meteor. Soc.,181–184.
——, D. N. Phan, V. Chakrapani, and P. Minnis, 2004: Contrail cov-erage over the USA from MODIS and AVHRR data. Preprints,European Conf. on Aviation, Atmosphere, and Climate, Fried-richshafen at Lake Constance, Germany, Institut fur Physik derAtmosphare, DLR, in press. [Available online at http://www-pm.larc.nasa.gov/sass/pub/conference/rabi.AAC.03.pdf.]
Penner, J. E., D. H. Lister, D. J. Griggs, D. J. Dokken, and M.McFarland, Eds., 1999: Aviation and the Global Atmosphere.Cambridge University Press, 373 pp.
Pielke, R. A., J. Eastman, T. N. Chase, J. Knaff, and T. G. F. Kittel,1998: 1973–1996 trends in depth-averaged tropospheric tem-perature. J. Geophys. Res., 103, 16 927–16 933.
Ponater, M., S. Marquart, and R. Sausen, 2002: Contrails incomprehensive global climate model: Parameterization and ra-diative forcing results. J. Geophys. Res., 107, 4164, doi:10.1029/2001JD000429.
Rind, D., P. Lonergan, and K. Shah, 2000: Modeled impact of cirruscloud increases along aircraft flight paths. J. Geophys. Res., 105,19 927–19 940.
Rossow, W. B., and R. A. Schiffer, 1999: Advances in understandingclouds from ISCCP. Bull. Amer. Meteor. Soc., 80, 2261–2287.
Sassen, K., 1997: Contrail-cirrus and their potential for regional cli-mate change. Bull. Amer. Meteor. Soc., 78, 1885–1903.
——, and G. C. Dodd, 1989: Haze particle nucleation simulations incirrus clouds, and application for numerical and lidar studies. J.Atmos. Sci., 46, 3005–3014.
Sausen, R., K. Gierens, M. Ponater, and U. Schumann, 1998: A di-agnostic study of the global coverage by contrails. Part I: Presentday climate. Theor. Appl. Climatol., 61, 127–141.
Soden, B. J., and J. R. Lanzante, 1996: An assessment of satelliteand radiosonde climatologies of upper-troposheric water vapor.J. Climate, 9, 1235–1250.
Strom, J., and Coauthors, 2003: Cirrus cloud occurrence as functionof ambient relative humidity: A comparison of observations fromthe Southern and Northern Hemisphere midlatitudes obtainedduring the INCA experiment. Atmos. Chem. Phys. Discuss., 3,3301–3333.
Travis, D., A. Carleton, and R. Lauritsen, 2002: Contrails reduce dailytemperature range. Nature, 418, 601.
Udelhofen, P., and R. D. Cess, 2001: Cloud cover variations over theUnited States: An influence of cosmic rays or solar variability?Geophys. Res. Lett., 28, 2617–2620.
Warren, S. G., C. J. Hahn, J. London, R. M. Chervin, and R. L. Jenne,1986: Global distribution of total cloud cover and cloud typeamounts over land. National Center for Atmospheric ResearchTech. Note TN-2731STR, 29 pp.
——, ——, ——, ——, and ——, 1988: Global distribution of totalcloud cover and cloud type amount over the ocean. NationalCenter for Atmospheric Research Tech. Note TN-3171STR, 42pp.