Gaurav Sundararaman - Advances in Enterprise Storage Systems and techniques - Interop Mumbai 2009

Working Draft – Comments Welcome
Contract Teachers: Experimental Evidence from India
Karthik Muralidharan†
Venkatesh Sundararaman
‡
1 May 2010*
Abstract: The large-scale expansion of primary education in developing countries has led to the increasing use of locally-hired teachers on fixed-term renewable contracts who are not professionally trained and who are paid much lower salaries than regular civil service teachers. This has been a very controversial policy, and there is limited evidence about the effectiveness of such contract teachers. We present experimental evidence from a program that provided an extra contract teacher to 100 randomly-chosen government-run rural primary schools in the Indian state of Andhra Pradesh. At the end of two years, students in schools with an extra contract teacher performed significantly better than those in comparison schools by 0.15 and 0.13 standard deviations, in math and language tests respectively. While all students gain from the program, the extra contract teacher was particularly beneficial for students in their first year of school and students in remote schools. Contract teachers were significantly less likely to be absent from school than civil-service teachers (16% vs. 27%). We also find using four different non-experimental estimation procedures that contract teachers are no less effective in improving student learning than regular civil-service teachers who are more qualified, better trained, and paid five times higher salaries. JEL Classification: I21, M55, O15
Keywords: contract teachers, teacher incentives, teacher pay, class size, primary education in developing countries, public and private schools, India
† UC San Diego, NBER, and J-PAL; E-mail: [email protected] ‡ South Asia Human Development Unit, World Bank. E-mail: [email protected] * We are grateful to Caroline Hoxby, Michael Kremer, and Michelle Riboud for their support, advice, and encouragement at all stages of this project. We thank Eli Berman, James Berry, Julie Cullen, Gordon Dahl, Nora Gordon, Gordon Hanson, and various seminar participants for useful comments and discussions. This paper is based on a project known as the Andhra Pradesh Randomized Evaluation Study (AP RESt), which is a partnership between the Government of Andhra Pradesh, the Azim Premji Foundation, and the World Bank. Financial assistance for the project has been provided by the Government of Andhra Pradesh, the UK Department for International Development (DFID), the Azim Premji Foundation, and the World Bank. We thank Dileep Ranjekar, Amit Dar, Samuel C. Carlson, and officials of the Department of School Education in Andhra Pradesh (particularly Dr. I.V. Subba Rao, Dr. P. Krishnaiah, and K. Ramakrishna Rao), for their continuous support and long-term vision for this research. We are especially grateful to DD Karopady, M Srinivasa Rao, and staff of the Azim Premji Foundation for their leadership and meticulous work in implementing this project. We thank Vinayak Alladi, and Ketki Sheth for outstanding research assistance. The findings, interpretations, and conclusions expressed in this paper are those of the authors and do not necessarily represent the views of the World Bank, its Executive Directors, or the governments they represent.

1
1. Introduction
The large scale expansion of primary education in developing countries over the past two
decades to achieve the Millennium Development Goal of universal primary education has led to
significant improvements in school access and enrollment, but has also created difficulties with
regards to maintaining and improving school quality.1 A particularly challenging problem has
been recruiting enough teachers and posting them in areas where they are needed. The challenge
is both fiscal (since teacher salaries account for the largest component of education spending2
Governments in several developing countries have responded to this challenge by staffing
teaching positions with locally-hired teachers on fixed-term renewable contracts, who are not
professionally trained, and who are paid much lower salaries than those of regular teachers (often
less than one fifth as much).
)
and logistical (since qualified civil-service teachers are less willing to be deployed to
underserved and remote areas where their need is the greatest).
3 The increasing use of contract teachers has been one of the most
significant policy innovations4 in providing primary education in developing countries over the
last two decades, but it has also been highly controversial. Supporters consider the use of
contract teachers to be an efficient way of expanding education access and quality to a large
number of first-generation learners, and argue that contract teachers face superior incentives
compared to tenured civil-service teachers. Opponents argue that using under-qualified and
untrained teachers may staff classrooms but will not produce learning outcomes, and that the use
of contract teachers de-professionalizes teaching, reduces the prestige of the entire profession,
and reduces motivation of all teachers.5
1 See Pritchett (2004) for a detailed overview showing very low levels of learning (conditional on years of school completed) across several developing countries.
2 Typically over 80% and often over 90% of education spending in many developing countries is on teacher salaries (education spending data by country available at http://www.uis.unesco.org/en/stats/stats0.htm) 3 Contract teacher schemes have been used in several developing countries including Cambodia, Indonesia, Kenya, Mali, Nicaragua, Niger, Togo, and several other African countries (see Duthilleul (2005) for a review of contract teacher programs in several countries). They have also been widely employed in several states of India (under different names such as Shiksha Karmi in Madhya Pradesh and Rajasthan, Shiksha Mitra in Uttar Pradesh, Vidya Sahayak in Gujarat and Himachal Pradesh, and Vidya Volunteers in Andhra Pradesh). 4 For example, over 25% of the primary school teachers in the large Indian states of Uttar Pradesh, Bihar, and Madhya Pradesh are contract teachers (as calculated from the State Report Cards issued by the Ministry of Human Resource Development in India – see Mehta (2007)). While this refers to the total stock of teachers, the share of contract teachers in the annual flow of new teachers has been significantly higher in the past 15 years. 5 See Kumar et al (2005) for an example of these criticisms.

2
We present experimental evidence on the impact of contract teachers from a program that
was designed to mimic an expansion of the current contract teacher policy of the government of
the Indian state of Andhra Pradesh (AP). The study was conducted across a representative
sample of 200 government-run schools in rural AP with 100 of these schools being selected by
lottery to receive an extra contract teacher over and above their allocation of regular and contract
teachers. This paper presents the first experimental evidence from an “as is” expansion of a
contract teacher policy in a representative sample of schools anywhere in the world.
At the end of two years of the program, we find that students in schools with an extra
contract teacher perform significantly better than those in comparison schools by 0.15 and 0.13
standard deviations (SD) in math and language tests respectively, showing that even untrained
teachers with less education and much lower levels of training than regular civil-service teachers
were able to improve student learning outcomes. Students in remote schools benefit more from
the extra contract teacher and we also find that the largest gains in test scores in treatment
schools are for students in the first grade (averaging 0.23 and 0.25 SD in math and language).
We find evidence to suggest that the mechanism for this result is that class-size reductions
enabled by hiring an additional contract teacher were of greatest benefit to children in younger
grades. Finally, we also find that contract teachers were significantly less likely to be absent
from school than regular teachers (16% versus 27%), suggesting that they have superior
incentives for effort.
While the experiment establishes that the marginal product of contract teachers is positive6
If contract teachers are so much more cost effective than regular teachers, a natural follow up
question is to ask why they have not been used more extensively. One possibility is that public
, it
does not compare regular and contract teachers. So we use our rich panel data on student
learning and data on teacher assignment to classrooms to construct four different non-
experimental estimates of the relative effectiveness of contract and regular teachers (two using
within-school variation, and two using between-school variation). We find using all four
methods that we cannot reject the null hypothesis that contract teachers are as effective as regular
teachers (who cost five times as much) in improving student learning outcomes and the null is
never rejected even under several robustness checks.
6 This is not obvious given the lack of training and the lower qualifications of contract teachers. For instance, the well-known Tennessee STAR experiment found a positive effect on test scores of reducing class sizes with a regular teacher, but found no additional impact of providing less-qualified teacher-aides.

3
production of education leads to sub-optimal resource allocation because of limited incentives to
do so optimally.7
Our results contribute to an emerging literature on understanding the impact of contract
teachers in developing countries. In addition to several descriptive studies regarding the use of
contract teachers,
We collect data on rural private school teachers in the same districts where the
contract teacher experiment was carried out and find that private school teacher characteristics
are closer to those of contract teachers than civil-service teachers, and that teacher salaries in
private schools are even lower than those of contract teachers. While private schools pay much
lower teacher salaries than government-run schools, they hire more teachers, and have lower
pupil-teacher ratios as a result. Considering the teacher hiring choices of private schools as a
benchmark for productive efficiency suggests that expanding the use of contract teachers may
move education production in public schools closer to the efficient frontier.
8 recent papers that use observational data to study the effect of contract
teachers include De Laat and Vegas (2005) in Togo, Bourdon et al (2006) in Niger, and Bourdon
et al (2007) in Niger, Mali, and Togo.9
7 On teacher personnel policies, Ballou (1996) shows that public school administrators typically do not hire the best applicants; on education spending more broadly, Hanushek (2002) reviews several studies showing the lack of a relation between public spending on education and learning outcomes, and on public sector management in general, Bloom and Van Reenen (2010) collect detailed data on management practices and show that government-owned firms are typically managed “extremely badly”.
Duflo et al (2009) conduct an experimental evaluation of
a contract teacher program in Kenya and find that students randomly assigned to contract
teachers (and whose class size was halved) do significantly better than students in comparison
schools, while students assigned to regular teachers in program schools (where the class size was
also halved) do no better than those in the comparison schools.
8 Notable among these are Duthilleul (2005) describing experiences with contract teachers in Cambodia, India, and Nicaragua, and Govinda and Josephine (2004) who conduct a detailed review of contract teachers (also known as para-teachers) in India and summarize the key arguments for and against the use of contract teachers in India. The three case studies in Pritchett and Pande (2006) also provide a good discussion on locally-hired contract teachers in India. Kingdon and Sipahimalani-Rao (2010) provide a recent overview that summarizes several descriptive studies on para-teachers across India. 9 Using a data set from Togo, De Laat and Vegas (2005) control for observable differences in student and teacher characteristics and find that students of regular teachers perform better than those of contract teachers. Bourdon et al (2006) use data from Niger and conclude that after controlling for confounding factors, contract teachers do not perform much worse than regular teachers. Bourdon et al (2007) use data from Togo, Niger, and Mali and find differential effects across these countries (positive effects in Mali, mixed effects in Togo, and negative effects in Niger) and suggest that these may be explained by differences in how contract teacher programs were implemented in these countries, with positive effects found where the contract teachers were managed through local communities and negative effects where contract teacher hiring was centralized. A related paper is Banerjee et al (2007), who conduct an experimental evaluation of a remedial education program staffed by untrained informal teachers in two Indian cities and find that the program was highly effective in improving learning outcomes. But the program focused on remedial instruction and removed weak children from the classroom, and is thus quite different from the typical contract teacher policies implemented in several Indian states over the past two decades.
4
The results in this paper are also relevant to the literatures on decentralization and
accountability in the provision of public services, on service delivery in remote areas, and on the
relative efficiency of public and private production of education.10 We also contribute to the
extensive class-size literature in developed and developing countries,11 and show that the
benefits of class-size reduction can be obtained even with less-trained contract teachers (for
primary education in developing countries). Finally, while set in the context of schools and
teachers, the results in this paper also contribute to our understanding of the consequences of
restricting entry into professions based on credentials (either by law or by convention).12
There are large welfare implications of taking our results seriously. The recently passed
Right to Education Act in India calls for eliminating the use of untrained teachers and increasing
education spending to replace them with regular teachers over the next three years. The Act also
calls for a reduction of the pupil-teacher ratio from 40:1 to 30:1 and the combination of these
clauses is expected to cost over USD 5 Billion annually if fulfilled through the recruiting of
additional regular teachers.
13
The rest of this paper is organized as follows: section 2 describes the experimental
intervention and data collection and section 3 presents the results of the extra contract teacher
program. Section 4 presents non-experimental comparisons of the effectiveness of regular and
contract teachers, while section 5 provides comparisons to private school teachers. Section 6
discusses policy implications and concludes.
Our results suggest that the need for additional teachers can be
satisfied in a much more cost effective way by hiring more contract teachers. As an extension to
this argument, the private school benchmark would suggest that hiring several contract teachers
for every one regular teacher not hired, is a more efficient way of allocating the additional
education spending and more likely to lead to better learning outcomes for a given budget.
10 On decentralization and service delivery, see Bardhan (2002) for a theoretical discussion, Sawada and Ragatz (2005) on the EDUCO program in El Salvador, and Pritchett and Murgai (2007) on education decentralization in India. On service delivery in remote areas see Jacob, Kochar, and Reddy (2008) on the impact of sub-scale schools and multi-grade teaching on learning outcomes in India. Review articles on the relative efficiency of public and private production of education include Hanushek (2002), and Pritchett (2004). 11 References based on US evidence include Krueger (1999, 2003) and Hanushek (1999, 2003). Angrist and Lavy (1999) and Urquiola (2006) provide international evidence. Krueger (1999) reports results from the Tennessee STAR project, which is probably the most well known class-size reduction experiment. 12 There is a vast literature in the US on the effects of teacher certification and of policies requiring school districts to hire certified or qualified teachers. See Walsh (2001) and Darling-Hammond (2001) for opposing views based on meta-analyses of several studies. Kane et al (2008) is a relevant recent study in New York. Kleiner (2000) presents a general overview of the economics of occupational licensing. 13 The Right to Education Act was passed in 2010 and estimates suggest that an additional 1.2 million teachers will need to be recruited to satisfy the provisions in the Act.

5
2. Experimental Design
2.1. Context
While India has made substantial progress in improving access to primary schooling and
primary school enrollment rates, the average levels of learning remain very low. The most
recent Annual Status of Education Report found that around 60% of children aged 6 to 14 in an
all-India sample of rural households could not read at the second grade level, though over 96%
of them were enrolled in school (Pratham, 2010). Public spending on education has been rising
as part of the “Education for All” campaign, but there are substantial inefficiencies in public
delivery of education services. A recent study using a nationally representative dataset of
primary schools in India found that 25% of teachers were absent on any given day, and that less
than half of them were engaged in any teaching activity (Kremer et al (2005)).
Andhra Pradesh (AP) is the 5th largest state in India, with a population of over 80 million,
73% of who live in rural areas. AP is close to the all-India average on various measures of
human development such as gross enrollment in primary school, literacy, and infant mortality, as
well as on measures of service delivery such as teacher absence (Figure 1a). The state consists
of three historically distinct socio-cultural regions (Figure 1b) and a total of 23 districts. Each
district is divided into three to five divisions, and each division is composed of ten to fifteen
mandals, which are the lowest administrative tier of the government of AP. A typical mandal
has around 25 villages and 40 to 60 government primary schools. There are a total of over
60,000 such schools in AP and around 80% of children in rural AP attend government-run
schools (Pratham, 2010).
The average rural government primary school is quite small, with total enrollment of around
80 to 100 students and an average of 2 to 3 teachers across grades one through five.14
14 This is a consequence of the priority placed on providing all children with access to a primary school within one kilometer from their homes. The median of the number of teachers per school was three and the mode was two.
One
teacher typically teaches all subjects for a given grade (and often teaches more than one grade
simultaneously). All regular teachers are employed by the state, and their salary is mostly
determined by experience and rank, with minor adjustments based on assignment location, but
no component based on any measure of performance. In 2006, the average salary of regular
teachers was over Rs. 8,000/month and total compensation (including benefits) was over Rs.
10,000/month (per capita income in AP was around Rs. 2,000/month). Regular teachers' salaries

6
and benefits comprise over 90% of non-capital expenditure on primary education in AP.
Teacher unions are strong and disciplinary action for non-performance is rare.15
2.2 The Extra Contract Teacher Intervention
Contract teachers (also known as para-teachers) are generally hired at the school level by
school committees and have usually completed either high school or college but typically have
no formal teacher training. Their contracts are renewed annually and they are not protected by
any civil-service rules. Their typical salary of around Rs. 1000 - 1500/month is less than one
fifth of the average salary of regular government teachers.16
The process by which contract teachers are typically hired in Andhra Pradesh is that schools
apply to the district education administration for permission to hire a contract teacher based on
their enrollment and teacher strength at the start of the school year. Thus contract teachers can
be appointed both against vacant sanctioned posts (that may have been filled by a regular
teacher) and as additional resources to meet the needs of growing enrollment. If the permission
(and fiscal allotment) is given, a contract teacher will be hired by the school committee. The
authorization of the position is not guaranteed for subsequent years, but once a position is
approved, it is usually continued unless there are significant changes in enrollment patterns. But
since renewal is not guaranteed, the appointment of contract teachers is typically for a 10-month
period.
They are also much more likely to
be younger, to be female, to be from the same village, and live closer to the school they teach in
(Table 1 – Panel A). Contract teachers usually teach their own classes and are not 'teacher-aides'
who support a regular teacher in the same classroom.
17
The extra contract teacher intervention studied in this paper was designed to resemble the
typical process of contract teacher hiring and use as closely as possible. Schools that were
selected for the program by a lottery were informed in a letter from the district administration
that they had been authorized to hire an additional contract teacher, and that they were expected
New hires are supposed to go through a brief accelerated training program prior to
starting to teach, but this is imperfectly implemented in practice.
15 Kremer et al (2005) find that on any given working day, 25% of teachers are absent from schools across India, but only 1 head teacher in their sample of 3000 government schools had ever fired a teacher for repeated absence. The teacher absence rate in AP is almost exactly equal to the all-India average. See Kingdon and Muzammil (2002) for a descriptive study of the strength of teacher unions in India’s largest state. 16 The salary of contract teachers was Rs. 1,000/month in the first year of the project (2005 – 06) and was raised to Rs. 1,500/month in the second year (2006 – 07). 17 See Govinda and Yazali (2004) for a more detailed description of contract teacher appointment procedures across Indian states.
7
to follow the same procedures and guidelines for hiring a contract teacher as they would
normally do. The additional contract teachers were allocated to the school and not to a specific
grade or pre-specified role, which is also how teachers (regular and contract) are typically
allocated to primary schools.
Most schools (~80%) reported starting the process of hiring the extra contract teacher within
a week of receiving the notification and the modal selection committee consisted of three
members (the head teacher, a member of the local elected body, and another teacher). The most
important stated criterion for hiring the contract teacher was qualification (62%), followed by
experience and distance from the school (20% each). The additional contract teachers hired
under this program had the same average characteristics as typical contract teachers in the
comparison schools (Table 1 – Panel B), and so the intervention mimicked an expansion of the
existing contract teacher program in AP to 100 randomly selected schools.
2.3. Sampling and Randomization We sampled 5 districts across each of the 3 socio-cultural regions of AP in proportion to
population (Figure 1b). In each of the 5 districts, we randomly selected one division and then
randomly sampled 10 mandals in the selected division. In each of the 50 mandals, we randomly
sampled 10 schools using probability proportional to enrollment. Thus, the universe of 500
schools in the study was representative of the schooling conditions of the typical child attending
a government-run primary school in rural AP. Experimental results in this sample can therefore
be credibly extrapolated to the full state of Andhra Pradesh.
The extra contract teacher program was one of four policy options evaluated as part of a
larger education research initiative known as the Andhra Pradesh Randomized Evaluation
Studies (AP RESt),18 with 100 schools being randomly assigned to each of four treatment and
one control groups. The school year in AP starts in mid June, and baseline tests were conducted
in the 500 sampled schools during late June and early July, 2005.19
18 The AP RESt is a partnership between the government of AP, the Azim Premji Foundation (a leading non-profit organization working to improve primary education in India), and the World Bank to rigorously evaluate the effectiveness of several policy options to improve the quality of primary education in developing countries. The Azim Premji Foundation (APF) was the main implementing agency for the study.
After the baseline tests were
evaluated, the Azim Premji Foundation randomly allocated 2 out of the 10 project schools in
each mandal to one of 5 cells (four treatments and one control). Since 50 mandals were chosen
19 The selected schools were informed by the government that an external assessment of learning would take place in this period, but there was no communication to any school about any of the treatments at this time.
8
across 5 districts, there were a total of 100 schools (spread out across the state) in each cell. The
geographic stratification allows us to estimate the treatment impact with mandal-level fixed
effects and thereby net out any common factors at the lowest administrative level of government.
Since no school received more than one treatment, we can analyze the impact of each
program independently with respect to the control schools without worrying about any
confounding interactions. This analysis in this paper is based on the 200 schools that comprise
the 100 schools randomly chosen for the extra contract teacher (ECT) program and the 100 that
were randomly assigned to the comparison group. Table 2 (Panel A) shows summary statistics
of baseline school and student characteristics for both treatment and comparison schools, and we
see that the null of equality across treatment groups cannot be rejected for any of the variables.20
2.4. Data Collection
The data used in this paper comprise of independent learning assessments in math and
language (Telugu) conducted at the beginning of the study, and at the end of each of the two
years of the experiment. We also use data from regular unannounced “tracking surveys” made
by staff of the Azim Premji Foundation to measure process variables such as teacher attendance
and teaching activity.21
The tests used for this study were designed by India’s leading education testing firm and the
difficulty level of questions was calibrated in a pilot exercise to ensure adequate statistical
discrimination on the tests. The baseline test (June-July, 2005) covered competencies up to that
of the previous school year. At the end of the school year (March-April, 2006), schools had two
rounds of tests with a gap of two weeks between them. The first test covered competencies up to
that of the previous school year, while the second test covered materials from the current school
year's syllabus. The same procedure was repeated at the end of the second year, with two rounds
of testing. Doing two rounds of testing at the end of each year allows for the inclusion of more
overlapping materials across years of testing, reduces the impact of measurement errors specific
The treatment and comparison schools operated under identical
conditions of information and monitoring and only differed in the treatment that they received.
This ensures that Hawthorne effects are minimized and that a comparison between treatment and
control schools can accurately isolate the treatment effect.
20 Table 2 shows sample balance between the comparison schools and those that received an extra contract teacher, which is the focus of the analysis in this paper. The randomization was done jointly across all 5 treatments shown in Table 3.1, and the sample was also balanced on observables across the other treatments. 21 Six visits were made to each school in the first year (2005 – 06), while four visits were made in the second year (2006 – 07)

9
to the day of testing by having multiple tests around two weeks apart, and also reduces sample
attrition due to student absence on the day of the test.
For the rest of this paper, Year 0 (Y0) refers to the baseline tests in June-July 2005; Year 1
(Y1) refers to both rounds of tests conducted at the end of the first year of the program in March-
April, 2006; and Year 2 (Y2) refers to both rounds of tests conducted at the end of the second
year of the program in March-April, 2007. All analysis is carried out with normalized test
scores, where individual test scores are converted to z-scores by normalizing them with respect
to the distribution of scores in the control schools on the same test.22
3. Experimental Results
3.1. Teacher and Student Turnover and Attrition
Regular civil-service teachers in AP are transferred once every three years on average.
While this could potentially bias our results if more teachers chose to stay in or tried to transfer
into the ECT schools, it is unlikely that this was the case since the treatments were announced in
August ’05, while the transfer process typically starts earlier in the year. There was no
statistically significant difference between the treatment and comparison groups in the extent of
teacher turnover, and the turnover rate was close to 33%, which is consistent with rotation of
teachers once every 3 years (Table 2 – Panel B, rows 11-12).
As part of the agreement between the Government of AP and the Azim Premji Foundation,
the Government agreed to minimize transfers into and out of the sample schools for the duration
of the study. The average teacher turnover in the second year was only 6%, and once again,
there was no significant difference in teacher transfer rates across the various treatments (Table 2
– Panel B, rows 13 - 16).23
22 Since all analysis is done with normalized test scores (relative to the control school distribution), a student can be absent on one testing day and still be included in the analysis without bias because the included score normalized relative to the control school distribution for the same test that the student took.
The average student attrition rate in the sample (defined as the
fraction of students in the baseline tests who did not take a test at the end of each year) was 7.3%
and 25% in year 1 and year 2 respectively, but there is no significant difference in attrition across
the treatments (rows 17 and 20). Attrition is higher among students with lower baseline scores,
but this is true across all treatments, and we find no significant difference in mean baseline test
23 There was also a court order to restrict teacher transfers in response to litigation complaining that teacher transfers during the school year were disruptive to students. This may have also helped to reduce teacher transfers during the second year of the project.
10
score across treatment categories among the students who drop out from the test-taking sample
(Table 1 – Panel B, rows 18, 19, 21, 22).
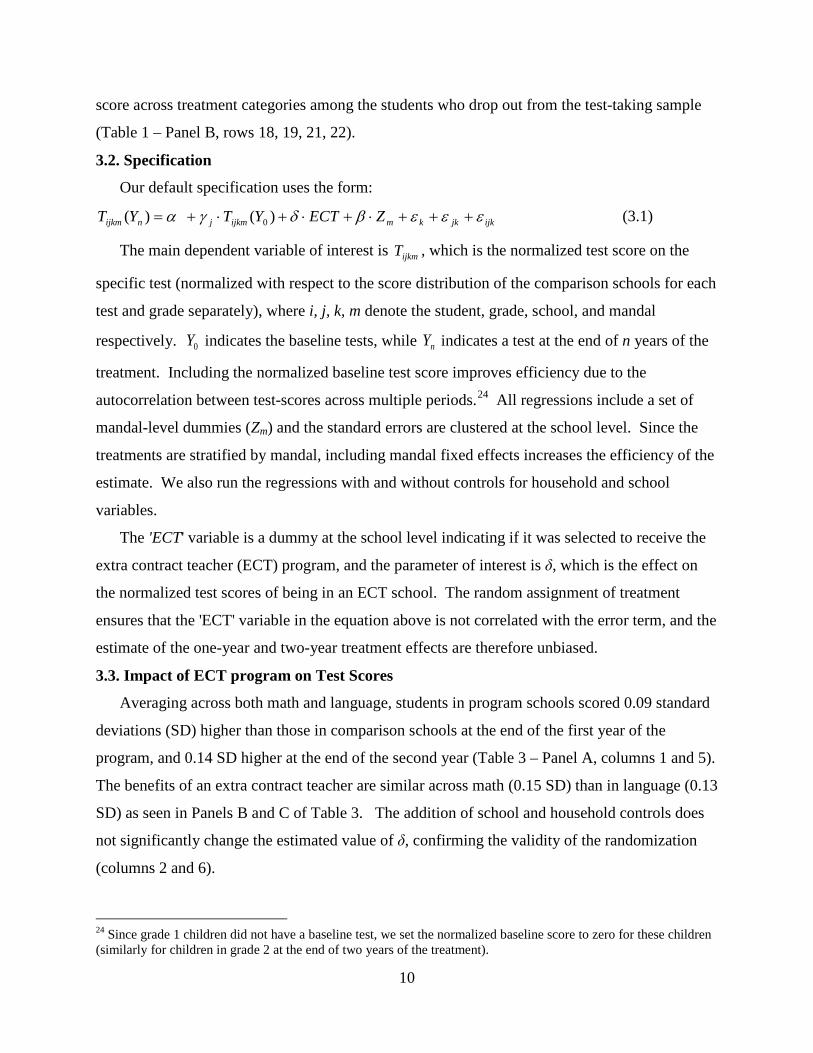
3.2. Specification
Our default specification uses the form:
ijkjkkmijkmjnijkm ZECTYTYT εεεβδγα +++⋅+⋅+⋅+= )()( 0 (3.1)
The main dependent variable of interest is ijkmT , which is the normalized test score on the
specific test (normalized with respect to the score distribution of the comparison schools for each
test and grade separately), where i, j, k, m denote the student, grade, school, and mandal
respectively. 0Y indicates the baseline tests, while nY indicates a test at the end of n years of the
treatment. Including the normalized baseline test score improves efficiency due to the
autocorrelation between test-scores across multiple periods.24
The 'ECT' variable is a dummy at the school level indicating if it was selected to receive the
extra contract teacher (ECT) program, and the parameter of interest is δ, which is the effect on
the normalized test scores of being in an ECT school. The random assignment of treatment
ensures that the 'ECT' variable in the equation above is not correlated with the error term, and the
estimate of the one-year and two-year treatment effects are therefore unbiased.
All regressions include a set of
mandal-level dummies (Zm) and the standard errors are clustered at the school level. Since the
treatments are stratified by mandal, including mandal fixed effects increases the efficiency of the
estimate. We also run the regressions with and without controls for household and school
variables.
3.3. Impact of ECT program on Test Scores
Averaging across both math and language, students in program schools scored 0.09 standard
deviations (SD) higher than those in comparison schools at the end of the first year of the
program, and 0.14 SD higher at the end of the second year (Table 3 – Panel A, columns 1 and 5).
The benefits of an extra contract teacher are similar across math (0.15 SD) than in language (0.13
SD) as seen in Panels B and C of Table 3. The addition of school and household controls does
not significantly change the estimated value of δ, confirming the validity of the randomization
(columns 2 and 6).
24 Since grade 1 children did not have a baseline test, we set the normalized baseline score to zero for these children (similarly for children in grade 2 at the end of two years of the treatment).

11
Column 3 of Table 3 shows the results of estimating equation (3.1) for the second-year effect
(with Y1 scores on the right-hand side). This is not an experimental estimate since the Y1
scores are a post-treatment outcome, but the point estimates suggest that the effect of the
program was almost identical across both years (0.09 SD in both years).25 However, the two-
year treatment effect of 0.14 SD is not the sum of these two effects because of depreciation of
prior gains. A more detailed discussion of depreciation (or the lack of full persistence) of test
score gains is beyond the scope of this paper, but the important point to note is that calculating
the average treatment effect by dividing the “n” year treatment effect by “n” years, will typically
underestimate the impact of the treatment beyond the first year relative to the counterfactual of
discontinuation of the treatment. On the other hand, if the effects of most educational
interventions fade out, then it is likely that extrapolating one-year treatment effects will typically
overstate the long-term impact of programs, which highlights the importance of carrying out
long-term follow ups of even experimental evaluations in order to do better cost-benefit
calculations.26
3.4. Heterogeneous treatment effects by grade
Disaggregating the treatment effects by grade, we find that children in the first grade in
treatment schools show the largest gains, scoring 0.20 SD and 0.29 SD better in the first and
second year respectively (Table 4 – columns 1 and 2). Given sampling variation, we must
exercise caution in inferring heterogeneous treatment effects, unless the same pattern is repeated
over multiple years. Finding the same results (of highest treatment effect for grade one) in both
years, therefore gives us confidence in the inference that the program had the greatest benefits
for students in grade 1.
Note, however, that the extra contract teacher is assigned to the school as opposed to a
specific class. Thus, the choice of how to assign the teacher is made at the school level and it
could have been possible that schools chose to reduce class sizes the most in grade 1. Table 5
25 Specifically the estimate of the “second year” treatment effect requires an unbiased estimate of γ, which cannot be consistently estimated in the above specification due to downward bias from measurement error and upward bias from omitted individual ability. Andrabi et al (2008) show that these biases roughly cancel out each other in their data from a similar context (primary education in Pakistan), and so we present the results of this specification as illustrative while focusing our discussion on the experimental estimates of one and two-year treatment effects. 26 The issue of persistence/depreciation of learning has only recently received attention in the literature on the effects of education interventions on test scores over multiple years. See Andrabi et al (2008) and Jacob et al (2008) for a more detailed discussion of issues involved with estimating the extent of persistence of interventions, and the implications for cost-benefit analysis.

12
shows the effective class size27
To better understand the mechanism for the results in Table 4, we estimate the correlation
between effective class size and student test score gains separately by grade, and find that the
impact of class size steadily declines as the grades increase (Table A1). These point estimates
are correlations and should not be interpreted as the causal effect of class size on learning gains,
but the results suggest that the there is a declining effect of class size on learning gains at higher
grades. The results in Table 5 and Table A1 suggest that the most likely mechanism for the
results in Table 4 is the possibility that the class-size reductions brought about by having an extra
contract teacher matter most for younger students.
experienced by students in each grade in both treatment and
comparison schools. We see that in most cases, there was a significant reduction in effective
class size for all grades in both years of the program, with the largest reductions being achieved
in grade 3. In the second year, we cannot reject the null hypothesis that the effective class size
reduction was the same in all grades. In the first year, we do reject the null and it appears that
most of the effective class size reductions were in grades 1 to 3 and not 4 and 5.
This result is consistent with the education production function proposed in Lazear (2001),
where the key insight is that classroom production of education is a public good where having a
disruptive child produces a negative spillover effect for the rest of the class. Thus, small classes
have greater benefits when the probability of having a disruptive child is higher. This is likely to
be the case for younger children – especially those who are coming to school for the first time, as
is the case with first grade students in Andhra Pradesh. Our results therefore provide empirical
support for the theory of education production proposed in Lazear (2001) if we assume that the
youngest children in primary school are likely to be most disruptive relative to their older peers
who have been acclimatized to the schooling environment. Our findings are also consistent with
Krueger (1999), who finds the largest benefits from small classes for students in grade 1 in the
Tennessee STAR class-size reduction experiment.
27 We use the term “effective class size” because of the common prevalence of multi-grade teaching whereby a single teacher simultaneously teaches more than one grade. Thus ECS in any school-grade combination is defined as the number of other students that a student in that school-grade simultaneously shares his/her teacher with. For example, consider a school with enrollment of 15, 20, 25, 15, and 15 in the five grades and with three teachers, with one teacher teaching grades 1 and 2, one teaching grade 3, and the last one teaching grades 4 and 5. In this case, the ECS in this school would be 35 in grades 1 and 2, 25 in grade 3, and 30 in grades 4 and 5.
13
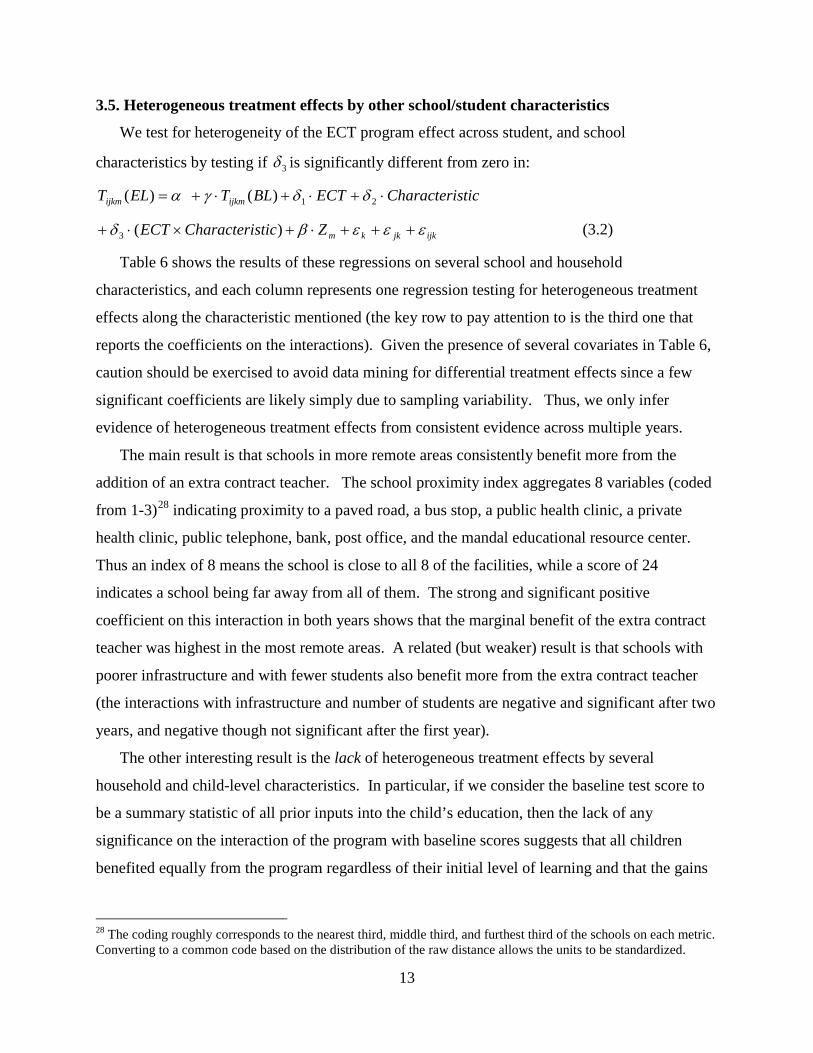
3.5. Heterogeneous treatment effects by other school/student characteristics
We test for heterogeneity of the ECT program effect across student, and school
characteristics by testing if 3δ is significantly different from zero in:
sticCharacteriECTBLTELT ijkmijkm ⋅+⋅+⋅+= 21)()( δδγα
ijkjkkmZsticCharacteriECT εεεβδ +++⋅+×⋅+ )(3 (3.2)
Table 6 shows the results of these regressions on several school and household
characteristics, and each column represents one regression testing for heterogeneous treatment
effects along the characteristic mentioned (the key row to pay attention to is the third one that
reports the coefficients on the interactions). Given the presence of several covariates in Table 6,
caution should be exercised to avoid data mining for differential treatment effects since a few
significant coefficients are likely simply due to sampling variability. Thus, we only infer
evidence of heterogeneous treatment effects from consistent evidence across multiple years.
The main result is that schools in more remote areas consistently benefit more from the
addition of an extra contract teacher. The school proximity index aggregates 8 variables (coded
from 1-3)28
The other interesting result is the lack of heterogeneous treatment effects by several
household and child-level characteristics. In particular, if we consider the baseline test score to
be a summary statistic of all prior inputs into the child’s education, then the lack of any
significance on the interaction of the program with baseline scores suggests that all children
benefited equally from the program regardless of their initial level of learning and that the gains
indicating proximity to a paved road, a bus stop, a public health clinic, a private
health clinic, public telephone, bank, post office, and the mandal educational resource center.
Thus an index of 8 means the school is close to all 8 of the facilities, while a score of 24
indicates a school being far away from all of them. The strong and significant positive
coefficient on this interaction in both years shows that the marginal benefit of the extra contract
teacher was highest in the most remote areas. A related (but weaker) result is that schools with
poorer infrastructure and with fewer students also benefit more from the extra contract teacher
(the interactions with infrastructure and number of students are negative and significant after two
years, and negative though not significant after the first year).
28 The coding roughly corresponds to the nearest third, middle third, and furthest third of the schools on each metric. Converting to a common code based on the distribution of the raw distance allows the units to be standardized.

14
from the program were quite broad. Similarly, there was no difference in program effectiveness
based on household affluence, parental literacy, caste, and gender of the child.
3.6. Differences in Teacher Effort by Contract Status
Table 7 – Panel A shows that contract teachers had significantly lower levels of absence
compared to regular teachers (16.3% versus 26.8% on average over two years), with the
difference being higher in the second year (12%) compared to the first year (9%). Contract
teachers also had higher rates of teaching activity compared to regular teachers (49% versus
43%), though these numbers are easier to manipulate than the absence figures, because it is
easier for an idle teacher to start teaching when he/she sees an enumerator coming to the school
than for an absent teacher to materialize during a surprise visit to the school.
These differences in rates of absence and teaching activity are even higher with school fixed
effects, suggesting that the presence of the contract teachers may have induced regular teachers
to shirk a little more. We can test this directly by comparing the absence rates of regular
teachers in comparison schools with those in program schools and we see that regular teachers in
program schools do have higher rates of absence and lower rates of teaching activity than their
counterparts in comparison schools (Table 7 – Panel B), and that these differences are significant
when aggregated across both years of the program.
Thus, we see that contract teachers show significantly superior performance on measures
such as attendance and teaching activity. This could be due to a combination of being from the
local area and feeling more connected to the community, living much closer to the school and
therefore having lower marginal costs of attendance, or the superior incentives from being on
annually renewable contracts without the job security of civil-service tenure.
We find some suggestive evidence of the last point by looking at the correlates of renewal of
the contract teachers. On average, less than 50% of contract teachers stay in the sample from
one year to the next (Table A2 - Panel A), and thus, contract renewal is by no means certain. We
correlate the probability of contract renewal with both measures of teacher performance
(attendance and teaching activity) and measures of teacher qualifications (education and training)
and find that teachers with lower absence rates are more likely to have their contracts renewed
(Table A2 – Panel B). The regressions in Table A2 are only suggestive because we do not
observe the “decision to renew” an individual teacher’s contract conditional on re-application for
the job, but only observe if the same contract teacher is still in the school the next year. So the
15
results confound renewal applications and renewal decisions and should not be interpreted
causally (for instance, teachers who know that they plan to leave next year may be more absent),
but they are suggestive that performance-contingent contract renewal may be a source of
superior incentives for contract teachers.
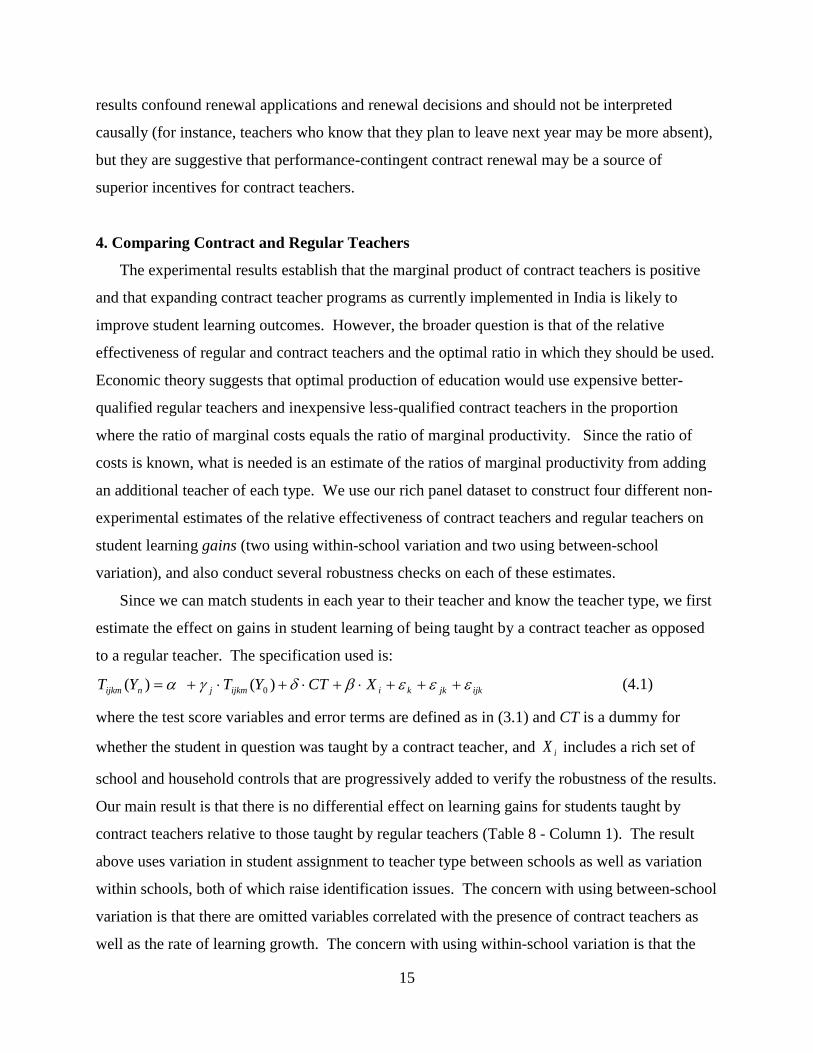
4. Comparing Contract and Regular Teachers
The experimental results establish that the marginal product of contract teachers is positive
and that expanding contract teacher programs as currently implemented in India is likely to
improve student learning outcomes. However, the broader question is that of the relative
effectiveness of regular and contract teachers and the optimal ratio in which they should be used.
Economic theory suggests that optimal production of education would use expensive better-
qualified regular teachers and inexpensive less-qualified contract teachers in the proportion
where the ratio of marginal costs equals the ratio of marginal productivity. Since the ratio of
costs is known, what is needed is an estimate of the ratios of marginal productivity from adding
an additional teacher of each type. We use our rich panel dataset to construct four different non-
experimental estimates of the relative effectiveness of contract teachers and regular teachers on
student learning gains (two using within-school variation and two using between-school
variation), and also conduct several robustness checks on each of these estimates.
Since we can match students in each year to their teacher and know the teacher type, we first
estimate the effect on gains in student learning of being taught by a contract teacher as opposed
to a regular teacher. The specification used is:
ijkjkkiijkmjnijkm XCTYTYT εεεβδγα +++⋅+⋅+⋅+= )()( 0 (4.1)
where the test score variables and error terms are defined as in (3.1) and CT is a dummy for
whether the student in question was taught by a contract teacher, and iX includes a rich set of
school and household controls that are progressively added to verify the robustness of the results.
Our main result is that there is no differential effect on learning gains for students taught by
contract teachers relative to those taught by regular teachers (Table 8 - Column 1). The result
above uses variation in student assignment to teacher type between schools as well as variation
within schools, both of which raise identification issues. The concern with using between-school
variation is that there are omitted variables correlated with the presence of contract teachers as
well as the rate of learning growth. The concern with using within-school variation is that the

16
assignment of teachers to students is endogenous to the school. While these concerns are
substantially mitigated by our controlling for baseline scores (which are the best summary
statistic of cumulative education inputs prior to the start of the study)29
We first shut down the between-school variation by estimating the equation above with
school fixed effects (i.e. - we use only within-school variation) and find that the point estimate is
practically unchanged (Table 8 - Column 2). The identifying variation now comes from children
within the same school being assigned to different types of teachers. Since the typical school
has 2 to 3 teachers across 5 grades, it is almost never the case that there are multiple sections per
grade. This eliminates one important threat to identification since students are not tracked and it
is not the case that teachers are assigned to sections based on unobservable characteristics.
, we do more to address
these concerns below.
30
The remaining concern is that there are systematic differences across grades assigned to
different teacher types. We include a rich set of school and household controls (class size, a
dummy for multi-grade teaching, household affluence, and parental education in addition to
baseline scores - which are included in all specifications) and find that there is still no significant
difference between contract and regular teachers (Table 8 - Column 3). A final robustness check
is that we estimate the same three specifications in the sample of treatment schools only
(Columns 4-6) and find the same result. Since the treatment was assigned randomly among a
representative sample of schools, this sample comes closest to estimating the relative effects of
the two teacher types in the context of an across the board expansion of the use of contract
teachers. Note also that the large sample size and the inclusion of baseline scores means that the
zero effects are quite precisely estimated and it is not the case that we are refusing to reject the
null because of wide confidence intervals. While the result of no differential effect by teacher
type is robust to the procedures above, we cannot rule out the possibility that there may still be
omitted variables correlated with teacher assignment to cohorts and potential test score gains.
One way of addressing this concern is to consider the sample of students who switch from
one teacher type to the other during their regular progression through school. We do this and
estimate the differential impact of teacher type using student fixed-effects and still find that there
is no difference between regular and contract teachers (Table 9 - Column 1). The results are
29 Trying to infer teacher quality without controlling for baseline scores is quite problematic because such a specification would attribute to a given the teacher the cumulative contributions to learning of all past teachers. 30 See Rothstein (2010) for an illustration of this concern in value-added modeling.
17
robust to including class size and a dummy for multi-grade teaching (Table 9 - Column 2).
Finally, given that teachers get re-assigned on a periodic basis, a further robustness check is to
restrict the estimation sample to cases where the same teacher was assigned to the same grade in
both years (i.e. the identifying variation comes from a cohort of students moving across teachers
who are fixed in specific grades, and thus teachers in this sample cannot be getting re-assigned
on the basis of cohort-level unobservables) and we again find no difference between teacher
types (Table 9 - Column 3). As in Table 8, we conduct a final robustness check by carrying out
all three estimations in the treatment schools only (Columns 4-6) and find the same result. While
truncating the sample may increase the probability of not rejecting the null, note again that the
use of student fixed effects and the inclusion of baseline scores means that we have very
precisely estimated zero effects.
While, the estimates in Tables 8 and 9 use within-school variation, we can also estimate the
impact of contract teachers using only between-school variation. The first advantage of this
approach is that we don't have to worry about endogenous assignment of teachers to grades and
the second one is that policy makers can only assign a teacher to a school and cannot typically
prevent schools from reassigning additional teacher resources as they see fit. Thus, the most
relevant policy question is the relative impact of adding a contract teacher to a school versus that
of adding a regular teacher to a school.
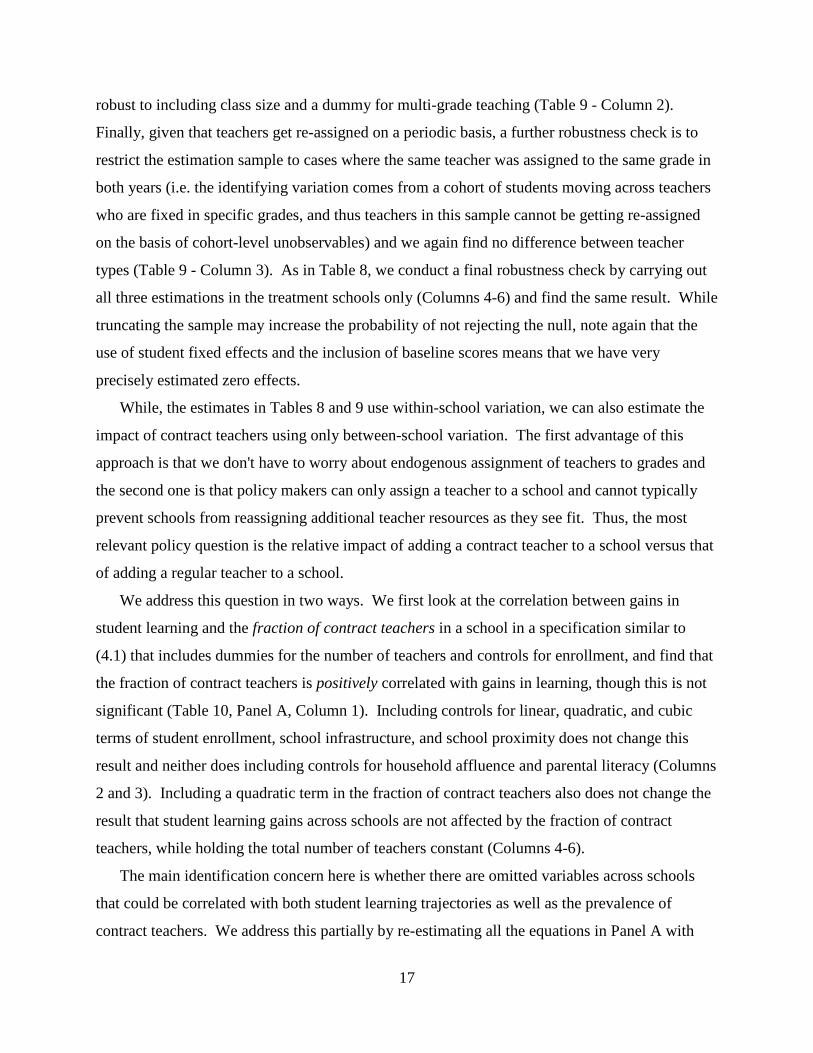
We address this question in two ways. We first look at the correlation between gains in
student learning and the fraction of contract teachers in a school in a specification similar to
(4.1) that includes dummies for the number of teachers and controls for enrollment, and find that
the fraction of contract teachers is positively correlated with gains in learning, though this is not
significant (Table 10, Panel A, Column 1). Including controls for linear, quadratic, and cubic
terms of student enrollment, school infrastructure, and school proximity does not change this
result and neither does including controls for household affluence and parental literacy (Columns
2 and 3). Including a quadratic term in the fraction of contract teachers also does not change the
result that student learning gains across schools are not affected by the fraction of contract
teachers, while holding the total number of teachers constant (Columns 4-6).
The main identification concern here is whether there are omitted variables across schools
that could be correlated with both student learning trajectories as well as the prevalence of
contract teachers. We address this partially by re-estimating all the equations in Panel A with
18
mandal (sub-district) fixed effects in Panel B and report that there is still no correlation between
the fraction of contract teachers in a school and student learning gains.31
Finally, we consider the impact of school-level pupil-teacher ratio (PTR) on learning
outcomes and study the differential impact of reducing PTR with a regular teacher and with a
contract teacher. We first restrict our analysis sample to the control schools that don’t have any
contract teacher and the treatment schools with exactly one contract teacher (i.e. schools that
would not have had a contract teacher but for the experiment).
Recall from the
discussion of sampling that the total sample of 200 schools consists of 4 schools in each of 50
mandals across the state (with two treatment and two control schools in each mandal). Thus,
estimating with mandal fixed effects eliminates concerns of omitted variables across
administrative jurisdictions and is identified using variation within the lowest administrative unit
in the state (sub-districts). Finally, note that the addition of school fixed effects in Table 8 did
not change the estimate of the “contract teacher effect”, which suggests that the between-school
variation in the prevalence of contract teachers is not correlated with omitted variables that may
also account for differential learning growth trajectories across schools.
32
ijkjkkinijkmjnijkm XPTRredPTRYTYT εεεδββγα +++⋅+⋅+⋅+⋅+= − log__log_)()( 211
We calculate PTR (and
log_PTR) in these schools using regular teachers only (i.e. for treatment schools – this would be
the counterfactual PTR had they not received the treatment), and then calculate the reduction in
log_PTR in the treatment schools caused by the addition of the extra (randomly assigned)
contract teacher. We include both the original log_PTR (using regular teachers only) and the
reduction in log_PTR (red_log_PTR) induced by the provision of the extra contract teacher as
regressors in the specification:
(4.2)
Thus unlike in section 3 where the treatment is a binary variable, the treatment indicator here
(red_log_PTR) is allowed to vary to reflect the marginal impact of the extra contract teacher on
PTR, which will vary depending on the initial PTR in the school and be zero for the control
schools. The point estimates suggest that reducing PTR with an extra contract teacher is almost
twice as effective in improving student learning than reducing PTR with an extra regular teacher
31 Note that the combined effect of the linear and quadratic terms yield a positive point estimate for the correlation between the percentage of contract teachers and student learning gains for most values of the percentages of contract teachers, but this positive estimate is not significant (this is also true for the specification in Table 9, Panel B, Column 4 coefficients are significant, the combined effect is insignificant at all values of the percentage of contract teachers. 32 This includes around 70% of the sample since around 30% of the schools had a contract teacher to begin with.
19
(0.34 versus 0.18) though this difference is not significant (Table 11, Panel A, Column 2). We
also estimate (4.2) with log_PTR and with red_log_PTR one at a time and verify that the point
estimates of 1β and 2β are unchanged confirming the validity of the experiment ( 1β is unchanged
between columns 1 and 2, and 2β is unchanged between columns 2 and 3 of Table 11).
Since we have an unbiased experimental estimate of 2β , the identification concerns are with
respect to 1β , which is estimated using non-experimental between-school variation. We apply
the same robustness checks as in Table 10 and include the same rich set of school and household
controls, and find that 1β is close to unchanged ( 2β of course remains unchanged as it’s an
experimental estimate). Finally, we extend the analysis to the full sample of schools in Panel B
of Table 11, where the only difference is that the regressors include log_PTR based on regular
teachers only (in all schools), the reduction in log_PTR using the non-experimental contract
teacher (in schools that already had one prior to the experimental intervention), and finally
include the reduction in log_PTR induced by the experimentally-provided extra contract teacher.
The results in Table 11, Panel B are similar to those in Panel A and we find again that reducing
PTR with an extra contract teacher is around twice as effective in improving student learning
than reducing PTR with an extra regular teacher (0.33 versus 0.15) though this difference is not
significant. We run all the specifications in Table 12 with mandal (sub-district) fixed effects and
the results on relative teacher effectiveness are unchanged (tables available on request). While
the results in Table 11 don’t eliminate all identification concerns, the estimate of 1β would have
to more than triple in magnitude to conclude that 21 ββ > , which is highly unlikely since
including a full set of controls barely changes the estimate of 1β .
While identification concerns are not fully eliminated, finding the same result with four
different estimation methods (Tables 8 to 11), and finding the result to be robust to the inclusion
of rich school and household covariates as well as school and student fixed effects, increases our
confidence in concluding that contract and regular teachers are equally effective in improving
primary school learning outcomes. One limitation of this analysis is that there are several ways
in which contract and regular teachers are different (see Table 1) and we do not decompose the
relative importance of these factors in teacher effectiveness, since there is no identifying
variation for the individual components in Table 1. Thus, we focus on the overall comparison of

20
the two different types of teachers being used in the status quo and conclude that they appear to
be equally effective.
One additional concern in making this comparison is that we are comparing the marginal
contract teacher with the average regular teacher (since the majority of contract teachers in our
estimation are hired as result of the intervention). Thus, the relevant comparison for teacher
hiring is between a contract teacher and a new regular teacher. We address this by re-estimating
(4.1) in three further estimation samples, restricting the regular teacher sample to those who have
been teaching for less than three, five, and ten years respectively, and again do not reject the null
of equal effectiveness in all three estimation samples. Since regular teachers cost around five
times more than contract teachers33
, our results suggest that expanding the use of contract
teachers may be a highly cost effective way of improving learning outcomes.
5. Public and Private Production of Education
A prominent feature of primary education in India over the past ten years has been the rapid
increase in the number of private schools (Muralidharan and Kremer, 2008) catering to an
increasing number of students with nearly 20% of primary school students in rural Andhra
Pradesh attending a fee-charging private school (Pratham, 2010). Since fee-charging private
schools need to compete against free public schools as well as other fee-charging schools for
students and also need to compete for teachers (and their characteristics), they are likely to face
better incentives than public schools to operate close to the efficient frontier of education
production, where the desired quality of education is produced at the lowest possible cost.
As part of an ongoing study of school vouchers and choice, we also collected detailed data on
teachers in private schools in the same five districts where the current study was conducted, and
Table 12 compares regular teachers, contract teachers, and private school teachers (sampled from
the same villages)34
33 Reasons for this wage premium are likely to include higher education (and corresponding outside opportunities), a compensating differential to locate to remote areas (since most regular teachers live in cities), a union/civil-service premium, and other inefficiencies in the wage-setting process for public employees. We don’t aim to decompose the wage premium in this discussion, but focus on the optimal ratio of expensive highly-qualified and inexpensive less-qualified teachers.
on a range of characteristics. The age and gender profile of private school
34 Note that this is a different sample from that used in Table 1. The sample in Table 1 is representative of rural government-run schools, which is the focus of this paper; the sample in Table 12 is from a sample of villages that have private schools (which tend to be larger). The data for Table 12 was also collected 3 years later than the data used for Table 1. AP government policies on contract teacher salaries now provides for some differentiation by education and experience, which accounts for the distribution in Figure 2.
21
teachers are similar to those of contract teachers (younger and more likely to be female than
regular teachers). Private school teachers have higher levels of general education, but even
lower levels of teacher training than contract teachers. They live much closer to the school and
are more likely to be from the same village relative to regular teachers (though less so than
contract teachers).
But, the most relevant comparison is that the salaries of private school teachers are even
lower than those of contract teachers and only around an eighth of regular teacher salaries.
Figure 2 plots the salary distribution of teachers in government and private schools, and we see
that the distribution of salaries in private schools is around the range of the contract teachers’
salaries, and there is almost no common support between distributions of private and regular
public school teacher salaries. Finally, private school teachers and contract teachers have
similarly low rates of absence, which are around half that of the regular teachers in spite of being
paid much lower salaries.
The private school data helps clarify the context of teacher labor markets in rural India and
provides important guidance for thinking about expanding the use of contract teachers in
government schools. First, the employment terms of contract teachers are not ‘exploitative’ as
believed by opponents of their use, but in line with the market clearing wage paid by private
schools. While their terms might seem exploitative when working side by side with regular
teachers and doing the same work for a fraction of the salary, the distortion is not the ‘low’
contract teacher salaries but rather the large rents accruing to regular teachers.35
Second, the policy-relevant question is not the comparison of one regular teacher to one
contract teacher (which is what the literature as well as the policy discussions have focused on),
but rather the comparison of one regular teacher to several contract teachers. In earlier work by
one of the authors, we find that while private schools pay much lower teacher salaries than what
the government pays regular teachers, they also hire many more teachers per student and have
pupil teacher ratios that are around a third that of the public schools in the same village
(Muralidharan and Kremer, 2008). Thus it appears that an unconstrained producer of primary
education services would pay salaries that are close to that of contract teachers, but hire many
more teachers. To the extent that the input combination used by private schools is likely to be
35 The existence of rents for regular teachers can also be inferred from the heavy over-subscription for these jobs whenever the government hires additional teachers (with the number of applicants typically being at least 10 times the number of open positions).

22
closer to the efficient frontier of education production, expanding the use of contract teachers in
government-run schools may be a way of moving public production of education closer to the
efficient frontier.
Third, since private schools are able to fill their teacher positions with salaries that are even
lower than those of contract teachers, an expansion of contract teacher hiring is unlikely to hit a
supply constraint at current salary levels.36 Also, none of the 100 treatment schools in our
experiment reported any difficulty in filling the position and the majority of positions were filled
within 2 weeks from the start of the search. More broadly, the pool of educated but unemployed
rural high-school and college graduates from which contract and private school teachers are
hired appears to be large enough for the labor supply of contract teachers to be fairly elastic
(Kingdon and Sipahimalani-Rao, 2010).37
6. Conclusion
Regular teachers in India are highly qualified, but command a substantial wage premium
(greater than a factor of five) over the market clearing wage of private school (and contract)
teachers that can be explained partly by their better education and outside opportunities, partly
by a compensating differential to locate to rural and remote areas, and partly by a union and
civil-service premium. The hiring of contract teachers can be a much more cost-efficient way of
adding teachers to schools because none of these three sources of wage premiums are applicable
for them. However, since locally-hired contract teachers are not as qualified or trained as civil-
service teachers, opponents of the use of the contract teachers have posited that the use of
contract teachers will not lead to improved learning.
We present experimental evidence from an “as is” expansion of the existing contract teacher
policy of the government of Andhra Pradesh, implemented in a randomly selected subset of 100
schools among a representative sample of schools in rural AP. We find that adding a contract
teacher significantly improved average learning outcomes in treatment schools, and especially
36 One caveat is that equally qualified teachers may be willing to accept a lower salary in private schools if there are other compensating differentials like being able to teach more motivated students. However, private schools also compete with other private schools for teachers and so the market wage for private school teachers reflects competition even among the non-monetary dimensions of the job. 37 Another contributing factor may be that limited job opportunities for educated rural women (who have cultural and family preferences for working in the same village) within the village may be providing a subsidy to the teaching sector (Andrabi et al, 2007). Similar patterns have been documented in the history of education in developed countries.

23
benefited the children in the first grade (the first year of formal schooling since there is no
kindergarten) and those in more remote areas. We also find using four different non-
experimental estimation procedures that contract teachers are no less effective in improving
student learning than regular teachers who are more qualified, better trained, and paid five times
higher salaries.
The combination of low cost, superior performance measures than regular teachers on
attendance and teaching activity, and positive program impact suggest that expanding the use of
contract teachers could be a highly cost effective way of improving primary education outcomes
in developing countries. In particular, expensive policy initiatives to get highly qualified
teachers to remote areas may be much less cost effective than hiring several local contract
teachers to provide much more attention to students at a similar cost. Observing the input
choices of private schools suggests that this is what a politically unconstrained producer of rural
education services would do. Another way of thinking about the inefficiency in the status quo is
to consider the teacher hiring choices that a locally-elected body responsible for delivering
primary education would make. Informal interviews with elected village leaders suggest that
they would almost always choose to hire several local teachers as opposed to one or two civil-
service teachers who are not connected to the community (though this is the de facto choice
made for them under the status quo).
Opponents of the use of contract teachers worry that their expanded use may lead to a
permanent second-class citizenry of contract teachers, which in the long-run will erode the
professional spirit of teaching and shift the composition of the teacher stock away from trained
teachers towards untrained teachers. Thus, even if expanding the use of contract teachers is
beneficial in the short run, it might be difficult to sustain a two-tier system of teachers in the long
run. Finally, the political economy concern is that hiring larger numbers of contract teachers will
lead to demands to be regularized which may be politically difficult to resist given the strengths
of teacher unions and if such regularization were to happen, it would defeat the purpose of hiring
a large number of contract teachers in the first place.
One possible course of action is to hire all new teachers as contract teachers at the school-
level, and create a system to measure their performance over a period of time (six to eight years
for example) that would include inputs from parents, senior teachers, and measures of value

24
addition using independent data on student performance.38
The perception that contract teachers are of inferior quality and that their use is a stop-gap
measure to be eliminated by raising education spending enough to hire regular teachers is deeply
embedded in the status quo education policy discourse (and has been formalized in the recently
passed “Right to Education” Act of the Indian Parliament).
These measures of performance
could be used in the contract-renewal decision at the end of each fixed-term contract (or to pay
bonuses), and consistently high-performing contract teachers could be promoted to regular civil-
service rank at the end of a fixed period of time. In other words, contract teachers need not be
like permanent adjunct faculty, but can be part of a performance-linked tenure track. Continuous
training and professional development could be a natural component of this career progression,
and integrating contract and regular teachers into a career path should help to address most of the
concerns above, including the political economy ones.
39 The evidence in this paper suggests
that expanding the use of highly-paid regular teachers with limited accountability might be
moving in exactly the wrong direction. The use of locally-hired teachers on fixed-term
renewable contracts can be a highly effective policy for improving student learning outcomes
(especially since many more such teachers can be hired for a given budget). While there are
valid concerns about the long-term consequences of expanding contract teacher programs, many
of these can be addressed by placing the increased use of contract teachers in the context of a
long-term professional career path that allows for continuous training and professional
development, and rewards effort and effectiveness at all stages of a teaching career. Pritchett
and Murgai (2007) provide a practical discussion of how such a system may be implemented in
practice, and is an excellent policy-focused complement to this paper.40
38 Gordon et al (2006) provide a similar recommendation for the US (as part of the Hamilton Project) on identifying effective teachers through measuring their on the job performance. In related work, we show that even small amounts of performance-linked pay for teachers based on measures of value addition led to substantial improvements in student learning, with no negative consequences (Muralidharan and Sundararaman, 2009).
39 This belief is not limited to India and is widespread in education policy discourse in most countries. For example, the Indonesian government passed a law in 2005 to require all teachers to get certified and offered a doubling of salary for certified teachers. The law also provides for a 100% salary supplement to certified teachers who serve in remote and underserved areas. 40 Pritchett and Murgai (2007) discuss how such a structured career leader for teachers can be embedded within a more decentralized education system that provides local communities more autonomy on managing schools. Pritchett and Pande (2006) provide a related discussion on decomposing education management into components and suggesting appropriate levels of decentralization for each component based on theoretical principles of fiscal federalism. The recommendation for a career ladder is also made by Kingdon and Sipahimalani-Rao (2010).
25
REFERENCES:
ANDRABI, T., J. DAS, and A. KHWAJA (2007): "Students Today, Teachers Tomorrow? Identifying Constraints on the Provision of Education," Harvard University.
ANDRABI, T., J. DAS, A. KHWAJA, and T. ZAJONC (2008): "Do Value-Added Estimates Add Value: Accounting for Learning Dynamics," Harvard University.
ANGRIST, J. D., and V. LAVY (1999): "Using Maimonides' Rule to Estimate the Effect of Class Size on Scholastic Achievement," Quarterly Journal of Economics, 114, 533-75.
BALLOU, D. (1996): "Do Public Schools Hire the Best Applicants?," Quarterly Journal of Economics, 111, 97-133.
BANERJEE, A., S. COLE, E. DUFLO, and L. LINDEN (2007): "Remedying Education: Evidence from Two Randomized Experiments in India," Quarterly Journal of Economics, 122, 1235-1264.
BARDHAN, P. (2002): "Decentralization of Governance and Development," Journal of Economic Perspectives, 16, 185-205.
BLOOM, N., and J. VAN REENEN (2010): "Why Do Management Practices Differ across Firms and Countries?," Journal of Economic Perspectives, 24, 203-224.
BOURDON, J., M. FRÖLICH, and K. MICHAELOWA (2006): "Broadening Access to Primary Education: Contract Teacher Programs and Their Impact on Education Outcomes in Africa – an Econometric Evaluation for Niger," in Pro-Poor Growth: Issues, Policies, and Evidence, ed. by L. Menkhoff. Berlin: Duncker & Humblot, 117-149.
— (2007): "Teacher Shortages, Teacher Contracts and Their Impact on Education in Africa," Institute for the Study of Labor (IZA), Berlin.
DARLING-HAMMOND, L. (2001): "The Research and Rhetoric on Teacher Certification: A Response To "Teacher Certification Reconsidered"," Education Policy Analysis Archives, 10.
DE LAAT, J., and E. VEGAS (2005): "Do Differences in Teacher Contracts Affect Student Performance? Evidence from Togo," World Bank.
DUFLO, E., P. DUPAS, and M. KREMER (2009): "Additional Resources Versus Organizational Changes in Education: Experimental Evidence from Kenya," MIT.
DUTHILLEUL, Y. (2005): "Lessons Learnt in the Use of 'Contract' Teachers," International Institute for Educational Planning, UNESCO.
GORDON, R., T. KANE, and D. STAIGER (2006): "Identifying Effective Teachers Using Performance on the Job," Washington DC: The Brookings Institution.
GOVINDA, R., and J. YAZALI (2004): "Para-Teachers in India: A Review," New Delhi: National Institute of Educational Planning and Administration.
HANUSHEK, E. A. (1999): "The Evidence on Class Size," in Earning and Learning: How Schools Matter, ed. by S. Mayer, and P. Peterson. Washington DC: Brookings Institution.
— (2002): "Publicly Provided Education," in Handbook of Public Economics, ed. by A. J. Auerbach, and M. S. Feldstein. Amsterdam: North-Holland, 2045-2141.
— (2003): "The Failure of Input-Based Schooling Policies," Economic Journal, 113, F64-98. HECKMAN, J., and J. SMITH (1995): "Assessing the Case of Social Experiments," Journal of
Economic Perspectives, 9, 85-110. JACOB, V., A. KOCHAR, and S. REDDY (2008): "School Size and Schooling Inequalities,"
Stanford.

26
KANE, T. J., J. E. ROCKOFF, and D. O. STAIGER (2008): "What Does Certification Tell Us About Teacher Effectiveness? Evidence from New York City," Economics of Education Review, 27, 615-631.
KINGDON, G. G., and M. MUZAMMIL (2001): "A Political Economy of Education in India: The Case of U.P.," Economic and Political Weekly, 36.
KINGDON, G. G., and V. SIPAHIMALANI-RAO (2010): "Para-Teachers in India: Status and Impact," Economic and Political Weekly, XLV, 59-67.
KLEINER, M. (2000): "Occupational Licensing," Journal of Economic Perspectives, 14, 189-202. KRUEGER, A. (1999): "Experimental Estimates of Education Production Functions," Quarterly
Journal of Economics, 114, 497-531. — (2003): "Economic Considerations and Class Size," Economic Journal, 113, 34-63. KUMAR, K., M. PRIYAM, and S. SAXENA (2005): "The Trouble with Para-Teachers," Frontline,
18. LAZEAR, E. (2001): "Educational Production," Quarterly Journal of Economics, 116, 777-803. MEHTA, A. (2007): "Elementary Education in India: Where Do We Stand? State Report Cards
2005-06," New Delhi: National University of Education Planning and Administration. MURALIDHARAN, K., and M. KREMER (2008): "Public and Private Schools in Rural India," in
School Choice International, ed. by P. Peterson, and R. Chakrabarti. Cambridge: MIT. MURALIDHARAN, K., and V. SUNDARARAMAN (2009): "Teacher Performance Pay: Experimental
Evidence from India," National Bureau of Economic Research Working Paper 15323. PRATHAM (2008): Annual Status of Education Report. PRITCHETT, L. (2004): "Access to Education," in Global Crises, Global Solutions, ed. by B.
Lomborg, 175-234. PRITCHETT, L., and R. MURGAI (2007): "Teacher Compensation: Can Decentralization to Local
Bodies Take India from Perfect Storm through Troubled Waters to Clear Sailing?," in India Policy Forum 2006-07, ed. by S. Bery, B. Bosworth, and A. Panagariya: Sage Publications.
PRITCHETT, L., and V. PANDE (2006): "Making Primary Education Work for India's Rural Poor: A Proposal for Effective Decentralization," New Delhi: World Bank.
RIVKIN, S. G., E. A. HANUSHEK, and J. F. KAIN (2005): "Teachers, Schools, and Academic Achievement," Econometrica, 73, 417-58.
ROCKOFF, J. E. (2004): "The Impact of Individual Teachers on Student Achievement: Evidence from Panel Data," American Economic Review, 94, 247-252.
ROTHSTEIN, J. (2010): "Teacher Quality in Educational Production: Tracking, Decay, and Student Achievement," Quarterly Journal of Economics, 125, 175-214.
SAWADA, Y., and A. RAGATZ (2005): "Decentralization of Education, Teacher Behavior, and Outcomes: The Case of El Salvador’s Educo Program," in Incentives to Improve Teaching: Lessons from Latin America, ed. by E. Vegas. Washington DC: The World Bank.
URQUIOLA, M. (2006): "Identifying Class Size Effects in Developing Countries: Evidence from Rural Bolivia," Review of Economics and Statistics, 88, 171-177.
WALSH, K. (2001): "Teacher Certification Reconsidered: Stumbling for Quality," Baltimore: Abell Foundation.
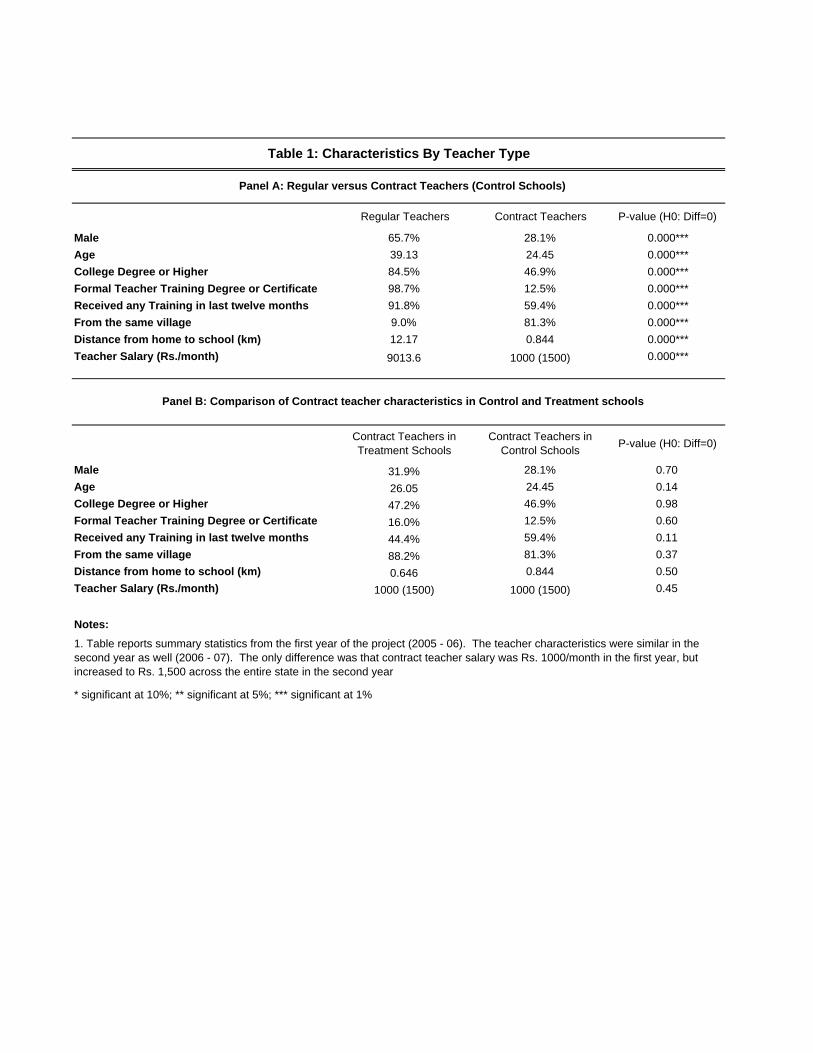
Regular Teachers Contract Teachers P-value (H0: Diff=0)
Male 65.7% 28.1% 0.000***
Age 39.13 24.45 0.000***
College Degree or Higher 84.5% 46.9% 0.000***
Formal Teacher Training Degree or Certificate 98.7% 12.5% 0.000***
Received any Training in last twelve months 91.8% 59.4% 0.000***
From the same village 9.0% 81.3% 0.000***
Distance from home to school (km) 12.17 0.844 0.000***
Teacher Salary (Rs./month) 9013.6 1000 (1500) 0.000***
Contract Teachers in Treatment Schools
Contract Teachers in Control Schools
P-value (H0: Diff=0)
Male 31.9% 28.1% 0.70
Age 26.05 24.45 0.14
College Degree or Higher 47.2% 46.9% 0.98
Formal Teacher Training Degree or Certificate 16.0% 12.5% 0.60
Received any Training in last twelve months 44.4% 59.4% 0.11
From the same village 88.2% 81.3% 0.37
Distance from home to school (km) 0.646 0.844 0.50
Teacher Salary (Rs./month) 1000 (1500) 1000 (1500) 0.45
Notes:
* significant at 10%; ** significant at 5%; *** significant at 1%
Table 1: Characteristics By Teacher Type
Panel A: Regular versus Contract Teachers (Control Schools)
Panel B: Comparison of Contract teacher characteristics in Control and Treatment schools
1. Table reports summary statistics from the first year of the project (2005 - 06). The teacher characteristics were similar in the second year as well (2006 - 07). The only difference was that contract teacher salary was Rs. 1000/month in the first year, but increased to Rs. 1,500 across the entire state in the second year
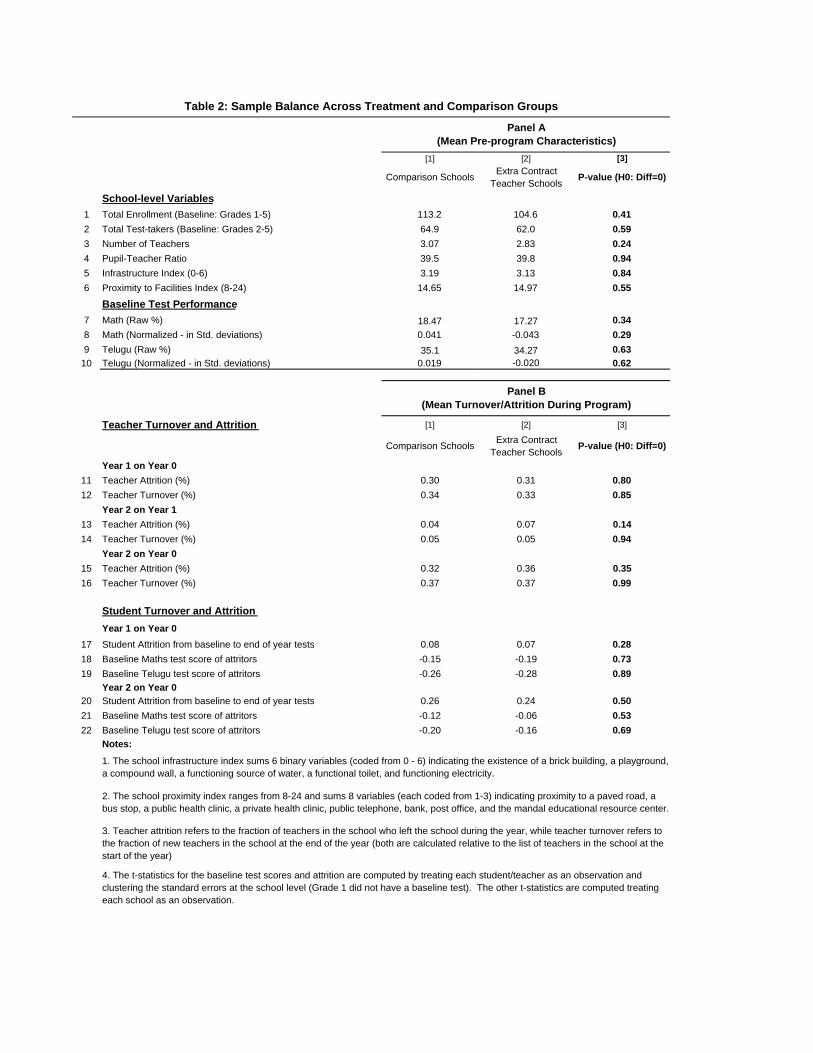
[1] [2] [3]
Comparison SchoolsExtra Contract
Teacher SchoolsP-value (H0: Diff=0)
School-level Variables
1 Total Enrollment (Baseline: Grades 1-5) 113.2 104.6 0.41
2 Total Test-takers (Baseline: Grades 2-5) 64.9 62.0 0.59
3 Number of Teachers 3.07 2.83 0.24
4 Pupil-Teacher Ratio 39.5 39.8 0.94
5 Infrastructure Index (0-6) 3.19 3.13 0.84
6 Proximity to Facilities Index (8-24) 14.65 14.97 0.55
Baseline Test Performance
7 Math (Raw %) 18.47 17.27 0.34
8 Math (Normalized - in Std. deviations) 0.041 -0.043 0.29
9 Telugu (Raw %) 35.1 34.27 0.63
10 Telugu (Normalized - in Std. deviations) 0.019 -0.020 0.62
Teacher Turnover and Attrition [1] [2] [3]
Comparison SchoolsExtra Contract
Teacher SchoolsP-value (H0: Diff=0)
Year 1 on Year 0
11 Teacher Attrition (%) 0.30 0.31 0.80
12 Teacher Turnover (%) 0.34 0.33 0.85
Year 2 on Year 1
13 Teacher Attrition (%) 0.04 0.07 0.14
14 Teacher Turnover (%) 0.05 0.05 0.94
Year 2 on Year 0
15 Teacher Attrition (%) 0.32 0.36 0.35
16 Teacher Turnover (%) 0.37 0.37 0.99
Student Turnover and Attrition
Year 1 on Year 0
17 Student Attrition from baseline to end of year tests 0.08 0.07 0.28
18 Baseline Maths test score of attritors -0.15 -0.19 0.73
19 Baseline Telugu test score of attritors -0.26 -0.28 0.89
Year 2 on Year 0
20 Student Attrition from baseline to end of year tests 0.26 0.24 0.50
21 Baseline Maths test score of attritors -0.12 -0.06 0.53
22 Baseline Telugu test score of attritors -0.20 -0.16 0.69
Notes:
3. Teacher attrition refers to the fraction of teachers in the school who left the school during the year, while teacher turnover refers to the fraction of new teachers in the school at the end of the year (both are calculated relative to the list of teachers in the school at the start of the year)
4. The t-statistics for the baseline test scores and attrition are computed by treating each student/teacher as an observation and clustering the standard errors at the school level (Grade 1 did not have a baseline test). The other t-statistics are computed treating each school as an observation.
Table 2: Sample Balance Across Treatment and Comparison Groups
Panel A (Mean Pre-program Characteristics)
Panel B (Mean Turnover/Attrition During Program)
1. The school infrastructure index sums 6 binary variables (coded from 0 - 6) indicating the existence of a brick building, a playground, a compound wall, a functioning source of water, a functional toilet, and functioning electricity.
2. The school proximity index ranges from 8-24 and sums 8 variables (each coded from 1-3) indicating proximity to a paved road, a bus stop, a public health clinic, a private health clinic, public telephone, bank, post office, and the mandal educational resource center.

[1] [2] [3] [4] [5] [6]
Extra Contract Teacher School 0.092 0.09 0.09 0.095 0.141 0.146(0.035)*** (0.034)*** (0.037)** (0.039)** (0.044)*** (0.047)***
School and Household Controls No Yes No Yes No Yes
Observations 44168 40557 41624 37219 41927 36499R-squared 0.337 0.361 0.311 0.319 0.196 0.216
[1] [2] [3] [4] [5] [6]
Extra Contract Teacher School 0.11 0.105 0.096 0.107 0.153 0.165(0.039)*** (0.039)*** (0.044)** (0.048)** (0.050)*** (0.053)***
School and Household Controls No Yes No Yes No Yes
Observations 21951 20157 20781 18590 20878 18170R-squared 0.316 0.339 0.276 0.28 0.185 0.2
[1] [2] [3] [4] [5] [6]
Extra Contract Teacher School 0.075 0.074 0.086 0.085 0.128 0.126(0.035)** (0.034)** (0.033)*** (0.035)** (0.041)*** (0.044)***
School and Household Controls No Yes No Yes No Yes
Observations 22217 20400 20843 18629 21049 18329R-squared 0.372 0.396 0.362 0.377 0.221 0.246
Notes:
4. Constants are insignificant in all specifications and are not shown.
* significant at 10%; ** significant at 5%; *** significant at 1%
1. All regressions include mandal (sub-district) fixed effects and standard errors clustered at the school level. They also include lagged normalized test scores interacted with grade, where the normalised lagged test score is set to 0 for students in grade 1 or for students in grade 2 in the 2-year regressions. All test scores are normalized relative to the distribution of scores in the control schools in the same grade, test, and year.
2. The two year treatment effect regressions (Year 2 on Year 0) include students who entered grade 1 in the second year of the program and who were there in the schools at end of two years of the program, but who have only been exposed to the program for one year at the end of two years of the program.
Year 2 on Year 1 Year 2 on Year 0
Panel C: TeluguDependent Variable = Normalized End of Year Test Score
Year 1 on Year 0 Year 2 on Year 1 Year 2 on Year 0
3. School controls include infrastructure and proximity indices as defined in Table 2. Household controls include a household asset index, parent education index (both defined as in Table 6), child gender an indicator for being from a disadvantaged caste/tribe.
Table 3: Impact of Extra Contract Teacher on Student Test Scores Panel A: Combined
Dependent Variable = Normalized End of Year Test Score
Year 1 on Year 0 Year 2 on Year 1 Year 2 on Year 0
Panel B: MathsDependent Variable = Normalized End of Year Test Score
Year 1 on Year 0
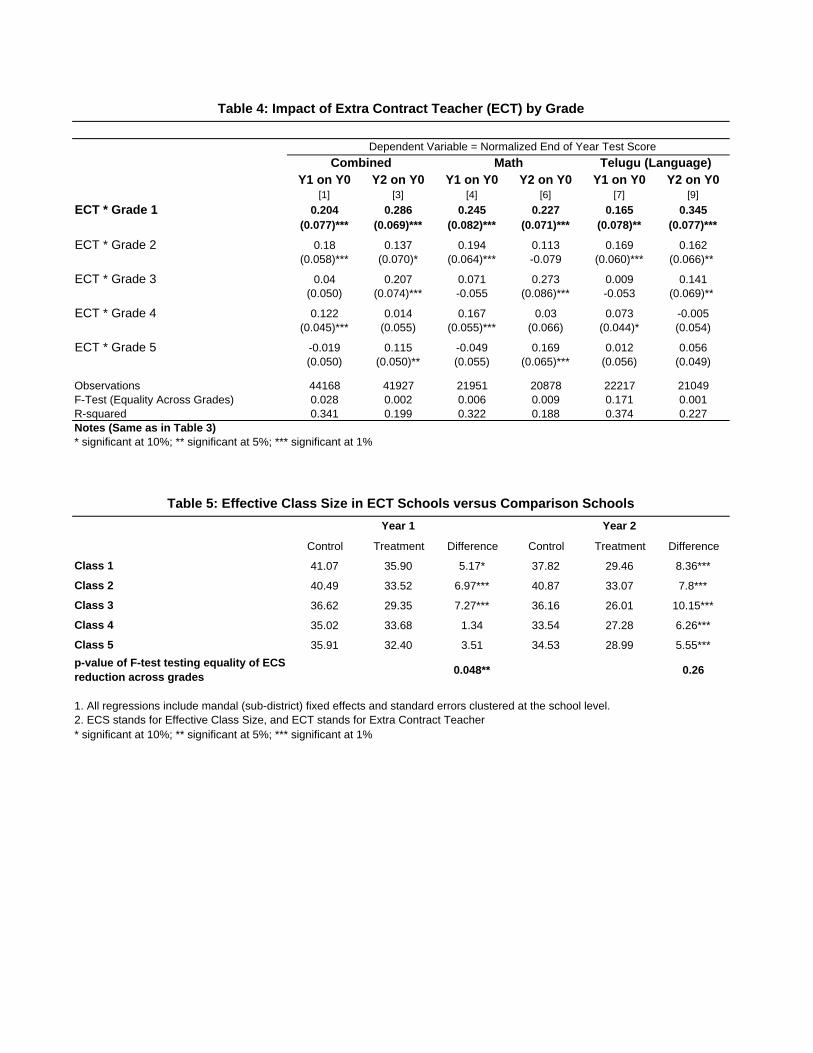
Y1 on Y0 Y2 on Y0 Y1 on Y0 Y2 on Y0 Y1 on Y0 Y2 on Y0[1] [3] [4] [6] [7] [9]
ECT * Grade 1 0.204 0.286 0.245 0.227 0.165 0.345(0.077)*** (0.069)*** (0.082)*** (0.071)*** (0.078)** (0.077)***
ECT * Grade 2 0.18 0.137 0.194 0.113 0.169 0.162(0.058)*** (0.070)* (0.064)*** -0.079 (0.060)*** (0.066)**
ECT * Grade 3 0.04 0.207 0.071 0.273 0.009 0.141(0.050) (0.074)*** -0.055 (0.086)*** -0.053 (0.069)**
ECT * Grade 4 0.122 0.014 0.167 0.03 0.073 -0.005(0.045)*** (0.055) (0.055)*** (0.066) (0.044)* (0.054)
ECT * Grade 5 -0.019 0.115 -0.049 0.169 0.012 0.056(0.050) (0.050)** (0.055) (0.065)*** (0.056) (0.049)
Observations 44168 41927 21951 20878 22217 21049F-Test (Equality Across Grades) 0.028 0.002 0.006 0.009 0.171 0.001R-squared 0.341 0.199 0.322 0.188 0.374 0.227Notes (Same as in Table 3)* significant at 10%; ** significant at 5%; *** significant at 1%
Control Treatment Difference Control Treatment Difference
Class 1 41.07 35.90 5.17* 37.82 29.46 8.36***
Class 2 40.49 33.52 6.97*** 40.87 33.07 7.8***
Class 3 36.62 29.35 7.27*** 36.16 26.01 10.15***
Class 4 35.02 33.68 1.34 33.54 27.28 6.26***
Class 5 35.91 32.40 3.51 34.53 28.99 5.55***
p-value of F-test testing equality of ECS reduction across grades
0.048** 0.26
* significant at 10%; ** significant at 5%; *** significant at 1%
1. All regressions include mandal (sub-district) fixed effects and standard errors clustered at the school level.2. ECS stands for Effective Class Size, and ECT stands for Extra Contract Teacher
Table 5: Effective Class Size in ECT Schools versus Comparison Schools
Year 1 Year 2
Table 4: Impact of Extra Contract Teacher (ECT) by Grade
Dependent Variable = Normalized End of Year Test Score
Combined Math Telugu (Language)
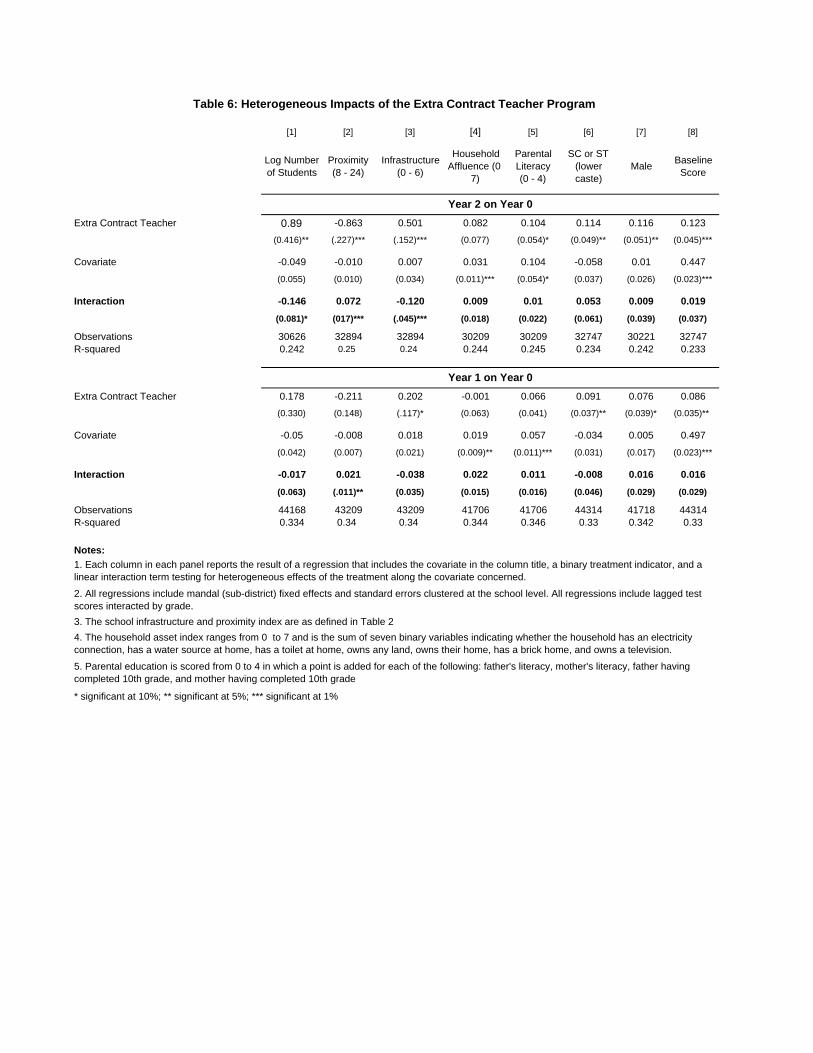
[1] [2] [3] [4] [5] [6] [7] [8]
Log Number of Students
Proximity (8 - 24)
Infrastructure (0 - 6)
Household Affluence (0 -
7)
Parental Literacy (0 - 4)
SC or ST (lower caste)
MaleBaseline
Score
Extra Contract Teacher 0.89 -0.863 0.501 0.082 0.104 0.114 0.116 0.123
(0.416)** (.227)*** (.152)*** (0.077) (0.054)* (0.049)** (0.051)** (0.045)***
Covariate -0.049 -0.010 0.007 0.031 0.104 -0.058 0.01 0.447
(0.055) (0.010) (0.034) (0.011)*** (0.054)* (0.037) (0.026) (0.023)***
Interaction -0.146 0.072 -0.120 0.009 0.01 0.053 0.009 0.019
(0.081)* (017)*** (.045)*** (0.018) (0.022) (0.061) (0.039) (0.037)
Observations 30626 32894 32894 30209 30209 32747 30221 32747R-squared 0.242 0.25 0.24 0.244 0.245 0.234 0.242 0.233
Extra Contract Teacher 0.178 -0.211 0.202 -0.001 0.066 0.091 0.076 0.086
(0.330) (0.148) (.117)* (0.063) (0.041) (0.037)** (0.039)* (0.035)**
Covariate -0.05 -0.008 0.018 0.019 0.057 -0.034 0.005 0.497
(0.042) (0.007) (0.021) (0.009)** (0.011)*** (0.031) (0.017) (0.023)***
Interaction -0.017 0.021 -0.038 0.022 0.011 -0.008 0.016 0.016
(0.063) (.011)** (0.035) (0.015) (0.016) (0.046) (0.029) (0.029)
Observations 44168 43209 43209 41706 41706 44314 41718 44314R-squared 0.334 0.34 0.34 0.344 0.346 0.33 0.342 0.33
Notes:
* significant at 10%; ** significant at 5%; *** significant at 1%
4. The household asset index ranges from 0 to 7 and is the sum of seven binary variables indicating whether the household has an electricity connection, has a water source at home, has a toilet at home, owns any land, owns their home, has a brick home, and owns a television.
5. Parental education is scored from 0 to 4 in which a point is added for each of the following: father's literacy, mother's literacy, father having completed 10th grade, and mother having completed 10th grade
2. All regressions include mandal (sub-district) fixed effects and standard errors clustered at the school level. All regressions include lagged test scores interacted by grade.
Table 6: Heterogeneous Impacts of the Extra Contract Teacher Program
Year 2 on Year 0
Year 1 on Year 0
3. The school infrastructure and proximity index are as defined in Table 2
1. Each column in each panel reports the result of a regression that includes the covariate in the column title, a binary treatment indicator, and a linear interaction term testing for heterogeneous effects of the treatment along the covariate concerned.
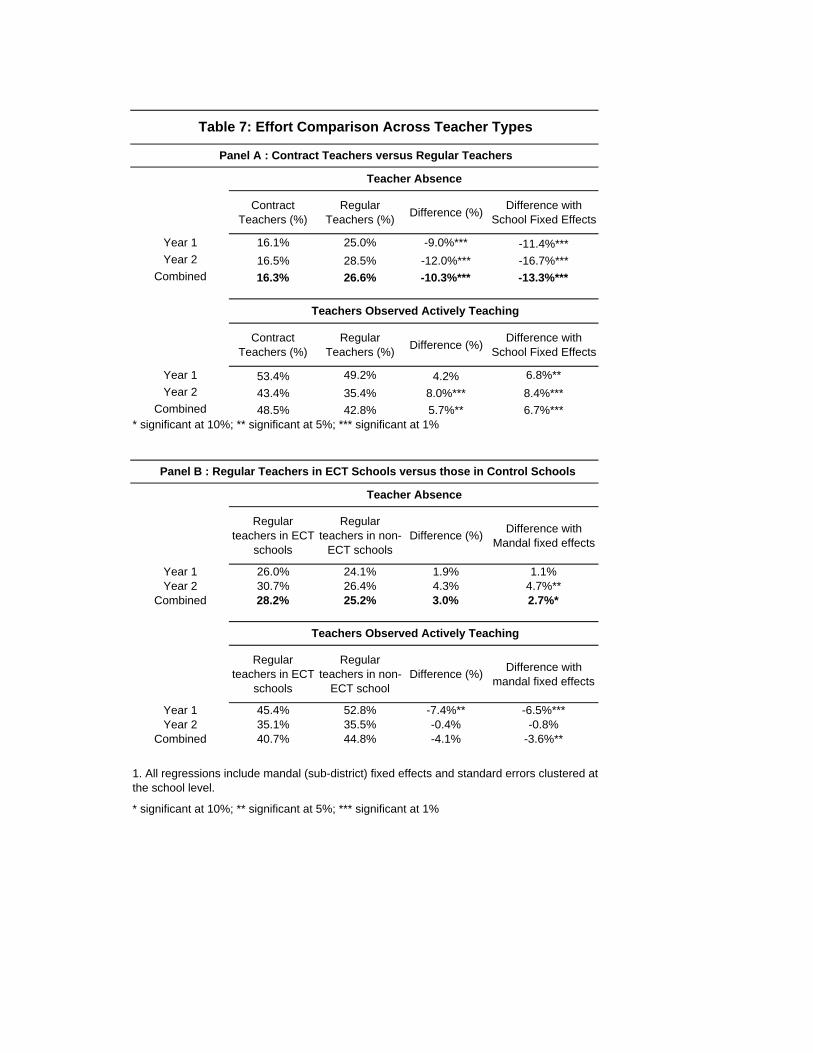
Contract Teachers (%)
Regular Teachers (%)
Difference (%)Difference with
School Fixed Effects
Year 1 16.1% 25.0% -9.0%*** -11.4%***Year 2 16.5% 28.5% -12.0%*** -16.7%***
Combined 16.3% 26.6% -10.3%*** -13.3%***
Contract Teachers (%)
Regular Teachers (%)
Difference (%)Difference with
School Fixed Effects
Year 1 53.4% 49.2% 4.2% 6.8%**
Year 2 43.4% 35.4% 8.0%*** 8.4%***Combined 48.5% 42.8% 5.7%** 6.7%***
* significant at 10%; ** significant at 5%; *** significant at 1%
Regular teachers in ECT
schools
Regular teachers in non-
ECT schoolsDifference (%)
Difference with Mandal fixed effects
Year 1 26.0% 24.1% 1.9% 1.1%Year 2 30.7% 26.4% 4.3% 4.7%**
Combined 28.2% 25.2% 3.0% 2.7%*
Regular teachers in ECT
schools
Regular teachers in non-
ECT schoolDifference (%)
Difference with mandal fixed effects
Year 1 45.4% 52.8% -7.4%** -6.5%***Year 2 35.1% 35.5% -0.4% -0.8%
Combined 40.7% 44.8% -4.1% -3.6%**
* significant at 10%; ** significant at 5%; *** significant at 1%
Teacher Absence
Teachers Observed Actively Teaching
1. All regressions include mandal (sub-district) fixed effects and standard errors clustered at the school level.
Table 7: Effort Comparison Across Teacher Types
Panel A : Contract Teachers versus Regular Teachers
Teacher Absence
Teachers Observed Actively Teaching
Panel B : Regular Teachers in ECT Schools versus those in Control Schools
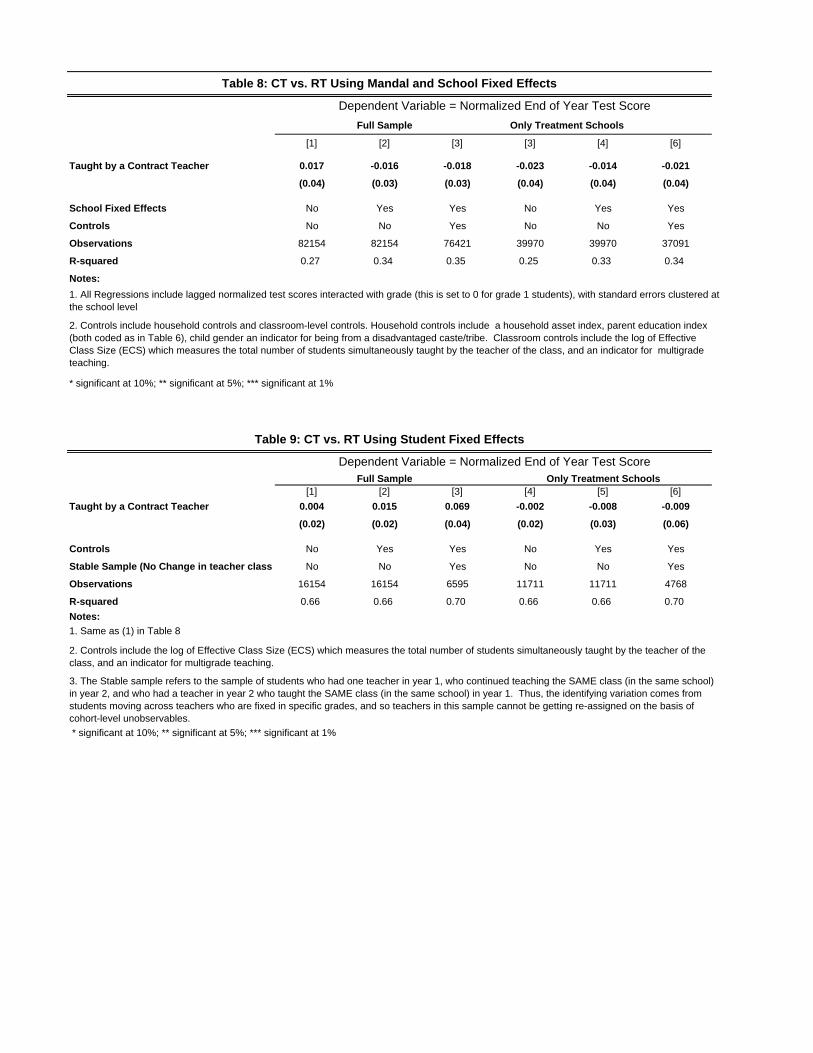
[1] [2] [3] [3] [4] [6]
Taught by a Contract Teacher 0.017 -0.016 -0.018 -0.023 -0.014 -0.021
(0.04) (0.03) (0.03) (0.04) (0.04) (0.04)
School Fixed Effects No Yes Yes No Yes Yes
Controls No No Yes No No Yes
Observations 82154 82154 76421 39970 39970 37091
R-squared 0.27 0.34 0.35 0.25 0.33 0.34
Notes:
* significant at 10%; ** significant at 5%; *** significant at 1%
[1] [2] [3] [4] [5] [6]
Taught by a Contract Teacher 0.004 0.015 0.069 -0.002 -0.008 -0.009
(0.02) (0.02) (0.04) (0.02) (0.03) (0.06)
Controls No Yes Yes No Yes Yes
Stable Sample (No Change in teacher class No No Yes No No Yes
Observations 16154 16154 6595 11711 11711 4768
R-squared 0.66 0.66 0.70 0.66 0.66 0.70
Notes:
* significant at 10%; ** significant at 5%; *** significant at 1%
Table 8: CT vs. RT Using Mandal and School Fixed Effects
Dependent Variable = Normalized End of Year Test Score
Full Sample
1. All Regressions include lagged normalized test scores interacted with grade (this is set to 0 for grade 1 students), with standard errors clustered at the school level
2. Controls include household controls and classroom-level controls. Household controls include a household asset index, parent education index (both coded as in Table 6), child gender an indicator for being from a disadvantaged caste/tribe. Classroom controls include the log of Effective Class Size (ECS) which measures the total number of students simultaneously taught by the teacher of the class, and an indicator for multigrade teaching.
Only Treatment Schools
3. The Stable sample refers to the sample of students who had one teacher in year 1, who continued teaching the SAME class (in the same school) in year 2, and who had a teacher in year 2 who taught the SAME class (in the same school) in year 1. Thus, the identifying variation comes from students moving across teachers who are fixed in specific grades, and so teachers in this sample cannot be getting re-assigned on the basis of cohort-level unobservables.
2. Controls include the log of Effective Class Size (ECS) which measures the total number of students simultaneously taught by the teacher of the class, and an indicator for multigrade teaching.
Table 9: CT vs. RT Using Student Fixed Effects
Dependent Variable = Normalized End of Year Test ScoreFull Sample Only Treatment Schools
1. Same as (1) in Table 8
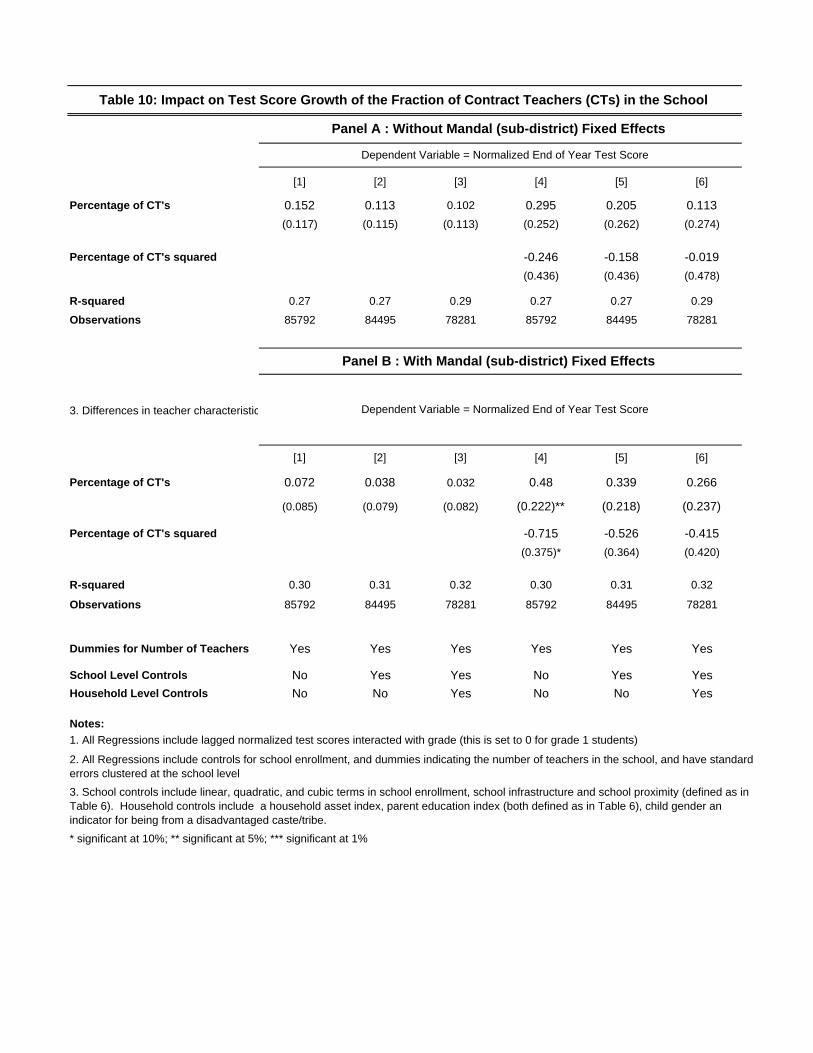
[1] [2] [3] [4] [5] [6]
Percentage of CT's 0.152 0.113 0.102 0.295 0.205 0.113
(0.117) (0.115) (0.113) (0.252) (0.262) (0.274)
Percentage of CT's squared -0.246 -0.158 -0.019
(0.436) (0.436) (0.478)
R-squared 0.27 0.27 0.29 0.27 0.27 0.29
Observations 85792 84495 78281 85792 84495 78281
3. Differences in teacher characteristic
[1] [2] [3] [4] [5] [6]
Percentage of CT's 0.072 0.038 0.032 0.48 0.339 0.266
(0.085) (0.079) (0.082) (0.222)** (0.218) (0.237)
Percentage of CT's squared -0.715 -0.526 -0.415
(0.375)* (0.364) (0.420)
R-squared 0.30 0.31 0.32 0.30 0.31 0.32
Observations 85792 84495 78281 85792 84495 78281
Dummies for Number of Teachers Yes Yes Yes Yes Yes Yes
School Level Controls No Yes Yes No Yes Yes
Household Level Controls No No Yes No No Yes
Notes:
* significant at 10%; ** significant at 5%; *** significant at 1%
3. School controls include linear, quadratic, and cubic terms in school enrollment, school infrastructure and school proximity (defined as in Table 6). Household controls include a household asset index, parent education index (both defined as in Table 6), child gender an indicator for being from a disadvantaged caste/tribe.
1. All Regressions include lagged normalized test scores interacted with grade (this is set to 0 for grade 1 students)
2. All Regressions include controls for school enrollment, and dummies indicating the number of teachers in the school, and have standard errors clustered at the school level
Panel A : Without Mandal (sub-district) Fixed Effects
Table 10: Impact on Test Score Growth of the Fraction of Contract Teachers (CTs) in the School
Panel B : With Mandal (sub-district) Fixed Effects
Dependent Variable = Normalized End of Year Test Score
Dependent Variable = Normalized End of Year Test Score
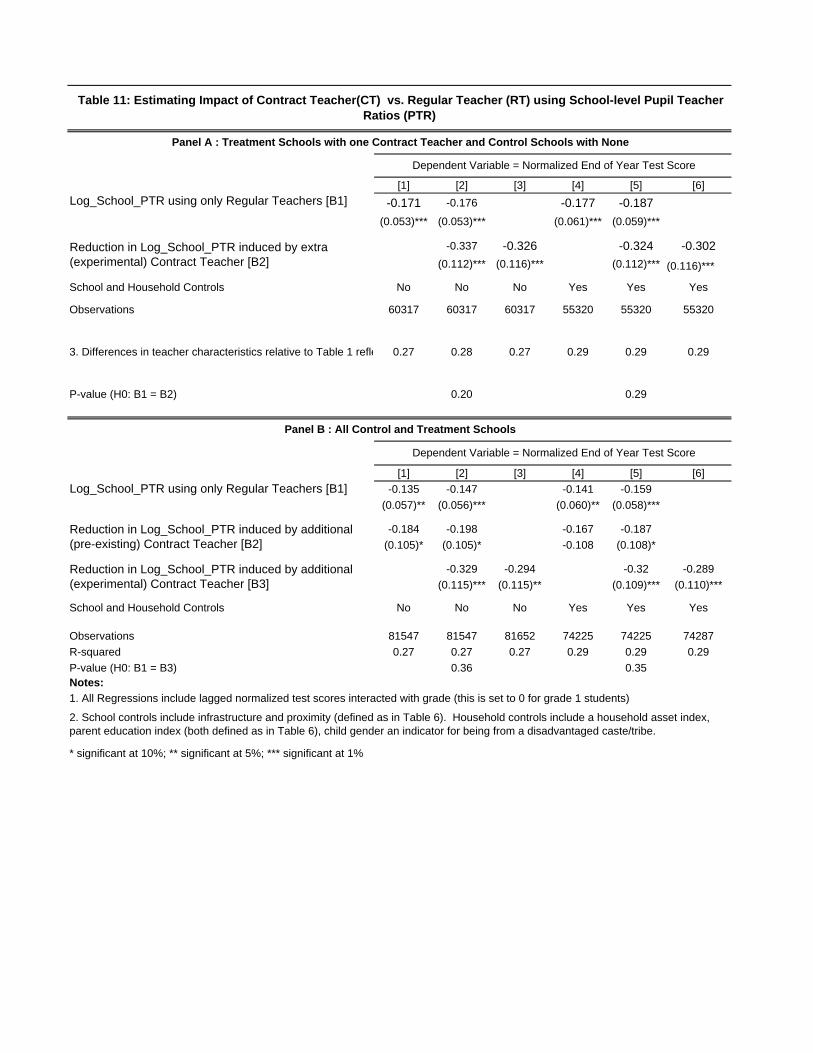
[1] [2] [3] [4] [5] [6]
-0.171 -0.176 -0.177 -0.187
(0.053)*** (0.053)*** (0.061)*** (0.059)***
-0.337 -0.326 -0.324 -0.302
(0.112)*** (0.116)*** (0.112)*** (0.116)***
School and Household Controls No No No Yes Yes Yes
Observations 60317 60317 60317 55320 55320 55320
3. Differences in teacher characteristics relative to Table 1 refle 0.27 0.28 0.27 0.29 0.29 0.29
P-value (H0: B1 = B2) 0.20 0.29
[1] [2] [3] [4] [5] [6]
-0.135 -0.147 -0.141 -0.159
(0.057)** (0.056)*** (0.060)** (0.058)***
-0.184 -0.198 -0.167 -0.187
(0.105)* (0.105)* -0.108 (0.108)*
-0.329 -0.294 -0.32 -0.289
(0.115)*** (0.115)** (0.109)*** (0.110)***
School and Household Controls No No No Yes Yes Yes
Observations 81547 81547 81652 74225 74225 74287
R-squared 0.27 0.27 0.27 0.29 0.29 0.29
P-value (H0: B1 = B3) 0.36 0.35Notes:
* significant at 10%; ** significant at 5%; *** significant at 1%
Reduction in Log_School_PTR induced by additional (pre-existing) Contract Teacher [B2]
Reduction in Log_School_PTR induced by additional (experimental) Contract Teacher [B3]
2. School controls include infrastructure and proximity (defined as in Table 6). Household controls include a household asset index, parent education index (both defined as in Table 6), child gender an indicator for being from a disadvantaged caste/tribe.
Table 11: Estimating Impact of Contract Teacher(CT) vs. Regular Teacher (RT) using School-level Pupil Teacher Ratios (PTR)
Panel A : Treatment Schools with one Contract Teacher and Control Schools with None
Dependent Variable = Normalized End of Year Test Score
Panel B : All Control and Treatment Schools
Dependent Variable = Normalized End of Year Test Score
1. All Regressions include lagged normalized test scores interacted with grade (this is set to 0 for grade 1 students)
Reduction in Log_School_PTR induced by extra (experimental) Contract Teacher [B2]
Log_School_PTR using only Regular Teachers [B1]
Log_School_PTR using only Regular Teachers [B1]
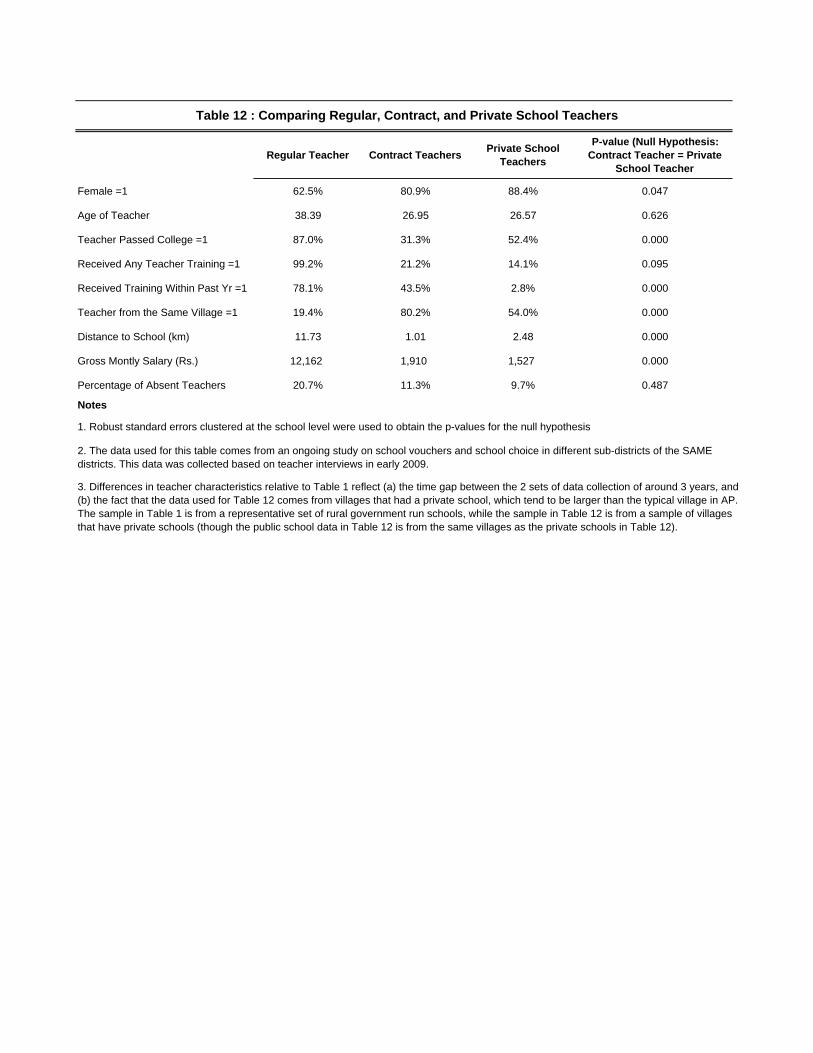
Regular Teacher Contract TeachersPrivate School
Teachers
P-value (Null Hypothesis: Contract Teacher = Private
School Teacher
Female =1 62.5% 80.9% 88.4% 0.047
Age of Teacher 38.39 26.95 26.57 0.626
Teacher Passed College =1 87.0% 31.3% 52.4% 0.000
Received Any Teacher Training =1 99.2% 21.2% 14.1% 0.095
Received Training Within Past Yr =1 78.1% 43.5% 2.8% 0.000
Teacher from the Same Village =1 19.4% 80.2% 54.0% 0.000
Distance to School (km) 11.73 1.01 2.48 0.000
Gross Montly Salary (Rs.) 12,162 1,910 1,527 0.000
Percentage of Absent Teachers 20.7% 11.3% 9.7% 0.487
Notes
Table 12 : Comparing Regular, Contract, and Private School Teachers
1. Robust standard errors clustered at the school level were used to obtain the p-values for the null hypothesis
2. The data used for this table comes from an ongoing study on school vouchers and school choice in different sub-districts of the SAME districts. This data was collected based on teacher interviews in early 2009.
3. Differences in teacher characteristics relative to Table 1 reflect (a) the time gap between the 2 sets of data collection of around 3 years, and (b) the fact that the data used for Table 12 comes from villages that had a private school, which tend to be larger than the typical village in AP. The sample in Table 1 is from a representative set of rural government run schools, while the sample in Table 12 is from a sample of villages that have private schools (though the public school data in Table 12 is from the same villages as the private schools in Table 12).
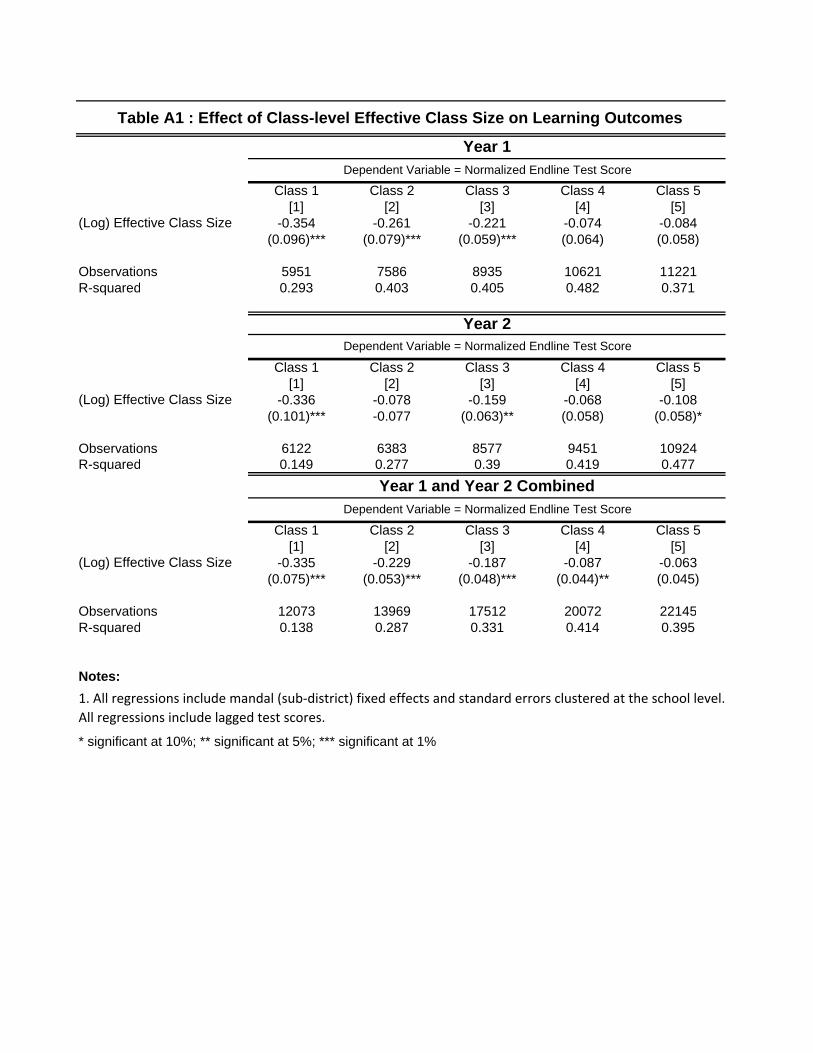
Class 1 Class 2 Class 3 Class 4 Class 5[1] [2] [3] [4] [5]
(Log) Effective Class Size -0.354 -0.261 -0.221 -0.074 -0.084(0.096)*** (0.079)*** (0.059)*** (0.064) (0.058)
Observations 5951 7586 8935 10621 11221R-squared 0.293 0.403 0.405 0.482 0.371
Class 1 Class 2 Class 3 Class 4 Class 5[1] [2] [3] [4] [5]
(Log) Effective Class Size -0.336 -0.078 -0.159 -0.068 -0.108(0.101)*** -0.077 (0.063)** (0.058) (0.058)*
Observations 6122 6383 8577 9451 10924R-squared 0.149 0.277 0.39 0.419 0.477
Class 1 Class 2 Class 3 Class 4 Class 5[1] [2] [3] [4] [5]
(Log) Effective Class Size -0.335 -0.229 -0.187 -0.087 -0.063(0.075)*** (0.053)*** (0.048)*** (0.044)** (0.045)
Observations 12073 13969 17512 20072 22145R-squared 0.138 0.287 0.331 0.414 0.395
Notes:
* significant at 10%; ** significant at 5%; *** significant at 1%
1. All regressions include mandal (sub‐district) fixed effects and standard errors clustered at the school level.
All regressions include lagged test scores.
Dependent Variable = Normalized Endline Test Score
Table A1 : Effect of Class-level Effective Class Size on Learning Outcomes
Year 1Dependent Variable = Normalized Endline Test Score
Year 2Dependent Variable = Normalized Endline Test Score
Year 1 and Year 2 Combined
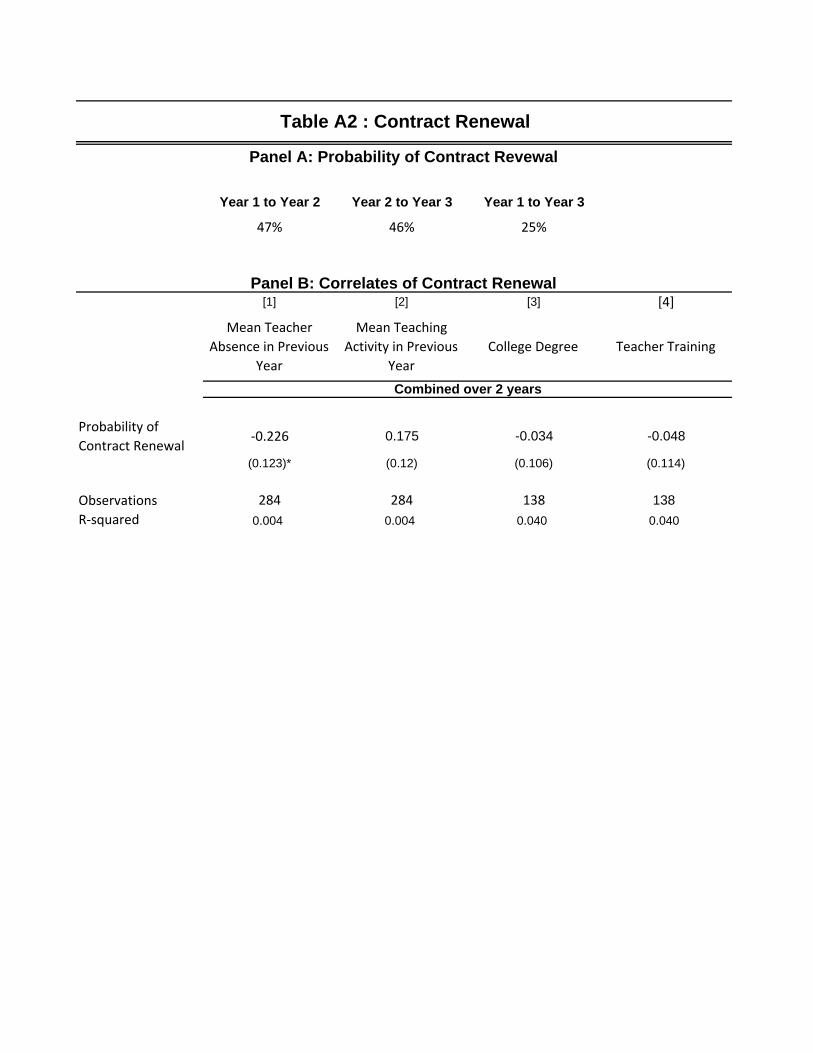
Year 1 to Year 2 Year 2 to Year 3 Year 1 to Year 3
47% 46% 25%
[1] [2] [3] [4]
Mean Teacher
Absence in Previous
Year
Mean Teaching
Activity in Previous
Year
College Degree Teacher Training
Probability of
Contract Renewal‐0.226 0.175 -0.034 -0.048
(0.123)* (0.12) (0.106) (0.114)
Observations 284 284 138 138
R‐squared 0.004 0.004 0.040 0.040
Table A2 : Contract Renewal
Panel A: Probability of Contract Revewal
Panel B: Correlates of Contract Renewal
Combined over 2 years
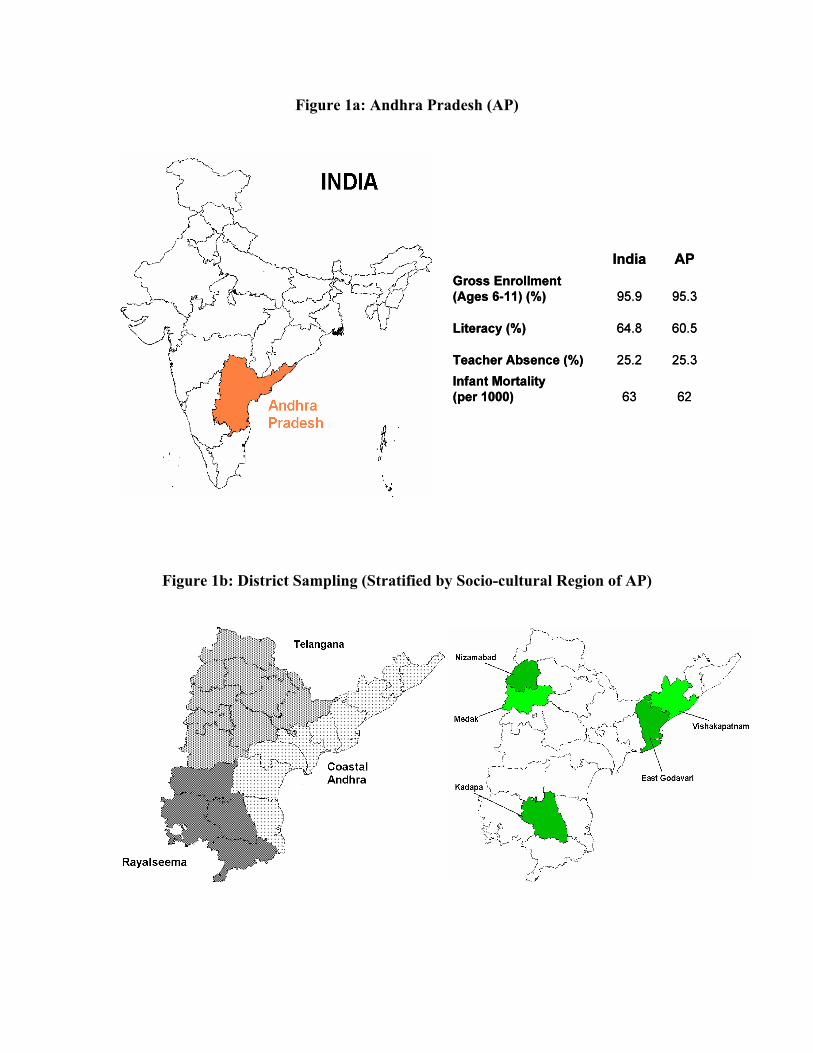
Figure 1a: Andhra Pradesh (AP)
Figure 1b: District Sampling (Stratified by Socio-cultural Region of AP)
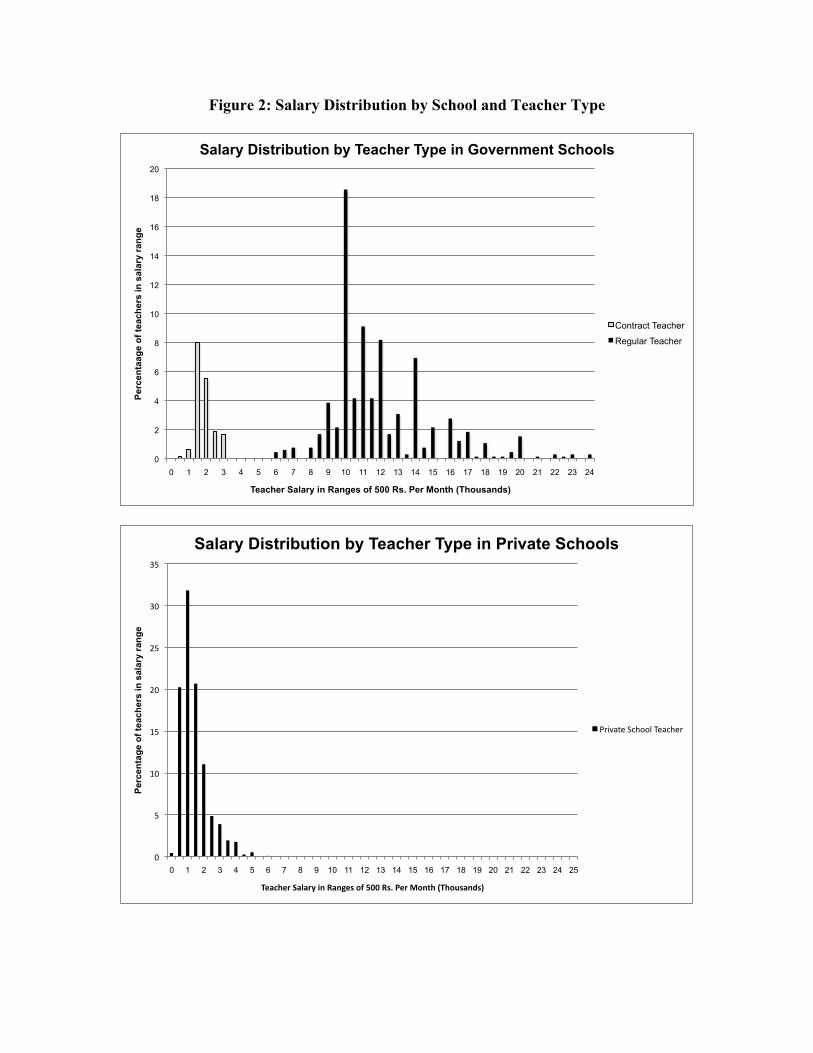
Figure 2: Salary Distribution by School and Teacher Type
0
2
4
6
8
10
12
14
16
18
20
0 1 2 3 4 5 6 7 8 9 10 11 12 13 14 15 16 17 18 19 20 21 22 23 24
Per
cent
aage
of t
each
ers
in s
alar
y ra
nge
Teacher Salary in Ranges of 500 Rs. Per Month (Thousands)
Salary Distribution by Teacher Type in Government Schools
Contract Teacher
Regular Teacher
!"
#"
$!"
$#"
%!"
%#"
&!"
&#"
0 1 2 3 4 5 6 7 8 9 10 11 12 13 14 15 16 17 18 19 20 21 22 23 24 25
Per
cent
age
of te
ache
rs in
sal
ary
rang
e
!"#$%"&'(#)#&*'+,'-#,."/'01'233'-/4'5"&'60,7%'8!%09/#,:/;'
Salary Distribution by Teacher Type in Private Schools
'()*+,-"./0112"3-+/0-("