Contour integration over time: Psychophysical and … · ORIGINAL ARTICLE Contour Integration over...
10
ORIGINAL ARTICLE Contour Integration over Time: Psychophysical and fMRI Evidence Shu-Guang Kuai 1 , Wu Li 2 , Cong Yu 3 and Zoe Kourtzi 4 1 MOE and Shanghai Key Laboratories of Brain Functional Genomics and School of Psychology and Cognitive Science, East China Normal University, Shanghai, China, 2 State Key Laboratory of Cognitive Neuroscience and Learning and IDG/McGovern Institute for Brain Research, Beijing Normal University, Beijing, China, 3 Department of Psychology, IDG/McGovern Institute for Brain Research, and Peking-Tsinghua Center for Life Sciences, Peking University, Beijing 100181, China and 4 Department of Psychology, University of Cambridge, Cambridge CB2 3AR, UK Address correspondence to Cong Yu, Department of Psychology, Peking University, 100181 Beijing, China. Email: [email protected]; Zoe Kourtzi, Department of Psychology, University of Cambridge, Cambridge CB2 3AR, UK. Email: [email protected] Abstract The brain integrates discrete but collinear stimuli to perceive global contours. Previous contour integration (CI) studies mainly focus on integration over space, and CI is attributed to either V1 long-range connections or contour processing in high-visual areas that top-down modulate V1 responses. Here, we show that CI also occurs over time in a design that minimizes the roles of V1 long-range interactions. We use tilted contours embedded in random orientation noise and moving horizontally behind a fixed vertical slit. Individual contour elements traveling up/down within the slit would be encoded over time by parallel, rather than aligned, V1 neurons. However, we find robust contour detection even when the slit permits only one viewable contour element. Similar to CI over space, CI over time also obeys the rule of collinearity. fMRI evidence shows that while CI over space engages visual areas as early as V1, CI over time mainly engages higher dorsal and ventral visual areas involved in shape processing, as well as posterior parietal regions involved in visual memory that can represent the orientation of temporally integrated contours. These results suggest at least partially dissociable mechanisms for implementing the Gestalt rule of continuity in CI over space and time. Key words: contour integration, fMRI, Gestalt principles, good continuity, psychophysics Introduction Integrating local image fragments into global shapes is critical for object recognition in complex environments. This contour inte- gration (CI) process has extensively been investigated in psycho- physical, neurophysiological, neuroimaging, and computational modeling studies (e.g., Field et al. 1993; Li 1998, 2006; Kourtzi et al. 2003). However, the neural mechanisms under CI remain controversial. One distinct characteristic is that it follows the Ge- stalt rule of good continuation. That is, adjacent contour seg- ments that are similarly oriented and aligned are more likely to be integrated. Because long-range horizontal connections in V1 are known to connect neurons with similar orientation prefer- ences (Gilbert and Wiesel 1989), many CI theories assume that such connections would mediate CI through contextual modula- tion (e.g., Field et al. 1993; Li 1998; Kapadia et al. 2000). However, neuroimaging evidence indicates that CI involves multiple areas from V1 to lateral occipital complex (LOC; Altmann et al. 2003; Kourtzi et al. 2003). There are reports that high-level visual regions such as LOC are activated earlier than V1 by contour stimuli (Mijovic et al. 2013; Shpaner et al. 2013). These results are consistent with monkey data that contour- related responses in V1 are delayed with respect to initial neural © The Author 2016. Published by Oxford University Press. All rights reserved. For Permissions, please e-mail: [email protected] Cerebral Cortex, May 2017;27:3042–3051 doi:10.1093/cercor/bhw147 Advance Access Publication Date: 30 May 2016
Transcript of Contour integration over time: Psychophysical and … · ORIGINAL ARTICLE Contour Integration over...
OR I G INA L ART I C L E
Contour Integration over Time: Psychophysicaland fMRI EvidenceShu-Guang Kuai1, Wu Li2, Cong Yu3 and Zoe Kourtzi4
1MOE and Shanghai Key Laboratories of Brain Functional Genomics and School of Psychology and CognitiveScience, East China Normal University, Shanghai, China, 2State Key Laboratory of Cognitive Neuroscience andLearning and IDG/McGovern Institute for Brain Research, Beijing Normal University, Beijing, China, 3Departmentof Psychology, IDG/McGovern Institute for Brain Research, and Peking-Tsinghua Center for Life Sciences,Peking University, Beijing 100181, China and 4Department of Psychology, University of Cambridge,Cambridge CB2 3AR, UK
Address correspondence to Cong Yu, Department of Psychology, Peking University, 100181 Beijing, China. Email: [email protected]; Zoe Kourtzi,Department of Psychology, University of Cambridge, Cambridge CB2 3AR, UK. Email: [email protected]
AbstractThe brain integrates discrete but collinear stimuli to perceive global contours. Previous contour integration (CI) studies mainlyfocus on integration over space, and CI is attributed to either V1 long-range connections or contour processing in high-visualareas that top-downmodulate V1 responses. Here, we show that CI also occurs over time in a design thatminimizes the roles ofV1 long-range interactions. We use tilted contours embedded in random orientation noise and moving horizontally behind afixed vertical slit. Individual contour elements traveling up/down within the slit would be encoded over time by parallel, ratherthan aligned, V1 neurons. However, we find robust contour detection even when the slit permits only one viewable contourelement. Similar to CI over space, CI over time also obeys the rule of collinearity. fMRI evidence shows that while CI over spaceengages visual areas as early as V1, CI over time mainly engages higher dorsal and ventral visual areas involved in shapeprocessing, as well as posterior parietal regions involved in visual memory that can represent the orientation of temporallyintegrated contours. These results suggest at least partially dissociable mechanisms for implementing the Gestalt rule ofcontinuity in CI over space and time.
Key words: contour integration, fMRI, Gestalt principles, good continuity, psychophysics
IntroductionIntegrating local image fragments into global shapes is critical forobject recognition in complex environments. This contour inte-gration (CI) process has extensively been investigated in psycho-physical, neurophysiological, neuroimaging, and computationalmodeling studies (e.g., Field et al. 1993; Li 1998, 2006; Kourtziet al. 2003). However, the neural mechanisms under CI remaincontroversial. One distinct characteristic is that it follows the Ge-stalt rule of good continuation. That is, adjacent contour seg-ments that are similarly oriented and aligned are more likely tobe integrated. Because long-range horizontal connections in V1
are known to connect neurons with similar orientation prefer-ences (Gilbert and Wiesel 1989), many CI theories assume thatsuch connections would mediate CI through contextual modula-tion (e.g., Field et al. 1993; Li 1998; Kapadia et al. 2000).
However, neuroimaging evidence indicates that CI involvesmultiple areas from V1 to lateral occipital complex (LOC;Altmann et al. 2003; Kourtzi et al. 2003). There are reports thathigh-level visual regions such as LOC are activated earlier thanV1 by contour stimuli (Mijovic et al. 2013; Shpaner et al. 2013).These results are consistent with monkey data that contour-related responses in V1 are delayed with respect to initial neural
© The Author 2016. Published by Oxford University Press. All rights reserved. For Permissions, please e-mail: [email protected]
Cerebral Cortex, May 2017;27:3042–3051
doi:10.1093/cercor/bhw147Advance Access Publication Date: 30 May 2016

responses to visual stimuli (Li et al. 2006; Gilad et al. 2013; Chenet al. 2014), and that V1 responses to contour stimuli are stronglymodulated by top-down feedback (Li et al. 2006, 2008; McManuset al. 2011; Chen et al. 2014). However, it is unclear whether V1horizontal connections are an indispensable machinery for CIunder all viewing conditions.
In this study,we examinewhether CI could still take place in aviewing condition where V1 horizontal connections are likelyrendered ineffective. We ask the observers to detect a collinearcontour embedded in random orientation noise, which is similarto stimuli used in many CI studies (e.g., Field et al. 1993), whilethe whole stimulus image is moving behind a fixed vertical slit(Fig. 1a). The contour is tilted while the whole stimulus imagemoves horizontally. Therefore, the viewable elements of the con-tourmove either up or downwithin the vertical slit, one at a time.These contour elements would be encoded over time by V1 neu-rons that arenot arranged along the contour path, but are parallelto each other. If the contour is still detectablewhen the slit is nar-row enough to allow only up to one contour element to be viewedat any moment, we would argue that V1 horizontal connectionsmaynot play a significant role in this particular temporal integra-tion process. Rather, we reason that higher-levelmechanisms re-sponsible for visual working memory and shape perception mayplay more prominent roles.
Materials and MethodsObservers
Twenty-two observers (12 males and 10 females, mean age = 24years) with normal or corrected-to-normal vision participatedin psychophysical and fMRI experiments. Some observersparticipated in more than one psychophysical and/or fMRI ex-periments (see Results). All, except S.-G.K., were new to psycho-physical and fMRI experiments and were unaware of thepurposes of the study. Informed written consent was obtainedfrom each observer prior to data collection.
Stimuli
The stimuli comprised 256 Gabors (Gaussian windowed sinus-oidal gratings), each occupying one of 16 × 16 invisible squaregrids (0.825° × 0.825° each). Some Gabors formed collinear con-tour paths, and the remaining ones were randomly oriented.The Gabors had a spatial frequency at 3 cpd, a standard deviationat 0.15°, and a contrast at 70%. The phases of the Gabors variedrandomly from 0° to 315° in 45° steps. When slit-viewed, thestimulus image moved behind a vertical slit at a speed of 6.4°/sin psychophysical experiments or 6.8°/s in fMRI experiments.
In psychophysical experiments, a straight contour pathformed by 9 collinear Gabor elements was embedded in a fieldof randomly oriented Gabors (Fig. 1a). The center of the pathwas randomly positioned within a range of ±2.5° from the stimu-lus center. To control the density cues, the center-to-center hori-zontal distance of adjacent contour elements varied from 0.9 to1.1 times the average interelement distance (AIED) that wasequal to the grid width. The global orientation of the contourpath was randomized either between 15° and 60° or between120° and 165°. A random stimulus image (without any contourpath) was also generated within the same trial in a differentstimulus interval by randomly shuffling the positions of all Ga-bors in the contour stimulus image.
In fMRI experiments, to maintain a sufficiently strong signal-to-noise ratio of blood oxygen level-dependent (BOLD) responses,
each contour stimulus image consisted of 5 nearly parallel con-tours, each containing 4–10 Gabor elements. The 5 contours ofdifferent lengths were randomly placed, and the distance be-tween 2 neighboring contours was randomized from 1.5° to2.25°. The global orientation of each contour was randomizedfrom 30° to 45° or from 135° to 150°.
All stimuli were generated with Matlab-based Psychtoolbox3(Pelli 1997). In psychophysical experiments, the stimulus imageswere presented on a 21 in. CRT monitor (1280 × 1024 pixels, 0.3mm× 0.3 mm pixel size, 85 Hz frame rate, and 47 cd/m2 mean lu-minance). The luminance of the monitor was linearized by an 8-bit look-up table. Viewing was binocular at a distance of 46 cm. Achin-and-head restwas used to stabilize thehead of the observer.Experiments were run in a dimly lit room. In fMRI experiments,the stimuli were presented through a projector onto a mirror infront of the observer (1280 × 1024 pixels, 0.44 mm× 0.44 mmpixel size, 60 Hz frame rate). The luminance of the projectorwas linearized by an 8-bit look-up table. Viewing was binocularat a distance of 67 cm.
Psychophysical Procedure
Contour detection performance was measured with a two-inter-val forced-choice method of constant stimuli. In each trial, thestimulus image moved behind a vertical slit of various widthsfrom left to right or reversely for 2 s. Two stimulus intervals,one containing the contour image and the other containing therandom stimulus image, were separated by a 500-ms interstimu-lus interval. Observers were instructed to report which intervalcontained a contour. Each slit width was repeated in 60 trials.
fMRI Experimental Procedure
Each observer was scanned for 7–8 runs using a block design.Each run consisted of 16 stimulus blocks that were interleavedwith 3 fixation blocks (10 s each) at the beginning, in the middle,and at the end of the run, respectively. Each stimulus block con-sisted of 8 trials and lasted for 20 s. Each trial consisted of a 2-sstimulus image and a 0.5-s blank with slit-viewing, or four 0.5 sregenerated similar stimulus images (to minimize adaptation)and a 0.5-s blank with full-field viewing. The color of the fixationdot changed in 25% of the trials randomly. Color changes neveroccurred in 2 consecutive trials. Observers were asked to reportthe stimulus type (e.g., contour or random stimulus) whencolor changed. Since the participants could not predict the trialsto which they needed to be responded, they had to keep their at-tention to the stimulus images throughout the experimentalruns.
fMRI Data Acquisition
fMRI data were acquired in a 3-T Achieva Philips scanner atthe University of Birmingham Imaging Centre using an eight-channel head coil. Anatomical images were obtained using athree-dimensional T1-weighted sequence (voxel size = 1 × 1 × 1mm, slices = 175) for localization and visualization of the func-tional data. Functional images were acquired by a high-reso-lution gradient echo-pulse sequence covering the occipital andposterior temporal cortex (28 slices; repetition time = 2000 ms;time to echo = 34 ms; resolution = 1.5 × 1.5 × 2 mm).
fMRI Data Analysis
Anatomical datawere transformed into Talairach space and theninflated using BrainVoyager QX (Brain Innovations, Maastricht,
Contour Integration over Time Kuai et al. | 3043
the Netherlands). Pre-processing of functional data includedslice scan time correction, three-dimensional motion correction,linear trend removal, and temporal high-pass filtering (3 cyclesper run), but not spatial smoothing. Trials with head motion lar-ger than 1 mm of translation or 1 degree of rotation were ex-cluded from analysis (<5% of total trials). The functional imageswere aligned to anatomical data and the complete data weretransformed into Talairach space. For each observer, the func-tional imaging data between the 2 sessions were co-aligned, re-gistering all volumes for each observer to the first functional
volume of the first run and session. This procedure ensured acautious registration across sessions.
Regions of Interest
For each individual observer, we identified retinotopic motion-related [V3B/kinetic occipital (KO)] and shape-related [lateraloccipital (LO)] areas using standard procedures. Specifically, vis-ual areas (V1, V2, V3, V3a, hV4, and V7) were defined by standardretinotopic mapping procedures using rotating wedge stimuli
(a)
(b)
Slit width (AIED)
0 10 20 30 40 5040
50
60
70
80
90
Orientation jitter (deg)
0 15 30 45 60 75 9040
50
60
70
80
90
Element angle (deg)
40
50
60
70
80
90
0 0.4 0.8 1.2 1.6 2
(c)
(d)
Per
cent
cor
rect
(%
)P
erce
nt c
orre
ct (
%)
Per
cent
cor
rect
(%
)
(e)
N = 6 N = 4
N = 4
Position jitter (+/– AIED)
Per
cent
cor
rect
(%
)
40
50
60
70
80
90
N = 4
0 0.5 1 1.5 2 2.5 3
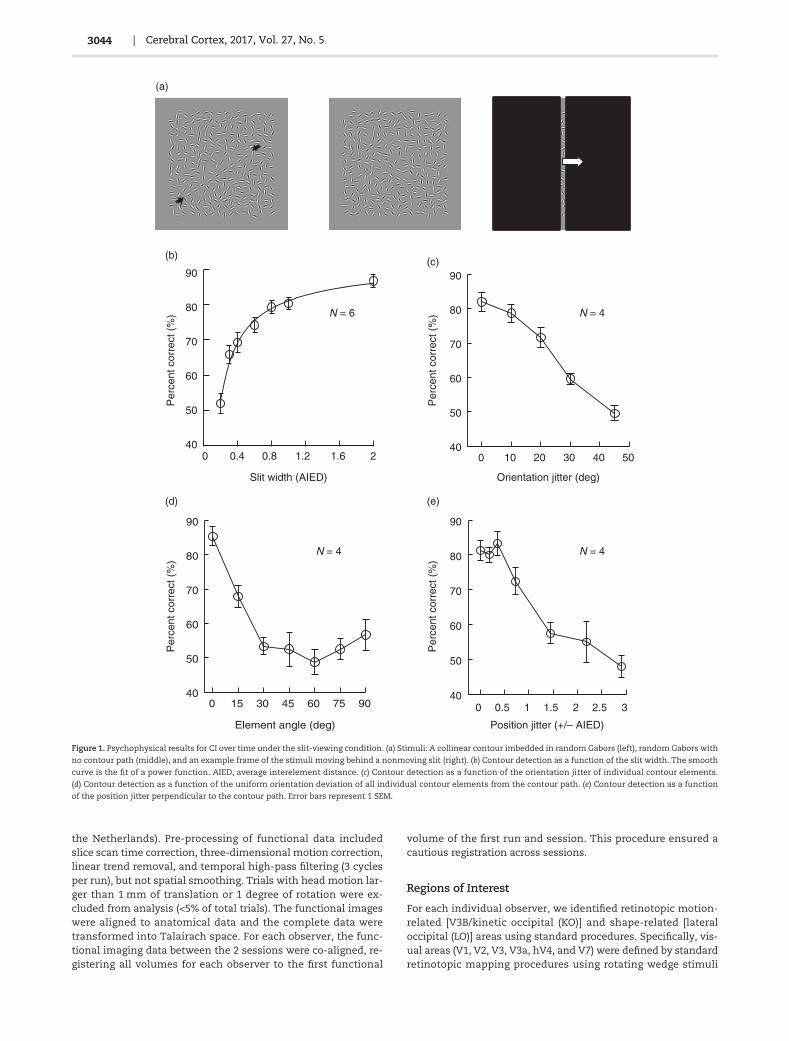
Figure 1. Psychophysical results for CI over time under the slit-viewing condition. (a) Stimuli: A collinear contour imbedded in random Gabors (left), random Gabors with
no contour path (middle), and an example frame of the stimuli moving behind a nonmoving slit (right). (b) Contour detection as a function of the slit width. The smooth
curve is the fit of a power function. AIED, average interelement distance. (c) Contour detection as a function of the orientation jitter of individual contour elements.
(d) Contour detection as a function of the uniform orientation deviation of all individual contour elements from the contour path. (e) Contour detection as a function
of the position jitter perpendicular to the contour path. Error bars represent 1 SEM.
| Cerebral Cortex, 2017, Vol. 27, No. 53044

(Engel et al. 1994; Sereno et al. 1995; DeYoe et al. 1996). hV4 wasidentified as the region comprising the ventral but not the dorsalsubregion of V4 (Wandell et al. 2007). V3B/KO was defined as theset of contiguous voxels anterior to V3A and inferior to V7 show-ing significantly higher response to kinetic boundaries thantransparent motion (Dupont et al. 1997; Zeki et al. 2003). One ob-server in the full-field viewing condition did not complete the lo-calizer scan of V3B/KO. For this observer, we defined the V3B/KObased on known Talairach coordinates for this region (left hemi-sphere: −29.5, −83.9, 1.8; right hemisphere: 31.5, −81.4, 3.6). Areamiddle temporal (MT) was defined as the set of voxels in the lat-eral temporal cortex demonstrating significantly higher activa-tion to an array of moving dots than to a static array dot (Zekiet al. 1991). LO was defined as a set of contiguous voxels in theposterior ventral occipitotemporal cortex showing significantlystronger activation for intact than for scrambled images (Malachet al. 1995; Kourtzi and Kanwisher 2001). Note that the anteriorLOC subregions and ventral regions around the fusiform andthe parahippocampal gyrus were not included, since they werecovered by high-resolution slices scanned in this study. Finally,intraparietal areas [ventral intraparietal sulcus (VIPS), left hemi-sphere:−24.2,−73.2, 25; right hemisphere: 27.4,−72, 25.8 and par-ieto occipital intraparietal sulcus (POIPS), left hemisphere: −20.3,−66.1, 42.6; right hemisphere: −20.8, −65.2, 42.7] were defined onthe basis of known Talairach coordinates for these regions (Orbanet al. 1999), since we did not have a functional localizer for theseareas. Data from different hemispheres were merged for furtheranalysis. The final regions of interest (ROIs) spanned both hemi-spheres, as bothhemispheres showed the samepattern of results.
Multivoxel Pattern Analysis
To identify brain patterns that discriminate between stimuli (e.g.,contour vs. randomstimuli, or left- vs. right-tilted contour paths),we performed multivoxel pattern classification analysis (Haynesand Rees 2005; Kamitani and Tong 2005). Voxels that showedstronger responses for all stimulus conditions comparedwith fix-ation were selected and ranked in a descending order based ontheir t-values. The first 500 voxels for each ROI per observerwere then selected for analysis, as prediction accuracy had satu-rated at this pattern size across areas. The time course of eachvoxel was extracted and normalized (z-score) in each run tomin-imize baseline differences across runs. The fMRI data wereshifted by 4 s due to the hemodynamic response delay andwere then averaged within each experimental block.
We trained binary linear support vectormachine (SVM) classi-fiers to discriminate fMRI responses evoked by contour versusrandom stimuli or by different contour orientations using aleave-one-run-out cross-validation procedure. There were 112–128 training patterns and 16 test patterns in the slit-viewingfMRI experiment, and 64 training patterns and 8 test patterns inthe full-field viewing fMRI experiment. It is important to notethat the classification comparisons were independent of thevoxel selection procedure (stimulus vs. fixation). Specifically,we ranked voxels by their activations to all stimulus conditionsin contrast to the fixation condition and selected the top 500 vox-els in each ROI. That is, voxel selection was independent of pat-tern classification contrasts (e.g., contour vs. random), avoidingcircularity in themultivoxel pattern analysis (MVPA) procedures.Furthermore, we subtracted the univariate signal for each condi-tion to prevent MVPA classification relying simply on differencesin fMRI responses between stimulus conditions. That is, for eachrun, themean fMRI signal across volumes per conditionwas sub-tracted from the fMRI signal per volume. For each observer, we
calculated the mean accuracy of the classifier’s predictions overcross-validations. To calculate the classifier’s baseline perform-ance, stimulus labels were randomly assigned to experimentalblocks and the same MVPA as described above was conductedfor 1000 times. In addition, the distribution of classificationaccuracies was estimated from actual data by 1000 times of boot-strap resampling. The probability of overlap between distribu-tions of classifier predictions using ordered versus shuffledstimulus labels was estimated to assess significance.
ResultsPsychophysical Experiments
We found that when the contour stimulus moved behind a nar-row fixed (nonmoving) slit that allowed as few as one contourelement to be viewed at any given moment (Fig. 1a), the globalcontour was still detectable. Six observers’ data showed that con-tour detection was near chance whenmeasured at a slit width of0.2 times the AIED (Fig. 1b). However, the performance was im-proved to approximately 70% correct when the slit width was in-creased to 0.4 AIED, where only one contour element or part of itwas visible at any given moment. The slope of a line connectingthe data points at 0.2 and 0.4 AIED was 0.86. A further increase inthe slit width to 0.8 AIED, where parts of 2 neighboring contourelementswere sometimes visible at the same time, elevated con-tour detection rate to approximately 80%, but at a much slowerspeed (slope = 0.19). There was additional slight improvementof performance by approximately 6.4% as the slit width increasedfrom 1 to 2 AIED when 2 neighboring contour elements weresometimes fully visible at the same time (slope = 0.06). Furtherincreasing the slit width, which allowed spatial interaction ofneighboring contour elements, had a smaller incremental impacton contour detection. These results show that global contour de-tection under the slit-viewing condition is possiblewith temporalintegration of neighboring contour elements. As we pointed outearlier, such contour processingwith our particular stimulus con-figurations may not be mediated by V1 horizontal connections.
CI over space is known to obey the Gestalt rule of good con-tinuity (Field et al. 1993). To examine whether collinearity isalso crucial for CI over time, 4 observers from the previous experi-ment (Fig. 1b) perform the contour detection task again. How-ever, the orientations of individual contour elements were nowjitteredwithin a range of 0°, ±10°, ±20°, ±30°, or±45° from the con-tour path, while the slit was 1 AIEDwide. Contour detection dete-riorated with increasing orientation jitter and reached chancelevel at ±45° orientation jitter (Fig. 1c). These results indicatethat collinearity is as important in CI over time as over space.
As a control, we examined whether contour detection couldbe alternatively due to the perception of similarly oriented con-tour elements along the slit over time through a simple probabil-ity summation mechanism across time. Contour detectionperformance was compared with iso-oriented contour elementsall deviating from the contour path by 0°–90° at steps of 15°. Suchorientation deviations reduced collinearity while keeping thelocal orientation similarity unchanged. The same 4 observersfrom Figure 1c performed this experiment. Their detection per-formance decreased as the orientation deviation increased,reaching the chance level when the orientation deviation waslarger than 30° (Fig. 1d). The performance slightly recoveredwhen the contour elements were all orthogonal to the path (90°deviation). Therefore, the potential detection of similarly or-iented contour elements along the vertical slit could not accountfor contour detection under the slit-viewing condition.
Contour Integration over Time Kuai et al. | 3045
For the collinear contour stimuli shown in Figure 1a, the ob-servers might have responded on the basis of a barberpole illu-sion kind of percept: The up or down movements of thecontour elements along the vertical slit. This possibility has notbeen completely ruled out by Figure 1d because in the latter ex-periment, the orientation of contour elements deviated fromthe contour path. To further examine this possibility, we separ-ately jittered the positions of individual contour elements alongthe direction perpendicular to the contour path. This lateral pos-ition jitter destroyed the collinearity without changing the orien-tations of the contour elements. As a result, the up or downmotions of individual contour elements were largely unchangedwhen viewed through the narrow slit, and so was the potentialbarberpole illusion. Data from 4 observers showed that the con-tour detection performance started to decrease after the averageposition jitter was over ±0.5 AIED, and rapidly approached thechance level when the jitter was larger than ±1.5 AIED (Fig. 1e).These results suggest that contour detection under slit-viewingis unlikely a result of the barberpole illusion.
fMRI Experiments
The above psychophysical data suggest that CI over timemay notnecessarily involve V1 horizontal connections.We conducted thefollowing fMRI experiments to examine the cortical mechanismunderlying this new CI format.
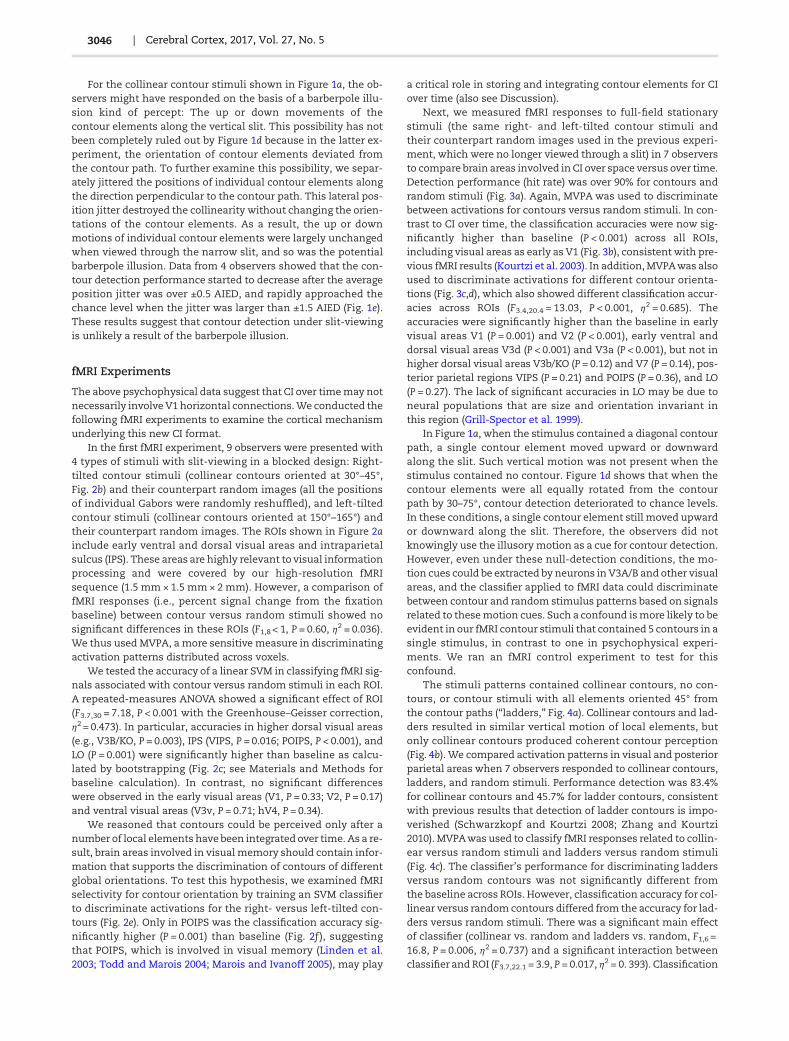
In the first fMRI experiment, 9 observers were presented with4 types of stimuli with slit-viewing in a blocked design: Right-tilted contour stimuli (collinear contours oriented at 30°–45°,Fig. 2b) and their counterpart random images (all the positionsof individual Gabors were randomly reshuffled), and left-tiltedcontour stimuli (collinear contours oriented at 150°–165°) andtheir counterpart random images. The ROIs shown in Figure 2ainclude early ventral and dorsal visual areas and intraparietalsulcus (IPS). These areas are highly relevant to visual informationprocessing and were covered by our high-resolution fMRIsequence (1.5 mm× 1.5 mm× 2 mm). However, a comparison offMRI responses (i.e., percent signal change from the fixationbaseline) between contour versus random stimuli showed nosignificant differences in these ROIs (F1,8 < 1, P = 0.60, η2 = 0.036).We thus used MVPA, a more sensitive measure in discriminatingactivation patterns distributed across voxels.
We tested the accuracy of a linear SVM in classifying fMRI sig-nals associated with contour versus random stimuli in each ROI.A repeated-measures ANOVA showed a significant effect of ROI(F3.7,30 = 7.18, P < 0.001 with the Greenhouse–Geisser correction,η2 = 0.473). In particular, accuracies in higher dorsal visual areas(e.g., V3B/KO, P = 0.003), IPS (VIPS, P = 0.016; POIPS, P < 0.001), andLO (P = 0.001) were significantly higher than baseline as calcu-lated by bootstrapping (Fig. 2c; see Materials and Methods forbaseline calculation). In contrast, no significant differenceswere observed in the early visual areas (V1, P = 0.33; V2, P = 0.17)and ventral visual areas (V3v, P = 0.71; hV4, P = 0.34).
We reasoned that contours could be perceived only after anumber of local elements have been integrated over time. As a re-sult, brain areas involved in visual memory should contain infor-mation that supports the discrimination of contours of differentglobal orientations. To test this hypothesis, we examined fMRIselectivity for contour orientation by training an SVM classifierto discriminate activations for the right- versus left-tilted con-tours (Fig. 2e). Only in POIPS was the classification accuracy sig-nificantly higher (P = 0.001) than baseline (Fig. 2f ), suggestingthat POIPS, which is involved in visual memory (Linden et al.2003; Todd and Marois 2004; Marois and Ivanoff 2005), may play
a critical role in storing and integrating contour elements for CIover time (also see Discussion).
Next, we measured fMRI responses to full-field stationarystimuli (the same right- and left-tilted contour stimuli andtheir counterpart random images used in the previous experi-ment, which were no longer viewed through a slit) in 7 observersto compare brain areas involved in CI over space versus over time.Detection performance (hit rate) was over 90% for contours andrandom stimuli (Fig. 3a). Again, MVPA was used to discriminatebetween activations for contours versus random stimuli. In con-trast to CI over time, the classification accuracies were now sig-nificantly higher than baseline (P < 0.001) across all ROIs,including visual areas as early as V1 (Fig. 3b), consistent with pre-vious fMRI results (Kourtzi et al. 2003). In addition,MVPAwas alsoused to discriminate activations for different contour orienta-tions (Fig. 3c,d), which also showed different classification accur-acies across ROIs (F3.4,20.4 = 13.03, P < 0.001, η2 = 0.685). Theaccuracies were significantly higher than the baseline in earlyvisual areas V1 (P = 0.001) and V2 (P < 0.001), early ventral anddorsal visual areas V3d (P < 0.001) and V3a (P < 0.001), but not inhigher dorsal visual areas V3b/KO (P = 0.12) and V7 (P = 0.14), pos-terior parietal regions VIPS (P = 0.21) and POIPS (P = 0.36), and LO(P = 0.27). The lack of significant accuracies in LO may be due toneural populations that are size and orientation invariant inthis region (Grill-Spector et al. 1999).
In Figure 1a, when the stimulus contained a diagonal contourpath, a single contour element moved upward or downwardalong the slit. Such vertical motion was not present when thestimulus contained no contour. Figure 1d shows that when thecontour elements were all equally rotated from the contourpath by 30–75°, contour detection deteriorated to chance levels.In these conditions, a single contour element still moved upwardor downward along the slit. Therefore, the observers did notknowingly use the illusory motion as a cue for contour detection.However, even under these null-detection conditions, the mo-tion cues could be extracted by neurons in V3A/B and other visualareas, and the classifier applied to fMRI data could discriminatebetween contour and random stimulus patterns based on signalsrelated to thesemotion cues. Such a confound ismore likely to beevident in our fMRI contour stimuli that contained 5 contours in asingle stimulus, in contrast to one in psychophysical experi-ments. We ran an fMRI control experiment to test for thisconfound.
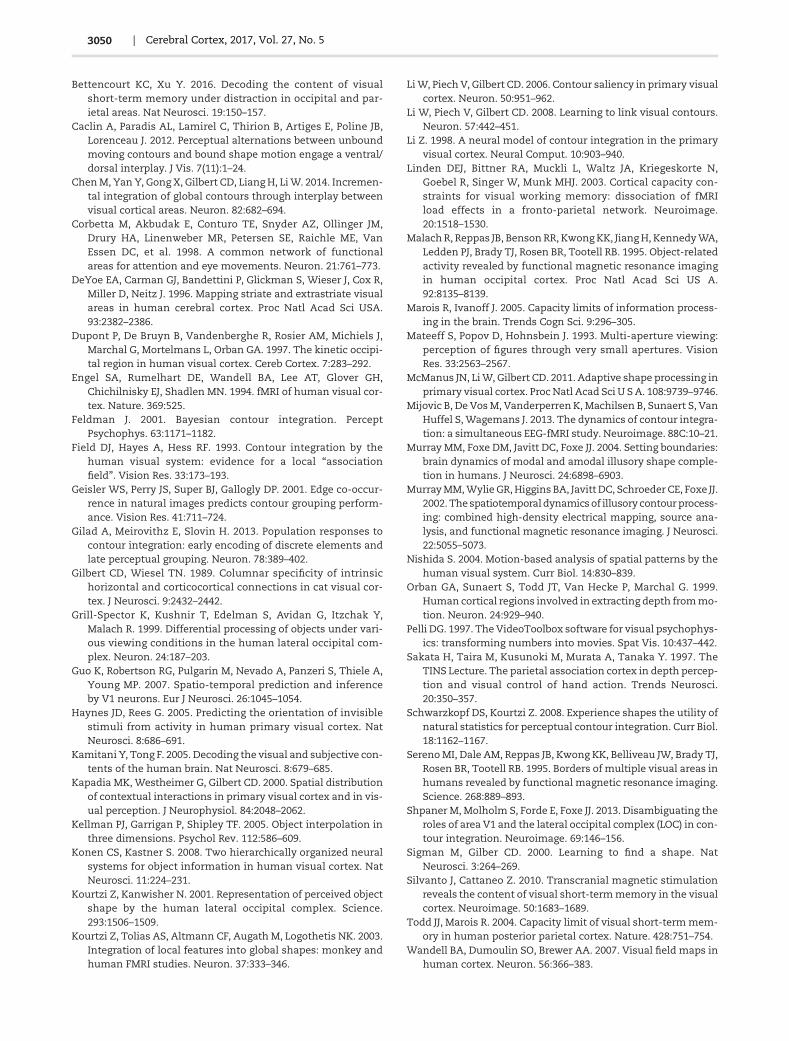
The stimuli patterns contained collinear contours, no con-tours, or contour stimuli with all elements oriented 45° fromthe contour paths (“ladders,” Fig. 4a). Collinear contours and lad-ders resulted in similar vertical motion of local elements, butonly collinear contours produced coherent contour perception(Fig. 4b). We compared activation patterns in visual and posteriorparietal areas when 7 observers responded to collinear contours,ladders, and random stimuli. Performance detection was 83.4%for collinear contours and 45.7% for ladder contours, consistentwith previous results that detection of ladder contours is impo-verished (Schwarzkopf and Kourtzi 2008; Zhang and Kourtzi2010). MVPAwas used to classify fMRI responses related to collin-ear versus random stimuli and ladders versus random stimuli(Fig. 4c). The classifier’s performance for discriminating laddersversus random contours was not significantly different fromthe baseline across ROIs. However, classification accuracy for col-linear versus randomcontours differed from the accuracy for lad-ders versus random stimuli. There was a significant main effectof classifier (collinear vs. random and ladders vs. random, F1,6 =16.8, P = 0.006, η2 = 0.737) and a significant interaction betweenclassifier and ROI (F3.7,22.1 = 3.9, P = 0.017, η2 = 0. 393). Classification
| Cerebral Cortex, 2017, Vol. 27, No. 53046

accuracy was significantly higher for collinear versus randomstimuli than for ladders versus random stimuli in the dorsal vis-ual areas (F1,6 = 25.6, P = 0.002, η2 = 0.81), LO [t(6) = 2.88, P = 0.028,Cohen’s d = 1.09], and IPS (F1,6 = 21.51, P = 0.004, η2 = 0.78), butnot in the early visual areas (F1,6 = 1.35, P = 0.29, η2 = 0.18). Further-more, the classification accuracy showed a similar pattern be-tween collinear versus random stimuli and collinear versusladder stimuli. There were a nonsignificant main effect of classi-fier (F1,6= 1.5, P = 0.267, η2= 0.20) and a nonsignificant interactionbetween classifier and ROI (F3.5, 21.2 = 1.07, P = 0.39, η2 = 0.15),
confirming that the activities in these areas reflect integrationsignals under slit-viewing. These results suggest that higher vis-ual (ventral and dorsal) and posterior parietal regions contain in-formation about the perceived contours under the slit-viewingcondition, rather than the perceived vertical motion of similarlyoriented contour elements.
We performed additional control analyses to examinewhether the observed fMRI activation patterns could be due todifferences in general arousal levels or eye movements. We didnot observe any significant univariate BOLD signal differences
Figure 2. fMRI results for CI over time under slit-viewing conditions. (a) ROIs in fMRI experiments. (b) A stimulus image containing 5 right-tilted contour paths. (c) The
behavioral accuracies (hit rates) of judging whether the stimuli were contour stimuli or random Gabors. (d) The mean MVPA accuracies for the classification of fMRI
responses to contours versus random Gabors. (e) The behavioral accuracies (hit rates) of judging whether the contour stimuli were left-tilted or right-tilted. (f ) The
mean MVPA accuracies for the classification of fMRI responses to left- versus right-tilted contours. Dashed lines represent the mean upper limits of the 95%
confidence interval calculated by shuffling the classification labels (upper confidence limits were very similar across ROIs).
Contour Integration over Time Kuai et al. | 3047
(a)
(c)
(e) (f)
(d)
(b)

between contour stimuli and random stimuli in the first fMRI ex-periment (F1,8 < 1, P = 0.60, η2= 0.036), suggesting that the fMRI re-sults with the slit-viewing condition could not be explained byhigher general arousal levels for salient contours. Comparingslit-viewing (Fig. 2) and full-field viewing (Fig. 3) conditions didnot reveal a significant main effect of viewing condition(F1,14 < 1, P = 0.51, η2 = 0.031). Behavioral performance in contourdetection did not differ between slit-viewing and full-fieldviewing either [90.9 ± 1.2% vs. 93.3 ± 4.2%, t(14) < 1, P = 0.55,Cohen’s d = 0.29]. Thus, the different activation patterns couldnot be explained by the differences in task difficulty that mayalter observers’ general arousal levels.
We recorded eye movements from 4 observers with an ASL6000 Eye-tracker (Applied Science Laboratories, Bedford, MA,USA). Eye-tracking data were preprocessed with the Eyenal soft-ware from the same company and analyzed with custom Matlabcode. For each stimulus condition, we calculated the horizontaland vertical eye positions and the amplitude and number of sac-cades. For each stimulus type, histograms of the horizontal andvertical eye positions were centered on the fixation at 0°. Pairedt-tests indicated no significant differences in horizontal eyeposition [t(3) < 1, P = 0.47, Cohen’s d = 0.41], vertical eye posi-tion [t(3) < 1, P = 0.57, Cohen’s d = 0.32], number of saccades[t(3) < 1, P = 0.61, Cohen’s d = 0.29], horizontal saccade amplitude[t(3) = 1.3, P = 0.27, Cohen’s d = 0.68], and vertical saccade ampli-tude [t(3) < 1, P = 0.95, Cohen’s d = 0.04], regardless of whetherthe slit-viewed stimulus image contained contours or not.In addition, we did not find significant difference of eye positionsin the first half and second half of a trial in the horizontal eyeposition (F1,3 = 3.5, P = 0.16, η2 = 0.54), vertical eye position
(F1,3 < 1, P = 0.41, η2= 0.23), number of saccades (F1,3 = 1.7, P = 0.29,η2 = 0.36), horizontal saccade amplitude (F1,3 = 3.8, P = 0.15, η2 =0.56), and vertical saccade amplitude (F1,3 = 3.5, P = 0.16, η2 = 0.54),suggesting that eye positions did not change systematicallyover time.
DiscussionStatistical analysis of natural scene images demonstrates thatcollinearity and co-circularity occur at a higher probability thanother geometrical relationships (Sigman and Gilber 2000; Geisleret al. 2001). These regularities well fit the Gestalt grouping rule ofgood continuity (Feldman 2001; Geisler et al. 2001). Our slit-viewed contour stimuli by design minimize the roles of V1long-range horizontal connections, so that the Gestalt rule ofgood continuation needs to be implemented by higher-level me-chanisms. This is feasible since the visual system may acquirecontour statistics from mechanisms that may not entirely relyon low-level V1 horizontal connections (Geisler et al. 2001). In-deed, our fMRI evidence indicates the engagement of posteriorparietal regions known to be involved in visualmemory, and dor-sal and ventral visual areas known to be involved in motion andshape processing, in CI over time.
Our fMRI results suggest that the posterior parietal cortex(POIPS) contains information related to the orientation of con-tours that are integrated over time (Fig. 2f ). In contrast, ventralareas like LO that are representation invariant are ill-suited forthe precise spatial and temporal encoding of contour elementsthat are integrated over time (Fig. 2f ). POIPS is known to be in-volved not only in visual working memory (Todd and Marois
V1 V2
50
60
70
80
90
100
Cla
ssifi
catio
n ac
cura
cy (
%)
V3v V4 LO V3d V3AV3B/KOV7 MT VIPS POIPS
V1 V2
50
60
70
80
90
100
Cla
ssifi
catio
n ac
cura
cy (
%)
V3v V4 LO V3d V3AV3B/KOV7 MT VIPS POIPS
Contours vs. random Gabors
Left- vs. right-tilted contours
Contour Random0
20
40
60
80
100
20
40
60
80
100
Left Right
(a)
(c)
(b)
(d)
N = 7
Hit
rate
(%
)H
it ra
te (
%)
Figure 3. fMRI results for CI over space. (a) The behavioral accuracies (hit rates) of judgingwhether the stimuli were contour stimuli or randomGabors. (b) ThemeanMVPA
accuracy for the classification of fMRI responses to contours versus random Gabors. (c) The behavioral accuracies (hit rates) of judging whether the contour stimuli were
left-tilted or right-tilted. (d) The mean MVPA accuracy for the classification of fMRI responses to left- versus right-tilted contours. Dashed lines indicate the mean upper
limits of the 95% confidence interval on the basis of bootstrap analysis.
| Cerebral Cortex, 2017, Vol. 27, No. 53048

2004; Marois and Ivanoff 2005; Xu and Chun 2006), but also in at-tentional processing (Corbetta et al. 1998). However, differentialPOIPS activation patterns for different contour orientations sug-gest that here POIPS is mainly responsible for CI over time in thevisual memory, rather than for general attentional processing,consistent with other studies on slit-viewing (Mateeff et al.1993; Nishida 2004; Silvanto and Cattaneo 2010). The roles ofthe dorsal areas in global percepts defined by motion signalshave also been reported elsewhere (Caclin et al. 2012; Zaretskayaet al. 2013).
Our results also show that POIPS activation patterns cannotdiscriminate the orientations of full-field contours (Fig. 3d), con-sistent with Konen and Kastner (2008) in that regions of IPS areorientation invariant for spatial stimuli. As the key difference be-tween CI over space versus time is the requirement of visualmemory, the conflicting roles of POIPS in CI over space versustime suggest that POIPS may be involved in short-term visualmemory processes necessary for CI under slit-viewing. Wespeculate that POIPS memorizes orientations of contour ele-ments passed through a slit and reconstruct the image of contourpaths. The findings in agreement with previous studies showthat superior IPS maintains details of object features in visualmemory (Xu and Chun 2006; Bettencourt and Xu 2016).
However, CI over time and spacemay share some componentprocesses. Our fMRI evidence indicates that ventral areas like LOalso participate in CI over time (Fig. 2d), and that both dorsal andventral areas are involved in CI over space (Fig. 3b) as in othersimilar imaging studies (Murray et al. 2002, 2004; Altmann et al.2003; Kourtzi et al. 2003; Shpaner et al. 2013). Moreover, 3D spatialcontour interpolation, which involves integration of informationfrom multiple depth cues, requires parietal areas as well (Sakataet al. 1997; Kellman et al. 2005). It is likely that, regardless of
where and how the CI process is initially implemented in thebrain, the higher-tier ventral areas responsible for global formprocessing, such as the LO, are necessary for global contourperception.
As a final note, in this study, the exclusion of the roles of V1horizontal connections in CI over time is based on the psycho-physical stimulus design, not the null difference of V1 BOLD pat-terns between the contour and random stimuli (Fig. 2d). Becauseof the limited spatial resolution of fMRI, in principle, a voxel isunable to separate the activations by the contour and randomstimuli (Guo et al. 2007), regardless of whether or not V1 neuronsare able to detect the slit-viewed contours.
FundingThis research was supported by the European Community’s Sev-enth Framework Programme (FP7/2007-2013) under grant agree-ment no. 255577, the Biotechnology and Biological SciencesResearch Council to Z.K. (D52199X and E027436), and NationalNatural Science Foundation of China Grants to C.Y. (31230030),S.K. (31571160), and W.L. (91432102).
NotesConflict of Interest: None declared.
ReferencesAltmann CF, Bulthoff HH, Kourtzi Z. 2003. Perceptual organiza-
tion of local elements into global shapes in the human visualcortex. Curr Biol. 13:342–349.
Figure4. fMRI results for CI over timeunder slit-viewing conditionswith ladder contours. (a) A stimulus images containing 5 ladder contourswith all elements oriented 45°
from the contour paths. The arrows indicate one contour path. (b) The behavioral detection rates for collinear and ladder contours. (c) MVPA accuracies for the
classification of fMRI responses to collinear versus random stimuli, collinear versus ladder stimuli, and ladder versus random stimuli. Dashed lines indicate the upper
limits at the 95% confidence level from bootstrap analysis.
Contour Integration over Time Kuai et al. | 3049
(a)
(b)
Collinear Ladders0
20
40
60
80
100
Per
cent
cor
rect
(%
)
(c)
Collinear vs. ladders Ladders vs. random
Cla
ssifi
catio
n ac
cura
cy (
%)
N = 7
V1 V2
50
60
70
80
90
V3v V4 LO
50
60
70
80
90
V3d V3A V3B/KO V7 MT
50
60
70
80
90
VIPS POIPS
50
60
70
80
90
Collinear vs. random
Bettencourt KC, Xu Y. 2016. Decoding the content of visualshort-term memory under distraction in occipital and par-ietal areas. Nat Neurosci. 19:150–157.
Caclin A, Paradis AL, Lamirel C, Thirion B, Artiges E, Poline JB,Lorenceau J. 2012. Perceptual alternations between unboundmoving contours and bound shape motion engage a ventral/dorsal interplay. J Vis. 7(11):1–24.
ChenM, Yan Y, Gong X, Gilbert CD, Liang H, LiW. 2014. Incremen-tal integration of global contours through interplay betweenvisual cortical areas. Neuron. 82:682–694.
Corbetta M, Akbudak E, Conturo TE, Snyder AZ, Ollinger JM,Drury HA, Linenweber MR, Petersen SE, Raichle ME, VanEssen DC, et al. 1998. A common network of functionalareas for attention and eye movements. Neuron. 21:761–773.
DeYoe EA, Carman GJ, Bandettini P, Glickman S, Wieser J, Cox R,Miller D, Neitz J. 1996. Mapping striate and extrastriate visualareas in human cerebral cortex. Proc Natl Acad Sci USA.93:2382–2386.
Dupont P, De Bruyn B, Vandenberghe R, Rosier AM, Michiels J,Marchal G, Mortelmans L, Orban GA. 1997. The kinetic occipi-tal region in human visual cortex. Cereb Cortex. 7:283–292.
Engel SA, Rumelhart DE, Wandell BA, Lee AT, Glover GH,Chichilnisky EJ, Shadlen MN. 1994. fMRI of human visual cor-tex. Nature. 369:525.
Feldman J. 2001. Bayesian contour integration. PerceptPsychophys. 63:1171–1182.
Field DJ, Hayes A, Hess RF. 1993. Contour integration by thehuman visual system: evidence for a local “associationfield”. Vision Res. 33:173–193.
Geisler WS, Perry JS, Super BJ, Gallogly DP. 2001. Edge co-occur-rence in natural images predicts contour grouping perform-ance. Vision Res. 41:711–724.
Gilad A, Meirovithz E, Slovin H. 2013. Population responses tocontour integration: early encoding of discrete elements andlate perceptual grouping. Neuron. 78:389–402.
Gilbert CD, Wiesel TN. 1989. Columnar specificity of intrinsichorizontal and corticocortical connections in cat visual cor-tex. J Neurosci. 9:2432–2442.
Grill-Spector K, Kushnir T, Edelman S, Avidan G, Itzchak Y,Malach R. 1999. Differential processing of objects under vari-ous viewing conditions in the human lateral occipital com-plex. Neuron. 24:187–203.
Guo K, Robertson RG, Pulgarin M, Nevado A, Panzeri S, Thiele A,Young MP. 2007. Spatio-temporal prediction and inferenceby V1 neurons. Eur J Neurosci. 26:1045–1054.
Haynes JD, Rees G. 2005. Predicting the orientation of invisiblestimuli from activity in human primary visual cortex. NatNeurosci. 8:686–691.
Kamitani Y, Tong F. 2005. Decoding the visual and subjective con-tents of the human brain. Nat Neurosci. 8:679–685.
Kapadia MK,Westheimer G, Gilbert CD. 2000. Spatial distributionof contextual interactions in primary visual cortex and in vis-ual perception. J Neurophysiol. 84:2048–2062.
Kellman PJ, Garrigan P, Shipley TF. 2005. Object interpolation inthree dimensions. Psychol Rev. 112:586–609.
Konen CS, Kastner S. 2008. Two hierarchically organized neuralsystems for object information in human visual cortex. NatNeurosci. 11:224–231.
Kourtzi Z, Kanwisher N. 2001. Representation of perceived objectshape by the human lateral occipital complex. Science.293:1506–1509.
Kourtzi Z, Tolias AS, Altmann CF, Augath M, Logothetis NK. 2003.Integration of local features into global shapes: monkey andhuman FMRI studies. Neuron. 37:333–346.
LiW, Piech V, Gilbert CD. 2006. Contour saliency in primary visualcortex. Neuron. 50:951–962.
Li W, Piech V, Gilbert CD. 2008. Learning to link visual contours.Neuron. 57:442–451.
Li Z. 1998. A neural model of contour integration in the primaryvisual cortex. Neural Comput. 10:903–940.
Linden DEJ, Bittner RA, Muckli L, Waltz JA, Kriegeskorte N,Goebel R, Singer W, Munk MHJ. 2003. Cortical capacity con-straints for visual working memory: dissociation of fMRIload effects in a fronto-parietal network. Neuroimage.20:1518–1530.
MalachR, Reppas JB, Benson RR, Kwong KK, JiangH, KennedyWA,Ledden PJ, Brady TJ, Rosen BR, Tootell RB. 1995. Object-relatedactivity revealed by functional magnetic resonance imagingin human occipital cortex. Proc Natl Acad Sci US A.92:8135–8139.
Marois R, Ivanoff J. 2005. Capacity limits of information process-ing in the brain. Trends Cogn Sci. 9:296–305.
Mateeff S, Popov D, Hohnsbein J. 1993. Multi-aperture viewing:perception of figures through very small apertures. VisionRes. 33:2563–2567.
McManus JN, LiW, Gilbert CD. 2011. Adaptive shape processing inprimary visual cortex. Proc Natl Acad Sci U S A. 108:9739–9746.
Mijovic B, De VosM, Vanderperren K, Machilsen B, Sunaert S, VanHuffel S, Wagemans J. 2013. The dynamics of contour integra-tion: a simultaneous EEG-fMRI study. Neuroimage. 88C:10–21.
Murray MM, Foxe DM, Javitt DC, Foxe JJ. 2004. Setting boundaries:brain dynamics of modal and amodal illusory shape comple-tion in humans. J Neurosci. 24:6898–6903.
MurrayMM,Wylie GR,Higgins BA, Javitt DC, Schroeder CE, Foxe JJ.2002. Thespatiotemporaldynamicsof illusory contourprocess-ing: combined high-density electrical mapping, source ana-lysis, and functional magnetic resonance imaging. J Neurosci.22:5055–5073.
Nishida S. 2004. Motion-based analysis of spatial patterns by thehuman visual system. Curr Biol. 14:830–839.
Orban GA, Sunaert S, Todd JT, Van Hecke P, Marchal G. 1999.Human cortical regions involved in extracting depth frommo-tion. Neuron. 24:929–940.
Pelli DG. 1997. The VideoToolbox software for visual psychophys-ics: transforming numbers into movies. Spat Vis. 10:437–442.
Sakata H, Taira M, Kusunoki M, Murata A, Tanaka Y. 1997. TheTINS Lecture. The parietal association cortex in depth percep-tion and visual control of hand action. Trends Neurosci.20:350–357.
Schwarzkopf DS, Kourtzi Z. 2008. Experience shapes the utility ofnatural statistics for perceptual contour integration. Curr Biol.18:1162–1167.
SerenoMI, Dale AM, Reppas JB, Kwong KK, Belliveau JW, Brady TJ,Rosen BR, Tootell RB. 1995. Borders of multiple visual areas inhumans revealed by functional magnetic resonance imaging.Science. 268:889–893.
Shpaner M, Molholm S, Forde E, Foxe JJ. 2013. Disambiguating theroles of area V1 and the lateral occipital complex (LOC) in con-tour integration. Neuroimage. 69:146–156.
Sigman M, Gilber CD. 2000. Learning to find a shape. NatNeurosci. 3:264–269.
Silvanto J, Cattaneo Z. 2010. Transcranial magnetic stimulationreveals the content of visual short-termmemory in the visualcortex. Neuroimage. 50:1683–1689.
Todd JJ, Marois R. 2004. Capacity limit of visual short-termmem-ory in human posterior parietal cortex. Nature. 428:751–754.
Wandell BA, Dumoulin SO, Brewer AA. 2007. Visual field maps inhuman cortex. Neuron. 56:366–383.
| Cerebral Cortex, 2017, Vol. 27, No. 53050

Xu YD, ChunMM. 2006. Dissociable neural mechanisms support-ing visual short-term memory for objects. Nature. 440:91–95.
Zaretskaya N, Anstis S, Bartels A. 2013. Parietal cortex mediatesconscious perception of illusory gestalt. J Neurosci. 33:523–531.
Zeki S, Perry RJ, Bartels A. 2003. The processing of kinetic con-tours in the brain. Cereb Cortex. 13:189–202.
Zeki S,Watson JD, Lueck CJ, Friston KJ, Kennard C, Frackowiak RS.1991. A direct demonstration of functional specialization inhuman visual cortex. J Neurosci. 11:641–649.
Zhang J, Kourtzi Z. 2010. Learning-dependent plasticity with andwithout training in the human brain. Proc Natl Acad Sci USA.107:13503–13508.
Contour Integration over Time Kuai et al. | 3051