Continuous Metering and Monitoring of PUE in Data...
13
Continuous Metering and Monitoring of PUE in Data Centers Executive summary A PUE (power usage effectiveness) meter- ing scheme in a data center can be very simplistic consisting theoretically of only two meters, at one extreme, or it can be much more comprehensive and consist of dozens of metering points. This paper provides guidance on determining what level of me- tering is appropriate for a particular data center, given its capacity (kW), power and cooling architecture, business objectives, and the degree to which infrastructure sys- tems (e.g., chillers, generators) are shared. Revision 0 White Paper 204 by Wendy Torell
Transcript of Continuous Metering and Monitoring of PUE in Data...
Continuous Metering and
Monitoring of PUE in Data Centers
Executive summary A PUE (power usage effectiveness) meter-ing scheme in a data center can be very simplistic consisting theoretically of only two meters, at one extreme, or it can be much more comprehensive and consist of dozens of metering points. This paper provides guidance on determining what level of me-tering is appropriate for a particular data center, given its capacity (kW), power and cooling architecture, business objectives, and the degree to which infrastructure sys-tems (e.g., chillers, generators) are shared.
Revision 0 White Paper 204
by Wendy Torell
Schneider Electric – Data Center Science Center White Paper 204 Rev 0 2
Continuous Metering and Monitoring of PUE in Data Centers
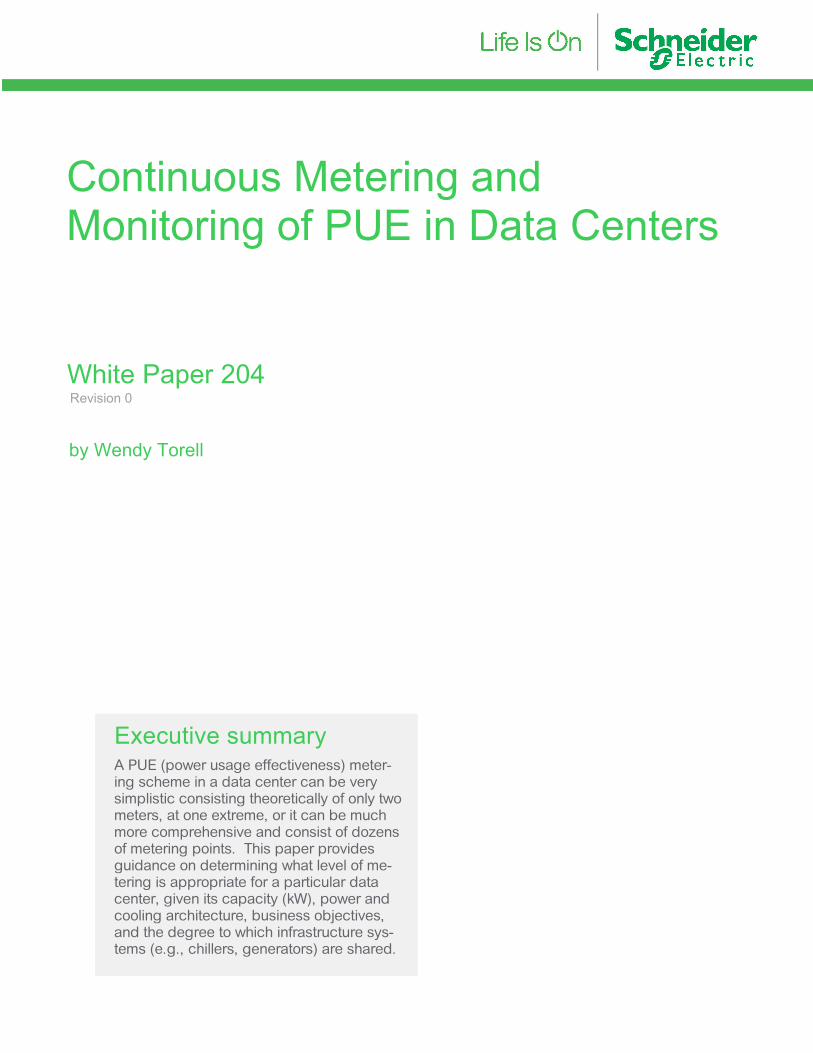
Power usage effectiveness (PUE) is the industry-accepted energy efficiency metric for the physical infrastructure systems (e.g. power and cooling) that support the IT loads of a data center. There are a number of reasons you may want to report your data center’s PUE; maybe you have an internal requirement as part of a green/en-ergy initiative within your company, or maybe you are required to meet a regulation or mandate (for example, the US government has instituted an executive order mandating measurement of PUE in government data centers); or maybe you want to promote your data center as “best-in-class”. There are three general approaches to obtaining a PUE (Table 1) value, with some more suitable than others given a particular business objective.
White Paper 154, Electrical Efficiency Measurement for Data Centers, provides an introduction to the PUE metric, discusses what the key drivers are, and discusses the role that models and measurements play in understanding and acting on the data. There are publicly available tools, such as the Schneider Electric TradeOff Tool, Data Center Efficiency Calculator, that allows you to estimate a PUE, given specific design conditions including the capacity, IT load, power architecture, cool-ing architecture, air flow management practices, and so on. But with any calculator or estimator, there are underlying assumptions that may or may not hold true for an actual data center. Vendors and consultants offer services to assess the efficiency of a data center, where temporary meters are brought on site to measure the data center’s PUE. This provides an excellent benchmark for a data center on a path to-wards improved efficiency, but, the data represents a point in time only. Consider this scenario. You are conducting an onsite energy audit to measure the PUE of your data center. There are no permanent meters in place, so the engineer brings in a temporary meter to clamp various circuits and take measurements. He starts by measuring the IT load in the morning while it was at a high value. He measures the variable speed air handlers later in the day, but the load on the air handlers is not the same as it was when the load was measured. If the load is now lower, for example, the resulting PUE would be artificially low because the variable speed fans would have ramped down. In addition, since the cooling energy draw is dependent on weather, which varies day by day and month to month, a measure-ment on single day does not reflect an annualized PUE. Continuous meters per-manently installed onsite ensure data can be collected in a synchronized way to avoid inaccuracies due to variations throughout the day and throughout the year.
Approach Pro’s Con’s
Estimation with a model
Low to no cost
Allows you to understand effi-ciency tradeoffs of design choices
Considers typical conditions
Model assumptions may not match actual installation
Point-in-time measurement
Moderate cost for one-time energy audit
Provides accurate PUE during measurement
Doesn’t consider weather variations throughout year
Doesn’t consider load varia-tions throughout the day, week, or year
Continuous measurement
Accurate PUE, as it considers vari-ations in load, weather, and sys-tem performance throughout the year
More expensive, but different levels of measurement are possible
Introduction
Table 1 General approaches to obtaining a data center PUE value
Schneider Electric – Data Center Science Center White Paper 204 Rev 0 3
Continuous Metering and Monitoring of PUE in Data Centers
In this paper, we focus on the third approach in Table 1, continuous or “real-time” measurement, and guide you through the following considerations and steps of de-ploying an effective continuous PUE measurement and monitoring system.
1. Choosing the right level of PUE measurement based on PUE objectives
2. Circuit tracing to capture all data center IT and non-IT loads
3. Determining what meters exist (i.e. embedded meters) and what types of me-ters are still needed and where they should be located
4. Installing meters in an operational data center
5. Implementing a monitoring system that aggregates the data
The Green Grid defines four levels of PUE reporting, which vary in terms of accu-racy, cost, and metering complexity. Level 0 is not continuous energy monitoring, so we’ll focus on Levels 1, 2, and 3. The main difference between these levels is the location of the meters for the IT load measurement. • Level 1 – UPS output
• Level 2 – PDU output
• Level 3 – IT equipment input (for example by using metered rack PDUs)
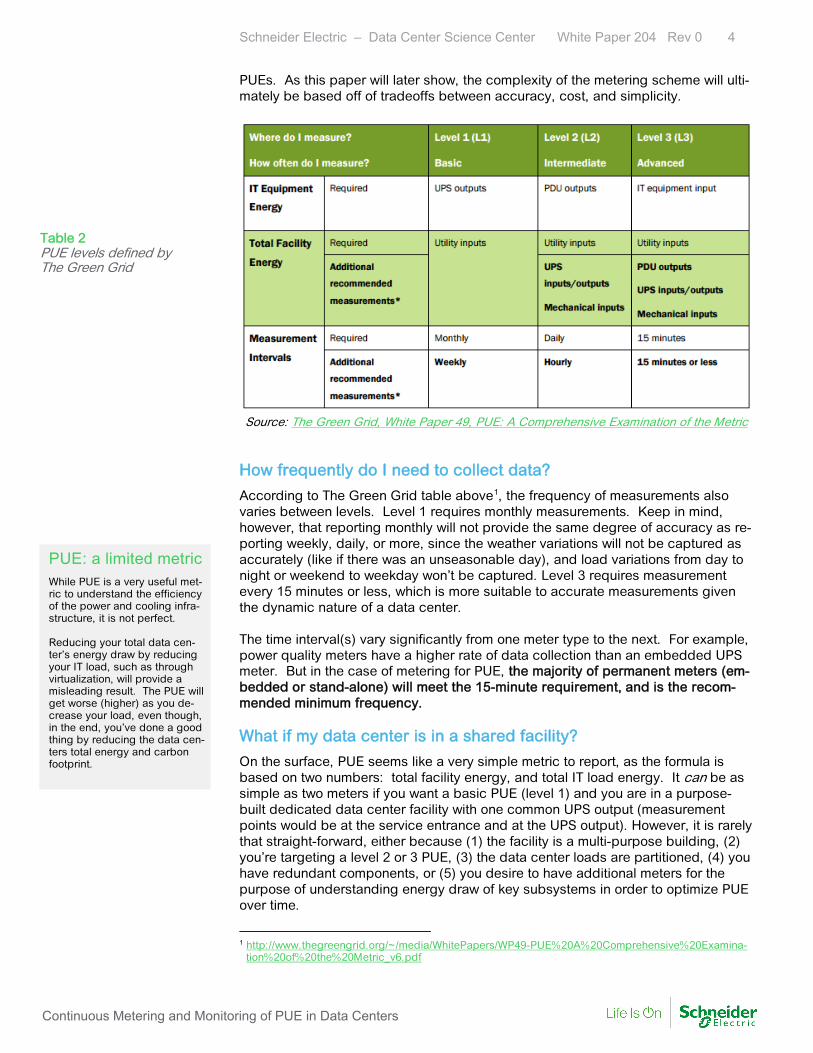
The business objectives for measuring and reporting your PUE will likely play a role in deciding which level is most appropriate. Level 1 is simplest to implement, as the data center UPS likely already has an embedded meter to use as the proxy for IT load. If the need to report PUE is being driven by a mandate, for example, this level may be sufficient. But if there’s a desire to more deeply understand inefficiencies in the data center, a more accurate method may be warranted. The IT load for Level 2 can also likely rely on embedded meters, as most power dis-tribution units (PDUs), remote power panels (RPPs), and busway systems include them. The difference between Level 1 and Level 2 accuracy depends on if there are non-IT loads being powered from the UPS. If there are air handlers, for exam-ple, on the UPS, then using the UPS output meter to represent the IT load would ar-tificially inflate the IT load value and lower (improve) the PUE. If all UPS loads are IT-related, then the difference between the two would be the losses from the power distribution equipment between the UPS and the load, which is relatively small. To report a Level 3, the number of metering points that need to be aggregated will be higher since the load is being measured at the IT rack level. This can increase the complexity, but also provides the most accurate representation of the IT load. Ultimately, metering at Level 3 means more data to better understand why your data center PUE is trending higher or lower over time and most important, what you can do about it. Table 2 summarizes the three levels as defined by The Green Grid. As Table 2 illustrates, The Green Grid’s PUE guideline also prescribes required me-ters at the utility input for the Total Facility Energy value, for all three levels. How-ever, Level 2 and 3 suggest additional meters, such as at the UPS inputs/outputs and mechanical inputs. Whichever level is chosen, it is important to be consistent across all of an organiza-tion’s data centers if the goal is (at least in part) to compare or benchmark their
Choosing the right PUE level
Schneider Electric – Data Center Science Center White Paper 204 Rev 0 4
Continuous Metering and Monitoring of PUE in Data Centers
PUEs. As this paper will later show, the complexity of the metering scheme will ulti-mately be based off of tradeoffs between accuracy, cost, and simplicity.
Source: The Green Grid, White Paper 49, PUE: A Comprehensive Examination of the Metric
How frequently do I need to collect data?
According to The Green Grid table above1, the frequency of measurements also varies between levels. Level 1 requires monthly measurements. Keep in mind, however, that reporting monthly will not provide the same degree of accuracy as re-porting weekly, daily, or more, since the weather variations will not be captured as accurately (like if there was an unseasonable day), and load variations from day to night or weekend to weekday won’t be captured. Level 3 requires measurement every 15 minutes or less, which is more suitable to accurate measurements given the dynamic nature of a data center. The time interval(s) vary significantly from one meter type to the next. For example, power quality meters have a higher rate of data collection than an embedded UPS meter. But in the case of metering for PUE, the majority of permanent meters (em-bedded or stand-alone) will meet the 15-minute requirement, and is the recom-mended minimum frequency. What if my data center is in a shared facility?
On the surface, PUE seems like a very simple metric to report, as the formula is based on two numbers: total facility energy, and total IT load energy. It can be as simple as two meters if you want a basic PUE (level 1) and you are in a purpose-built dedicated data center facility with one common UPS output (measurement points would be at the service entrance and at the UPS output). However, it is rarely that straight-forward, either because (1) the facility is a multi-purpose building, (2) you’re targeting a level 2 or 3 PUE, (3) the data center loads are partitioned, (4) you have redundant components, or (5) you desire to have additional meters for the purpose of understanding energy draw of key subsystems in order to optimize PUE over time.
1 http://www.thegreengrid.org/~/media/WhitePapers/WP49-PUE%20A%20Comprehensive%20Examina-
tion%20of%20the%20Metric_v6.pdf
Table 2 PUE levels defined by The Green Grid
PUE: a limited metric While PUE is a very useful met-ric to understand the efficiency of the power and cooling infra-structure, it is not perfect. Reducing your total data cen-ter’s energy draw by reducing your IT load, such as through virtualization, will provide a misleading result. The PUE will get worse (higher) as you de-crease your load, even though, in the end, you’ve done a good thing by reducing the data cen-ters total energy and carbon footprint.
Schneider Electric – Data Center Science Center White Paper 204 Rev 0 5
Continuous Metering and Monitoring of PUE in Data Centers
A shared facility generally means shared power and cooling infrastructure subsys-tems which typically are large upstream systems like switchgear, generators, and a chiller plant. In order to report a PUE for a data center with shared systems, a por-tion of the energy from those shared systems must be assigned to the data center. There are various ways to do this: • Meter the system, and apply a percentage of that energy to the data center,
based on the ratio of the total building load that is the data center IT load.
• Meter the input of a system, and subtract out sub-meters on the output of the system that are non-data center related. This method works well for electric panels.
• Exclude the energy from the shared subsystem and instead include an esti-mated value for the shared system using a model.
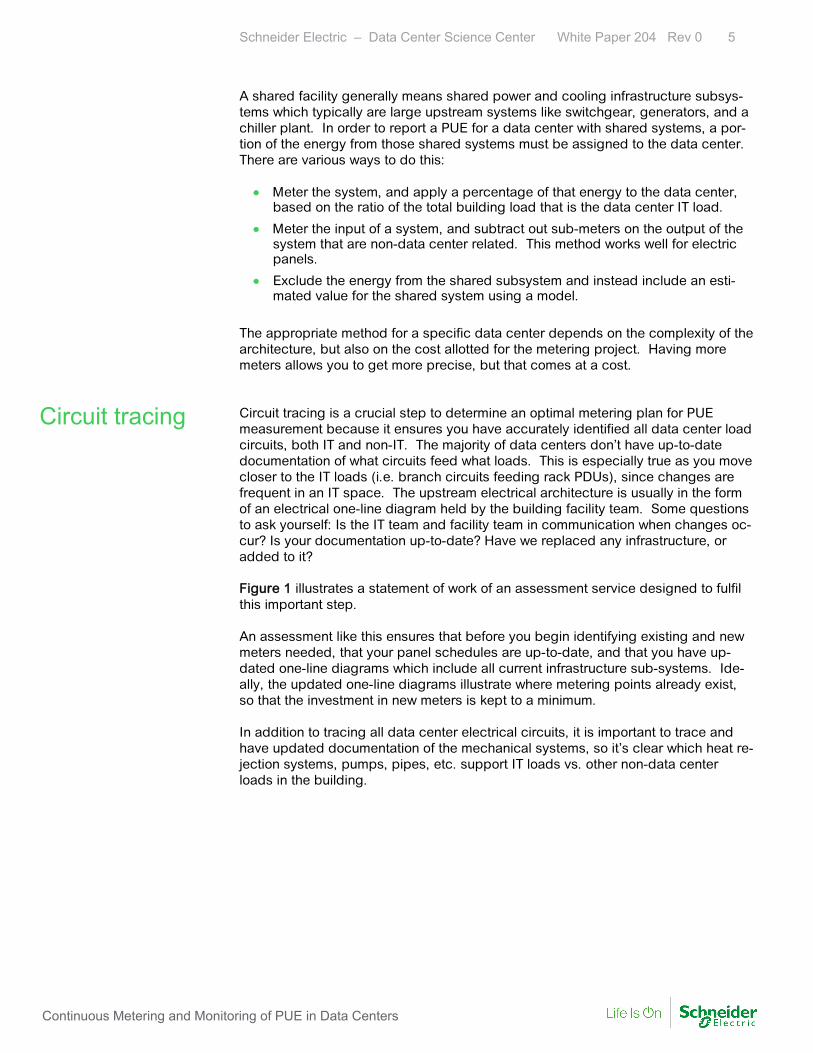
The appropriate method for a specific data center depends on the complexity of the architecture, but also on the cost allotted for the metering project. Having more meters allows you to get more precise, but that comes at a cost. Circuit tracing is a crucial step to determine an optimal metering plan for PUE measurement because it ensures you have accurately identified all data center load circuits, both IT and non-IT. The majority of data centers don’t have up-to-date documentation of what circuits feed what loads. This is especially true as you move closer to the IT loads (i.e. branch circuits feeding rack PDUs), since changes are frequent in an IT space. The upstream electrical architecture is usually in the form of an electrical one-line diagram held by the building facility team. Some questions to ask yourself: Is the IT team and facility team in communication when changes oc-cur? Is your documentation up-to-date? Have we replaced any infrastructure, or added to it? Figure 1 illustrates a statement of work of an assessment service designed to fulfil this important step. An assessment like this ensures that before you begin identifying existing and new meters needed, that your panel schedules are up-to-date, and that you have up-dated one-line diagrams which include all current infrastructure sub-systems. Ide-ally, the updated one-line diagrams illustrate where metering points already exist, so that the investment in new meters is kept to a minimum. In addition to tracing all data center electrical circuits, it is important to trace and have updated documentation of the mechanical systems, so it’s clear which heat re-jection systems, pumps, pipes, etc. support IT loads vs. other non-data center loads in the building.
Circuit tracing
Schneider Electric – Data Center Science Center White Paper 204 Rev 0 6
Continuous Metering and Monitoring of PUE in Data Centers
As already discussed, the number of meters needed and therefore the cost of the metering scheme depends on a number of factors. Finding the right point on the cost vs accuracy spectrum is crucial, as there is no one right method to metering for PUE. Measuring of the IT load is straight-forward, and in many cases requires no addi-tional meters, as the UPSs and PDUs generally have built-in (embedded) meters to provide the data. Measuring the physical infrastructure, on the other hand, often gets more complicated and costlier. In the following sections, we’ll describe meter placement for common data center scenarios. Measuring the IT load
In White Paper 172, Types of Electrical Meters in Data Centers, we discuss the typi-cal cost per kW for different types of meters. Metering solutions for the IT load can have a wide range in cost, from free (when you utilize embedded meters) to $300 per kW of IT load. In the majority of data centers, sufficient metering exists to achieve a Green Grid Level 1 PUE, since most UPS systems provide the needed energy data. If multiple UPSs support the IT loads, the data can either be summed together to obtain the total IT load or the measurement can be taken on the common output bus (i.e. circuit breaker trip unit on the combined output). Data aggregation is achieved through an energy management system such as a DCIM software tool. When the UPS outputs contain only IT loads (no cooling systems or non-data center loads), level 1 is the most cost effective and recommended approach. Note, if not subtracted out, the IT load will be artificially inflated by a small amount, from the losses in the PDU transformers and wires from the UPS to the loads.
Determining placement of meters
Figure 1 Example of circuit tracing assessment
Schneider Electric – Data Center Science Center White Paper 204 Rev 0 7
Continuous Metering and Monitoring of PUE in Data Centers
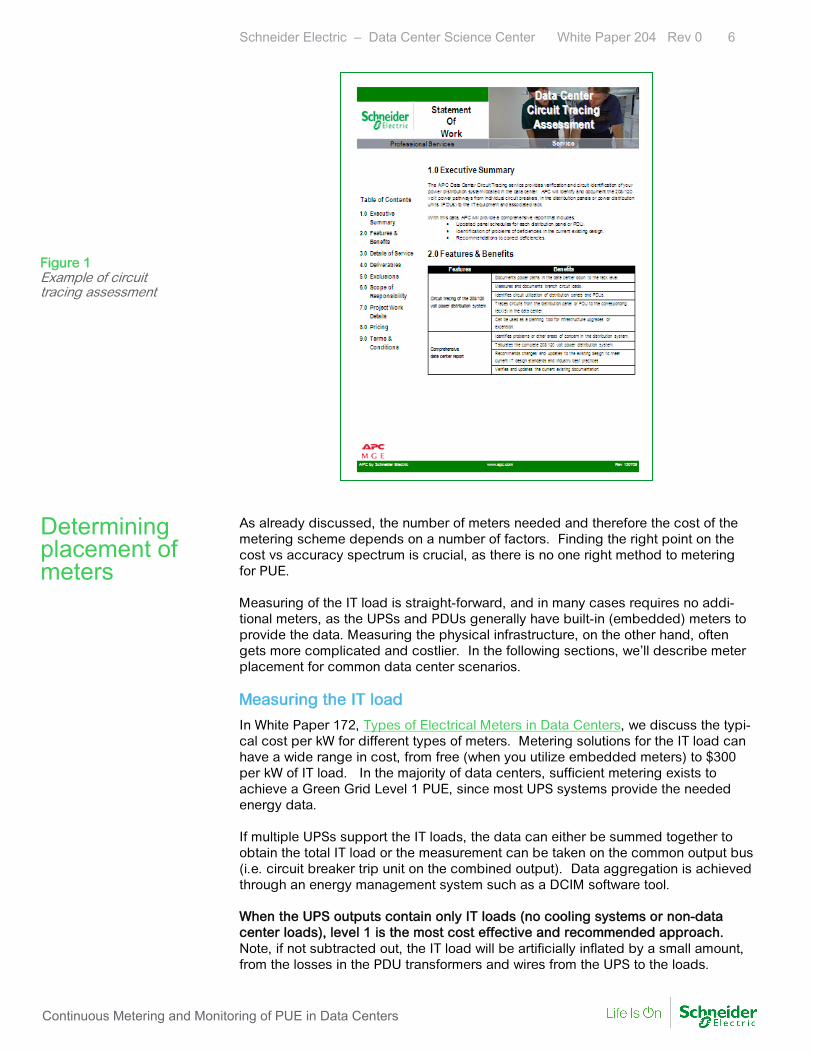
For those data centers looking for better accuracy, or that have significant non-IT loads on the UPS output, level 2 or level 3 approach should be considered. Me-tered rack PDUs (like in Figure 2) provide the most accurate representation of the IT load energy measurement, when placed in every IT rack and summed together. Note, this approach can add complexity to the aggregation of data because of the number of systems being aggregated. This can increase the risk of an incorrect calculation due to some points not reporting or not being included in the calcula-tion. Therefore, this method is recommended only for data centers with mature change management processes to ensure as IT racks are added or changed, that the rack PDU data is accounted for properly. If busway power distribution is used instead of rack PDUs, the same approach applies, but with meters at the tap-off units that feed each rack. An additional benefit of measuring at the rack level is that you can more accurately identify the “waste” or losses in the upstream power distribution. If the upstream PDU losses are greater than they should be, when compared to other data centers or modeled data, this can drive action to reduce them (for instance by consolidating loads and removing some lightly loaded PDUs). Measuring the physical infrastructure
For purpose-built stand-alone data center facilities, measuring the total facility power is straightforward. In this case, a meter at the service entrance is enough to get the needed information for total facility energy. But, for the majority of data cen-ters, this is insufficient, because they either: • need more data (at the subsystem level) to take action and make improve-
ments OR
• are in a mixed use facility with shared infrastructure systems like chillers and generators.
There is no one right answer to the question of “where do I place my meters to measure the total energy?” This is because it is very dependent on the electrical and mechanical architecture of the building. But an effective strategy minimizes the number of meters necessary to obtain the measurements needed. In a mixed-use
Figure 2 Example of metered rack PDU
Schneider Electric – Data Center Science Center White Paper 204 Rev 0 8
Continuous Metering and Monitoring of PUE in Data Centers
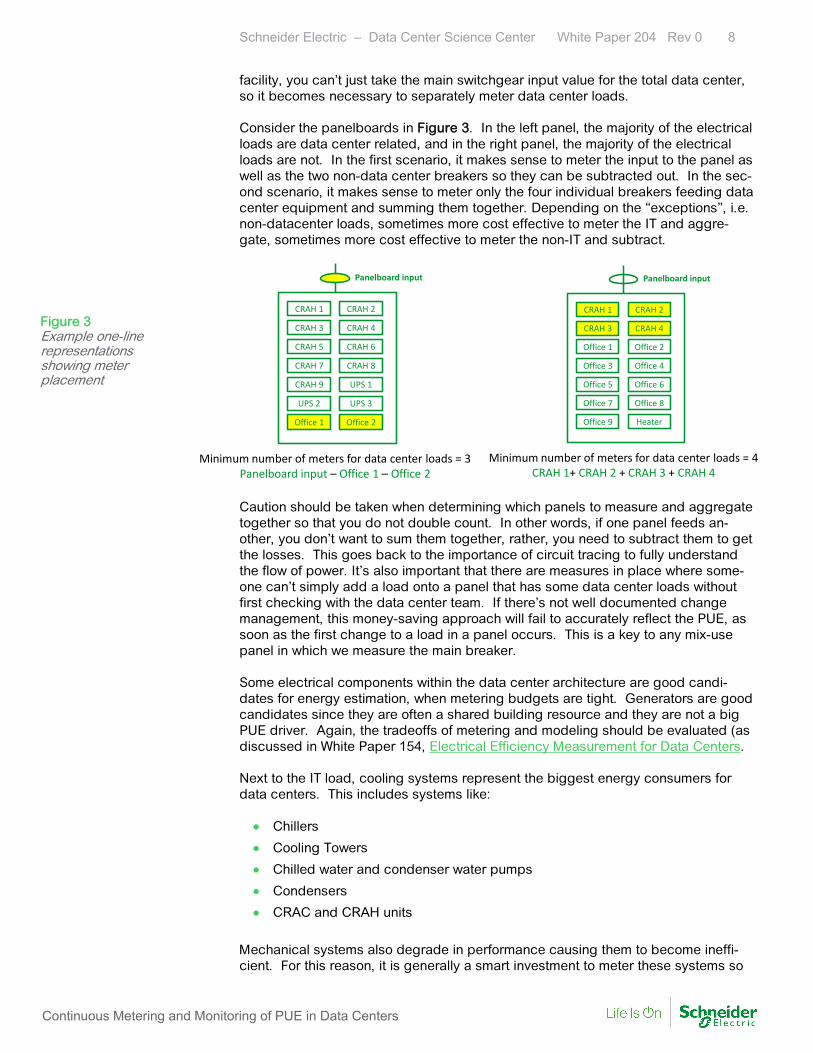
facility, you can’t just take the main switchgear input value for the total data center, so it becomes necessary to separately meter data center loads. Consider the panelboards in Figure 3. In the left panel, the majority of the electrical loads are data center related, and in the right panel, the majority of the electrical loads are not. In the first scenario, it makes sense to meter the input to the panel as well as the two non-data center breakers so they can be subtracted out. In the sec-ond scenario, it makes sense to meter only the four individual breakers feeding data center equipment and summing them together. Depending on the “exceptions”, i.e. non-datacenter loads, sometimes more cost effective to meter the IT and aggre-gate, sometimes more cost effective to meter the non-IT and subtract.
CRAH 1 CRAH 2
CRAH 3 CRAH 4
CRAH 5 CRAH 6
CRAH 7 CRAH 8
CRAH 9 UPS 1
UPS 2 UPS 3
Office 2
Office 1
Panelboard input
Minimum number of meters for data center loads = 3Panelboard input – Office 1 – Office 2
CRAH 1 CRAH 2
CRAH 3 CRAH 4
Office 1 Office 2
Office 3 Office 4
Office 5 Office 6
Office 7 Office 8
Heater
Office 9
Panelboard input
Minimum number of meters for data center loads = 4CRAH 1+ CRAH 2 + CRAH 3 + CRAH 4
Caution should be taken when determining which panels to measure and aggregate together so that you do not double count. In other words, if one panel feeds an-other, you don’t want to sum them together, rather, you need to subtract them to get the losses. This goes back to the importance of circuit tracing to fully understand the flow of power. It’s also important that there are measures in place where some-one can’t simply add a load onto a panel that has some data center loads without first checking with the data center team. If there’s not well documented change management, this money-saving approach will fail to accurately reflect the PUE, as soon as the first change to a load in a panel occurs. This is a key to any mix-use panel in which we measure the main breaker. Some electrical components within the data center architecture are good candi-dates for energy estimation, when metering budgets are tight. Generators are good candidates since they are often a shared building resource and they are not a big PUE driver. Again, the tradeoffs of metering and modeling should be evaluated (as discussed in White Paper 154, Electrical Efficiency Measurement for Data Centers. Next to the IT load, cooling systems represent the biggest energy consumers for data centers. This includes systems like: • Chillers
• Cooling Towers
• Chilled water and condenser water pumps
• Condensers
• CRAC and CRAH units
Mechanical systems also degrade in performance causing them to become ineffi-cient. For this reason, it is generally a smart investment to meter these systems so
Figure 3 Example one-line representations showing meter placement
Schneider Electric – Data Center Science Center White Paper 204 Rev 0 9
Continuous Metering and Monitoring of PUE in Data Centers
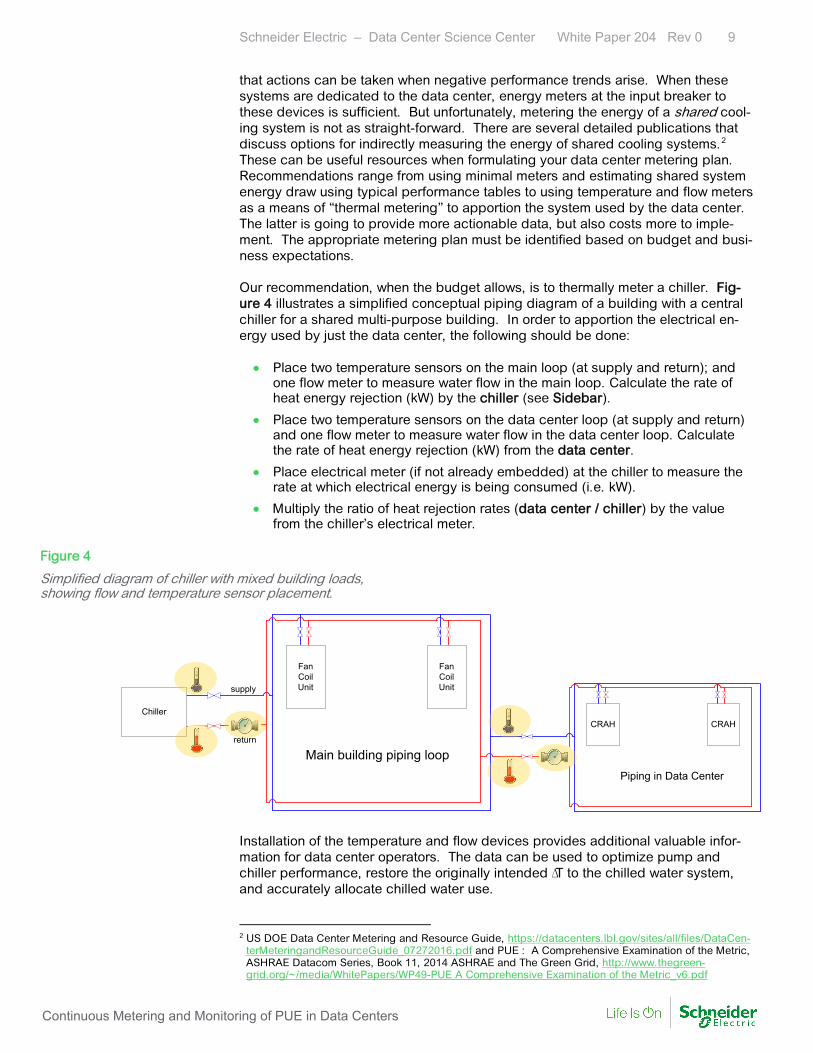
that actions can be taken when negative performance trends arise. When these systems are dedicated to the data center, energy meters at the input breaker to these devices is sufficient. But unfortunately, metering the energy of a shared cool-ing system is not as straight-forward. There are several detailed publications that discuss options for indirectly measuring the energy of shared cooling systems.2 These can be useful resources when formulating your data center metering plan. Recommendations range from using minimal meters and estimating shared system energy draw using typical performance tables to using temperature and flow meters as a means of “thermal metering” to apportion the system used by the data center. The latter is going to provide more actionable data, but also costs more to imple-ment. The appropriate metering plan must be identified based on budget and busi-ness expectations. Our recommendation, when the budget allows, is to thermally meter a chiller. Fig-ure 4 illustrates a simplified conceptual piping diagram of a building with a central chiller for a shared multi-purpose building. In order to apportion the electrical en-ergy used by just the data center, the following should be done: • Place two temperature sensors on the main loop (at supply and return); and
one flow meter to measure water flow in the main loop. Calculate the rate of heat energy rejection (kW) by the chiller (see Sidebar).
• Place two temperature sensors on the data center loop (at supply and return) and one flow meter to measure water flow in the data center loop. Calculate the rate of heat energy rejection (kW) from the data center.
• Place electrical meter (if not already embedded) at the chiller to measure the rate at which electrical energy is being consumed (i.e. kW).
• Multiply the ratio of heat rejection rates (data center / chiller) by the value from the chiller’s electrical meter.
Installation of the temperature and flow devices provides additional valuable infor-mation for data center operators. The data can be used to optimize pump and chiller performance, restore the originally intended ∆T to the chilled water system, and accurately allocate chilled water use. 2 US DOE Data Center Metering and Resource Guide, https://datacenters.lbl.gov/sites/all/files/DataCen-
terMeteringandResourceGuide_07272016.pdf and PUE : A Comprehensive Examination of the Metric, ASHRAE Datacom Series, Book 11, 2014 ASHRAE and The Green Grid, http://www.thegreen-grid.org/~/media/WhitePapers/WP49-PUE A Comprehensive Examination of the Metric_v6.pdf
Figure 4
Simplified diagram of chiller with mixed building loads, showing flow and temperature sensor placement.
supply
return
Fan Coil Unit
Fan Coil Unit
CRAH CRAH
Piping in Data Center
Chiller
Main building piping loop

Schneider Electric – Data Center Science Center White Paper 204 Rev 0 10
Continuous Metering and Monitoring of PUE in Data Centers
A lower cost option, suitable when the non-data center loads are fairly static, is to use the ratio of load (kW) of IT vs total load, and multiply that ratio by the chiller electrical energy. Temperature sensors within the IT space, although not needed for PUE measure-ment are an important best practice, as they can help identify hot spots, and iden-tify where over-cooling is occurring, so that actions can be taken to reduce overall energy consumption (i.e. by turning off excess CRAHs without exceeding tempera-ture thresholds). Once additional metering locations are determined (beyond existing embedded meters), the next step is to select the meters, sensors, and plan for installation. PUE guidelines don’t specify meter or sensor types3, so the decision should be made based on whether the data center is new or existing (operational). It is gener-ally desirable to choose sensors that avoid or reduce downtime, and some sensors are therefore more suitable than others for existing data centers. Split core sen-sors, such as the one in Figure 5, are not as accurate as solid-core sensors, but are more suited for installation in an operational data center, as they are clamped around live conductors vs. having to feed conductors through solid-core sensors.
For temperature sensor and flow meter installation on cooling systems, the same logic applies. There are two approaches to installing these devices in a live data center. Hot-tapping – a method of safely installing meters on fully operational piping systems (with only insignificant loss of wa-ter) so that downtime is not necessary. “This method is more expensive than an installation on a new piping system under construction, but the savings in time on existing piping to shut down, drain, refill, pressure test, and treat the water typ-ically make hot tapping very cost-effective.”4 Ultrasonic meters – a type of meter that straps around the outside of a pipe, avoiding any cutting or drilling, and uses ultrasonic signals to determine flow velocity. From this ve-locity and the pipe size, volumetric flow is computed. “To read accurately, flow meters must be placed on a straight length of pipe of sufficient length.”4 Ultrasonic meters are much more expensive than hot-tapping, and for this reason are less commonly deployed.
3 Electrical meters are generally connected to separate sensors. In order for a meter to record power
(kW) and energy (kWh) it requires voltage and current values for each phase of a 3-phase system. 4 US DOE Data Center Metering and Resource Guide, https://datacenters.lbl.gov/sites/all/files/DataCen-
terMeteringandResourceGuide_07272016.pdf
Installation of meters
Figure 5
Example of split-core current sensor (also known as a current transformer)
Schneider Electric – Data Center Science Center White Paper 204 Rev 0 11
Continuous Metering and Monitoring of PUE in Data Centers
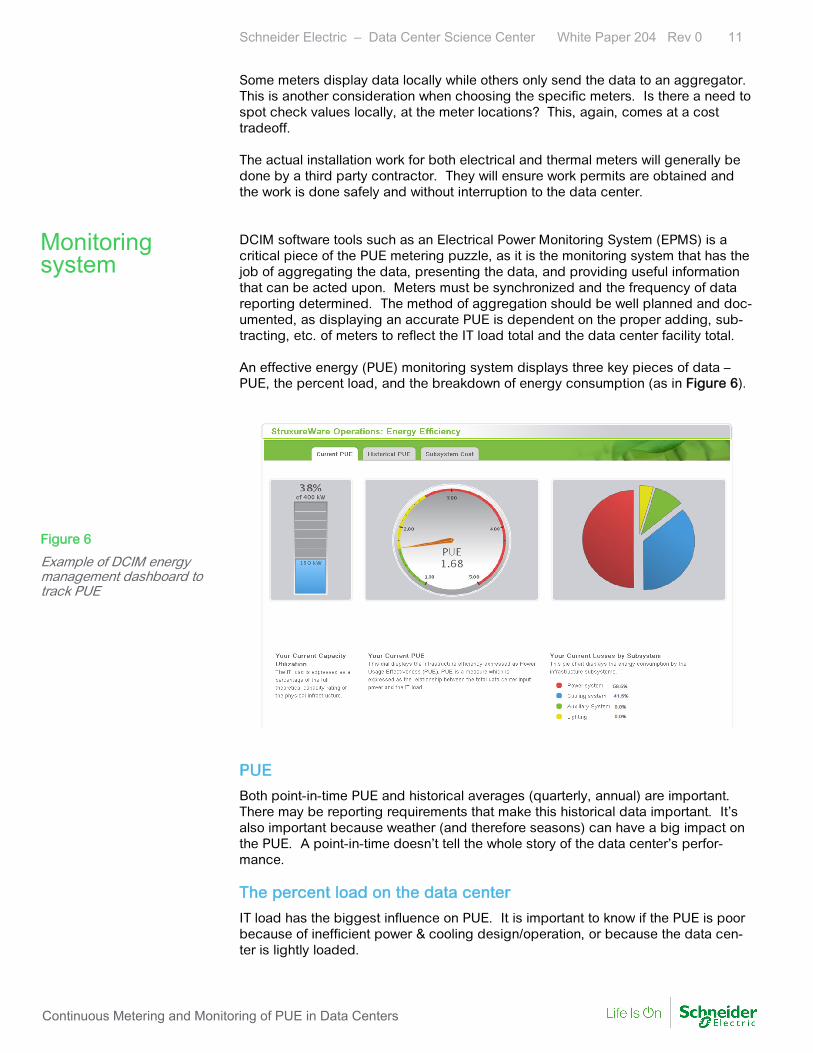
Some meters display data locally while others only send the data to an aggregator. This is another consideration when choosing the specific meters. Is there a need to spot check values locally, at the meter locations? This, again, comes at a cost tradeoff. The actual installation work for both electrical and thermal meters will generally be done by a third party contractor. They will ensure work permits are obtained and the work is done safely and without interruption to the data center. DCIM software tools such as an Electrical Power Monitoring System (EPMS) is a critical piece of the PUE metering puzzle, as it is the monitoring system that has the job of aggregating the data, presenting the data, and providing useful information that can be acted upon. Meters must be synchronized and the frequency of data reporting determined. The method of aggregation should be well planned and doc-umented, as displaying an accurate PUE is dependent on the proper adding, sub-tracting, etc. of meters to reflect the IT load total and the data center facility total. An effective energy (PUE) monitoring system displays three key pieces of data – PUE, the percent load, and the breakdown of energy consumption (as in Figure 6).
PUE
Both point-in-time PUE and historical averages (quarterly, annual) are important. There may be reporting requirements that make this historical data important. It’s also important because weather (and therefore seasons) can have a big impact on the PUE. A point-in-time doesn’t tell the whole story of the data center’s perfor-mance. The percent load on the data center
IT load has the biggest influence on PUE. It is important to know if the PUE is poor because of inefficient power & cooling design/operation, or because the data cen-ter is lightly loaded.
Monitoring system
Figure 6
Example of DCIM energy management dashboard to track PUE
Schneider Electric – Data Center Science Center White Paper 204 Rev 0 12
Continuous Metering and Monitoring of PUE in Data Centers
A best practice data center that is lightly loaded may have a high (bad) PUE, simply because it is currently lightly loaded, and such a data center would be a good candidate for others to consolidate into, not to close down because of its PUE. The breakdown of energy consumption by key subsystem
In order to make PUE improvements, you need to know the biggest energy consum-ers. You can also compare actual subsystem energy consumption to modeled con-sumption to identify possible subpar performance. The naming convention of infrastructure components within the DCIM software should be well thought-through. Labeling is crucial to easily interpreting what you see at the main aggregator. “PDU Side A”, “PDU Side B”, or “Chilled Water Supply Pumps” are examples of clear names. “Panel 1”, “Panel 2”, on the other hand would be ambiguous as to where those subsystems are located in the electrical one-line. A combination of color coding and alphanumeric coding helps to easily find the correct system and associate it with the data on the software. Maintaining the integrity of the PUE monitoring system is crucial. This takes disci-pline and maturity within the data center operations team. For instance, electrical one-lines and circuit schedules must be kept current as changes are made to the data center and/or the building. Data center owners continue to be under pressure to reduce the energy consump-tion of their data centers. While average PUE numbers have come down for an in-dustry as a whole, there are still many data centers that have not taken the first step of continuous metering. Proper metering and monitoring will provide you with the ability to calculate PUE for real-time operational control, site benchmarking, and site compliance (internal or external). It’s very difficult to improve what you do not meas-ure, in a systematic way. Metering the IT load can generally be done with existing meters, either from the UPS, PDU, or rack PDUs. Metered rack PDUs provide the most accurate represen-tation of IT load, as it eliminates losses between the UPS and the load. Measuring the total data center load can be simple if the data center is the only function in the building; or it can involve aggregating, calculating, and estimating when the data center is in a shared facility with shared systems. When budgets al-low, cooling systems should be metered, as these represent the systems with most opportunity for PUE improvement. Less visibility to individual subsystems means less ability to continuously improve and/or measure the effectiveness of changes.
About the author
Wendy Torell is a Senior Research Analyst at Schneider Electric’s Data Center Science Center. In this role, she researches best practices in data center design and operation, publishes white pa-pers & articles, and develops TradeOff Tools to help clients optimize the availability, efficiency, and cost of their data center environments. She also consults with clients on availability science approaches and design practices to help them meet their data center performance objectives. She received her Bachelors of Mechanical Engineering degree from Union College in Schenec-tady, NY and her MBA from University of Rhode Island. Wendy is an ASQ Certified Reliability En-gineer.
Conclusion
Schneider Electric – Data Center Science Center White Paper 204 Rev 0 13
Continuous Metering and Monitoring of PUE in Data Centers
Electrical Efficiency Measurement for Data Centers White Paper 154
Types of Electrical Meters in Data Centers White Paper 172
Guidance for Calculation of Efficiency (PUE) in Data Centers White Paper 158
An Improved Architecture for High-Efficiency, High-Density Data Centers White Paper 126
Power Sizing Calculator TradeOff Tool 1
Energy Efficiency Calculator TradeOff Tool 6
Cooling Economizer Mode PUE Calculator TradeOff Tool 11
Contact us For feedback and comments about the content of this white paper:
Data Center Science Center [email protected]
If you are a customer and have questions specific to your data center project:
Contact your Schneider Electric representative at www.apc.com/support/contact/index.cfm
Browse all white papers whitepapers.apc.com
tools.apc.com
Browse all TradeOff Tools™
Resources
© 20
16 S
chne
ider E
lectri
c. Al
l righ
ts re
serv
ed.
![Tyler Rollins Fine Art - Homepage · Áq plnom I pue „Oqueweqd3 Sl Olcm 'no pue 6UlJldSU! uaeq seq pue 6u!W00 aldoed 40 dnoJ6 esJêA!p e peaq [Jleq e pue Kep 6u!-lna] .spued pue](https://static.fdocuments.in/doc/165x107/610d91b723e9671c0037e626/tyler-rollins-fine-art-q-plnom-i-pue-aoqueweqd3-sl-olcm-no-pue-6uljldsu.jpg)

![· punoue qwq pa13nnsu03 aq Ileus pue èua!pef 'alls aleud0Jdde 10 swep pue 'su!up pue .Åvad0Jd pue uoasuoul _laue naa] aq Ileqs su!eup aul watud01anap llaq uaauî 'speou au!Lu](https://static.fdocuments.in/doc/165x107/5e37d892818bf70c1f099a04/punoue-qwq-pa13nnsu03-aq-ileus-pue-uapef-alls-aleud0jdde-10-swep-pue-suup.jpg)


![Home - City of Page · dlaq Il!M saouqeq pue eonoe]d pue sJêdweo soap!A pue 'dde peolumop apoo e leaq pue 01 amaoaJ Jêdweo qoe3 iêtuou le pue dueo 'S3/10W 3141 pue aouqeg Bu!Jnp](https://static.fdocuments.in/doc/165x107/5f827d611bea87656d7a01f0/home-city-of-page-dlaq-ilm-saouqeq-pue-eonoed-pue-sjdweo-soapa-pue-dde-peolumop.jpg)