Contents Market driven solutions...Geleenlaan 5 3600 Genk - Belgium Tel: +32 (0)89 623 000 Fax: +32...
86
Market driven solutions ANNUAL REPORT 2007
Transcript of Contents Market driven solutions...Geleenlaan 5 3600 Genk - Belgium Tel: +32 (0)89 623 000 Fax: +32...

Geleenlaan 53600 Genk - Belgium
Tel: +32 (0)89 623 000Fax: +32 (0)89 623 010
www.ipte.com
Market driven solutions
ANNUAL REPORT 2007
Company profile 1
Interview with Managing Director Huub Baren 2
IPTE Worldwide 4
Contract Manufacturing 6
Factory Automation 12
Report from the Board of Directors 18
Human Resources 22
Corporate Governance 24
Consolidated Financial Statements 29
Individual Financial Statements 70
Investor relationsIPTE NV - Geleenlaan 5 - 3600 Genk - BELGIUMTel: +32 (0)89 623 000 - Fax: +32 (0)89 623 010www.ipte.com - e-mail: [email protected] Baren, Managing Director IPTE NVHugo Ciroux, CFO IPTE NV
Contents
Financial calendar
General shareholders meeting 2007 April 29, 2008
Result Q1 May 15, 2008
Result Q2 August 13, 2008
Result Q3 November 13, 2008
Annual results 2008 February 19, 2009
General shareholders meeting 2008 April 28, 2009

Annual report IPTE 2007Key figures
0
100
200
300
400
500
0
500
1000
1500
2000
-6,000
-5,000
-4,000
-3,000
-2,000
-1,000
0
1,000
2,000
3,000
100
150
200
250
300
0
1
2
3
4
5
-1,5
-1,0
-0,5
0,0
0,5
1,0
1,5
2,0
18832168
-5627
-701
-2236
0.34
1.56
0.37
-1.02
20072006200520042003 20072006200520042003 20072006200520042003
-0.13
-6000
-4000
-2000
0
2000
4000
6000
8000
10000
1200010 883
1 883
-5 627
-701
2 168
138.3
255.3
126.6128.5
110.3
Sales (in EUR ‘million)
Factory Automation Contract Manufacturing
Contract manufacturing by region Factory automation by market
Contract manufacturing by market Factory automation by region
Net result per share (in EUR) Net result (in EUR ‘000)
9% Europe and rest of the World
15% Consumer electronics
8% Other
4% Subcontracting6% Telecommunications
15% The Netherlands
12% Germany
64% Belgium
47% Western Europe
20% USAand rest of the World
15% Eastern Europe
2% Northern Europe
10% Benelux
6% Southern Europe
67% Automotive
10% Medical products
63% Professional products
11% Telecommunications2% Other
14% Automotive
2005 2006 2007 2005 2006 2007
Jan
07
Feb
07
Mar
07
Apr 0
7
May
07
Jun
07
Jul 0
7
Aug
07
Sep
07
Oct
07
Nov
07
Dec
07
Closing Price (Euronext Brussels)Volume (000)
Closing Price (Euronext Brussels)Bel20
0
1
2
3
4
5
6
7
8
9
10
11
12
0
20000
40000
60000
80000
100000
120000
Jan
07
Feb
07
Mar
07
Apr 0
7
May
07
Jun
07
Jul 0
7
Aug
07
Sep
07
Oct
07
Nov
07
Dec
07
50
00
50
100
150
Jan
07
Feb
07
Mar
07
Apr 0
7
May
07
Jun
07
Jul 0
7
Aug
07
Sep
07
Oct
07
Nov
07
Dec
07
Closing Price (Euronext Brussels)Volume (000)
Closing Price (Euronext Brussels)Bel20
0
1
2
3
4
5
6
7
8
9
10
11
12
0
20000
40000
60000
80000
100000
120000
Jan
07
Feb
07
Mar
07
Apr 0
7
May
07
Jun
07
Jul 0
7
Aug
07
Sep
07
Oct
07
Nov
07
Dec
07
50
00
50
100
150
0
100
200
300
400
500
0
500
1000
1500
2000
-6,000
-5,000
-4,000
-3,000
-2,000
-1,000
0
1,000
2,000
3,000
100
150
200
250
300
0
1
2
3
4
5
-1,5
-1,0
-0,5
0,0
0,5
1,0
1,5
2,0
18832168
-5627
-701
-2236
0.34
1.56
0.37
-1.02
20072006200520042003 20072006200520042003 20072006200520042003
-0.13
-6000
-4000
-2000
0
2000
4000
6000
8000
10000
1200010 883
1 883
-5 627
-701
2 168
138.3
255.3
126.6128.5
110.3
Sales (in EUR ‘million)
Factory Automation Contract Manufacturing
Contract manufacturing by region Factory automation by market
Contract manufacturing by market Factory automation by region
Net result per share (in EUR) Net result (in EUR ‘000)
9% Europe and rest of the World
15% Consumer electronics
8% Other
4% Subcontracting6% Telecommunications
15% The Netherlands
12% Germany
64% Belgium
47% Western Europe
20% USAand rest of the World
15% Eastern Europe
2% Northern Europe
10% Benelux
6% Southern Europe
67% Automotive
10% Medical products
63% Professional products
11% Telecommunications2% Other
14% Automotive
2005 2006 2007 2005 2006 2007
0
100
200
300
400
500
0
500
1000
1500
2000
-6,000
-5,000
-4,000
-3,000
-2,000
-1,000
0
1,000
2,000
3,000
100
150
200
250
300
0
1
2
3
4
5
-1,5
-1,0
-0,5
0,0
0,5
1,0
1,5
2,0
18832168
-5627
-701
-2236
0.34
1.56
0.37
-1.02
20072006200520042003 20072006200520042003 20072006200520042003
-0.13
-6000
-4000
-2000
0
2000
4000
6000
8000
10000
1200010 883
1 883
-5 627
-701
2 168
138.3
255.3
126.6128.5
110.3
Sales (in EUR ‘million)
Factory Automation Contract Manufacturing
Contract manufacturing by region Factory automation by market
Contract manufacturing by market Factory automation by region
Net result per share (in EUR) Net result (in EUR ‘000)
9% Europe and rest of the World
15% Consumer electronics
8% Other
4% Subcontracting6% Telecommunications
15% The Netherlands
12% Germany
64% Belgium
47% Western Europe
20% USAand rest of the World
15% Eastern Europe
2% Northern Europe
10% Benelux
6% Southern Europe
67% Automotive
10% Medical products
63% Professional products
11% Telecommunications2% Other
14% Automotive
2005 2006 2007 2005 2006 2007
KEY FIGURES
Stock market quotation (at 31/12/2007) Shares Highest price 11.39 EURLowest price 4.7 EURAverage price (accounting average) 7.36 EURPrice at 31/12/2007 11 EUR
Number of shares 6 934 424Number of warrants 182 850Average volume traded per day 9 481Stock market capitalisation (at 31/12/2007) 76 278 664
AnnuAl results IPte GrouP At 31 DeCember 000 EUR 2007 % 2006 % 2005 %Sales 255,290 100.0 138,282 100.0 126,662 100.0Cost of sales -208,396 -81.6 -109,917 -79.5 -97,886 -77.3Gross profit 46,894 18.4 28,365 20.5 28,776 22.7Research and development expenses -7,791 -3.1 -6,255 -4.5 -5,802 -4.6General and administrative expenses -13,891 -5.4 -9,134 -6.6 -8,757 -6.9Selling expenses -12,889 -5.0 -9,886 -7.1 -10,010 -7.9Other operating income/expense (net) 104 0.0 304 0.2 -10 -0.0Profit from operations 12,427 4.9 3,394 2.5 4,197 3.3Financial income/charges (net) -2,726 -1.1 -1,377 -1.0 -2,041 -1.6Profit before taxes 9,701 3.8 2,017 1.5 2,156 1.7Income taxes 1,182 0.5 -134 -0.1 12 0.0Profit after taxes 10,883 4.3 1,883 1.4 2,168 1.7Attributable to:Equity holders of the parent 10,868 4.3 1,857 1.3 2,046 1.6Minority interest 15 0.0 26 0.0 122 0.1Number of shares: 6,934,424Number of warrants: 182,850Profit/(loss) per share in EUR 1.57 0.34 0.37Diluted profit/loss per share in EUR 1.57 0.27 0.37
bAlAnCe sheet IPte GrouP At 31 DeCember 000 EUR 2007 2006 2005Intangible fixed assets 254 221 254Goodwill 5,943 5,943 5,943Property, plant and equipment 17,102 12,226 12,000Deferred tax assets 1,615 1,000 901Amounts receivable after one year 1,240 1,490 1,502Inventories and contracts in progress 46,243 28,914 23,988Trade receivables 52,919 34,781 26,267Other receivables 2,865 2,396 2,539Cash, bank deposits and current investments 3,414 2,309 3,694Other current assets 212 289 390Total assets 131,807 89,569 77,478
Equity 41,655 23,920 22,894Subordinated loan 0 7,200 7,000Provisions 2,016 1,356 2,342Deferred tax liability 115 1,000 901Long-term financial debts 4,630 1,810 2,750Bank loans and overdrafts 25,650 23,156 18,147Trade payables 40,818 21,440 14,852Current liabilities 16,923 9,687 8,592Total liabilities 131,807 89,569 77,478

Annual report IPTE 2007Key figures
0
100
200
300
400
500
0
500
1000
1500
2000
-6,000
-5,000
-4,000
-3,000
-2,000
-1,000
0
1,000
2,000
3,000
100
150
200
250
300
0
1
2
3
4
5
-1,5
-1,0
-0,5
0,0
0,5
1,0
1,5
2,0
18832168
-5627
-701
-2236
0.34
1.56
0.37
-1.02
20072006200520042003 20072006200520042003 20072006200520042003
-0.13
-6000
-4000
-2000
0
2000
4000
6000
8000
10000
1200010 883
1 883
-5 627
-701
2 168
138.3
255.3
126.6128.5
110.3
Sales (in EUR ‘million)
Factory Automation Contract Manufacturing
Contract manufacturing by region Factory automation by market
Contract manufacturing by market Factory automation by region
Net result per share (in EUR) Net result (in EUR ‘000)
9% Europe and rest of the World
15% Consumer electronics
8% Other
4% Subcontracting6% Telecommunications
15% The Netherlands
12% Germany
64% Belgium
47% Western Europe
20% USAand rest of the World
15% Eastern Europe
2% Northern Europe
10% Benelux
6% Southern Europe
67% Automotive
10% Medical products
63% Professional products
11% Telecommunications2% Other
14% Automotive
2005 2006 2007 2005 2006 2007
Jan
07
Feb
07
Mar
07
Apr 0
7
May
07
Jun
07
Jul 0
7
Aug
07
Sep
07
Oct
07
Nov
07
Dec
07
Closing Price (Euronext Brussels)Volume
Closing Price (Euronext Brussels)Bel20
0
1
2
3
4
5
6
7
8
9
10
11
12
0
20000
40000
60000
80000
100000
120000
Jan
07
Feb
07
Mar
07
Apr 0
7
May
07
Jun
07
Jul 0
7
Aug
07
Sep
07
Oct
07
Nov
07
Dec
07
50
00
50
100
150
Jan
07
Feb
07
Mar
07
Apr 0
7
May
07
Jun
07
Jul 0
7
Aug
07
Sep
07
Oct
07
Nov
07
Dec
07
Closing Price (Euronext Brussels)Volume
Closing Price (Euronext Brussels)Bel20
0
1
2
3
4
5
6
7
8
9
10
11
12
0
20000
40000
60000
80000
100000
120000
Jan
07
Feb
07
Mar
07
Apr 0
7
May
07
Jun
07
Jul 0
7
Aug
07
Sep
07
Oct
07
Nov
07
Dec
07
50
00
50
100
150
0
100
200
300
400
500
0
500
1000
1500
2000
-6,000
-5,000
-4,000
-3,000
-2,000
-1,000
0
1,000
2,000
3,000
100
150
200
250
300
0
1
2
3
4
5
-1,5
-1,0
-0,5
0,0
0,5
1,0
1,5
2,0
18832168
-5627
-701
-2236
0.34
1.56
0.37
-1.02
20072006200520042003 20072006200520042003 20072006200520042003
-0.13
-6000
-4000
-2000
0
2000
4000
6000
8000
10000
1200010 883
1 883
-5 627
-701
2 168
138.3
255.3
126.6128.5
110.3
Sales (in EUR ‘million)
Factory Automation Contract Manufacturing
Contract manufacturing by region Factory automation by market
Contract manufacturing by market Factory automation by region
Net result per share (in EUR) Net result (in EUR ‘000)
9% Europe and rest of the World
15% Consumer electronics
8% Other
4% Subcontracting6% Telecommunications
15% The Netherlands
12% Germany
64% Belgium
47% Western Europe
20% USAand rest of the World
15% Eastern Europe
2% Northern Europe
10% Benelux
6% Southern Europe
67% Automotive
10% Medical products
63% Professional products
11% Telecommunications2% Other
14% Automotive
2005 2006 2007 2005 2006 2007
0
100
200
300
400
500
0
500
1000
1500
2000
-6,000
-5,000
-4,000
-3,000
-2,000
-1,000
0
1,000
2,000
3,000
100
150
200
250
300
0
1
2
3
4
5
-1,5
-1,0
-0,5
0,0
0,5
1,0
1,5
2,0
18832168
-5627
-701
-2236
0.34
1.56
0.37
-1.02
20072006200520042003 20072006200520042003 20072006200520042003
-0.13
-6000
-4000
-2000
0
2000
4000
6000
8000
10000
1200010 883
1 883
-5 627
-701
2 168
138.3
255.3
126.6128.5
110.3
Sales (in EUR ‘million)
Factory Automation Contract Manufacturing
Contract manufacturing by region Factory automation by market
Contract manufacturing by market Factory automation by region
Net result per share (in EUR) Net result (in EUR ‘000)
9% Europe and rest of the World
15% Consumer electronics
8% Other
4% Subcontracting6% Telecommunications
15% The Netherlands
12% Germany
64% Belgium
47% Western Europe
20% USAand rest of the World
15% Eastern Europe
2% Northern Europe
10% Benelux
6% Southern Europe
67% Automotive
10% Medical products
63% Professional products
11% Telecommunications2% Other
14% Automotive
2005 2006 2007 2005 2006 2007
KEY FIGURES
Stock market quotation (at 31/12/2007) Shares Highest price 11.39 EURLowest price 4.7 EURAverage price (accounting average) 7.36 EURPrice at 31/12/2007 11 EUR
Number of shares 6 934 424Number of warrants 182 850Average volume traded per day 9 481Stock market capitalisation (at 31/12/2007) 76 278 664
AnnuAl results IPte GrouP At 31 DeCember 000 EUR 2007 % 2006 % 2005 %Sales 255,290 100.0 138,282 100.0 126,662 100.0Cost of sales -208,396 -81.6 -109,917 -79.5 -97,886 -77.3Gross profit 46,894 18.4 28,365 20.5 28,776 22.7Research and development expenses -7,791 -3.1 -6,255 -4.5 -5,802 -4.6General and administrative expenses -13,891 -5.4 -9,134 -6.6 -8,757 -6.9Selling expenses -12,889 -5.0 -9,886 -7.1 -10,010 -7.9Other operating income/expense (net) 104 0.0 304 0.2 -10 -0.0Profit from operations 12,427 4.9 3,394 2.5 4,197 3.3Financial income/charges (net) -2,726 -1.1 -1,377 -1.0 -2,041 -1.6Profit before taxes 9,701 3.8 2,017 1.5 2,156 1.7Income taxes 1,182 0.5 -134 -0.1 12 0.0Profit after taxes 10,883 4.3 1,883 1.4 2,168 1.7Attributable to:Equity holders of the parent 10,868 4.3 1,857 1.3 2,046 1.6Minority interest 15 0.0 26 0.0 122 0.1Number of shares: 6,934,424Number of warrants: 182,850Profit/(loss) per share in EUR 1.57 0.34 0.37Diluted profit/loss per share in EUR 1.57 0.27 0.37
bAlAnCe sheet IPte GrouP At 31 DeCember 000 EUR 2007 2006 2005Intangible fixed assets 254 221 254Goodwill 5,943 5,943 5,943Property, plant and equipment 17,102 12,226 12,000Deferred tax assets 1,615 1,000 901Amounts receivable after one year 1,240 1,490 1,502Inventories and contracts in progress 46,243 28,914 23,988Trade receivables 52,919 34,781 26,267Other receivables 2,865 2,396 2,539Cash, bank deposits and current investments 3,414 2,309 3,694Other current assets 212 289 390Total assets 131,807 89,569 77,478
Equity 41,655 23,920 22,894Subordinated loan 0 7,200 7,000Provisions 2,016 1,356 2,342Deferred tax liability 115 1,000 901Long-term financial debts 4,630 1,810 2,750Bank loans and overdrafts 25,650 23,156 18,147Trade payables 40,818 21,440 14,852Current liabilities 16,923 9,687 8,592Total liabilities 131,807 89,569 77,478

1
Annual report IPTE 2007Company profile
Company profile
IPTE is a worldwide supplier of automated production equipment for the electronics industry and a supplier of manufacturing services to electronic and industrial markets in Europe.
IPTE NV’s registered office and corporate headquarters are located in Genk, Belgium.
The group has production facilities in Belgium, the Netherlands, Germany, France, Portugal, Slovakia, Romania, Czech Republic and China.
It serves its clients through sales and service offices on three continents.
The company was founded in 1992 and its shares have been traded on Euronext Brussels since 2000.
The group’s activities are divided into two business units, Factory Automation and Contract Manufacturing, each combining a number of specific processes for the electronics industry.
Both divisions have their own independent marketing approach and make their own strategic decisions for reacting to new markets and opportunities.
The IPTE Contract Manufacturing division (Connect Systems Group) delivers, as a contract manufacturer, a full range of cable manufacturing and assembly, PCB assembly and module assembly services to the professional industry.
The IPTE Factory Automation division develops standard machinery and turnkey automation systems for the production, testing and treatment of printed circuit boards and for final assembly work. The equipment is used in the automotive, telecommunications, consumer and other sectors of the electronics industry.
our aCtivities

2
IPTE presents excellent figures for 2007. What is the basis for this success? I don’t need to tell you that we are excited with the past year’s results. The figures speak volumes: group sales of EUR 255 million, or 85% more than in 2006, and a steep increase of net profit to EUR 10.9 million. In addition IPTE as a company has proved so flexible and healthy that we have digested this major growth without negative impact on delivery deadlines or quality. This too is cause for satisfaction.
We can ascribe our good performances on the one hand to the further positive development of the world economy in 2007 in general in general and of the electronics market in particular, and on the other to the proactive way in which the IPTE divisions have taken advantage of this situation.
Was 2007 an exceptionally good economic year? The past year was indeed excellent, both economically and industrially, better even than expected. And this despite the financial crisis at the end of the year. We saw global growth of 4 to 5%, with consumption rising in the United States, Europe and Asia.
The favourable macro-economic trend expressed itself also on the electronics market, which is still expanding. For example the production of “consumer” equipment in which electronics are essential (GSM, PC, flat screen, etc.) rose by between 10 and 20%. This rise is based on three pillars: the growth of an Asian middle class that is providing an increasing number of potential customers, the prominent place that consumer electronics is conquering in total consumer spending budgets, and the ever more essential role that electronics are playing in a growing number of products. This last factor certainly
applies in the automotive sector. Today’s motorcar contains numberless pearls of automotive electronics.I would not, however, talk of 2007 as an out-of-the-ordinary year. The three above-mentioned elements that are supporting electronics growth seem to me so fundamental that there is no single reason to assume that this growth is suddenly going to reduce in 2008.
The same applies to the industrial and professional electronics markets, where the positive developments we saw in 2007 are set to continue for the next few years. Economic growth, driven from Asia, means that more and more energy will need to be generated and distributed. Multi-annual plans for building new electricity power stations will support demand for industrial electronics for some time yet. In the medical sector too, where technology is playing an ever more important role, electronics remains essential. Environmental concerns are going to have a booster effect on the electronics market for some years to come. Think only of the impact that LED technology is having on light electronics.
As you yourself said, IPTE owes its growth not just to good market circumstances, but also to its corporate strategy. What should we understand by this?First of all, it continues to make economic sense to be active both in contract manufacturing, via our Connect Systems division, and in developing standard and tailored automation systems via the Factory Automation department. Not only do both divisions produce a cross-pollination of knowledge and experience, but by each taking a separate and specific course, they are able to cash in on the specific developments in their sales markets.
Interview with Huub Baren

3
Annual report IPTE 2007Interview with Managing Director
Group sales are 85% more than in 2006
Factory Automation is directed at automotive electronics (two thirds of sales), consumer electronics and the telecom sector. The still very European-directed automotive sector is interesting because of the high innovation content, driven by comfort, safety and the environment. In our various market segments we score well with our unique close-to-the customer philosophy. This means our setting up shop, if desired, geographically close to our customers’ production facilities. Where necessary for this we acquire smaller local players, which in many cases also produce added value in terms of product technology for the IPTE group. This philosophy means that we shall be focusing more on large customers. The 20% sales growth to EUR 60 million that we realized in 2007 is based on these strategic choices.
In contract manufacturing we are able to place other accents. We are active in particular in the industrial market segment and, to a lesser degree, in the automotive and telecoms sectors. With sales of EUR 195 million we can be included in the group of ‘middle market’ contract manufacturers, where gross margins are viable. We have no ambition to compete with the big shots. The outstanding event of 2007 was our taking over of the Barco surface mounting activities. This has gone off particularly well, with the new partnership delivering more than the anticipated sales growth. On top of this, in contract manufacturing too, our size has led us to focus more on large customers.
What are IPTE’s plans and prospects for 2008? We are confident that the market will remain favourable and therefore believe that we will again post a strong performance in 2008. In the meantime, for Factory Automation the year
has begun with the signing of the contract to acquire a German sector colleague, Platzgummer GmbH. Obviously this offers growth prospects on the interesting German market. In contract manufacturing we shall be moving forward with the same élan, even if it is clear that it will not be possible to match in 2008 the growth that Barco brought us in 2007. In the medium term we are striving for a sales distribution of one quarter Factory Automation, three quarters Contract Manufacturing.
I would also remind you that the present CEO of Contract Manufacturing, Luc Switten, will be taking over as CEO of the IPTE Group, after the General Meeting.
Talking about the General Meeting, how do you react to the evolution of the share price?Over the past year our share price evolved favourably, though I remain slightly surprised that our magnificent results have not produced a much better price rise, though I realize that market sentiment in general had a role to play here. For the rest, this year the Board of Directors has again proposed to reinvest the profit in the company instead of paying a dividend to shareholders.

4
ipte WorldWide
Added value
We are a reliable, quality supplier of engineering solutions on a worldwide scale. Our focus is on crea-ting ‘added value’ for our customers, in terms of both our product portfolio and the surrounding services.

5
Annual report IPTE 2007IPTE Worldwide
WorldWide yet loCal, Where our Customers need us
IPTE NV’s registered office and corporate headquarters are located in Genk, Belgium. The Group has production facilities in Belgium, the Netherlands, Germany, France,
Portugal, Slovakia, Romania, Czech Republic and China. It serves its clients through sales and service offices on three continents.
SaleS cOntactS
Europe Belgium Germany France United Kingdom Portugal Spain Hungary Romania Poland Norway Finland Czech Republic
America United States Mexico
Asia Singapore China
PrOductiOn SiteS
Factory automation Genk, Belgium Heroldsberg, Germany Carlepont, France Ovar, Portugal Shanghai, China Malville, France Oradea, Romania
Contract manufacturing Kampenhout, Belgium Ieper, Belgium Poperinge, Belgium Rijen, the Netherlands Frickenhausen, Germany Kladno, Czech Republic Vrable, Slovakia Oradea, Romania

6
Committed to quality
We continuously strive to improve the quality level of our products and ourservices. this in turn reflects in increasedsuccess for our customers.

7
Connect Systems is one of the leading service providers regarding cable, PCB and module assembly. Connect Systems developed from a cable company to a full service provider and supports its customers with design, production, logistics and after-sales services.
Today, Connect Systems is one of the most innovative technology centers across Europe, constantly aiming to improve the success of its customers by supplying the best Electronic Manufacturing Services.
deSignHigh quality products start with good design. Connect Systems brings added value to the customer by providing design and engineering services, advice regarding component and materials choices, and layout of cable, PCB and module assemblies.
Annual report IPTE 2007IPTE Contract Manufacturing, Integrated Subcontractors
ContraCt manufaCturinG, inteGrated subContraCtors
IPTE ConTrACT MAnufACTurIng
DESIgn &EngInEErIng
-Design-in-Co-engineering-Component definition-Layout PCB-Development support-Prototyping-FMEA-Design rules check-Mechanical design- Obsolete component
management-Last time buy
CABLE ASSEMBLY
PCB ASSEMBLY
MoDuLE ASSEMBLY
- Design & development-Cutting-Stripping-Crimping- High level of
automation-Printing-Welding- Documentation control-Moulding & potting-Harnesses-100% test
-SMD-placement-Manual mounting-Die & wire bonding-THT-Soldering-Press fit-High precision coating-Clean room-Testing-FMEA
-Co-development-Submodules-Racks- Electronic and
mechanical assembly- Partial and functional
testing-Project management-Field repairs-After-sales service-Flex-Ops

8
cable aSSemblyCabling services using copper, coaxial and fiber-optic technologies offer a complete answer to the interconnection needs of OEMs and equipment installers.Our skilled operators are fully conversant with all regularly used signal, power, HF and coaxial cable, including the most complex constructions.
Pcb aSSemblyConnect Systems’ PCB assem bly offers a number of different integrated automatic production lines, built around a series of modern surface mounters, to provide rapid, cost-efficient assembly of SMD circuit boards. To ensure the best quality, test systems are installed:• In-circuit test • AOI• Functional test • Burn-in test• Flying probe • Lifecycle test.• 3D X-ray
mechatrOnicSConnect Systems’ mechatronics division offers customers production solutions that integrate cable, electronics and mechanical aspects, from sub-assemblies to fully tested finished products. For the assembly of complete cabled panels, racks and cabinets, the Connect Systems group has versatile and modular production locations to handle customer projects from co-development through to after-sales service.
9
Annual report IPTE 2007IPTE Contract Manufacturing, Integrated Subcontractors
ipte ContraCt manufaCturinG, inteGrated subContraCtors
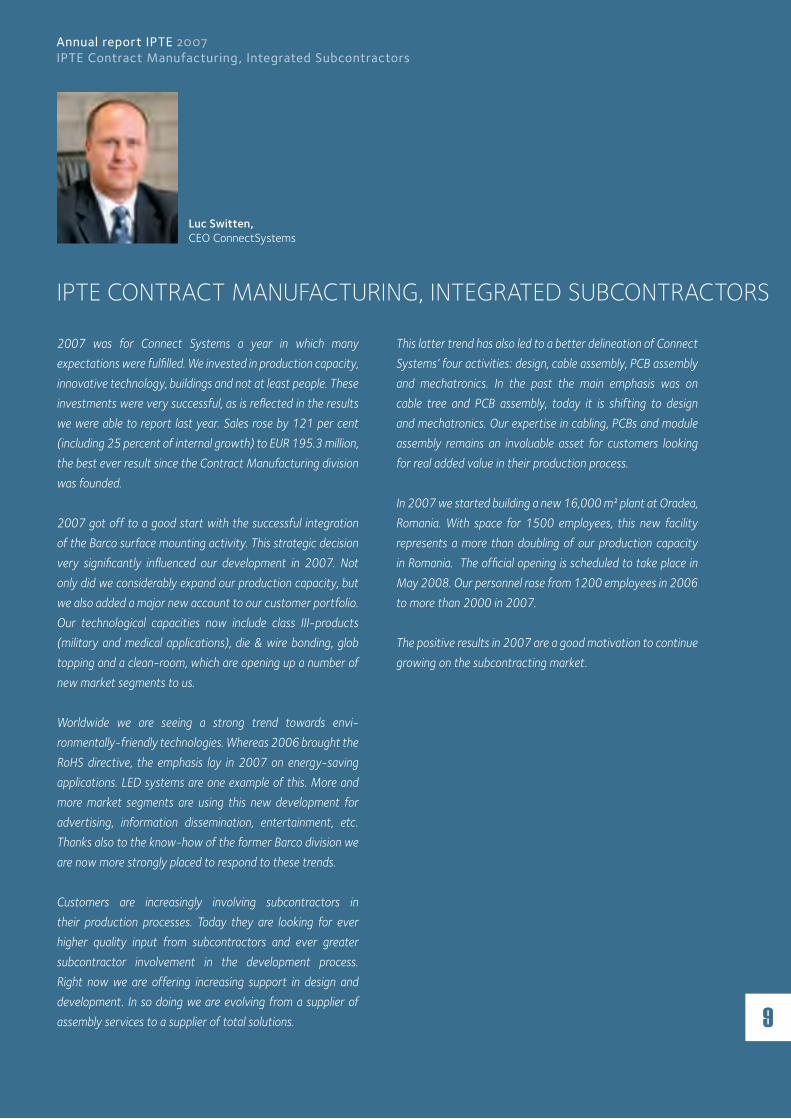
2007 was for Connect Systems a year in which many expectations were fulfilled. We invested in production capacity, innovative technology, buildings and not at least people. These investments were very successful, as is reflected in the results we were able to report last year. Sales rose by 121 per cent (including 25 percent of internal growth) to EUR 195.3 million, the best ever result since the Contract Manufacturing division was founded.
2007 got off to a good start with the successful integration of the Barco surface mounting activity. This strategic decision very significantly influenced our development in 2007. Not only did we considerably expand our production capacity, but we also added a major new account to our customer portfolio. Our technological capacities now include class III-products (military and medical applications), die & wire bonding, glob topping and a clean-room, which are opening up a number of new market segments to us.
Worldwide we are seeing a strong trend towards envi-ronmentally-friendly technologies. Whereas 2006 brought the RoHS directive, the emphasis lay in 2007 on energy-saving applications. LED systems are one example of this. More and more market segments are using this new development for advertising, information dissemination, entertainment, etc. Thanks also to the know-how of the former Barco division we are now more strongly placed to respond to these trends.
Customers are increasingly involving subcontractors in their production processes. Today they are looking for ever higher quality input from subcontractors and ever greater subcontractor involvement in the development process. Right now we are offering increasing support in design and development. In so doing we are evolving from a supplier of assembly services to a supplier of total solutions.
This latter trend has also led to a better delineation of Connect Systems’ four activities: design, cable assembly, PCB assembly and mechatronics. In the past the main emphasis was on cable tree and PCB assembly, today it is shifting to design and mechatronics. Our expertise in cabling, PCBs and module assembly remains an invaluable asset for customers looking for real added value in their production process.
In 2007 we started building a new 16,000 m² plant at Oradea, Romania. With space for 1500 employees, this new facility represents a more than doubling of our production capacity in Romania. The official opening is scheduled to take place in May 2008. Our personnel rose from 1200 employees in 2006 to more than 2000 in 2007.
The positive results in 2007 are a good motivation to continue growing on the subcontracting market.
Luc Switten, CEO ConnectSystems

10
StrategyThe IPTE Contract Manufacturing strategy is based on a ‘hands-on’ company culture and customer-oriented organization:• Quality We aim for zero defects, delivering products to our
customer’s expectations.• Logistics An integrated offer covered by the different production
facilities. Competitive purchase agreements. Wide range of logistical concepts. Component selection for an optimal correlation between purchase and production.
• Technology We are continuously looking for innovations to implement
the latest technologies in our production processes.• Costs We aim at the best price for your products through
co-engineering, high productivity and centralized purchasing.
• Flexibility Volume-flexibility, thanks to a network of production
facilities. Technology mix. Multifunctional employees. Customer-oriented delivery.
Our miSSiOn“To continuously improve as a total solution provider the success of our customers in the industrial and professional markets throughout Europe by supplying the best Electronic Manufacturing Services.”
11
Annual report IPTE 2007IPTE Contract Manufacturing, Integrated Subcontractors
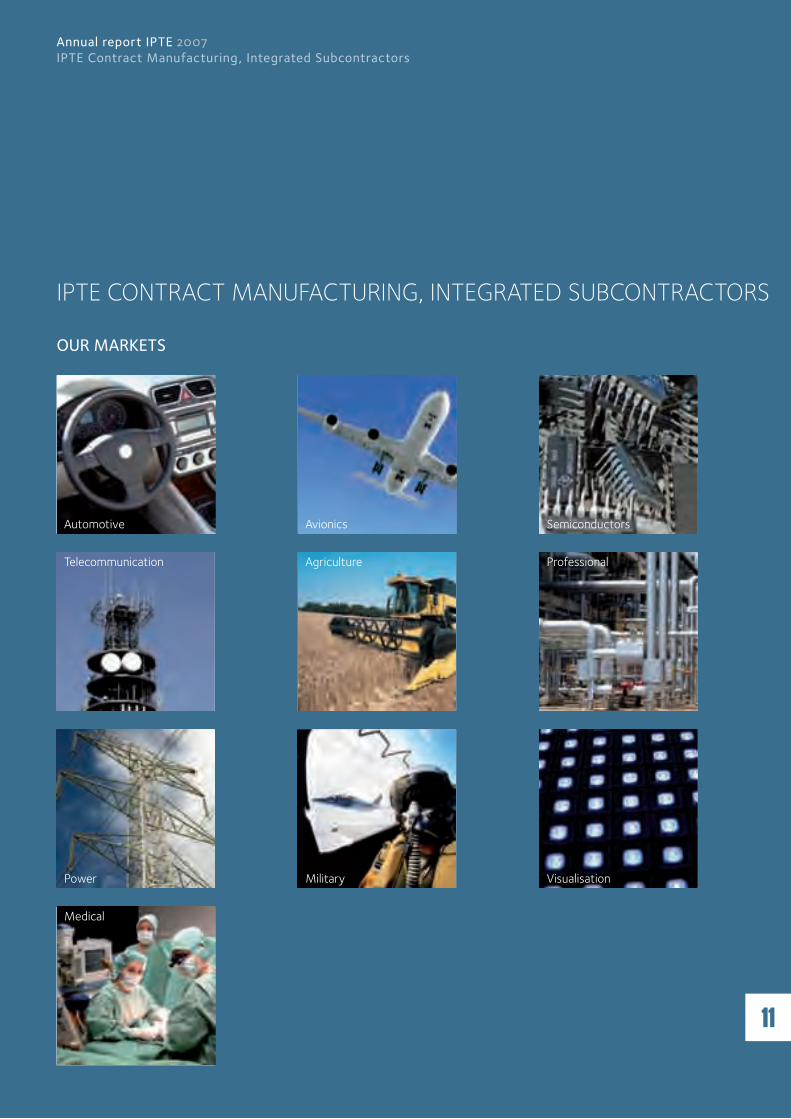
Our marketS
Automotive
Power
Telecommunication Agriculture
Military
Professional
Avionics
Visualisation
Medical
Semiconductors
ipte ContraCt manufaCturinG, inteGrated subContraCtors
12
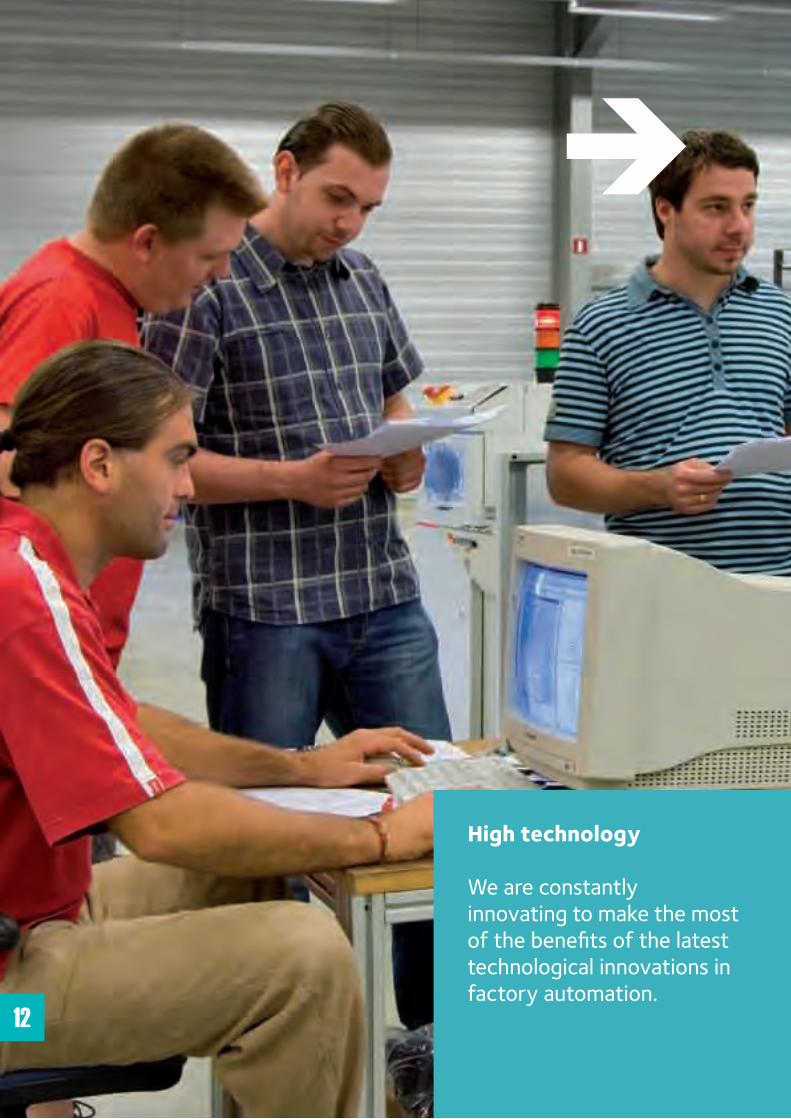
High technology
We are constantly innovating to make the most of the benefits of the latest technological innovations in factory automation.

13
Annual report IPTE 2007IPTE – Experts in Factory Automation
ipte – experts in faCtory automation
teStIPTE provides the necessary test stations and applications for PCBs and final products. These include hardware, software, process and management aspects: from test handlers to test systems, fixtures, application programs, tooling, etc. Test capacities range from ‘design for testability’ (optimizing testability during the development phase), test engineering, installation and startup support to training, process improvements and repair assistance.
Factory Automation is one of the few leading companies offering full capabilities in test, systems and assembly requirements for the market. Its worldwide presence is of major interest to large companies operating worldwide. The factory automation activities cover manual, semi-automatic and automatic standardized solutions for the different process steps in electronic factories. It also provides full-automatic complete production lines for the automotive, consumer and other industries.
IPTE fACTorY AuToMATIon
TEST SYSTEMS ASSEMBLY

14
aSSemblyIPTE delivers the assembly stations, linked to build complete production lines for electronic and mechanical products.
Although assembly operations are complicated, IPTE offers a solution that is simple, economical and efficient. IPTE has the technology and experience in-house to solve assembly projects in different application areas. These can be inline processes with pallets carrying the products, or offline processes with rotary tables or individual work stations. Lines based on lean solution principles are part of the portfolio.
SyStemSIPTE offers a complete conveying program, a state-of-the-art range of laser marking, odd-form placement and depaneling systems.
IPTE provides standardized solutions for several process steps in electronics production: marking of PCB’s up to depaneling of PCBs, placement of odd shape components including feeding, and the whole conveying program to link the complete line together.

15
Vladimir Dobosch, CCO Factory Automation
Annual report IPTE 2007IPTE – Experts in Factory Automation
2007 was a particularly attractive year for the Factory Automation division. With sales of EUR 60 million – no less than 20% higher than in 2006 – our division was able to make a significant contribution to the strong IPTE group results.
Around two-thirds of our sales were to the automotive sector. With the huge number of technological innovations constantly being introduced, this remains a leading sector for us.
Electronics is playing an ever greater role in today’s car. As well as safety, environmental friendliness and comfort determine the driver’s ultimate car choice. This is a trend that is set to continue.
Another significant portion of our sales came from the consumer electronics market. For the past year we can mention the boost in sales of test equipment for LCD TVs. With sales and production of cell phones continuing to progress, we are making major efforts in this market segment.
At the same time we have succeeded in growing more strongly than the electronics market as a whole. This we owe above all to the strategic choices we have made in terms of customer approach and the extension of our product and services offering.
Last year, for example, we began more systematically targeting larger customers.
Local IPTE activities are not limited to sales and services. Engineering-wise we can also operate close to our customers via our supply centres in the proximity of customer plants. This pretty much unique approach enables us to offer a maximum response to customers’ specific needs in terms of price and service.
In our product range we are continuing to place the emphasis on standardization, so that we can continue to offer maximum value for money. With regard to projects we are concen-trating in France, Germany and Belgium on building complex, fully-automated production lines, mostly for the automotive sector. We are also building semi-automated lines in China and Portugal
Factory Automation believes strongly in local presence and will be further invest in developing business units in more countries. This increases our capacity, and our know-how and product offering. The acquisition of PlatzGummer fits perfectly into this strategy.
ipte – experts in faCtory automation

16
Fully meeting customers’ requirementsThe IPTE Factory Automation division is committed to meet its customers’ needs by providing:• A high customer care approach• Leading technology in factory automation• A worldwide presence• Excellent price/performance
StrategyThe division’s strategy is based on four pillars• Strengthening the Group’s position in its present and new
niche markets by optimizing its organizational structure and existing product range
• Concentrating on its known areas of expertise in order to increase profitability
• Achieving a more dynamic professional organization by optimizing synergy between production facilities
• Focusing on the existing customer portfolio with a fully-developed standard product range.
Our miSSiOn“To be the leading independent global factory automation partner to the electronics manufacturing industry.”

17
Our marketS
Annual report IPTE 2007IPTE – Experts in Factory Automation
Computers & peripherals
Automotive
Professional products
Telecom Consumer electronics
ipte – experts in faCtory automation
18
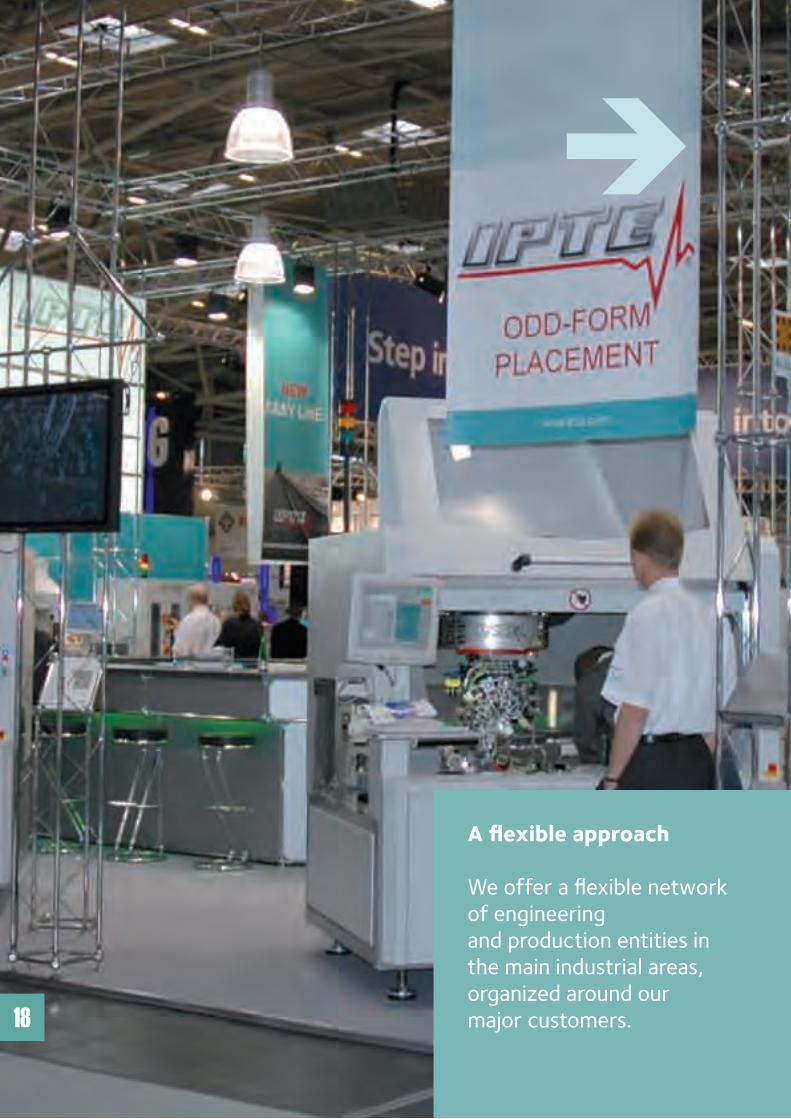
A flexible approach
We offer a flexible network of engineeringand production entities in the main industrial areas, organized around ourmajor customers.
19
Annual report IPTE 2007Report from the Board of Directors
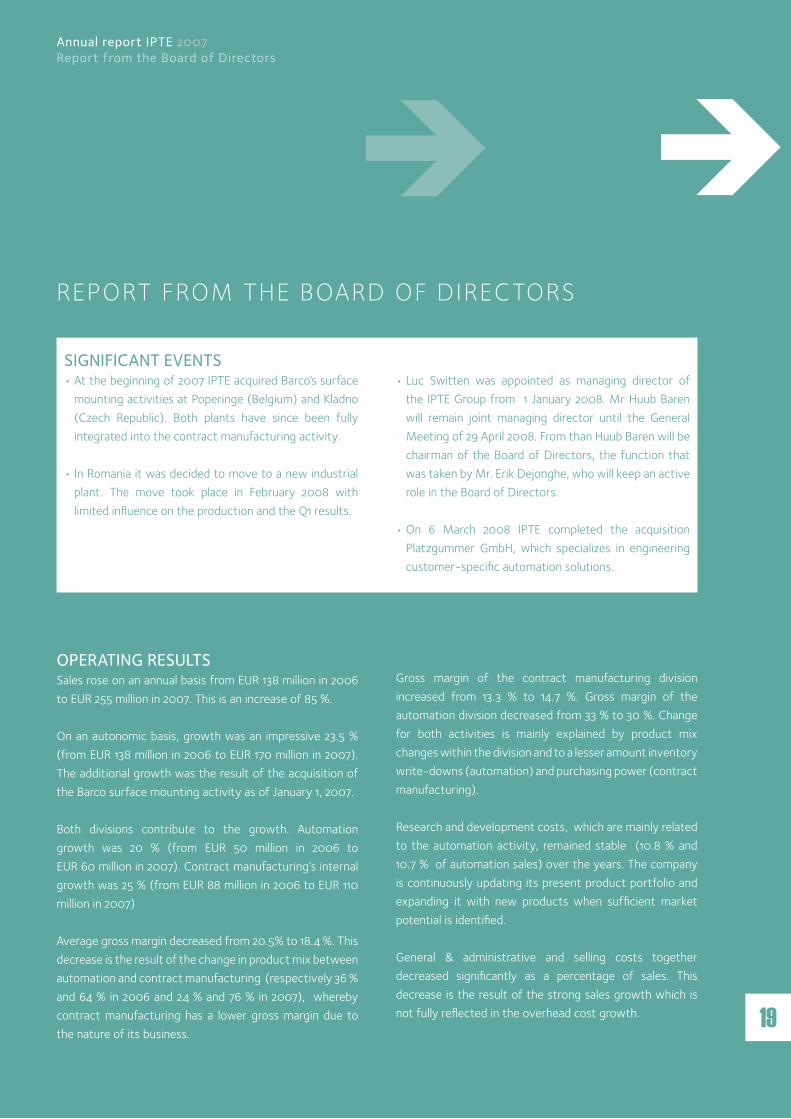
Significant eventS • At the beginning of 2007 IPTE acquired Barco’s surface
mounting activities at Poperinge (Belgium) and Kladno (Czech Republic). Both plants have since been fully integrated into the contract manufacturing activity.
• In Romania it was decided to move to a new industrial plant. The move took place in February 2008 with limited influence on the production and the Q1 results.
• Luc Switten was appointed as managing director of the IPTE Group from 1 January 2008. Mr Huub Baren will remain joint managing director until the General Meeting of 29 April 2008. From than Huub Baren will be chairman of the Board of Directors, the function that was taken by Mr. Erik Dejonghe, who will keep an active role in the Board of Directors.
• On 6 March 2008 IPTE completed the acquisition Platzgummer GmbH, which specializes in engineering customer-specific automation solutions.
report from the board of direCtors
OPerating reSultSSales rose on an annual basis from EUR 138 million in 2006 to EUR 255 million in 2007. This is an increase of 85 %.
On an autonomic basis, growth was an impressive 23.5 % (from EUR 138 million in 2006 to EUR 170 million in 2007). The additional growth was the result of the acquisition of the Barco surface mounting activity as of January 1, 2007.
Both divisions contribute to the growth. Automation growth was 20 % (from EUR 50 million in 2006 to EUR 60 million in 2007). Contract manufacturing‘s internal growth was 25 % (from EUR 88 million in 2006 to EUR 110 million in 2007)
Average gross margin decreased from 20.5% to 18.4 %. This decrease is the result of the change in product mix between automation and contract manufacturing (respectively 36 % and 64 % in 2006 and 24 % and 76 % in 2007), whereby contract manufacturing has a lower gross margin due to the nature of its business.
Gross margin of the contract manufacturing division increased from 13.3 % to 14.7 %. Gross margin of the automation division decreased from 33 % to 30 %. Change for both activities is mainly explained by product mix changes within the division and to a lesser amount inventory write-downs (automation) and purchasing power (contract manufacturing).
Research and development costs, which are mainly related to the automation activity, remained stable (10.8 % and 10.7 % of automation sales) over the years. The company is continuously updating its present product portfolio and expanding it with new products when sufficient market potential is identified.
General & administrative and selling costs together decreased significantly as a percentage of sales. This decrease is the result of the strong sales growth which is not fully reflected in the overhead cost growth.
20
Operating result improved from EUR 3.4 million to EUR 12.4 million. This is an increase from 2.5 % of sales in 2006 to 4.9 % of sales in 2007, and mainly relates to the contract manufacturing business.
Financial costs were EUR 2.7 million compared to EUR 1.3 million. This increase is the combined result of – exchange losses of EUR 0.6 million in 2007 for booking US dollar contracts market to market at yearend and a favorable reversal in 2006 of an interest provision of 0.5 million.
In 2007, the company recognized a deferred tax asset of EUR 1.5 million on prior year losses in accordance with IAS 12, paragraph 37 “Reassessment of unrecognized deferred tax assets”. The board of directors believes that this is a conservative estimation and that this deferred tax asset will be fully recoverable in the coming years.
The net profit for 2007 was EUR 10,9 million. This is five times higher compared to the profit of EUR 1.9 million in 2006.
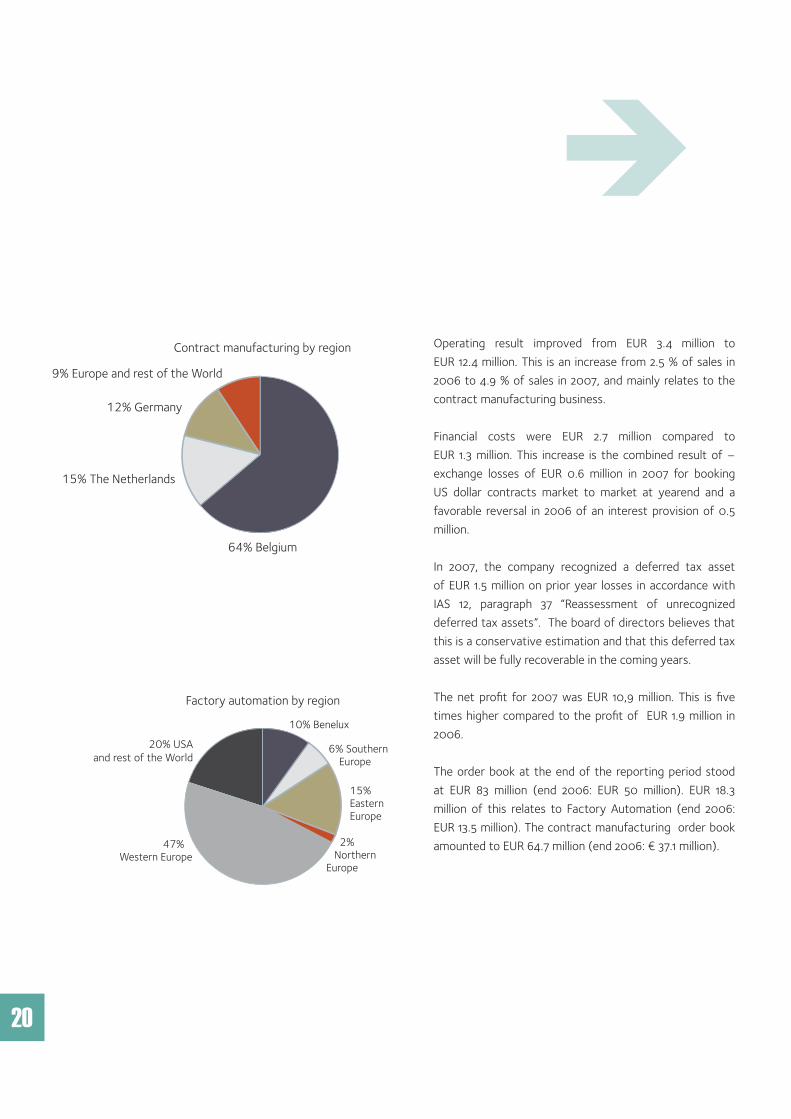
The order book at the end of the reporting period stood at EUR 83 million (end 2006: EUR 50 million). EUR 18.3 million of this relates to Factory Automation (end 2006: EUR 13.5 million). The contract manufacturing order book amounted to EUR 64.7 million (end 2006: € 37.1 million).
0
100
200
300
400
500
0
500
1000
1500
2000
-6,000
-5,000
-4,000
-3,000
-2,000
-1,000
0
1,000
2,000
3,000
100
150
200
250
300
0
1
2
3
4
5
-1,5
-1,0
-0,5
0,0
0,5
1,0
1,5
2,0
18832168
-5627
-701
-2236
0.34
1.56
0.37
-1.02
20072006200520042003 20072006200520042003 20072006200520042003
-0.13
-6000
-4000
-2000
0
2000
4000
6000
8000
10000
1200010 883
1 883
-5 627
-701
2 168
138.3
255.3
126.6128.5
110.3
Sales (in EUR ‘million)
Factory Automation Contract Manufacturing
Contract manufacturing by region Factory automation by market
Contract manufacturing by market Factory automation by region
Net result per share (in EUR) Net result (in EUR ‘000)
9% Europe and rest of the World
15% Consumer electronics
8% Other
4% Subcontracting6% Telecommunications
15% The Netherlands
12% Germany
64% Belgium
47% Western Europe
20% USAand rest of the World
15% Eastern Europe
2% Northern Europe
10% Benelux
6% Southern Europe
67% Automotive
10% Medical products
63% Professional products
11% Telecommunications2% Other
14% Automotive
2005 2006 2007 2005 2006 2007
0
100
200
300
400
500
0
500
1000
1500
2000
-6,000
-5,000
-4,000
-3,000
-2,000
-1,000
0
1,000
2,000
3,000
100
150
200
250
300
0
1
2
3
4
5
-1,5
-1,0
-0,5
0,0
0,5
1,0
1,5
2,0
18832168
-5627
-701
-2236
0.34
1.56
0.37
-1.02
20072006200520042003 20072006200520042003 20072006200520042003
-0.13
-6000
-4000
-2000
0
2000
4000
6000
8000
10000
1200010 883
1 883
-5 627
-701
2 168
138.3
255.3
126.6128.5
110.3
Sales (in EUR ‘million)
Factory Automation Contract Manufacturing
Contract manufacturing by region Factory automation by market
Contract manufacturing by market Factory automation by region
Net result per share (in EUR) Net result (in EUR ‘000)
9% Europe and rest of the World
15% Consumer electronics
8% Other
4% Subcontracting6% Telecommunications
15% The Netherlands
12% Germany
64% Belgium
47% Western Europe
20% USAand rest of the World
15% Eastern Europe
2% Northern Europe
10% Benelux
6% Southern Europe
67% Automotive
10% Medical products
63% Professional products
11% Telecommunications2% Other
14% Automotive
2005 2006 2007 2005 2006 2007

21
Total balance sheet rose with 47 % from EUR 89.5 million to EUR 131.8 million end 2007. This increase should be compared with a sales increase of 85 % on a year to year basis. Average working capital needs decreased from 26 % of sales in 2006 to 18 % in 2007.
The acquisition of Barco surface mounting activity resulted as of January 1, 2007 in an increase of the balance sheet total with EUR 22.6 million (EUR 15 million inventories, EUR 2.5 million fixed assets, EUR 5.1 million receivables as assets and EUR 7.2 million trade payables as liabilities. The remaining 15.4 million was financed by bank loans).
The company invested heavily in expansion of its production capacity, needed to cope with the growth of the business. In total, new machines were bought for a total of EUR 6.5 million (EUR 2.8 million in 2006). These investments mainly include electronic production and test equipment.
Net financial debt (long and short term financial debt less cash, bank deposits and current investments) decreased from EUR 30.5 million to EUR 28 million due to repayment of the subordinated loan of EUR 7 million and the capital increase of EUR 7 million.
Group shareholders’ equity improved from EUR 23.9 million (26.7 % of the balance sheet total) to EUR 41.6 million (31.6 % of the balance sheet total). This increase is the result of - the conversion of the warrants (1,458,333 new shares) into capital (EUR 7 million capital increase) - the profit of the year (EUR 10.9 million) and - the buyout of all shares of the existing minorities in Singapore and USA (minus EUR 0.1 million).
report from the board of direCtors
Annual report IPTE 2007Report from the Board of Directors
0
100
200
300
400
500
0
500
1000
1500
2000
-6,000
-5,000
-4,000
-3,000
-2,000
-1,000
0
1,000
2,000
3,000
100
150
200
250
300
0
1
2
3
4
5
-1,5
-1,0
-0,5
0,0
0,5
1,0
1,5
2,0
18832168
-5627
-701
-2236
0.34
1.56
0.37
-1.02
20072006200520042003 20072006200520042003 20072006200520042003
-0.13
-6000
-4000
-2000
0
2000
4000
6000
8000
10000
1200010 883
1 883
-5 627
-701
2 168
138.3
255.3
126.6128.5
110.3
Sales (in EUR ‘million)
Factory Automation Contract Manufacturing
Contract manufacturing by region Factory automation by market
Contract manufacturing by market Factory automation by region
Net result per share (in EUR) Net result (in EUR ‘000)
9% Europe and rest of the World
15% Consumer electronics
8% Other
4% Subcontracting6% Telecommunications
15% The Netherlands
12% Germany
64% Belgium
47% Western Europe
20% USAand rest of the World
15% Eastern Europe
2% Northern Europe
10% Benelux
6% Southern Europe
67% Automotive
10% Medical products
63% Professional products
11% Telecommunications2% Other
14% Automotive
2005 2006 2007 2005 2006 2007
0
100
200
300
400
500
0
500
1000
1500
2000
-6,000
-5,000
-4,000
-3,000
-2,000
-1,000
0
1,000
2,000
3,000
100
150
200
250
300
0
1
2
3
4
5
-1,5
-1,0
-0,5
0,0
0,5
1,0
1,5
2,0
18832168
-5627
-701
-2236
0.34
1.56
0.37
-1.02
20072006200520042003 20072006200520042003 20072006200520042003
-0.13
-6000
-4000
-2000
0
2000
4000
6000
8000
10000
1200010 883
1 883
-5 627
-701
2 168
138.3
255.3
126.6128.5
110.3
Sales (in EUR ‘million)
Factory Automation Contract Manufacturing
Contract manufacturing by region Factory automation by market
Contract manufacturing by market Factory automation by region
Net result per share (in EUR) Net result (in EUR ‘000)
9% Europe and rest of the World
15% Consumer electronics
8% Other
4% Subcontracting6% Telecommunications
15% The Netherlands
12% Germany
64% Belgium
47% Western Europe
20% USAand rest of the World
15% Eastern Europe
2% Northern Europe
10% Benelux
6% Southern Europe
67% Automotive
10% Medical products
63% Professional products
11% Telecommunications2% Other
14% Automotive
2005 2006 2007 2005 2006 2007

22
People in partnership
We take our partnerships with our customers not only seriously, but alsoenthu siastically, to ensure that we provide optimum, cost-efficient andsuccessful solutions.
DEDICATIOn
OPEnnESS
InTEGRITY
PARTnERSHIP
InnOvATIOn
keePing PrOmiSeS and credibility
mOtivatiOn and cOntinuOuS
imPrOvement
cOOPeratiOn and
knOWledge Sharing
tranSParency and OPen cOmmunicatiOn PaSSiOn fOr innOvatiOn
23
Annual report IPTE 2007Human Resources
human resourCes
0
100
200
300
400
500
0
500
1000
1500
2000
-6,000
-5,000
-4,000
-3,000
-2,000
-1,000
0
1,000
2,000
3,000
100
150
200
250
300
0
1
2
3
4
5
-1,5
-1,0
-0,5
0,0
0,5
1,0
1,5
2,0
18832168
-5627
-701
-2236
0.34
1.56
0.37
-1.02
20072006200520042003 20072006200520042003 20072006200520042003
-0.13
-6000
-4000
-2000
0
2000
4000
6000
8000
10000
1200010 883
1 883
-5 627
-701
2 168
138.3
255.3
126.6128.5
110.3
Sales (in EUR ‘million)
Factory Automation Contract Manufacturing
Contract manufacturing by region Factory automation by market
Contract manufacturing by market Factory automation by region
Net result per share (in EUR) Net result (in EUR ‘000)
9% Europe and rest of the World
15% Consumer electronics
8% Other
4% Subcontracting6% Telecommunications
15% The Netherlands
12% Germany
64% Belgium
47% Western Europe
20% USAand rest of the World
15% Eastern Europe
2% Northern Europe
10% Benelux
6% Southern Europe
67% Automotive
10% Medical products
63% Professional products
11% Telecommunications2% Other
14% Automotive
2005 2006 2007 2005 2006 2007
0
100
200
300
400
500
0
500
1000
1500
2000
-6,000
-5,000
-4,000
-3,000
-2,000
-1,000
0
1,000
2,000
3,000
100
150
200
250
300
0
1
2
3
4
5
-1,5
-1,0
-0,5
0,0
0,5
1,0
1,5
2,0
18832168
-5627
-701
-2236
0.34
1.56
0.37
-1.02
20072006200520042003 20072006200520042003 20072006200520042003
-0.13
-6000
-4000
-2000
0
2000
4000
6000
8000
10000
1200010 883
1 883
-5 627
-701
2 168
138.3
255.3
126.6128.5
110.3
Sales (in EUR ‘million)
Factory Automation Contract Manufacturing
Contract manufacturing by region Factory automation by market
Contract manufacturing by market Factory automation by region
Net result per share (in EUR) Net result (in EUR ‘000)
9% Europe and rest of the World
15% Consumer electronics
8% Other
4% Subcontracting6% Telecommunications
15% The Netherlands
12% Germany
64% Belgium
47% Western Europe
20% USAand rest of the World
15% Eastern Europe
2% Northern Europe
10% Benelux
6% Southern Europe
67% Automotive
10% Medical products
63% Professional products
11% Telecommunications2% Other
14% Automotive
2005 2006 2007 2005 2006 2007
PerSOnnel Overview by country
Factory Automation
Contract Manufacturing
Total
Belgium 132 623 755
Netherlands 0 96 96
Germany 109 97 206
France 112 0 112
United Kingdom 2 0 2
Portugal 18 0 18
Romania 20 743 763
Slovakia 0 155 155
Czech Republic 1 270 271
Finland 1 0 1
Singapore 1 0 1
China 52 0 52
USA 7 0 7
Total 455 1 984 2 439

24
the group’s basic philosophy has always been to support our european industrial customers on site wherever they are producing.

25
Annual report IPTE 2007Corporate governance
Corporate GovernanCe
bOard Of directOrS*EDJ NV (permanently represented by Mr. Erik Dejonghe) Chairman, Independent Director (1) (2)Huub Baren Managing DirectorVladimir Dobosch DirectorLuc Switten DirectorStokklinx BVBA (permanently represented by Mr. Guy van Dievoet) Independent Director (2)
Becap BVBA (permanently represented by Mr. Pierre Serrure) Director **Immocom NV (permanently represented by Mr. Freddy Daniëls) Director** (2)
Dominique Moorkens Independent Director (1)Geboers Management & Consulting BVBA (permanently represented by Mr. André Geboers) Director, till October 17, 2007 ** (1)
executive management*Huub Baren CEO, Managing Director GroupHugo Ciroux Chief Financial OfficerLuc Switten CEO ConnectSystems
* in their own names or via management companies ** representing LRM NV (Limburgse Reconversie Maatschappij)(1) Member of the Remuneration Committee (2) Member of the Audit Committee
the bOard Of directOrSThe Board of Directors is the highest management body within the company. In addition to its decision-making authority, the Board is charged with exercising full and effective control of the company.
The Board must therefore meet at least six times a year and on as many other occasions as the group’s interests require. In addition to its statutory duties the Board of Directors is responsible for defining the group’s strategic objectives and establishing general policy on the basis of proposals submitted by management. The Board also supervises the implementation of policy, controls the company and prepares the annual accounts for the shareholders.

26
cOmPOSitiOn Of the bOard Of directOrSThe company is managed by a Board of Directors, comprised of a minimum of five directors, who may or may not be shareholders, and who are appointed by the General Meeting of Shareholders.In 2007, the Board of Directors was made up by the following members:• EDJ nv, represented by Mr. Erik Dejonghe (appointed on
18 April 2003 for a six-year term). Independent Director, Chairman of the Board of Directors.
• Huub Baren BvBA, represented by Mr. Huub Baren (appointed on 26 April 2005 for a six-year term). Managing Director. Dominant shareholder holding 30,23% of the shares.
• vladimir Dobosch BvBA, represented by Mr. vladimir Dobosch (appointed on 16 April 2004 for a six-year term). Dominant shareholder.
• Luc Switten BvBA, represented by Mr. Luc Switten (appointed on 16 April 2004 for a six-year term). Dominant shareholder.
• Stokklinx BvBA, represented by Mr. Guy van Dievoet (appointed on 26 April 2005 for a six-year term). Independent Director, dominant shareholder.
• Mr Dominique Moorkens (appointed on 25 April 2006 for a six-year term). Independent Director.
• Geboers Management & Consulting BvBA, represented by Mr. André Geboers (till October 17, 2007).
• Immocom nv, represented by Mr. Freddy Daniëls (appointed on 14 November 2007 as director coopted till the General Meeting of Shareholders of 29 April 2008). Director representing LRM NV.
• Becap BvBA, represented by Mr. Pierre Serrure, (appointed on 24 April 2007 for a six year term).
Each director may be dismissed by the General Meeting at any time. Retiring or retired Directors may be reappointed. Any Board member may resign by written notification to the Board of Directors. There must be at least two independent directors.
OPeratiOn Of the bOard Of directOrSIn 2006 the Board of Directors met on 08/01, 12/02, 19/03, 24/04, 14/05, 13/08 en 14/11. Items on the agenda included the approval of financial data such as the Group Operating Reports and the group accounts, sales figures, quarterly reporting and budget monitoring, monitoring of subsidiaries, consolidated results, review and appraisal of strategic directions, acquisitions and evaluation of investments.
The Board of Directors can deliberate and come to decisions only if a majority of its members, including at least one independent director, attend the meeting or are represented. Where the first meeting fails to meet the required quorum, the Board of Directors may legally deliberate and make decisions during a following meeting with the same agenda, irrespective of whether the required quorum is present or not.
In the event of a tie, the director chairing the meeting gives the casting vote. The executive management must provide the Board of Directors on a monthly basis with a group management report and group accounts, sales statistics and an interim financial report (income statement and balance sheet). On a quarterly basis it must also provide a complete interim financial report (income statement, balance sheet, detailed budget monitoring, ratio analysis), which is made public. The information provided to the Board must include regularly updated information on current acquisition projects. Each director may ask approval to seek independent professional advice at the company’s expense at any time.

27
CORPORATE GOVERNANCE
Annual report IPTE 2007Corporate governance
Committees formed by the board of direCtors
Audit CommitteeThe Audit Committee has the task of reporting to and advising the Board of Directors. The Audit Committee supervises the company’s accounting operations and financial reporting. It verifies that there are sufficient internal controls and, in collaboration with the statutory auditors, it inquires into accountancy issues, including the assessment. The committee meets at least twice a year to review the half-yearly statements and the draft of the consolidated and individual annual accounts.
Remuneration CommitteeThe Remuneration Committee is made up of non-executive directors, at least one of whom is required by the by-laws to be an independent director. One of the Remuneration Committee’s responsibilities is to ensure that members of staff are remunerated fairly and appropriately in relation to their contribution to the performance and prosperity of the company. The committee also makes recommendations to the Board of Directors on remuneration-related matters. The Board of Directors may assign certain tasks to the Remuneration Committee. The Remuneration Committee met once in 2007.In 2008 the Board of Directors will examine the need for new committees and establish any that it deems necessary.
Executive managementMr. Huub Baren has been appointed Managing Director in charge of daily management. He is supported by a Management Committee consisting - apart from himself - of the Chief Financial Officer , and the Chief Executive Officer of ConnectSystems. The Executive Management meets monthly and its responsibilities include the preparation of the meetings of the Board of Directors and the supervision of daily management The remuneration of the Executive Management amounts in total to € 0.9 million.
Appropriation policyThe company does not pursue any strictly defined dividend policy. IPTE wants to conserve cash resources and remain flexible enough to take advantage of opportunities for internal and external expansion. For this reason no dividend will again be declared for the 2007 financial year.
Relations between dominant shareholdersThe dominant shareholders have contracted among themselves to sell their IPTE shares only by mutual agreement.
Protocol to prevent abuse of advance information and insider tradingDuring its meeting on 15 November 2000 the Board of Directors of IPTE drew up a protocol to avoid the illegal use of privileged information – or creating the impression of its illegal use – by directors, shareholders, senior managers and key employees (insiders). The protocol consists of a number of prohibitions, intended primarily to protect the market.The practice of insiders dealing in company shares whilst in possession of insider information affects the market. If insiders are seen to make (or are suspected of making) financial benefit from insider knowledge, investors will turn their back on the market. This could reduce the liquidity of the listed shares and limit access to new cash resources.The protocol also includes a number of preventive measures to assure compliance with the legal stipulations and to protect the company’s reputation.
The stringent procedures of the protocol require that the persons involved:• not deal in IPTE shares during the two months prior to
publication of annual results;• not deal in IPTE shares during the 21 days prior to publication
of quarterly results;• not sell shares within six months of purchase;• inform the CFO of all intended operations before
undertaking them.

cOntentS
1. Consolidated finanCial statements p.291.1 independent auditor ’s report p.291.2 detailed Consolidated financial statements (in eur) p.311.3 notes to the Consolidated financial statements of the ipte Group p.35
2. individual finanCial statements p.702.1 report of board of directors p.70 2.2 Condensed financial statements p.742.3 summary of the valuation rules p.78
28
29
Annual report IPTE 2007Consolidated Financial Statements
To the shareholdersAs required by law and the company’s articles of association, we are pleased to report to you on the audit assignment which you have entrusted to us. This report includes our opinion on the consolidated financial statements together with the required additional comment.
Unqualified audit opinion on the consolidated financial statementsWe have audited the accompanying consolidated financial statements of INTEGRATED PRODUCTION AND TEST ENGINEERING NV (“the company”) and its subsidiaries (jointly “the Group”), prepared in accordance with International Financial Reporting Standards as adopted by the European Union and with the legal and regulatory requirements applicable in Belgium. Those consolidated financial statements comprise the consolidated balance sheet as at 31 December 2007, the consolidated income statement, the consolidated statement of changes in equity and the consolidated cash flow statement for the year then ended, as well as the summary of significant accounting policies and other explanatory notes. The consolidated balance sheet shows total assets of EUR 131,806,980 and a consolidated profit (Group share) for the year then ended of EUR 10,868,205.
The financial statements of several significant entities included in the scope of consolidation which represent total assets of EUR 31,373,752 and a total turnover of EUR 52,698,759 have been audited by other auditors.
Our opinion on the accompanying consolidated financial statements, insofar as it relates to the amounts contributed by those entities, is based upon the reports of those other auditors.
The Board of Directors of the company is responsible for the preparation of the consolidated financial statements. This responsibility includes among other things: designing, implementing and maintaining internal control relevant to the preparation and fair presentation of consolidated financial statements that are free from material misstatement,
whether due to fraud or error, selecting and applying appropriate accounting policies, and making accounting estimates that are reasonable in the circumstances.
Our responsibility is to express an opinion on these consolidated financial statements based on our audit. We conducted our audit in accordance with legal requirements and auditing standards applicable in Belgium, as issued by the “Institut des Reviseurs d’Entreprises/Instituut der Bedrijfsrevisoren”. Those standards require that we plan and perform the audit to obtain reasonable assurance whether the consolidated financial statements are free from material misstatement.
In accordance with these standards, we have performed procedures to obtain audit evidence about the amounts and disclosures in the consolidated financial statements. The procedures selected depend on our judgment, including the assessment of the risks of material misstatement of the consolidated financial statements, whether due to fraud or error. In making those risk assessments, we have considered internal control relevant to the Group’s preparation and fair presentation of the consolidated financial statements in order to design audit procedures that are appropriate in the circumstances but not for the purpose of expressing an opinion on the effectiveness of the Group’s internal control.
We have assessed the basis of the accounting policies used, the reasonableness of accounting estimates made by the company and the presentation of the consolidated financial statements, taken as a whole.
Finally, the Board of Directors and responsible officers of the company have replied to all our requests for explanations and information. We believe that the audit evidence we have obtained, together with the reports of other auditors on which we have relied, provides a reasonable basis for our opinion.
In our opinion, and based upon the reports of other auditors, the consolidated financial statements give a true and fair view of the Group’s financial position as of 31 December 2007, and of its results and its cash flows for the year then
1. CONSOLIDATED FINANCIAL STATEMENTS1 .1 Independent Auditor ’s Report

30
ended, in accordance with International Financial Reporting Standards as adopted by the European Union and with the legal and regulatory requirements applicable in Belgium.
Additional commentThe preparation and the assessment of the information that should be included in the directors’ report on the consolidated financial statements are the responsibility of the Board of Directors.
Our responsibility is to include in our report the following additional comment which does not change the scope of our audit opinion on the consolidated financial statements:
• The directors’ report on the consolidated financial statements includes the information required by law and is in agreement with the consolidated financial statements. However, we are unable to express an opinion on the description of the principal risks and uncertainties confronting the Group, or on the status, future evolution, or significant influence of certain factors on its future development. We can, nevertheless, confirm that the information given is not in obvious contradiction with any information obtained in the context of our appointment.
Hasselt, 18 March 2008The statutory auditor
DELOITTE Bedrijfsrevisoren Represented by
Dominique Roux
31
Annual report IPTE 2007Consolidated Financial Statements
Consolidated Balance Sheets as of 31 December 2007IPTE NV 2007 2006 2005AssetsCurrent assets:
Cash and cash equivalents (notes 1.3.7.a) 3,414,192 2,309,267 3,694,792Trade receivables (notes 1.3.7.b) 52,919,443 34,781,109 26,266,649Other receivables (notes 1.3.7.c) 2,865,483 2,395,578 2,538,922Inventories (notes 1.3.7.d) 46,243,204 28,914,324 23,987,772Other current assets 211,054 289,418 390,068
Total current assets 105,653,376 68,689,696 56,878,203Non-current assets:
Other receivables 1,239,364 1,489,717 1,502,044Deferred tax assets (notes 1.3.7.n) 1,615,333 999,900 901,553Property, plant and equipment (notes 1.3.7.e) 17,101,944 12,225,580 11,999,604Intangible assets (notes 1.3.7.f) 254,402 221,470 253,554Goodwill / negative goodwill (notes 1.3.7.g) 5,942,561 5,942,561 5,942,561
Total non-current assets 26,153,604 20,879,228 20,599,316Total assets 131,806,980 89,568,924 77,477,519
Liabilities and equityCurrent liabilities:
Bank loans and overdrafts (notes 1.3.7.i) 25,649,555 23,155,582 18,147,209Current portion of long-term debt (notes 1.3.7.j) 1,464,651 7,848,765 691,787Trade payables 40,818,143 21,439,599 14,852,232Accrued expenses, payroll and related taxes and deferred income (notes 1.3.7.h)
10,749,659 6,308,386 5,865,737
Provisions (notes 1.3.7.k) 2,016,384 1,356,208 2,341,780Other current liabilities (notes 1.3.7.l) 4,707,522 2,730,092 2,032,942
Total current liabilities 85,405,914 62,838,632 43,931,687Non-current liabilities:
Long-term debt less current portion (notes 1.3.7.j) 4,630,255 1,810,118 9,749,930Deferred tax liability (notes 1.3.7.n) 115,333 999,900 901,553
Total non-current liabilities 4,745,588 2,810,018 10,651,483Equity (notes 1.3.7.m)
Shareholders’ capital 429,934 339,411 339,411Legal reserve 42,993 33,941 33,941Share premium 37,214,276 30,304,699 30,304,699Retained earnings (6,970,094) (8,818,086) (10,626,062)Current year’s profit / (loss) 10,868,205 1,857,151 2,046,008Cumulative translation adjustment 70,164 107,352 261,274
Equity attributable to equity holders of the parent 41,655,478 23,824,468 22,359,271Minority interests - 95,806 535,078Total equity 41,655,478 23,920,274 22,894,349Total liabilities and equity 131,806,980 89,568,924 77,477,519The accompanying notes to these balance sheets form an integral part of these consolidated financial statements.
1.2 Detailed Consolidated Financial Statements (in EUR)

32
Consolidated Income Statements as of 31 December 2007
IPTE NV 2007 2006 2005Sales (notes 1.3.7.o) 255,290,481 138,281,819 126,662,471 Cost of sales (notes 1.3.7.p) (208,396,134) (109,917,429) (97,885,671)Gross Profit 46,894,347 28,364,390 28,776,800 Research and development expenses (notes 1.3.7.q) (7,790,923) (6,255,331) (5,801,681) General and administrative expenses (notes 1.3.7.r) (13,890,734) (9,134,290) (8,756,865) Selling expenses (notes 1.3.7.s) (12,888,818) (9,885,503) (10,010,522) Other income (expense) net 103,225 303,762 (10,982)Profit/(loss) from operations 12,427,097 3,393,028 4,196,750 Financial income (notes 1.3.7.v) 1,102,042 1,041,464 437,638 Financial charges (notes 1.3.7.v) (3,828,268) (2,418,061) (2,478,271)Profit/(loss) before taxes 9,700,871 2,016,431 2,156,117 Income taxes (notes 1.3.7.w) 1,181,810 (133,633) 12,143Profit/(loss) for the years 10,882,681 1,882,798 2,168,260Attributable to: Equity holders of the parent 10,868,205 1,857,151 2,046,008 Minority interest (notes 1.3.7.m) 14,476 25,647 122,252Earnings per shareBasic earnings per share (notes 1.3.7.x) 1.57 0.34 0.37Diluted earnings per share (notes 1.3.7.x) 1.57 (*) 0.27 0.37
(*) Taking into account the number of additional ordinary shares, which would have been outstanding assuming the conversion of all warrants granted to LRM NV and the managers into ordinary shares (see note 1.3.7.x.).
The accompanying notes to these income statements form an integral part of these consolidated financial statements.

33
Annual report IPTE 2007Consolidated Financial Statements
Consolidated statement of changes in equity
Date Number of shares
outstanding
Capital Legal reserve
Share premium
Profit/loss carried
forward
Cumulative translation adjustment
Attributable to equity holders
of the parent
Minority Total
31/12/04 5,476,092 339,411 33,941 30,304,699 (11,434,170) (48,340) 19,195,541 412,826 19,608,367Effect of change in valuation rules (1) 808,108 808,108 808,108Net income 2,046,008 2,046,008 122,252 2,168,260Cumulative translation adjustment 309,614 309,614 309,614
31/12/05 5,476,092 339,411 33,941 30,304,699 (8,580,054) 261,274 22,359,271 535,078 22,894,349Net income 1,857,151 1,857,151 25,647 1,882,798Cumulative translation adjustment (153,921) (153,921) (153,921)Increase participation Antest SARL to 100 % (2) (238,033) (464,919) (702,952)
31/12/06 5,476,092 339,411 33,941 30,304,699 (6,960,936) 107,353 23,824,468 95,806 23,920,274Net income 10,868,205 10,868,205 14,476 10,882,681Increase legal reserve 9,158 (9,158) 0Capital increase 1,458,332 90,417 6,909,577 6,999,994 6,999,994Other 106 (106) 0Cumulative translation adjustment (37,189) (37,189) (37,189)
Increase participation IPTE Asia Pacific PTE Ltd to 100% (3) (110,282) (110,282)
31/12/07 6,934,424 429,934 42,993 37,214,276 3,898,111 70,164 41,655,478 0 41,655,478
(1) According to IFRS 3.81 the carrying amount of negative goodwill at the beginning of the first annual period beginning or after 31 March 2004 that arose from a business combination for which the agreement date was before 31 March 2004, shall be derecognised at the beginning of that period, with a corresponding adjustment to the opening balance of retained earnings.
(2) The Group already had control over Antest SARL in which it owned 52 % of the shares. On 1 June 2006 it acquired the remaining shares. In accordance with the accounting policies of the Group the excess of the cost of acquisition over the carrying amount of the Group’s share of the identifiable net assets acquired is recorded against equity.
(3) The Group already had control over IPTE Asia Pacific PTE Ltd in which it owned 80 % of the shares. On 1 December, 2007 it acquired the remaining shares at the value of the minority.

34
Consolidated Cash Flow Statements for the 12 month period ending 31 December IPTE NV 2007 2006 2005Profit/(loss) from operations 12,427,097 3,393,028 4,196,750Adjustments for: Amortization goodwill/negative goodwill - - - Allowance for doubtful receivables and obsolete stock 3,593,617 854,089 403,779 Depreciation and amortization 4,190,668 2,640,224 2,566,599 Provisions 660,176 (985,572) (1,808,608)Operating profit before changes in working capital 20,871,558 5,901,769 5,358,520 Inventories (5,764,960) (5,661,885) (1,194,965) Trade receivables (13,351,210) (8,633,215) 5,611,125 Trade payables 12,756,331 6,587,367 (3,043,648) Accrued expenses, payroll and related taxes and deferred income 3,502,908 271,565 (912,439) Other receivables (357,587) 143,409 183,667 Other current assets 328,717 113,033 (71,430) Other payables 2,297,051 714,314 214,600Cash flow from operating activities (588,750) (563,643) 6,145,430 Taxes (318,190) (133,633) 12,143 Exchange differences 357,826 328,514 (135,751) Interests / Financial charges (3,089,813) (2,254,315) (1,929,825) Other (118,366) 65 294,300Net cash from/(used in) operating activities (3,168,543) (2,623,012) 4,386,297Cash flows from investing activities Increase in ownership interest, net of cash acquired (notes 1.3.7.y) (15,387,595) (702,952) - Investments in intangible assets (103,086) (98,798) (86,900) Investments in property, plant and equipment (6,752,383) (2,862,390) (3,666,022) Gain/(loss) on the sale of property, plant and equipment 297,973 127,072 - Interest received 5,761 549,016 24,943Cash flows used in investing activities (21,939,330) (2,988,052) (3,727,979)Cash flows from financing activities Proceeds/(repayments) from long-term debts 2,820,137 (939,812) 21,828 Proceeds/(repayments) from current portion of long-term debt (6,384,114) 156,978 71,887 Proceeds/(repayments) from bank loans and overdrafts 2,493,973 5,008,373 91,092 Proceeds from capital increase 6,999,994 - -Net cash provided by financing activities 5,929,990 4,225,539 184,807Monetary (loss)/gain on cash and cash equivalents - - -Increase/(decrease) in cash and cash equivalents 1,104,925 (1,385,525) 843,125Cash and cash equivalents at the beginning of the period 2,309,267 3,694,792 2,851,667Cash and cash equivalents at the end of the period 3,414,192 2,309,267 3,694,792
The accompanying notes to these cash flow statements form an integral part of the consolidated financial statements.

35
Annual report IPTE 2007Consolidated Financial Statements
1.3 Notes to the Consolidated Financial Statements of the IPTE Group
1.3.1. GeneralIPTE NV is a limited liability company incorporated under Belgian law, with subsidiaries in Belgium (ConnectSystems NV, ConnectSystems International NV, Connectronics NV and Connect Systems Holding NV), the Netherlands (Connect Systems Nederland BV), France (IPTE RF SARL, And-Elec SAS, Antest SARL, Prodel Automation SARL and Prodel Technologies SA), Germany (IPTE GmbH and Connectronics GmbH), Portugal (IPTE Iberia – Automaçao Industrial LDA), Romania (Connectronics Romania SRL), Slovakia (Connect Systems Slovakia spol. sro), Czech Republic (Connectronics sro), Singapore (IPTE Asia Pacific PTE LTD, IPTE ASIA Holdings PTE LTD), the United Kingdom (IPTE (UK) LTD), Sweden (IPTE Nordic AB), the United States of America (ITE Enterprises Inc., IPTE America LLC and Prodel USA Inc.), China (IPTE Industrial Automation (Shanghai) Co. LTD) and Finland (IPTE Nordic Oy). The company develops and produces test and production equipment for the electronics industry (automation business) and is a subcontractor for the electronics industry (contract manufacturing business).
The number of employees at year-end amounted to 2,439 in 2007, 1,643 in 2006 and 1,467 in 2005.
The registered office address of the Group is located at Geleenlaan 5, 3600 Genk, Belgium. The financial statements were authorized for issue by the Board of Directors subsequent to their meeting held on March 17 2008, in Genk.
1.3.2. BasisofpreparationThe consolidated financial statements have been prepared in accordance with the International Financial Reporting Standards (IFRS) as adopted by the European Union.
These consolidated statements have been prepared under the historical cost convention except for certain accounts for which IFRS requires another convention. Such deviation from historical cost is disclosed in the notes.
1.3.3. GoingconcernThe Board of Directors reviewed the preparation of the financial statements under the going concern principle given the fact that:
- Consolidated 2007 results are positive;- Budget 2008 prepared on a conservative basis, shows
profit and a positive cash flow.
The Board of Directors is convinced that the preparation of the financial statements under the going concern principle is fully justified.
1.3.4. Adoption of new and revised InternationalFinancialReportingStandardsIn the current year, the Group has adopted all of the new and revised Standards and Interpretations issued by the International Accounting Standards Board (the IASB) and the International Financial Reporting Interpretations Committee (IFRIC) of the IASB that are relevant to its operations and effective for accounting periods beginning on 1 January 2007.
Following Standards and Interpretations becameapplicablefor2007-IFRS 7 Financial Instruments: Disclosures (applicable for
accounting years beginning on or after 1 January 2007)
-IAS 1 Presentation of Financial Statements - Amendment - Capital Disclosures (applicable for accounting years beginning on or after 1 January 2007)
-IFRIC 7 Applying the Restatement Approach under IAS 29 Financial Reporting in Hyperinflationary Economies (applicable for accounting years beginning on or after 1 March 2006)
-IFRIC 8 Scope of IFRS 2 (applicable for accounting years beginning on or after 1 May, 2006)
-IFRIC 9 Reassessement of Embedded Derivatives (applicable for accounting years beginning on or after 1 June 2006)
36
- IFRIC 10 Interim Financial Reporting and Impairment (applicable for accounting years beginning on or after 1 November 2006)
The impact of the adoption of IFRS 7 and the changes to IAS 1 has been to expand the disclosures provided in these financial statements regarding the Group’s financial instruments and management of capital.
The adoption of the four interpretations issues by the International Financial Reporting Interpretations Committee that are effective for the current period has not led to any changes in the Group’s accounting policies.
Following Standards and Interpretations were issued but are not yet effective- IAS 1 Presentation of Financial Statements (annual periods
beginning on or after 1 January 2009). This Standard replaces IAS 1 Presentation of Financial Statements (revised in 2003) as amended in 2005.
- Amendment to IAS 27 Consolidated and Separate Financial Statements (applicable for annual periods beginning on or after 1 July 2009). This Standard amends IAS 27 Consolidated and Separate Financial Statements (revised 2003).
- Amendment to IFRS 2 – Vesting Conditions and Cancellations (applicable for annual periods beginning on or after 1 January 2009).
- Amendments to IAS 32 Financial Instruments: Presentation and IAS 1 Presentation of Financial Statements – Puttable financial instruments an obligations arising on liquidation (annual periods beginning on or after 1 January 2009).
- IFRS 3 Business Combinations (applicable to business combinations for which the acquisition date is on or after the beginning of the first annual reporting period beginning on or after 1 July 2009). This Standard replaces IFRS Business Combinations as issued in 2004.
- IFRS 8 Operating Segments (applicable for accounting years beginning on or after 1 January 2009)
- Amendment to IAS 23 Borrowing Costs (applicable for accounting years beginning on or after 1 January 2009)
- IFRIC 11 IFRS 2 Group and Treasury share Transactions (applicable for accounting years beginning on or after 1 March 2007)
- IFRIC 12 Service Concession Arrangements (applicable for accounting years beginning on or after 1 January 2008)
- IFRIC 13 Customer Loyalty Programmes (applicable for accounting years beginning on or after 1 July 2008)
- IFRIC 14 ‘IAS 19—The limit on a defined benefit asset, minimum funding requirements and their interaction’ (applicable for accounting years beginning on or after 1 January 2008)
The directors anticipate that the adoption of these Standards and Interpretations in future periods will have no material impact on the financial statements of the Group in the period of initial application.
1.3.5. Summary of principal accounting policiesa. Basis of consolidation SubsidiariesThe consolidated financial statements include all the subsidiaries that are controlled by the Group. Control exists when IPTE has the power to govern the financial and operating policies and obtains the benefits from the entities activities. Control is presumed to exist when IPTE owns, directly or indirectly, more than 50 % of an entity’s voting rights of the share capital. The existence and effect of potential voting rights that are currently exercisable or convertible are considered when assessing whether the Group controls another entity.
Subsidiaries are fully consolidated from the date on which control is transferred to the Group. They are de-consolidated from the date that control ceases.
The purchase method of accounting is used to account for the acquisition of subsidiaries by the Group.The cost of an acquisition is measured at the fair value of the assets given, equity instruments issued and liabilities incurred or assumed at the date of exchange, plus costs directly

37
Annual report IPTE 2007Consolidated Financial Statements
attributable to the acquisition. Identifiable assets acquired and liabilities and contingent liabilities assumed in a business combination are measured initially at their fair values at the acquisition date, irrespective of the extent of any minority interest. The excess of the cost of acquisition over the fair value of the Group’s share of the identifiable net assets acquired is recorded as goodwill. If the cost of acquisition is less than the fair value of the net assets of the subsidiary acquired, the remaining difference after reassessment is recognised directly in the income statement.Intercompany transactions, balances and unrealised gains on transactions between group companies are eliminated. Unrealised losses are also eliminated unless the transaction provides evidence of an impairment of the asset transferred. Accounting policies of subsidiaries have been changed where necessary to ensure consistency with the policies adopted by the Group.
Minority interests in the net assets of consolidated subsidiaries are identified separately from the Group’s equity therein. Minority interests consist of the amount of those interests at the date of the original business combination (see below) and the minority’s share of changes in equity since the date of the combination. Losses applicable to the minority in excess of the minority’s interest in the subsidiary’s equity are allocated against the interests of the Group except to the extent that the minority has a binding obligation and is able to make an additional investment to cover the losses.
The Group applies a policy of treating transactions with minority interest as transactions with equity owners of the Group. For purchases from minority interest, the difference between any consideration paid and the relevant share acquired of the carrying value of the net assets of the subsidiary is deducted from equity. Gains or losses on disposals to minority interests are also recorded in equity. For disposals to minority interests, differences between any proceeds received and the relevant share of minority interest are also recorded in equity. Consequently, in case of an increase in ownership for an entity which was already controlled by the Group, the excess of the cost of acquisition over the fair value of the Group’s share of the identifiable net assets acquired is recorded against equity.
List of subsidiaries consolidated as of 31 December 2007
Entity Ownership interest2007 2006 2005
Integrated Production and Test Engineering NV
Parent company
Integrated Production and Test Engineering (UK) LTD
100 100 100
Integrated Production and Test Engineering GmbH
100 100 100
Integrated Production and Test Engineering Asia Pacific PTE LTD
100 80 80
Integrated Production and Test Engineering Nordic AB
100 100 100
Integrated Test Engineering Enterprises Inc.
100 100 100
Integrated Production and Test Engineering America LLC
100 87.2 87.2
Connect Systems Holding NV 100 100 100ConnectSystems NV 100 100 100Connectronics NV 100 100 100Connect Systems Nederland BV
100 100 100
ConnectSystems International NV
100 100 100
Connect Systems Slovakia spol. sro
100 100 100
Connectronics Romania SRL 100 100 100Connectronics GmbH 100 100 100Connectronics sro 100 100 -IPTE RF SA 100 100 100And-Elec SAS 100 100 100Antest SARL 100 100 52IPTE ASIA Holdings PTE LTD 100 100 100IPTE Industrial Automation (Shanghai) Co. LTD
100 100 100
Prodel Automation SARL 100 100 100Prodel Technologies SA 100 100 100Prodel USA Inc. 100 100 100IPTE Iberia – Automaçao Industrial LDA
100 100 100
IPTE Nordic Oy 100 - -

38
b. Foreign currency translationThe individual financial statements of each Group entity are presented in the currency of the primary economic environment in which the entity operates (its functional currency). For the purpose of the consolidated financial statements, the results and financial position of each entity are expressed in Euro, which is the functional currency of the Company, and the presentation currency for the consolidated financial statements.
Foreign currency transactionsForeign currency transactions are recognized initially at exchange rates prevailing at the date of the transactions. Subsequently, at closing, monetary assets and liabilities denominated in foreign currencies are translated at the balance sheet currency rate. Gains and losses resulting from the settlement of foreign currency transactions and from the translation of monetary assets and liabilities denominated in foreign currencies are included in the income statement as a financial result. Exchange differences arising on the retranslation of non-monetary items carried at fair value are included in profit or loss for the period except for differences arising on the retranslation of non-monetary items in respect of which gains and losses are recognised directly in equity. For such non-monetary items, any exchange component of that gain or loss is also recognised directly in equity.
Foreign entitiesIn consolidation, the assets and liabilities of the Group companies, using a different functional currency then the Euro, are expressed in Euro using exchange rates prevailing on the balance sheet date. Income and expense items are translated at the average exchange rates for the period. Exchange differences arising, if any, are classified in equity and transferred to the Group’s “Cumulative translation adjustment”. Such translation differences are recognised as income or as expenses in the period in which the entity is sold, disposed or liquidated. Exchange rates mentioned below have been used to consolidate foreign subsidiaries.
The year-end exchange rates (used to translate assets and liabilities in the financial statements) are as follows:
Date GBP/EUR
SGD/EUR
SEK/EUR
USD/EUR
CNY/EUR
RON/EUR
SKK/EUR
31 December 2007 1.364 0.473 0.106 0.679 0.093 0.277 0.03031 December 2006 1.489 0.495 0.111 0.759 0.097 0.296 0.02931 December 2005 1.459 0.510 0.107 0.848 0.105 0.272 0.026
The weighted average rates (used to translate revenues and expenses in the financial statements) are as follows:
Year GBP/EUR
SGD/EUR
SEK/EUR
USD/EUR
CNY/EUR
RON/EUR
SKK/EUR
2007 1.461 0.473 0.108 0.730 0.096 0.300 0.0302006 1.468 0.503 0.108 0.803 0.070 0.284 0.0272005 1.457 0.480 0.108 0.797 0.100 0.279 0.026
c. Intangible AssetsAcquired intangible assets Licences, patents, trademarks, similar rights and software are measured initially at cost. Intangible assets obtained in a business combination are initially measured at fair value. After initial recognition, intangible assets are carried at cost less accumulated amortisation and impairment losses. They are amortised on a straight-line basis over their estimated useful life which is not considered to exceed 5 years. At the end of each annual reporting period the amortisation method and period are reviewed.
Internally-generated intangible assets - research and development expenditureExpenditure on research activities, undertaken with the prospect of gaining new scientific or technical knowledge, is recognised in the income statement as an expense as incurred.
Costs incurred on development projects (relating to the design and testing of new or improved products) are recognised as intangible assets when the asset can be clearly identified, when the development costs can be measured reliably and to the extent that it is probable that the asset created will generate future economic benefits. Other development expenditures are recognised as an expense as incurred. Development cost previously recognised as an

39
Annual report IPTE 2007Consolidated Financial Statements
expense is not recognised as an asset in a subsequent period. Development costs that have been capitalised are amortised from the commencement of the commercial production of the product on a straight-line basis over the period of its expected benefit which normally does not exceed five years.
d. GoodwillGoodwill arises when the cost of a business combination at the date of acquisition is in excess of the Group’s share in the fair value of the identifiable assets, liabilities and contingent liabilities acquired. Goodwill is initially recognised as an asset at cost and is subsequently measured at cost less any accumulated impairment losses.
The cash-generating unit(s) to which the goodwill is allocated to is tested for impairment annually, and whenever there is an indication that it may be impaired, by comparing its carrying amount with its recoverable amount. If the recoverable amount of the cash-generating unit is less than the carrying amount of the unit, the impairment loss is allocated first to reduce the carrying amount of any goodwill allocated to the unit and then to the other assets of the unit pro-rata on the basis of the carrying amount of each asset in the unit. An impairment loss recognised for goodwill is not reversed in a subsequent period.
On disposal of a subsidiary or a jointly controlled entity, the attributable amount of goodwill is included in the determination of the profit or loss on disposal.
In case the fair value of the identifiable assets, liabilities and contingent liabilities exceeds the cost of the business combination, the excess remaining after reassessment is recognised immediately into profit and loss.
e. Property, plant and equipmentLand is carried at cost less accumulated impairment. All other property, plant and equipment are carried at cost less accumulated depreciation and impairment losses except for property, plant and equipment under construction which is carried at cost less accumulated impairment losses. Cost includes all directly attributable costs of bringing the asset
to working condition for its intended use. Depreciation is charged so as to write off the cost or valuation of assets, other than land and properties under construction, over their estimated useful lives, using the straight-line method to their estimated residual value. The depreciation is computed from the date the asset is ready to be used.The residual value and the useful life of an asset is reviewed at least at each financial year-end and, if expectations differ from previous estimates, the change(s) are be accounted for as a change in an accounting estimate in accordance with IAS 8 Accounting Policies, Changes in Accounting Estimates and Errors.
The following useful lives are applicable to the main property, plant and equipment categories:
Buildings 10-20 yearsMachinery and equipment 4-5 yearsFurniture and office equipment 5 yearsComputer equipment 3 yearsVehicles 3-5 years
Subsequent costs are included in the asset’s carrying amount or recognised as a separate asset, as appropriate, only when it is probable that future economic benefits associated with the item will flow to the Group and the cost of the item can be measured reliably. All other repairs and maintenance are charged to the income statement during the financial period in which they are incurred.
Borrowing costs directly attributable to the acquisition, construction or production of an asset requiring a long preparation are not included in the cost of this asset but are expenses as incurred.
f. LeasingLeases are classified as finance leases when the terms of the lease transfer substantially all the risks and rewards of ownership to the lessee. All other leases are classified as operating leases.

40
IPTE as lessee
Finance leasesAssets held under finance leases are recognised as assets of the Group at the lower of their fair value and the present value of the minimum lease payments less cumulative depreciation and impairment losses. The corresponding liability to the lessor is included in the balance sheet as obligations under finance leases. Lease payments are apportioned between finance charges and reduction of the lease obligation so as to achieve a constant rate of interest on the remaining balance of the liability. Finance charges are charged directly to profit or loss.
The depreciable amount of a leased asset is allocated to each accounting period during the period of expected use on a systematic basis consistent with the depreciation policy the lessee adopts for depreciable assets that are owned. If there is reasonable certainty that the lessee will obtain ownership by the end of the lease term, the period of expected use is the useful life of the asset; otherwise the asset is depreciated over the shorter of the lease term and its useful life. Operating leaseLease payments under an operating lease are charged to profit or loss on a straight-line basis over the term of the relevant lease. Benefits received and receivable as an incentive to enter into an operating lease are also spread on a straight-line basis over the lease term.
g. Borrowing costs All borrowing costs are expensed in the period in which they are incurred.
h. Impairment of tangible and intangible assets excluding goodwillAt each balance sheet date, the Group reviews the carrying amounts of its tangible and intangible assets to determine whether there is any indication that those assets have suffered an impairment loss. If any such indication exists, the recoverable amount of the asset is estimated in order to determine the extent of the impairment loss (if any). Where
it is not possible to estimate the recoverable amount of an individual asset, the Group estimates the recoverable amount of the cash-generating unit to which the asset belongs.
Recoverable amount is the higher of fair value less costs to sell and value in use. In assessing value in use, the estimated future cash flows are discounted to their present value using a pre-tax discount rate that reflects current market assessments of the time value of money and the risks specific to the asset.
If the recoverable amount of an asset (or cash-generating unit) is estimated to be less than its carrying amount, the carrying amount of the asset (cash-generating unit) is reduced to its recoverable amount. An impairment loss is recognised immediately in profit or loss.
i. InventoriesInventories are stated at the lower of cost and net realizable value.
Raw materials, consumables and goods purchased for resale are valued at the lower of their cost or their net realizable value. Cost is determined using the moving weighted average cost method. The cost of work in process and finished goods comprise all the costs of conversion and other costs incurred in bringing the inventories to their present location and condition. The conversion costs include the cost of production and the related fixed and variable production overhead costs. Net realizable value represents the estimated selling price less all estimated costs of completion and costs to be incurred in marketing, selling and distribution.
j. Financial instrumentsTrade receivablesTrade receivables are measured at initial recognition at fair value. Appropriate allowances for estimated irrecoverable amounts are recognised in profit or loss when there is objective evidence that the asset is impaired. The allowance recognised is measured as the difference between the asset’s carrying amount and the present value of estimated future cash flows discounted at the effective interest rate computed at initial recognition.
41
Annual report IPTE 2007Consolidated Financial Statements
InvestmentsInvestments are recognised and derecognised on a trade date basis where the purchase or sale of an investment is under a contract whose terms require delivery of the investment within the timeframe established by the market concerned, and are initially measured at fair value, plus directly attributable transaction costs.
At subsequent reporting dates, debt securities that the Group has the expressed intention and ability to hold to maturity (held-to-maturity debt securities) are measured at amortised cost using the effective interest rate method, less any impairment loss recognised to reflect irrecoverable amounts. An impairment loss is recognised in profit or loss when there is objective evidence that the asset is impaired, and is measured as the difference between the investment’s carrying amount and the present value of estimated future cash flows discounted at the effective interest rate computed at initial recognition. Impairment losses are reversed in subsequent periods when an increase in the investment’s recoverable amount can be related objectively to an event occurring after the impairment was recognised, subject to the restriction that the carrying amount of the investment at the date the impairment is reversed shall not exceed what the amortised cost would have been had the impairment not been recognised.
Investments other than held-to-maturity debt securities are classified as either investments held for trading or as available-for-sale, and are measured at subsequent reporting dates at fair value. Where securities are held for trading purposes, gains and losses arising from changes in fair value are included in profit or loss for the period. For available-for-sale investments, gains and losses arising from changes in fair value are recognised directly in equity, until the security is disposed of or is determined to be impaired, at which time the cumulative gain or loss previously recognised in equity is included in the profit or loss for the period. Impairment losses recognised in profit or loss for equity investments classified as available-for-sale are not subsequently reversed through profit or loss. Impairment losses recognised in profit or loss for debt instruments classified as available-for-sale are subsequently reversed if an increase in the fair value of the
instrument can be objectively related to an event occurring after the recognition of the impairment loss.
Cash and cash equivalentsCash and cash equivalents comprise cash on hand and demand deposits and other short-term highly liquid investments that are readily convertible to a known amount of cash and are subject to an insignificant risk of changes in value.
Financial liabilities and equityFinancial liabilities and equity instruments issued by the Group are classified according to the substance of the contractual arrangements entered into and the definitions of a financial liability and an equity instrument. An equity instrument is any contract that evidences a residual interest in the assets of the Group after deducting all of its liabilities. The accounting policies adopted for specific financial liabilities and equity instruments are set out below.
Bank borrowingsInterest-bearing bank loans and overdrafts are initially measured at fair value, and are subsequently measured at amortised cost, using the effective interest rate method. Any difference between the proceeds (net of transaction costs) and the settlement or redemption of borrowings is recognised over the term of the borrowings in accordance with the Group’s accounting policy for borrowing costs (see above).
Trade payablesTrade payables are initially measured at fair value, and are subsequently measured at amortised cost, using the effective interest rate method.
Equity instrumentsEquity instruments issued by the Company are recorded at the proceeds received, net of direct issue costs.
Treasury sharesTreasury shares are presented in the balance sheet as a deduction from equity. The acquisition of treasury shares is presented as a change in equity. No gain or loss is recognized in the income statement on the sale, issuance, or cancellation

42
of treasury shares. Consideration received on the sale of own shares is presented in the financial statements as a change in equity.
Derivative financial instrumentsThe Group uses derivative financial instruments to manage its exposure to the USD. The Group does not engage in pure speculative transactions nor does it issue or hold financial instruments for trading purposes. Derivatives are initially recorded at fair value and re-measured at the subsequent reporting dates.
Derivatives that do not qualify for hedge accountingThe changes in the fair value of derivatives which provide effective economic hedges under the Group’s risk Management policies, and which do not qualify for hedge accounting under the specific rules in IAS 39 are recognised immediately in the income statement.
Financial risk factorsThe financial risk of the Group is limited. However, fluctuations foreign currency exchange rates on foreign currency payables and receivables including inter-company loans are inherent risks in the performance of the business. The Group entities seek to minimize potential adverse effects on the financial performance from their local business. • Foreign Exchange risks: Due to the international character of the Group, we are
exposed to different foreign exchange risks arising from various currency exposures primarily with respect to USD, GBP and SGD. The Group uses derivatives to manage part of its exposure to the USD (see note 1.3.7. ac.)
• Credit risks: The Group has policies in place to monitor the credit risks
on customers. Except for one customer, who represents 33% of revenue in 2007, no significant concentration of risk exists. Customers are closely monitored. (see note 1.3.7 ac and note 1.3.7 b)
• Liquidity risks: Liquidity risk is linked to the evolution of our working
capital. The Group monitors the change in working capital through focused actions.
• Interest rate risk: The Group does not use derivative financial instruments to
manage its exposure to fluctuation in interest rates on their short-term loans. All loans are at commercial Belgian banks and are concluded based on EURIBOR + bankers margin.
k. Non-current assets held for saleNon-current assets and disposal groups are classified as held for sale if their carrying amount will be recovered through a sale transaction rather than through continuing use. This condition is regarded as met only when the sale is highly probable and the asset (or disposal group) is available for immediate sale in its present condition. Management must be committed to the sale, which should be expected to qualify for recognition as a completed sale within one year from the date of classification.Non-current assets (and disposal groups) classified as held for sale are measured at the lower of the assets’ previous carrying amount and fair value less costs to sell.
l. Government grantsGovernment grants are recognised when there is a reasonable assurance that: - the Group will comply with the conditions attached to them; - the grants will be received.
Government grants are recognised as income over the periods necessary to match them with the related costs which they are intended to compensate, on a systematic basis. A government grant that becomes receivable as compensation for expenses or losses already incurred or for the purpose of giving immediate financial support with no future related costs are recognised as income of the period in which it becomes receivable.
Government grants related to assets are presented as deferred income. Government grants related to income are presented as a deduction to the related expense.

43
Annual report IPTE 2007Consolidated Financial Statements
m. ProvisionsProvisions are recognised in the balance sheet when:
- there is a present obligation (legal or constructive) as a result of a past event;
- it is probable that an outflow of resources embodying economic benefits will be required to settle the obligation;
- a reliable estimate can be made of the amount of the obligation.
The amount recognised as a provision is the best estimate of the expenditure to settle the present obligation at the balance sheet date. Where the effect of the time value of money is material, the amount of a provision is the present value of the expenditure expected to be required to settle the obligation.
A restructuring provision is recognised when the Group has a detailed formal plan and has raised a valid expectation in those affected that it will carry out the restructuring by starting to implement that plan or announcing its main features to those affected by it.
WarrantyThe Group recognizes the estimated liability to repair or replace its products still under warranty at the balance sheet date. This provision is calculated based on the past history of the level of repairs and replacements.
Onerous contractsThe Group recognizes a provision for onerous contracts when the expected benefits to be derived from a contract are less than the unavoidable costs of meeting the obligations under the contract.
n. Revenue recognitionRevenue is recognised when it is probable that future economic benefits associated with the transaction will flow to the entity and that these benefits can be measured reliably.
Turnover is reported net of sales taxes and rebates.
Sale of goodsRevenue from sales of goods is recognised when: • The significant risks and rewards of the ownership of
goods is transferred to the buyer;• The Group retains neither continuing managerial
involvement to the degree usually associated with ownership nor effective control over the goods sold;
• The amount of revenue can be measured reliably;• It is probable that the economic benefits associated with
the transaction will flow to the entity; • The costs incurred or to be incurred in respect of the
transaction can be measured reliably.
Provisions for rebates and discounts are recorded as a reduction of revenue at the time the related revenues are recorded or when the incentives are offered.
Revenue from projectsRevenue from projects is recognised by reference to the stage of completion when the outcome of a transaction involving the project can be estimated reliably. When the outcome of the transaction involving the project cannot be estimated reliably, revenue is recognised only to the extent of the expenses recognised that are recoverable. In the period in which it is expected that the benefits to be derived from the project are less than the unavoidable costs of meeting the obligations under the project, the entire amount of the estimated ultimate loss is charged against income.
InterestInterest is recognised on a time proportion basis that takes into account the effective yield on the asset.
DividendsDividends are recognised when the shareholder’s right to receive the payment is established.
o. Income taxesThe income tax charge is based on the results for the year and includes current and deferred taxation. They are recorded in the income statement except when they relate to items directly recorded in equity, in which case they are directly recorded in equity.

44
Current tax is the amount of tax to pay based on the taxable profit of the period, as well as any adjustments relating to previous years. It is calculated using local tax rates adopted (or substantially enacted) at the closing date.
Deferred tax is recognised on differences between the carrying amounts of assets and liabilities in the financial statements and the corresponding tax bases used in the computation of taxable profit, and is accounted for using the balance sheet liability method. Deferred tax liabilities are generally recognised for all taxable temporary differences and deferred tax assets are recognised to the extent that it is probable that taxable profits will be available against which deductible temporary differences can be utilised. Such assets and liabilities are not recognised if the temporary difference arises from goodwill or from the initial recognition (other than in a business combination) of other assets and liabilities in a transaction that affects neither the taxable profit nor the accounting profit.
Deferred tax liabilities are recognised for taxable temporary differences arising on investments in subsidiaries and associates, and interests in joint ventures, except where the Group is able to control the reversal of the temporary difference and it is probable that the temporary difference will not reverse in the foreseeable future.
The carrying amount of deferred tax assets is reviewed at each balance sheet date and reduced to the extent that it is no longer probable that sufficient taxable profits will be available to allow all or part of the asset to be recovered.
Deferred tax is calculated at the tax rates that are expected to apply in the period when the liability is settled or the asset realised. Deferred tax is charged or credited to profit or loss, except when it relates to items charged or credited directly to equity, in which case the deferred tax is also dealt with in equity.
Deferred tax assets and liabilities are offset when there is a legally enforceable right to set off current tax assets against current tax liabilities and when they relate to income taxes levied by the same taxation authority and the Group intends
to settle its current tax assets and liabilities on a net basis.
p. Employee benefitsPension obligationsThe Group operates a number of defined contribution retirement benefit plans. Payments to defined contribution benefit plans are charged as an expense as they fall due.
Termination benefitsTermination benefits are payable when employment is terminated before the normal retirement date, or when an employee accepts voluntary redundancy in exchange for these benefits. The Group recognises termination benefits when it is demonstrably committed to either: terminating the employment of current employees according to a detailed formal plan without possibility of withdrawal; or providing termination benefits as a result of an offer made to encourage voluntary redundancy. Benefits falling due more than 12 months after balance sheet date are discounted to present value.
Profit-sharing and bonus plansThe Group recognises a liability and an expense for bonuses and profit-sharing, based on a formula that takes into consideration the profit attributable to the Company’s shareholders after certain adjustments. The Group recognises a provision where contractually obliged or where there is a past practice that has created a constructive obligation.
q. Segment reportingFor Management purposes the Group is organized on a worldwide basis into 2 major operating businesses: the “factory automation” business and the “contract manufacturing” business. The divisions are the basis upon which the Group reports its primary segment information. Financial information on business and geographical segments is presented in 1.3.7.z.

45
Annual report IPTE 2007Consolidated Financial Statements
1.3.6. Changes in organization
Acquisitions and disposalsOn 1 April 2006, IPTE NV acquired the remaining 48 % of the shares of Antest SARL for a cash consideration of EUR 702,952. The acquisition was financed with a 5 years repayable bank loan. The excess price over the fair value of the net assets acquired was EUR 238,033 and has been deducted from equity, in accordance with the accounting policies set out for an increase in interest in an entity for which the Group already had control. As of that date, IPTE NV owns 100 % of Antest SARL. On 5 December 2006 ConnectSystems NV acquired 100 % of the business share of a Czech shelf company for an amount of 200,000 CZK, which equaled the amount of its registered capital. On 1 January 2007 IPTE NV acquired 100 % of the assets of Barco business unit ‘surface mounting’ located in Poperinge (Belgium) and the assets of Barco business unit ‘surface mounting’ located in Kladno (Czech Republic). Both acquired activities are together the Barco surface mounting business. The net assets were acquired for a cash consideration of € EUR 15,387,595. This amount represented the fair value of the acquired assets. This acquisition was financed by additional credit lines received from IPTE’s bankers (KBC, ING and Fortis). The business was fully integrated into IPTE’s business starting January 1, 2007. We refer to note 1.3.7 y for additional information related to this business combination.
On 1 December 2007 the group acquired the remaining 20 % of the shares of IPTE Asia Pacific PTE LTD for a cash consideration of EUR 110,282. There was no excess price over the carrying amount of the net assets acquired. As of that date, IPTE NV owns 100 % of IPTE Asia Pacific PTE LTD
1.3.7. Notes
a. Cash and cash equivalents2007 2006 2005
Cash at bank and on hand
3,344,132 2,128,749 3,544,967
Cash equivalents 70,060 180,518 149,825Total 3,414,192 2,309,267 3,694,792
Cash equivalents are short-term, highly liquid investments that are readily convertible to known amounts of cash.
A part of the company’s cash balance as of 31 December 2007, 2006 and 2005 served as guarantee for straight loans and short-term commercial loans taken up with commercial banks. The restricted cash balance amounts to respectively approximately EUR 70,060 in 2007, EUR 140,377 in 2006 and EUR 268,785 in 2005.
b. Trade receivables - net2007 2006 2005
Trade receivables 53,788,916 35,483,082 26,849,866Allowance for doubtful accounts
(869,473) (701,973) (583,217)
Trade receivables (net) 52,919,443 34,781,109 26,266,649
The average credit period on sales is 68 days, 75 days and 74 days in 2007, 2006 and 2005 respectively. In event of overdue payment, IPTE shall have the right to levy interest at a rate of 1,5 % per month over the total amount overdue.
Credit risks arise from the possibility that customers may not be able to settle their obligations as agreed. To manage this risk, the Group periodically assesses the financial reliability of its customers. The group does not record general reserves for doubtful accounts but specific reserves are recorded in case indications exist that recoverability is doubtful. 10 customers account for approximately 35 %, 36 % and 61 % respectively of the Group net sales in 2005, 2006 and 2007. No other customer accounts for 2 % or more of the Group’s total net sales. The 10 highest amounts of trade receivables for a single customer account for approximately 38 %, 36 % and 43 % respectively of Group trade accounts receivable at December 31, 2005, 2006 and 2007 and there is no other significant concentration of credit risk.

46
Aging of receivables:
2007 Receivables not impaired
Impaired receivables
Total gross receivables
Current(not passed due)
46,451,511 - 46,451,511
1-30 3,471,960 - 3,471,960
31-60 1,528,909 - 1,528,90961-90 878,960 41,869 920,82991-180 508,258 665,632 1,173,890>180 - 241,817 241,817Total 52,839,598 949,318 53,788,916
2006 Receivables not impaired
Impaired receivables
Total gross receivables
Current 27,688,498 - 27,688,498
(not passed due)1-30 4,169,197 - 4,169,197
31-60 771,670 - 771,670
61-90 484,925 23,300 508,225
91-180 1,478,324 - 1,478,324
>180 111,467 755,701 867,168Total 34,704,081 779,001 35,483,082
2005 Receivables not impaired
Impaired receivables
Total gross receivables
Current 22,048,095 - 22,048,095
(not passed due)1-30 2,416,784 - 2,416,784
31-60 798,201 - 798,201
61-90 494,697 14,957 509,654
91-180 436,007 - 436,007
>180 - 641,125 641,125Total 26,193,784 656,082 26,849,866
The group does not have any other financial receivables which are past due.
Allowance for doubtful accounts:
Balance at December 31, 2004 561,720New impairment losses recognised on receivables
194,871
Amounts written off (used) during the year -Amounts reversed during the year (173,374)Balance at December 31, 2005 583,217New impairment losses recognised on receivables
180,207
Amounts written off (used) during the year -Amounts reversed during the year (61,451)Balance at December 31, 2006 701,973New impairment losses recognised on receivables
342,537
Amounts written off (used) during the year -Amounts reversed during the year (175,037)Balance at December 31, 2007 869,473
Total impairments recorded in the profit and loss statement amount 167,500 EUR and are recorded in the profit and loss statement as cost of sales. c.Otherreceivables
2007 2006 2005VAT receivables 772,554 717,352 410,168Income tax receivables 859,809 716,396 971,431Insurance - 298 2,264Capital grants - 145,915 317,943Credit notes to receive - 43,090 -Deferrals and accruals 849,592 709,603 715,221Other 383,528 62,951 121,894Net 2,865,483 2,395,578 2,538,922
d.Inventories2007 2006 2005
Raw materials and supplies, at cost
41,322,845 27,614,294 24,330,798
Work in progress, at cost
10,995,327 3,198,777 2,875,621
Finished goods, at cost 4,436,647 2,803,324 3,112,308Goods purchased for resale
- - -
Contracts in progress 1,264,307 3,647,734 1,283,517Reserve for obsolete inventories
(11,775,922) (8,349,805) (7,614,472)
Net 46,243,204 28,914,324 23,987,772

47
Annual report IPTE 2007Consolidated Financial Statements
e. Property, plant and equipment
Land and buildings
Machinery and equipment
Furniture and vehicles
Fixed asset under
construction
Total
Year ended December 2007
Acquisition value:Beginning of the period 12,456,812 14,234,725 6,255,065 22,645 32,969,247
Additions of the year 546,907 5,018,043 799,084 388,349 6,752,383
Acquisitions through business - 2,475,319 54,614 - 2,529,933
combinationsRetirements (2,820) (214,348) (280,431) - (497,599)
Transfers (64,365) 23,437 (25,394) (22,645) (88,967)
CTA (12,418) (136,173) (22,189) - (170,780)
End of the period 12,924,116 21,401,003 6,780,749 388,349 41,494,217
Accumulated depreciation:Beginning of the period 6,586,373 9,227,635 4,929,659 - 20,743,667
Additions of the year 608,826 2,881,396 612,786 - 4,103,008Retirements (2,820) (124,700) (167,970) - (295,490)Transfers (49,594) - (24,602) - (74,196)CTA (14,129) (43,701) (26,886) - (84,716)End of the period 7,128,656 11,940,630 5,322,987 - 24,392,273Net book value at December 2007 5,795,460 9,460,373 1,457,762 388,349 17,101,944
Land and buildings
Machinery and equipment
Furniture and vehicles
Fixed asset under
construction
Total
Year ended December 2006Acquisition value:Beginning of the period 12,313,158 13,489,536 6,260,502 17,187 32,080,383
Additions of the year 110,847 2,302,390 426,508 22,645 2,862,390
Retirements (2,805) (1,751,929) (275,715) - (2,030,449)
Transfers - 17,187 (164,194) (17,187) (164,194)
CTA 35,612 177,541 7,964 - 221,117
End of the period 12,456,812 14,234,725 6,255,065 22,645 32,969,247
Accumulated depreciation:Beginning of the period 6,003,734 9,361,252 4,715,793 - 20,080,779
Additions of the year 573,010 1,297,744 580,716 - 2,451,470
Retirements (1,542) (1,484,943) (221,485) - (1,707,970)
Transfers - - (145,143) - (145,143)
CTA 11,171 53,582 (222) - 64,531
End of the period 6,586,373 9,227,635 4,929,659 - 20,743,667Net book value at December 2006 5,870,439 5,007,090 1,325,406 22,645 12,225,580
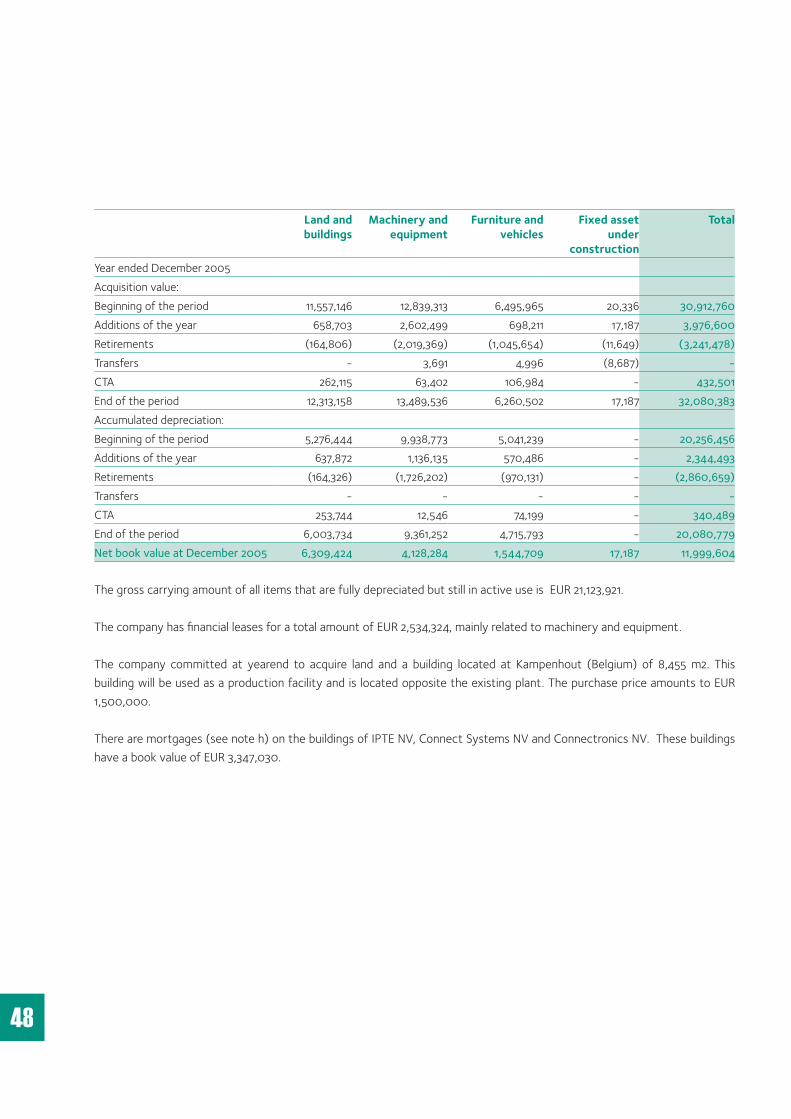
48
Land and buildings
Machinery and equipment
Furniture and vehicles
Fixed asset under
construction
Total
Year ended December 2005Acquisition value:Beginning of the period 11,557,146 12,839,313 6,495,965 20,336 30,912,760Additions of the year 658,703 2,602,499 698,211 17,187 3,976,600Retirements (164,806) (2,019,369) (1,045,654) (11,649) (3,241,478)Transfers - 3,691 4,996 (8,687) -CTA 262,115 63,402 106,984 - 432,501End of the period 12,313,158 13,489,536 6,260,502 17,187 32,080,383Accumulated depreciation:Beginning of the period 5,276,444 9,938,773 5,041,239 - 20,256,456Additions of the year 637,872 1,136,135 570,486 - 2,344,493Retirements (164,326) (1,726,202) (970,131) - (2,860,659)Transfers - - - - -CTA 253,744 12,546 74,199 - 340,489End of the period 6,003,734 9,361,252 4,715,793 - 20,080,779Net book value at December 2005 6,309,424 4,128,284 1,544,709 17,187 11,999,604 The gross carrying amount of all items that are fully depreciated but still in active use is EUR 21,123,921.
The company has financial leases for a total amount of EUR 2,534,324, mainly related to machinery and equipment.
The company committed at yearend to acquire land and a building located at Kampenhout (Belgium) of 8,455 m2. This building will be used as a production facility and is located opposite the existing plant. The purchase price amounts to EUR 1,500,000.
There are mortgages (see note h) on the buildings of IPTE NV, Connect Systems NV and Connectronics NV. These buildings have a book value of EUR 3,347,030.

49
Annual report IPTE 2007Consolidated Financial Statements
f. Intangible fixed assets
Development Costs
Licenses Goodwill Other Total
Year ended December 2007Acquisition value:Beginning of the period 866,828 926,040 269,778 270,209 2,332,855Additions of the year - 70,317 - 32,769 103,086Acquisitions through business - 4,391 - - 4,391combinationsRetirements - (943) - - (943)Transfers - - 64,365 24,602 88,967CTA (335) (2,709) - (73) (3,117)End of the period 866,493 997,096 334,143 327,507 2,525,239Accumulated amortization:Beginning of the period 866,828 756,596 269,778 218,183 2,111,385Additions of the year - 84,068 - 3,592 87,660Retirements - (943) - - (943)Transfers - - 49,594 24,602 74,196CTA (335) (1,053) - (73) (1,461)End of the period 866,493 838,668 319,372 246,304 2,270,837Net book value December 2007 0 158,428 14,771 81,203 254,402
Development Costs
Licenses Goodwill Other Total
Year ended December 2006Acquisition value:Beginning of the period 875,759 720,821 269,778 234,043 2,100,401Additions of the year - 93,069 - 5,729 98,798Retirements - (22,625) - - (22,625)Transfers (5,513) 139,189 - 30,518 164,194CTA (3,418) (4,414) - (81) (7,913)End of the period 866,828 926,040 269,778 270,209 2,332,855Accumulated amortization:Beginning of the period 867,230 533,984 269,778 175,855 1,846,847Additions of the year (3,021) 119,461 - 10,350 126,790Retirements - (6,578) - - (6,578)Transfers 2,988 110,098 - 32,057 145,143CTA (369) (369) - (79) (817)End of the period 866,828 756,596 269,778 218,183 2,111,385Net book value December 2006 0 169,444 0 52,026 221,470
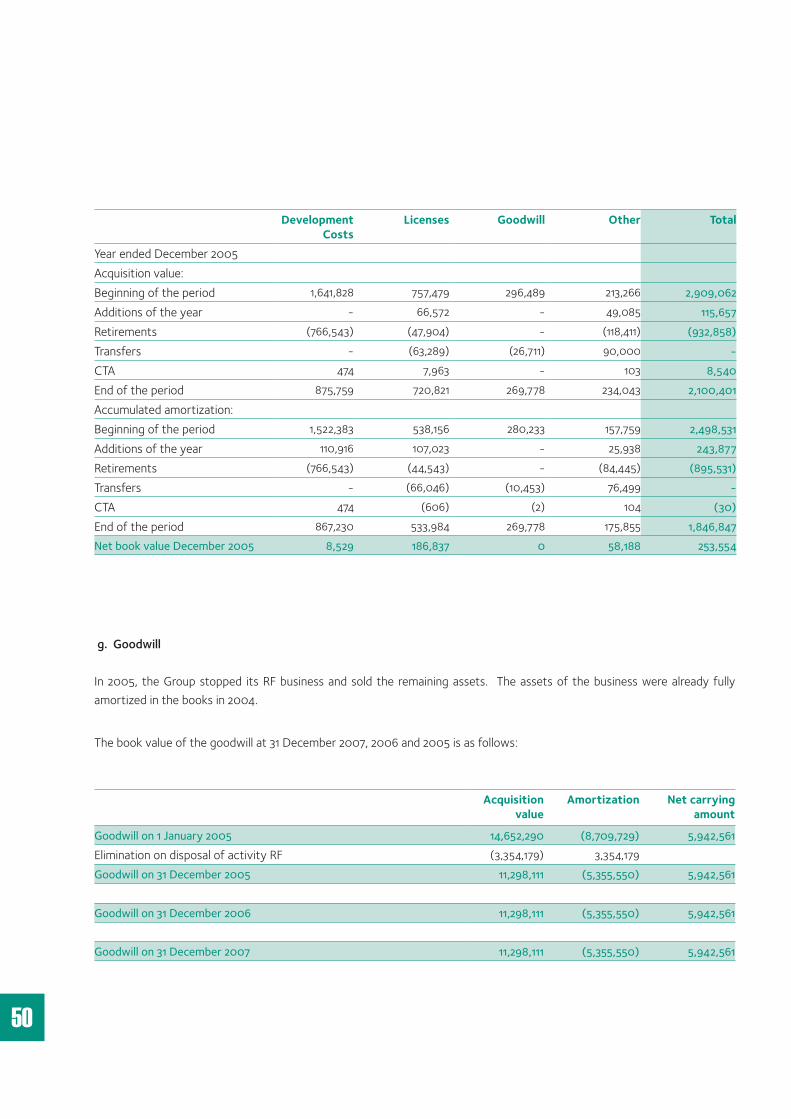
50
Development Costs
Licenses Goodwill Other Total
Year ended December 2005Acquisition value:Beginning of the period 1,641,828 757,479 296,489 213,266 2,909,062Additions of the year - 66,572 - 49,085 115,657Retirements (766,543) (47,904) - (118,411) (932,858)Transfers - (63,289) (26,711) 90,000 -CTA 474 7,963 - 103 8,540End of the period 875,759 720,821 269,778 234,043 2,100,401Accumulated amortization:Beginning of the period 1,522,383 538,156 280,233 157,759 2,498,531Additions of the year 110,916 107,023 - 25,938 243,877Retirements (766,543) (44,543) - (84,445) (895,531)Transfers - (66,046) (10,453) 76,499 -CTA 474 (606) (2) 104 (30)End of the period 867,230 533,984 269,778 175,855 1,846,847Net book value December 2005 8,529 186,837 0 58,188 253,554
g. Goodwill In 2005, the Group stopped its RF business and sold the remaining assets. The assets of the business were already fully amortized in the books in 2004.
The book value of the goodwill at 31 December 2007, 2006 and 2005 is as follows:
Acquisition value
Amortization Net carrying amount
Goodwill on 1 January 2005 14,652,290 (8,709,729) 5,942,561Elimination on disposal of activity RF (3,354,179) 3,354,179Goodwill on 31 December 2005 11,298,111 (5,355,550) 5,942,561
Goodwill on 31 December 2006 11,298,111 (5,355,550) 5,942,561
Goodwill on 31 December 2007 11,298,111 (5,355,550) 5,942,561

51
Annual report IPTE 2007Consolidated Financial Statements
The net goodwill as of 31 December 2007 is for EUR 4,648,712 allocated to the Connect Systems business and for EUR 1,293,849 to the AndElec/Antest business, part of Factory Automation. The Group tests goodwill annually for impairment or more, frequently if there are indications that goodwill might be impaired.The recoverable amounts of the cash generating units are determined from value in use calculations. The key assumptions for the value in use calculations are those regarding the discount rates, growth rates and expected changes to selling prices and direct costs during the period. Management estimates discount rates using pre-tax rates that reflect current market assessments of the time value of money and the risks specific to the cash generating units. The growth rates are based on industry growth forecasts. Changes in selling prices and direct costs are based on past practices and expectations of future changes in the market.The Group prepares cash flow forecasts derived from the most recent financial budgets approved by Management for the next 5 years and extrapolates cash flows for the following 3 years based on an estimated growth rate of 10 %. This rate does not exceed the average long-term growth rate for the relevant markets. The rate used to discount the forecast cash flows is 8 percent (pre-tax). h. Accrued expenses, payroll and related taxes anddeferredincome
2007 2006 2005Vacation pay accruals 3,267,638 2,463,686 2,315,704Other social debt 4,807,088 2,299,191 2,385,623VAT debt 726,626 503,442 248,561Income taxes 398,492 23,419 104,884Withholding taxes 91,727 45,183 8,583Accrued interests 313,791 145,986 36,818Deferred income 812,948 496,814 250,742Accrued expenses on projects
- - 10,391
Other 331,349 330,665 504,431Total 10,749,659 6,308,386 5,865,737
Accrued interests relate to interests on current bank loans and overdrafts.
i.Currentbankloansandoverdrafts
2007 2006 2005Secured 25,649,555 23,155,582 18,147,209
As of 31 December 2007 IPTE NV has credit lines for a total amount of EUR 48 million at different Belgian commercial banks and no credit lines at foreign banks. As of 31 December 2006 IPTE NV had credit lines for a total amount of EUR 30 million at different Belgian commercial banks and for EUR 5,6 million credit lines at foreign banks. As of December 31, 2005 IPTE NV had credit lines for a total amount of EUR 20 million at different Belgian commercial banks and for EUR 3 million credit lines at foreign banks. The credit lines at the foreign banks can only be used by the affiliate to whom the credit line is given. The credit lines given by the Belgian banks can be used by the Group as a whole. As of December 2007 EUR 25,649,555 of the credit lines at the Belgian commercial banks was used.As of 31 December 2006, EUR 23,155,582 of the credit lines at the Belgian commercial banks was used. As of 31 December 2005, EUR 18,147,209 of these credit lines at the Belgian commercial banks was used. All bank borrowings are in Euro. Average interest rate on credit lines is based on Euribor plus 1.25 % bankers margin.
To secure these loans at the Belgian commercial banks, following guarantees have been given as of 31 December 2007: - Mortgage on the building of IPTE NV (Genk), Connectronics
NV (Ieper) and Connect Systems NV(Kampenhout) each for EUR 785,860 at one financial institution, and EUR 550,000 at two other financial institutions;
- Pledge on the commercial funds of IPTE NV, Connect Systems NV, Connect Systems International NV and Connectronics NV for a total value of EUR 11,000,000 at one financial institution and EUR 5,500,000 at two other financial institutions;
– A proxy to mortgage the building of IPTE NV (Genk),

52
Connectronics NV (Ieper) and Connect Systems NV (Kampenhout) for EUR 1,100,000 at one financial institution, EUR 1.375.000 at two other financial institutions and EUR 250,000 at a forth financial institution;
– A proxy to pledge the commercial funds of IPTE NV, Connect Systems NV, Connect Systems International NV and Connectronics NV for a total value of EUR 8,800,000 at one financial institution, EUR 9,350,000 at two other financial institutions and EUR 3,300,000 at a forth financial institution.
All financial institutions obtained following guarantees in parity with their credit lines :
- A ‘Zessionsvertrag’ on IPTE GmbH;- A pledge on the inventories of IPTE GmbH;- A ‘Zessionsvertrag’ on Connectronics GmbH;- A pledge on the inventories of Connectronics GmbH;- A pledge on the receivables (amounting EUR 5,948,457
at December 31, 2007) and the inventories of Connect Systems Nederland BV;
- A pledge on the supply agreement with Barco NV.
Furthermore, the following bank covenants need to be respected on a consolidated level:a) A solvency ratio (*) of minimum 25 % at one financial institution; 22% at two other financial institutions as of December 31, 2007. The solvency ratio as of December 31, 2007 was reached. For 2008 and following the agreement stipulates a minimum solvency ratio of 30% at one financial institution, 25% at two other financial institutions.b) The consolidated cash flow (**) on a quarterly basis needs to be positive.
Both covenants were reached as of December 31, 2007 and management expects to comply with these covenants for the next 12 months.
In 2006 and 2005 the Group needed to respect a solvency ratio of 22% and 30% respectively, and to show a positive consolidated cash flow on a quarterly basis. In both years the Group met these covenants. (*) Defined as tangible equity / modified total balance sheet (tangible
equity = equity plus subordinated loan, less goodwill and intangible
assets, modified total balance sheet = total balance sheet - goodwill
and intangible assets, netting cash on bank with short term financial
debt, netting deferred taxes)
(**) Defined as net income of the consolidation period + depreciation on
fixed and intangible assets + amortization of goodwill
j. Long-term debt
2007 2006 2005Secured debt 6,094,906 2,458,884 3,441,717* Bank loans 2,577,878 2,378,247 3,400,692* Finance lease liabilities
3,517,02880,637 41,025
Unsecured debt - 7,200,000 7,000,000* Subordinated loan - 7,200,000 7,000,000Total long term debt 6,094,906 9,658,884 10,441,717Less current maturities (1,464,651) (7,848,765) (691,787)Long term portion 4,630,255 1,810,118 9,749,930
Breakdown of maturities:
The following tables detail the Group’s remaining contractual maturity for its financial liabilities. The tables have been drawn up based on undiscounted cash flows of financial liabilities based on the earliest date on which the Group can be required to pay. The table includes both interest and principal cash flows.

53
Annual report IPTE 2007Consolidated Financial Statements
2007 Bankloans Repayment
BankloansInterest
payments
Total
2009 489,808 104,094 593,902
2010 382,352 79,255 461,607
2011 268,903 59,162 328,065
2012 220,460 44,748 265,208
2013 211,852 31,736 243,588
Beyond 2013 340,885 28,011 369,069
Finance lease payments
Finance lease Interest
payments
Total
2009 783,990 136,865 920,855
2010 779,431 89,287 868,718
2011 751,762 39,812 791,574
2012 400,812 12,647 413,459
2013 0 0 0
Beyond 2013 0 0 0
2006 Bankloans Repayment
BankloansInterest
payments
Total
2008 440,519 90,625 531,144
2009 277,619 67,542 345,161
2010 248,246 52,994 301,240
2011 217,375 39,986 257,361
2012 173,868 28,596 202,464
Beyond 2012 371,854 37,064 408,918
Finance lease payments
Finance lease Interest
payments
Total
2008 37,516 5,475 42,991
2009 20,253 3,297 23,550
2010 15,694 1,829 17,523
2011 7,174 574 7,748
2012 0 0 0
Beyond 2012 0 0 0
2005 Bankloans Repayment
BankloansInterest
payments
Total
2007 641,326 695,445 1,336,771
2008 7,815,846 570,046 8,385,892
2009 269,351 62,587 331,938
2010 239,002 49,119 288,121
2011 197,659 37,169 234,828
Beyond 2011 545,721 65,660 611,381
Finance lease payments
Finance lease Interest
payments
Total
2007 18,233 1,908 20,141
2008 18,233 847 19,080
2009 4,559 212 4,771
2010 0 0 0
2011 0 0 0
Beyond 2011 0 0 0
Long-term debts are in Euro. Average interest rate on long-term bank loans is quarterly revised based on Euribor 3 month plus 1,25 % bankers margin. There is no material difference between the book value and the fair value of the long-term debts.
The long term bankloans are secured with a mortgage on the building of IPTE NV (Genk), Connectronics NV (Ieper) and Connect Systems NV (Kampenhout) respectively for € 2,207,000, € 587,000 and € 483,391 at a Belgian commercial bank.
The company concluded a financing agreement with the Limburgse Reconversie Maatschappij and the company’s Management for a total amount of EUR 7 million of which EUR 3,500,000 was granted in 2003 and EUR 3,500,000 was granted in 2004. This agreement was concluded at 13 March 2003 and executed by the General Shareholders Assemblies of 18 April 2003 and 16 April 2004. This financing comprehends an interest bearing subordinated loan and warrants. The duration for the loan was 5 years and the warrants could be exercised at a rate of EUR 4.8.3.5 million of the interest bearing loan was given with a start

54
date 18 April 2003 and with maturity 28 April 2008 and 3.5 million of the interest bearing loan was given with a start date 20 December 2004 and with maturity 20 December 2009. 1,458,332 warrants B1 and B2 were created. All these warrants B1 and B2 were granted to LRM NV and Management members (1,250,000 warrants to LRM NV and 208,332 to Management members). The warrants have the same duration as the subordinated loans.
On 6 December 2006 the company signed an irrevocable agreement with LRM NV and Management that:- LRM NV and Management irrevocably commit to execute
all warrants (1,458,332) before 10 October 2007;- IPTE commits to repay the outstanding loans to LRM NV
and Management (EUR 7,000,000) at the same date.
In October 2007, this agreement was executed. All warrants were converted into shares. The loan was fully repaid and equity was increased with EUR 6,999,994. After the conversion the number of shares equals 6,934,424.
k. Provisions
Provisions have been presented as current liabilities as of 31 December 2005, 2006 and 2007 as the costs are expected to be incurred in the next accounting year (see table at bottom of page).
Warranty provisionsThe company and its affiliated companies grant a warranty of 1 year on products and projects sold. For expected warranty claims the company has set up a total reserve of EUR 386,551 as of 31 December 2007, EUR 390,300 as of 31
December 2006 and EUR 520,781 as of 31 December 2005. This estimate is based on historical warranty costs and based on the assumption that warranty costs will remain at this same level. Over the last years the company did not incur any significant warranty claims.
Other provisionsOther provisions should cover risks and contractual commitments existing at balance sheet date,mainly relating to completed projects. This estimate is based on a project analysis basis.In 2005 the company finalised a dispute with a government for which a provision of EUR 453,947 was set up in 2000. As no costs were incurred, the provision of EUR 453,947 was fully reversed in 2005.
l. Other liabilities
2007 2006 2005Advances received on contracts in progress
3,777,522 2,186,298 1,250,176
Fair value of financial instruments
601,123 - -
Other 328,877 543,794 782,766Net 4,707,522 2,730,092 2,032,942
The company concluded US Dollar option contracts against EUR based on the estimated Dollar requirements for 2008. In total, for 20,460,000 US dollars, option contracts were signed with Belgian commercial banks, equally spread over the year. Conditions of these contracts are exchange rates EUR/USD of 1.40 – 1.50, knock-in of 1.50 and strike
Warranty Restructuring Other TotalBalance at 31 December 2005 520,781 50,000 1,770,999 2,341,780New provisions recorded in 2006 355,522 - 842,212 1,197,734
Provisions used in 2006 (433,902) (50,000) (1,333,031) (1,816,933)
Provisions reversed in 2006 (52,101) - (314,272) (366,373)Balance at 31 December 2006 390,300 0 965,908 1,356,208New provisions recorded in 2007 548,439 - 2,292,913 2,841,352
Provisions used in 2007 (312,424) - (1,474,960) (1,787,384)
Provisions reversed in 2007 (239,764) - (154,028) (393,792)Balance at 31 December 2007 386,551 0 1,629,833 2,016,384

55
Annual report IPTE 2007Consolidated Financial Statements
of 1.40. The group also has forward contracts to buy US dollar 3,000,000 at EUR/USD rates between 1.3923 and 1.3964. At yearend, the company recorded an unrealised financial loss of 601,123 Euro based on the market to market valuation of these contracts.
m. Shareholders’ equity and rights attached to the shares
As of 31 December 2007 the common stock consisted of 6,934,424 issued and outstanding ordinary shares without face value.
Each holder of shares is entitled to one vote per share, without prejudice to specific restrictions on the shareholders’ voting rights in the company’s Articles of Association and Belgian Company Laws, including restrictions for non-voting shares and the suspension or cancellation of voting rights for shares which have not been fully paid up at the request of the Board of Directors.
Under Belgian Company Laws, the shareholders decide on the distribution of profits at the annual shareholders’ meeting, based on the latest audited accounts of the company. Dividends may be paid in cash or in kind.
In 2000, the company gave its personnel the possibility to subscribe to a maximum of 200,000 warrants. In total 182,850 warrants were subscribed by employees, each giving the right to purchase IPTE NV shares at a price of EUR 20. Each warrant gives the right to subscribe to one new share. The warrants are granted for a period of 10 years and can be executed at the earliest in 2004. The execution of such warrants will lead to a dilution of existing shareholders. Nothing is recognized in the financial statements.
In April 2003, the company concluded a financing agreement with LRM NV and the company’s Management for a total amount of EUR 7 million. This agreement was concluded at 13 March 2003 and executed by the General Shareholders Assembly of 18 April 2003. This financing comprehends an interest bearing subordinated loan and warrants. The
duration for the loan is 5 years and the warrants can be exercised at a rate of EUR 4.8.During the shareholders meeting, 1,458,332 warrants B1 and B2 were created. All these warrants B1 and B2 were granted to LRM NV and Management members (1,250,000 warrants to LRM NV and 208,332 to Management members) who provided in total subordinated loans of EUR 7,000,000.
In October 2007, the agreement was executed. The loan of EUR 7,000,000 was fully repaid, the warrants were converted into shares and equity was increased with EUR 6,999,945.
The Group’s objectives when managing capital are:- to safeguard the entity’s ability to continue as a going
concern, so that it can continue to provide returns for shareholders and benefits for other stakeholders;
- to provide the capital allowing to continue the growth strategy of the group;
- to provide an adequate return to shareholders by pricing products and services commensurately with the level of risk.
The Group sets the amount of capital in proportion to risk. The Group manages the capital structure and makes adjustments to it in the light of changes in economic conditions and the risk characteristics of the underlying assets. In order to maintain or adjust the capital structure, the Group may adjust the amount of dividend paid to shareholders, return capital to shareholders, issue new shares, or sell assets to reduce debt.
The Group monitors capital on the basis of financial debt-to-adjusted capital ratio. This ratio is calculated as net financial debt – adjusted capital. Net financial debt is calculated as total financial debt, less cash and cash equivalents. Adjusted capital comprises all components of equity (ie. share capital, share premium, minority interest, retained earnings and revaluation reserve) other than amounts accumulated in equity relating to cash flow hedges, and includes some forms of subordinate debt.
During 2007, the Group’s strategy, which was unchanged from 2006 was to maintain the debt-to-adjusted capital

56
ratio, in order to secure access to finance at a reasonable cost . The debt-to-adjusted-capital ratios at December 31, 2007 , 2006 and 2005 were as follows:
2007 2006 2005Total financial debt 31,744,461 25,814,465 21,588,926Less cash and cash equivalents
(3,414,192) (2,309,267) (3,694,792)
Net financial debt 28,330,269 23,505,198 17,894,134Total equity 41,655,478 23,920,274 22,894,349Add subordinated loan
- 7,000,000 7,000,000
Adjusted capital 41,655,478 30,920,274 29,894,349
Net financial debt to adjusted capital ratio
0.68 0.76 0.60
The decrease in the financial debt-to-adjusted capital ratio during 2007 resulted primarily from the strong results posted in 2007, partially offset by the additional financing requirements as a result of the acquisition of the Barco surface mounting business and the investments of the year.
n.Deferredtaxes
Deferred tax arises in the following circumstances:- Intangible fixed assets: accelerated tax depreciations
lead to tax bases lower than the carrying amounts;- Property, plant and equipment: accelerated tax
depreciations lead to tax bases lower than the carrying amounts;
- Inventories may have carrying amounts higher than the fiscal accepted value resulting from the completed contract method in the fiscal books;
- Provisions recorded in the financial statements which are disallowed for fiscal reasons in local books;
- Companies reporting losses: deferred tax assets are recognized when it is probable that sufficient taxable profits will be available against which the deferred tax assets can be utilized.
The Group has unrecognized tax losses of EUR 23,932,000, EUR 35,436,000 and EUR 36,774,000 respectively at 31 December 2007, 2006 and 2005 with no expiry date resulting in tax assets not recognized for EUR 7,180,000 EUR 10,630,000 and EUR 10,117,000 as at 31 December 2007, 2006 and 2005.
Balance at December
2007
Taxes in result of
2007
Balance at December
2006
Taxes in result of
2006
Balance at December
2005
Taxes in result of
2005
Balance at December
2004Deferred tax assets 2,452,927 1,453,027 999,900 98,347 901,553 (13,447) 915,000 - Research costs - (31,191) 31,191 (58,140) 89,331 (77,669) 167,000
- Inventories 38,360 38,360 - - - - -
- Losses consolidated companies
2,077,465 1,258,305 819,160 216,250 602,910 (145,090) 748,000
- Notional interest deduction 220,000 220,000 - - - - -
- Other provisions 117,102 32,447 149,549 (59,763) 209,312 (209,312) -Deferred tax liabilities (952,927) 46,973 (999,900) (98,347) (901,553) 13,447 (915,000) - Tangible fixed assets (353,096) (7,796) (345,300) 18,973 (364,273) 19,727 (384,000)
- Inventories (599,831) 54,769 (654,600) (117,320) (537,280) (6,280) (531,000)
- Other - - - - - - -Net deferred income tax expense/(income) 1,500,000 1,500,000 - - - - -
Net deferred tax assets 1,615,333 - 999,900 - 901,553 - 915,000Net deferred tax liabilities (115,333) - (999,900) - (901,553) - (915,000)
Components of deferred tax assets and liabilities are as follows:
57
Annual report IPTE 2007Consolidated Financial Statements
Temporary differences on investments in subsidiaries (undistributed earnings) were approximately EUR 45,994,000, EUR 41,371,000 and EUR 43,700,000 respectively at 31 December 2007, 2006 and 2005. Since it is the intention of the company to indefinitely reinvest these earnings, no deferred tax liability has been provided.
o. Revenue recognitionThe company recognizes revenue from projects by reference to the stage of completion when this can be measured by reference to labour hours incurred to date as a percentage of total estimated hours for the contract. When the outcome of the project cannot be measured reliably, revenue is recognized only to the extent of the expenses recognized that are recoverable. In the period in which it is determined that the loss will result from the performance of the contract, the entire amount of the estimated ultimate loss is charged against income.
Sales include EUR 11,668,393 contract revenue, arising from projects not completed, recognized as revenue in 2007. This has been booked against trade receivables for EUR 6,335,121 for the amounts not billed and against advances for EUR 5,333,272 for the part already billed to customers. The cost of sales recognized on these not completed projects amounts to EUR 7,010,871.
Sales include EUR 8,416,800 contract revenue, arising from projects not completed, recognized as revenue in 2006. This has been booked against trade receivables for EUR 2,442,804 for the amounts not billed and against advances for EUR 5,973,996 for the part already billed to customers. The cost of sales recognized on these not completed projects amounts to EUR 5,077,970.
Sales include EUR 5,430,087 contract revenue, arising from projects not completed, recognized as revenue in 2005. This has been booked against trade receivables for EUR 2,167,391 for the amounts not billed and against advances for EUR 3,262,696 for the part already billed to customers. The cost of sales recognized on these not completed projects amounts to EUR 2,754,013.
p. Cost of sales 2007 2006 2005
Purchases of material 161,440,990 78,790,297 67,867,814Personnel expenses 38,397,971 26,041,418 24,424,147
Depreciation/amortization
3,457,469 1,999,650 1,842,202
Investment grants (1,692) 20,445 (7,185)Repair and maintenance
1,303,808 607,944 650,846
Other 3,797,588 2,457,675 3,107,565Total 208,396,134 109,917,429 97,885,389
q. Research and development expenses 2007 2006 2005
Personnel expenses 7,102,389 5,474,602 5,067,793
Depreciation/amortization
219,585 258,428 261,346
Investment grants (1,692) 30,363 (10,669)
Other 470,641 491,938 483,211Total 7,790,923 6,255,331 5,801,681 r. General and administrative expenses
2007 2006 2005Personnel expenses 8,269,363 5,767,516 5,764,000
Depreciation/amortization
426,434 221,422 366,865
Investment grants (5,828) 8,055 (2,830)
Professional and Directors fees
2,463,354 1,675,051 1,464,376
Other 2,737,411 1,462,246 1,164,454Total 13,890,734 9,134,290 8,756,865
Other G&A expenses mainly include various office supplies, IT and communication services and supplies as well as general taxes such as real estate taxes and community taxes. The increase can be explained by the increase in activities.

58
s. Selling expenses 2007 2006 2005
Personnel expenses 8,215,102 6,067,828 5,195,759Representation and travel expenses
1,649,406 1,508,977 1,359,346
Publicity 442,159 288,078 269,898Depreciation/amortization
87,180 98,760 117,957
Investment grants (188) 3,099 (1,089)Transportation costs 994,517 693,243 1,793,328Fair, exhibitions and other
1,500,642 1,225,518 1,275,323
Total 12,888,818 9,885,503 10,010,522
t. Personnel expenses and average number of employees
2007 2006 2005Wages and salaries 58,578,923 41,071,346 38,290,371Insurance 835,543 743,339 587,087Other 2,570,359 1,536,679 1,574,241Total 61,984,825 43,351,364 40,451,699
The average number of employees was 2,274 in 2007, 1,630 in 2006 and 1,434 in 2005. The main reasons for the increase in the number of employees was the business growth of 85 % in 2007 compared to 2006 (including the Barco Surface mounting business counting for 400 headcounts at the start in January 2007), the personnel increase in China and further growth in the contract manufacturing division in 2007 and the expansion of the Connect business in Romania in 2007.
Defined contribution plansThe company provides defined contribution plans for some employees. The plan provides for contributions ranging from 2 % to 8 % of the salary. These contributions, partly paid by the employer and partly paid by the employee, are calculated by an insurance company and the costs are charged to income statement in the year to which they relate. Defined contribution costs were EUR 439,349, EUR 342,765 and EUR 291,332 as of 31 December 2007, 2006 and 2005 respectively.
u. Depreciation charges and amortization2007 2006 2005
Property, plant and equipment
4,103,008 2,451,470 2,344,493
Cost of sales 3,369,809 1,872,860 1,598,325
General and administration costs
426,434 221,422 366,865
Selling expenses 87,180 98,760 117,957
Research and development costs
219,585 258,428 261,346
Intangible fixed assets
87,660 126,790 243,877
Cost of sales 87,660 126,790 243,877Total depreciation charges
4,190,668 2,578,260 2,588,370
v. Financial results2007 2006 2005
Interest income 5,761 63,016 24,943Exchange differences 914,544 492,448 412,695Gain on derecogni-tion of modified subordinated loan (see note j.)
- 486,000 -
Other 181,737 - -Total financial income
1,102,042 1,041,464 437,638
Interest charges 2,419,455 2,095,121 1,756,496Bank charges 250,972 159,006 158,002Exchange differences 556,718 163,934 563,773Change in fair value derivative financial instruments
601,123 - -
Total financial charges
3,828,268 2,418,061 (2,478,271)
Net financial results (2,726,226) (1,376,597) (2,040,633)
The interest charges in 2007 include EUR 227,913 interests on the subordinated loans (EUR 857,387 in 2006). In December 2006, the subordinated loan agreement was renegotiated resulting in a financial income of EUR 486,000 for 2006 (see note i.).
The company accounted for the change in fair value of its US Dollar hedge option contracts based on the market to market valuation of these contracts as at yearend.
59
Annual report IPTE 2007Consolidated Financial Statements
w. Income taxes Income taxes are calculated on the basis of the taxable profit of the individual companies included in the consolidation. The company recognizes deferred taxes according to IAS 12.
Based on the requirements of IAS 12, the company has concluded not to recognize a net deferred tax assets on the losses carried forward except for the loss of the parent company IPTE NV.
2007 2006 2005Income taxes of the current year
57,000 177,107 266,129
Income taxes of the prior year
261,190 (43,472) (278,272)
Deferred tax expense/(income)
(1,500,000) - -
Total (1,181,810) 133,633 (12,143)
The reconciliation of the effective tax rate to the statutory tax rate is as follows:
2007 2006 2005Profit/(loss) before taxes
9,700,871 2,016,431 2,156,118
Effect of companies reporting losses
1,634,000 4,633,000 3,214,000
Use of tax losses to offset current year’s profits
(8,177,524) (2,861,105) (2,172,118)
Notional interest deduction
(964,490) (1,285,326) -
Non taxable income/expenses
(2,030,000) (2,030,000) (2,330,000)
Taxable profit 162,857 473,000 778,000Income taxes 57,000 177,107 266,129In % 35% 37.4 % 34.2 %
The deferred taxes recognized in the balance sheet are the result of timing differences in the recognition of income and expenses in the annual report on one hand and the fiscal books on the other hand.
x. Earnings per shareBasic earnings per share are calculated by dividing the net profit for the period attributable to ordinary shareholders by the weighted average number of ordinary shares outstanding during the period. On 3 March 2000 the Extraordinary General Assembly of Shareholders decided to split each share into 2000, which brings the total amount of shares up to 4,000,000. The earnings per share after the split shows the net profit for the period attributable to ordinary shareholders divided by the number of shares being 4,000,000 shares. The company increased the number of shares with 1,476,092 at the occasion of the capital increase and the public offering in May 2000. The earnings per share as of 31 December 2002 show the net profit for the period attributable to ordinary shareholders divided by 5,476,092 shares.
The Extraordinary General Assembly of Shareholders of 3 March 2000 has decided to grant 200,000 warrants ‘B’ to personnel members. In total 182,850 warrants were granted for a period of 10 years and can be exercised in 2004 at the earliest. The exercise of such warrants will lead to a dilution of existing shareholders.
During the shareholders meeting of 18 April 2003, 1,458,332 warrants B1/B2 were created. All these warrants B1/B2 were granted to LRM NV and Management members (1,250,000 warrants to LRM NV and 208,332 to Management members) who provided in total subordinated loans of EUR 7,000,000 (EUR 3,500,000 in April 2003 and EUR 3,500,000 in December 2004).
In October 2007, the subordinated loan was repaid. During the Extraordinary Shareholders meeting of 10 October 2007 the 1,458,332 warrants were exercised resulting in the same number of additional shares. This brings the total number of shares to 6,934,424.
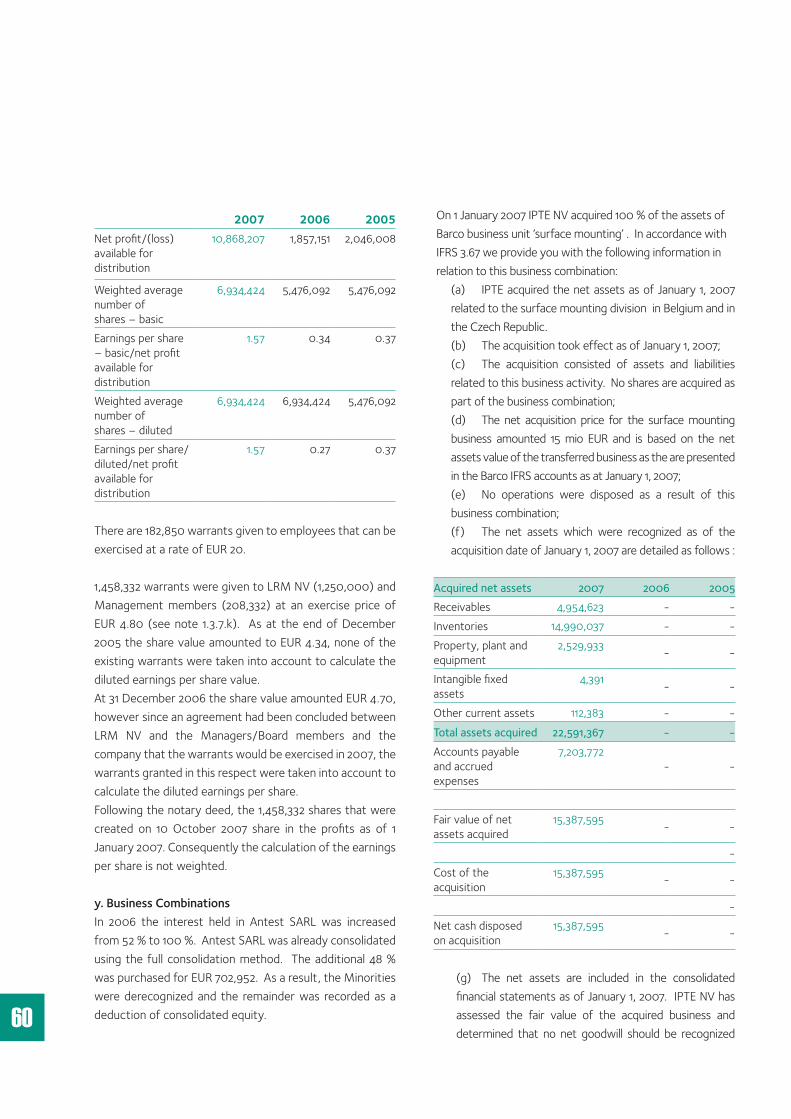
60
2007 2006 2005Net profit/(loss) available for distribution
10,868,207 1,857,151 2,046,008
Weighted average number of shares – basic
6,934,424 5,476,092 5,476,092
Earnings per share – basic/net profit available for distribution
1.57 0.34 0.37
Weighted average number of shares – diluted
6,934,424 6,934,424 5,476,092
Earnings per share/diluted/net profit available for distribution
1.57 0.27 0.37
There are 182,850 warrants given to employees that can be exercised at a rate of EUR 20.
1,458,332 warrants were given to LRM NV (1,250,000) and Management members (208,332) at an exercise price of EUR 4.80 (see note 1.3.7.k). As at the end of December 2005 the share value amounted to EUR 4.34, none of the existing warrants were taken into account to calculate the diluted earnings per share value. At 31 December 2006 the share value amounted EUR 4.70, however since an agreement had been concluded between LRM NV and the Managers/Board members and the company that the warrants would be exercised in 2007, the warrants granted in this respect were taken into account to calculate the diluted earnings per share.Following the notary deed, the 1,458,332 shares that were created on 10 October 2007 share in the profits as of 1 January 2007. Consequently the calculation of the earnings per share is not weighted.
y. Business CombinationsIn 2006 the interest held in Antest SARL was increased from 52 % to 100 %. Antest SARL was already consolidated using the full consolidation method. The additional 48 % was purchased for EUR 702,952. As a result, the Minorities were derecognized and the remainder was recorded as a deduction of consolidated equity.
On 1 January 2007 IPTE NV acquired 100 % of the assets ofBarco business unit ‘surface mounting’ . In accordance withIFRS 3.67 we provide you with the following information inrelation to this business combination: (a) IPTE acquired the net assets as of January 1, 2007
related to the surface mounting division in Belgium and in the Czech Republic.
(b) The acquisition took effect as of January 1, 2007; (c) The acquisition consisted of assets and liabilities
related to this business activity. No shares are acquired as part of the business combination;
(d) The net acquisition price for the surface mounting business amounted 15 mio EUR and is based on the net assets value of the transferred business as the are presented in the Barco IFRS accounts as at January 1, 2007;
(e) No operations were disposed as a result of this business combination;
(f) The net assets which were recognized as of the acquisition date of January 1, 2007 are detailed as follows :
Acquired net assets 2007 2006 2005Receivables 4,954,623 - -Inventories 14,990,037 - -Property, plant and equipment
2,529,933 - -
Intangible fixed assets
4,391 - -
Other current assets 112,383 - -Total assets acquired 22,591,367 - -Accounts payable and accrued expenses
7,203,772- -
Fair value of net assets acquired
15,387,595 - -
-Cost of the acquisition
15,387,595 - -
-Net cash disposed on acquisition
15,387,595 - -
(g) The net assets are included in the consolidated financial statements as of January 1, 2007. IPTE NV has assessed the fair value of the acquired business and determined that no net goodwill should be recognized

61
Annual report IPTE 2007Consolidated Financial Statements
on the combination, nor were any other intangible assets recognized based on a sensitivity analysis made by management;
(h) The income statement per December 31, 2007 includes all results of the operations as of January 1, 2007 related to the acquired business. Revenue related to the business combination is 85 mio EUR. The resulting operating profit and net profit recognized in 2007 are similar to the existing Contract Manufacturing business.
In 2007 the Group increased its ownerschip in IPTE AsiaPacific Ltd from 80% to 100%. The purchase occurred for EUR 110,282 which corresponded to the value of the minority.Furthermore the Group acquired the remaining 12,8% in IPTELLC for EUR 1. No minorities were recognized on thissubsidiary.
As of December 2007 the Group holds 100% in all its subsidiaries.We refer to note 1.3.7. ad Commitments for Business Combinations that have been executed subsequent to December 31, 2007.
z. Segment reporting
Segment information is prepared on the following bases:
A. Business segmentsThe activities of the Group are divided into 2 business segments, on one hand the “factory automation” business and on the other hand the “contract manufacturing” business.
The income statements for the factory automation segment are as follows (before amortization of goodwill):2007 In % 2006 In % 2005 In %
Sales 60,207,429 100 50,178,842 100 48,076,131 100Cost of sales (42,204,761) (70.1) (33,627,723) (67.0) (33,443,749) (69.6)Gross margin 18,002,668 29.9 16,551,119 33.0 14,632,382 30.4Research and development expenses
(6,438,999) (10.7) (5,443,889) (10.8) (5,068,356) (10.5)
General and administrative expenses
(6,187,218) (10.3) (5,755,341) (11.5) (5,129,738) (10.6)
Selling expenses (5,239,389) (8.7) (5,172,642) (10.3) (4,847,252) (10.0)Other income (expense) net 410,403 0.7 533,149 1.0 768,476 1.6Operating income (before amortization of goodwill) 547,465 0.9 712,396 1.4 355,512 0.7
The income statements for the contract manufacturing segment are as follows (before amortization of goodwill):
2007 In % 2006 In % 2005 In %Sales 195,312,137 100 88,387,444 100 78,856,801 100Cost of sales (166,548,100) (85.3) (76,670,300) (86.7) (64,712,375) (82.1)Gross margin 28,764,037 14.7 11,717,144 13.3 14,144,426 17.9Research and development expenses
(1,351,925) (0.7) (811,442) (0.9) (733,324) (0.9)
General and administrative expenses
(7,997,536) (4.1) (3,799,000) (4.3) (3,627,128) (4.6)
Selling expenses (7,671,578) (3.9) (4,733,260) (5.4) (5,163,278) (6.5)Other income (expense) net 136,636 0.1 307,190 0.3 (779,457) (0.9)Operating income (before amortization of goodwill) 11,879,634 6.1 2,680,632 3.0 3,841,239 4.9
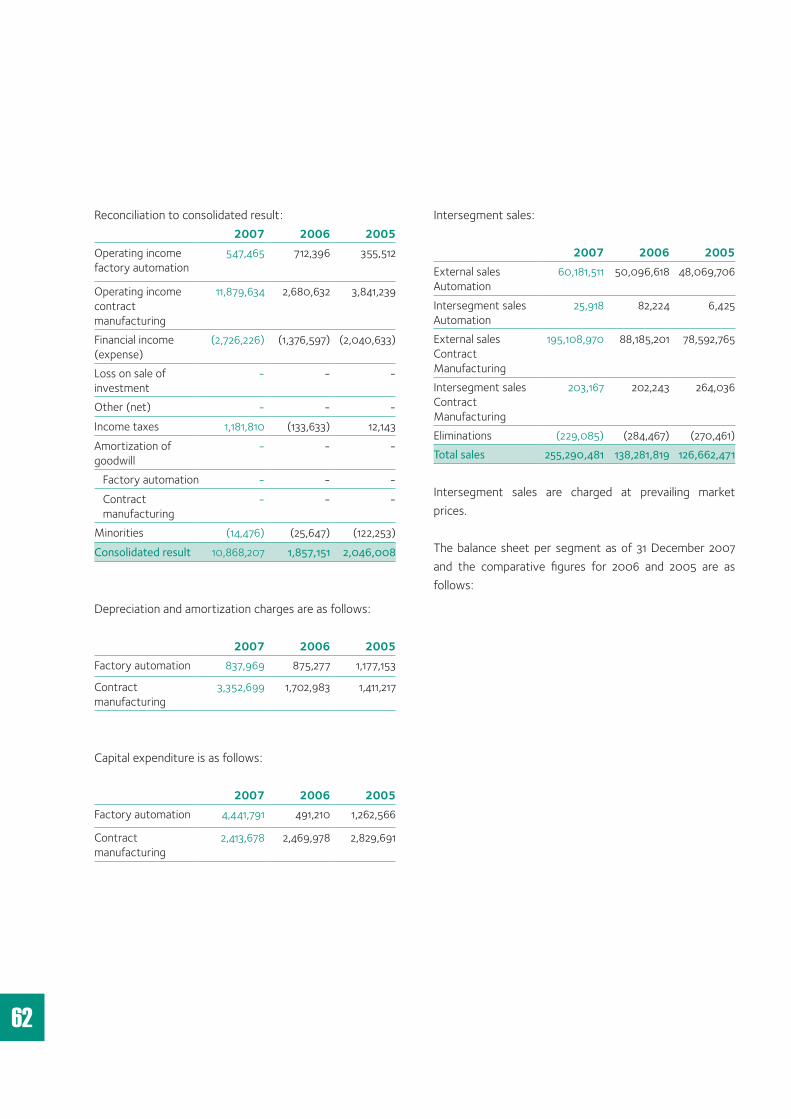
62
Reconciliation to consolidated result:2007 2006 2005
Operating income factory automation
547,465 712,396 355,512
Operating income contract manufacturing
11,879,634 2,680,632 3,841,239
Financial income (expense)
(2,726,226) (1,376,597) (2,040,633)
Loss on sale of investment
- - -
Other (net) - - -Income taxes 1,181,810 (133,633) 12,143Amortization of goodwill
- - -
Factory automation - - - Contract manufacturing
- - -
Minorities (14,476) (25,647) (122,253)Consolidated result 10,868,207 1,857,151 2,046,008
Depreciation and amortization charges are as follows:
2007 2006 2005Factory automation 837,969 875,277 1,177,153
Contract manufacturing
3,352,699 1,702,983 1,411,217
Capital expenditure is as follows:
2007 2006 2005Factory automation 4,441,791 491,210 1,262,566
Contract manufacturing
2,413,678 2,469,978 2,829,691
Intersegment sales:
2007 2006 2005External sales Automation
60,181,511 50,096,618 48,069,706
Intersegment sales Automation
25,918 82,224 6,425
External sales Contract Manufacturing
195,108,970 88,185,201 78,592,765
Intersegment sales Contract Manufacturing
203,167 202,243 264,036
Eliminations (229,085) (284,467) (270,461)Total sales 255,290,481 138,281,819 126,662,471
Intersegment sales are charged at prevailing market prices.
The balance sheet per segment as of 31 December 2007 and the comparative figures for 2006 and 2005 are as follows:
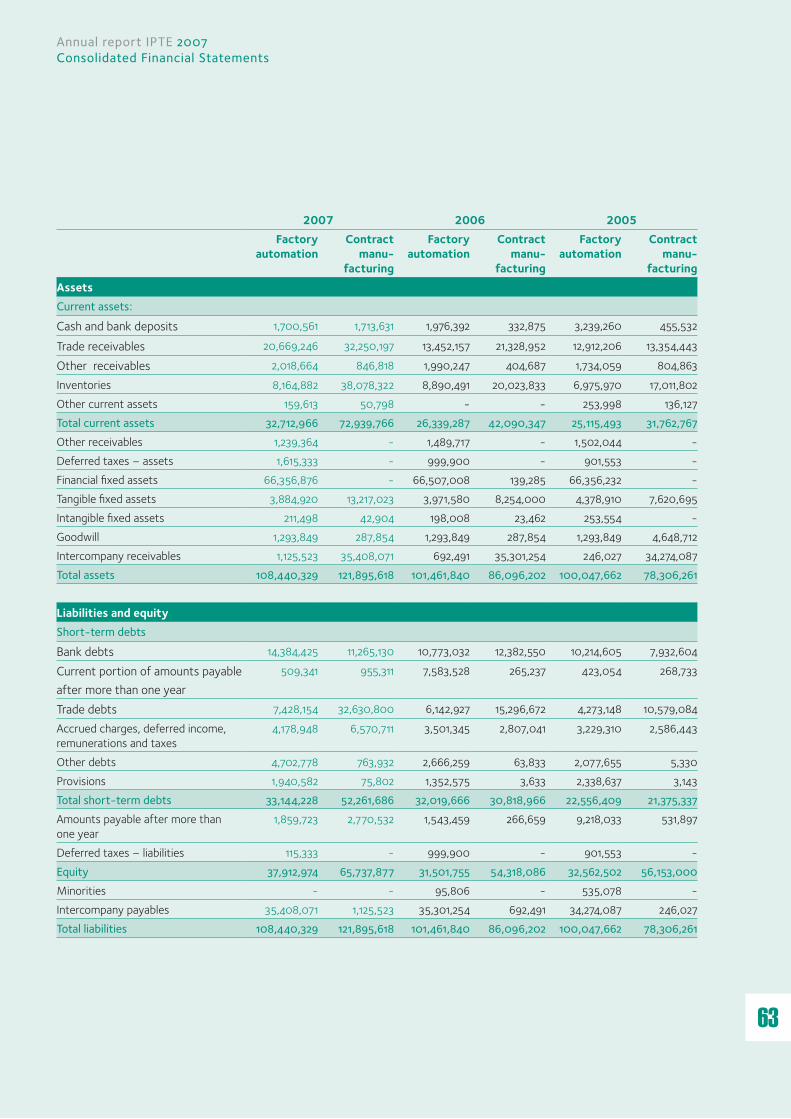
63
Annual report IPTE 2007Consolidated Financial Statements
2007 2006 2005Factory
automation Contract
manu-facturing
Factory automation
Contract manu-
facturing
Factory automation
Contract manu-
facturingAssetsCurrent assets:
Cash and bank deposits 1,700,561 1,713,631 1,976,392 332,875 3,239,260 455,532
Trade receivables 20,669,246 32,250,197 13,452,157 21,328,952 12,912,206 13,354,443
Other receivables 2,018,664 846,818 1,990,247 404,687 1,734,059 804,863Inventories 8,164,882 38,078,322 8,890,491 20,023,833 6,975,970 17,011,802Other current assets 159,613 50,798 - - 253,998 136,127Total current assets 32,712,966 72,939,766 26,339,287 42,090,347 25,115,493 31,762,767Other receivables 1,239,364 - 1,489,717 - 1,502,044 -Deferred taxes – assets 1,615,333 - 999,900 - 901,553 -Financial fixed assets 66,356,876 - 66,507,008 139,285 66,356,232 -Tangible fixed assets 3,884,920 13,217,023 3,971,580 8,254,000 4,378,910 7,620,695Intangible fixed assets 211,498 42,904 198,008 23,462 253,554 -Goodwill 1,293,849 287,854 1,293,849 287,854 1,293,849 4,648,712Intercompany receivables 1,125,523 35,408,071 692,491 35,301,254 246,027 34,274,087Total assets 108,440,329 121,895,618 101,461,840 86,096,202 100,047,662 78,306,261
Liabilities and equityShort-term debts
Bank debts 14,384,425 11,265,130 10,773,032 12,382,550 10,214,605 7,932,604
Current portion of amounts payable after more than one year
509,341 955,311 7,583,528 265,237 423,054 268,733
Trade debts 7,428,154 32,630,800 6,142,927 15,296,672 4,273,148 10,579,084Accrued charges, deferred income, remunerations and taxes
4,178,948 6,570,711 3,501,345 2,807,041 3,229,310 2,586,443
Other debts 4,702,778 763,932 2,666,259 63,833 2,077,655 5,330Provisions 1,940,582 75,802 1,352,575 3,633 2,338,637 3,143Total short-term debts 33,144,228 52,261,686 32,019,666 30,818,966 22,556,409 21,375,337Amounts payable after more than one year
1,859,723 2,770,532 1,543,459 266,659 9,218,033 531,897
Deferred taxes – liabilities 115,333 - 999,900 - 901,553 -Equity 37,912,974 65,737,877 31,501,755 54,318,086 32,562,502 56,153,000Minorities - - 95,806 - 535,078 -Intercompany payables 35,408,071 1,125,523 35,301,254 692,491 34,274,087 246,027Total liabilities 108,440,329 121,895,618 101,461,840 86,096,202 100,047,662 78,306,261

64
Reconciliation to consolidated equity:2007
Equity factory automation
37,912,974
Equity contract manufacturing 65,737,877
Elimination cross participation (61,995,373)Equity attributable to equity of the parent 41,655,478
Reconciliation of total assets:2007
Assets factory automation 108,440,329
Assets contract manufacturing 121,895,618
Elimination intercompany receivables and payables
(36,533,594)
Elimination participation (61,995,373)Total assets 131,806,980
B. Geographical segmentsThe IPTE Group’s activities are conducted predominantly in Europe (95 %); America and Asia count for 5 % of the business.The geographical spread by business segment (in % of sales by destination) is as follows:
Factory Automation2007 2006 2005
Western Europe 53 58 67Northern Europe 2 2 -Benelux 10 22 6Eastern Europe 15 5 8Total Europe 80 87 81Asia and America 20 13 19Total 100 100 100
Contract Manufacturing 2007 2006 2005
Belgium 64 46 45The Netherlands 15 29 25Germany 12 12 14Europe 9 13 16Total 100 100 100
The geographical spread in K EUR for 2007 is as follows:
All amounts in K EUR
Europe US Asia Total
Revenues (by origin)
243,530 5,648 6,112 255,290
Segments assets
127,508 2,645 1,539 131,692
Capital expenditure
6,802 0 53 6,855
The geographical spread in K EUR for 2006 is as follows:
All amounts in K EUR
Europe US Asia Total
Revenues (by origin)
131,769 2,545 3,968 138,282
Segments assets
86,657 1,222 1,690 89,569
Capital expenditure
2,853 14 94 2,961
The geographical spread in K EUR for 2005 is as follows:
All amounts in K EUR
Europe US Asia Total
Revenues (by origin)
123,338 2,151 1,173 126,662
Segments assets
74,354 1,990 1,134 77,478
Capital expenditure
3,996 4 47 4,047
aa.Contingent liabilities Neither the company, nor its subsidiaries are subject to any legal proceeding that can have or may have a significant negative impact on the consolidated financial position of the company.
ab. Structure shareholders’ equityShareholders’ Equity (at 31/12/2007)Origin Name Number
IssuedDeclared
total%
Equity 6,934,424 4,877,134 70,33 %Warrants 182,850 0 0 %Total 7,117,274 4,877,134 68,53 %

65
Annual report IPTE 2007Consolidated Financial Statements
Shareholder Name Number Declared
(*)
%
Huub Baren BVBA 2,096,155 30.23 %LRM 1,250,000 18.03 %Quaeroq CVBA 247,859 3.57 %Het Beste Brood 224,000 3.23 %Moonen Gaston 244,582 3.53 %Switten Luc 258,589 3.73 %Vladimir Dobosch 257,465 3.71 %FMR Corporation 298,484 4.30 %Total 4,877,134 70,33 %
(*) Shareholders holding 3% or more need to declare their interests.
ac.Financialinstruments(i) Categories of financial instrument
2007 2006 2005Loans and receivables Cash and cash equivalents
3,414,192 2,309,267 3,692,792
Trade receivables 52,919,443 34,781,109 26,266,649TOTAL Loans and receivables 56,333,635 37,090,376 29,959,441
Financial liabilitiesFinancial liablities at amortized cost Bank loans and overdrafts
25,649,555 23,155,582 18,147,209
Long term debt (incl. Short Term Debt)
6,094,906 9,658,883 10,441,717
Accrued interest 313,791 145,986 36,818 Trade payables 40,818,143 21,439,599 14,852,232TOTAL Financial liabilities at amortized cost
72,876,395 54,400,050 43,477,976
Non Hedging financial derivatives Fair value of financial instruments
601,123 - -
TOTAL Non Hedging financial instruments 601,123 - -
The Group does not have quoted financial instruments.
(ii) Financial risk management objectives The Group’s Corporate Treasury function co-ordinates access to domestic and international financial markets and monitors and manages the financial risks relating to the operations of the Group. These risks include market risk (including currency risk, interest rate risk), credit risk and liquidity risk.
The Group seeks to minimise the effects of its USD exchange risks by using derivative financial instruments to manage these risk exposures.
The Group does not enter into or trade financial instruments, including derivative financial instruments, for speculative purposes.
(iii) Market risk managementThe Group’s activities expose it primarily to the financial risks of changes in foreign currency exchange rates (see note A below) and interest rates (see note B below). The Group enters into derivative financial instruments to manage its exposure to foreign currency risk on the US Dollar using foreign currency option contracts. Foreign currency risks that do not influence the Group’s cash flows (the risks resulting from the translation of assets and liabilities of foreign operations in to the Group’s reporting currency) are not hedged.
A.ForeigncurrencyriskmanagementThe Group undertakes purchase transactions denominated in foreign currencies. Hence, exposure to exchange rate fluctuations arise. Exchange rate exposures are managed within approved policy parameters utilising foreign currency option contracts for US Dollars only. To this effect the group has purchased and written options to buy US Dollars and entered into forward contracts to buy US Dollars. The Group does not use derivative financial instruments to manage its exposure to other foreign currencies.
The carrying amounts of the Group’s foreign currency denominated monetary assets and monetary liabilities (versus the functional currencies of the reporting entity

66
and including intercompany financial assets and liabilities) at the reporting date are as follows:
2007 2006 2005Assets GBP 176,940 232,727 357,848 USD 2,320,091 366,201 447,506 EUR 3,427,365 605,929 295,907Liabilities GBP 151,780 169,700 40,363 SGD 64,636 1,000,600 847,483 SEK 59,944 73,144 69,744 EUR 13,540,396 3,054,021 1,734,206 JPY 15,174,574 378,180 45,375 USD 7,666,072 2,008,515 1,280,056
Foreign currency sensitivity analysis
The Group is mainly exposed to the USD.
The company business is more than 95 percent a Euro sales business. Purchasing of material is partially US dollar driven. In 2007, the company purchased materials for approx 35 mio US dollar (14 percent of sales). These purchases are mainly for the subcontracting business (electronic components). The impact on future financial statements of a 10 percent increase or decrease of the US dollar against the Euro is difficult to measure and unpredictable for the following reasons:Product price setting for customers is based on the US dollar/ Euro exchange rate at the moment the contract is negotiated. Prices are typically negotiated for a 1 year period.Customer contracts regularly include clauses allowing Euro price adaptation in case impact of the US dollar content of the product changes with a certain percentage. During the lifespan of a product, price may change (including the impact of USdollar / Euro effects) as a consequence of minor product changes / revisions.The company sells several thousands of different products which each have their own lifespan, starting date and revision of prices history.US dollar / Euro exchange rate fluctuations may be volatile in both directions but gradually moving in one direction or US dollar / Euro exchange rate fluctuations may be steady moving in one direction.
The combination of all these elements makes the impact of the US Dollar / Euro Exchange rate exposure unpredictable. The impact will always be limited to the percentile movement of the US dollar /Euro exchange rate on the total US Dollar purchases in both directions. It can however have a material impact on the financial performance of the company.
The sensitivity analysis below represents the sensitivity of a 10% change in the foreign currency rates of the USD, including only the outstanding US dollars at year end. This sensitivity analysis includes external loans as well as loans to foreign operations within the Group where the denomination of the loan is in a currency other than the currency of the lender or the borrower. A positive number below indicates an increase in profit where the EUR strengthens against the USD. For a 10% weakening of the EUR against the USD, there would be an equal and opposite impact on the profit and the balances below would be negative.
Currency impact USD
2007 2006 2005
EUR EUR EUR Profit or loss 330,139 113,365 64,157
The Group’s sensitivity to the USD has increased over the last two years due to the increased purchases in USD.
Foreign currency option contracts.
To offset the US dollar risk , the company concluded US Dollar hedge contracts based on the estimated Dollar requirements for 2008. In total, for 20,460,000 US dollars , option contracts were signed equally spread over the year. Conditions of these contracts are spil of 1.40 – 1.50, knock-in of 1.50 and strike of 1.40. The group also has firm contracts of US dollar 3,000,000 at rates between 1.3923 and 1.3964. At yearend, the company recorded a financial loss of 601,123 Euro based on the market to market valuation of these contracts.

67
Annual report IPTE 2007Consolidated Financial Statements
B. Interest rate risk management and sensitivity analysis.The group is exposed to interest rate risk as entities in the group borrow funds at floating interest rates (mostly Euribor plus bankers margin ). The group has no outstanding interest swap or hedging contracts. The effect on the financial statements of a 1% change in interest rate amounts to less than EUR 320.000 based on the total outstanding financial debt of EUR 32 mio at yearend 2007. For 2006 and 2005 a 1% change in interest rate would have amounted to approximately EUR 320.000 and EUR 280.000. A sensitivtity in interest rates would not impact equity.
(iv) Credit risk management.Credit risk refers to the risk that a counterparty will default on its contractual obligations resulting in financial loss to the Group. The Group uses publicly available financial information and its own trading records to rate its major customers. The Group’s exposure is continuously monitored.
Maximum exposure to credit risk can be detailed as follows:
2007 2006 2005Loans and receivables Cash and cash equivalents
3,414,192 2,309,267 3,692,792
Trade receivables 52,919,443 34,781,109 26,266,649TOTAL Loans and receivables
56,333,635 37,090,376 29,959,441
The main focus for credit risk management relates to Trade receivables (see note 1.3.7 b) for an amount of 52,919,443 EUR, 34,781,109 and 26,266,649 as at December 31, 2007, 2006 and 2005 respectively.
The company has one customer counting for 33% of its business. 10 customers count for 61% of the business. We refer to note 1.3.7 b for an analysis of the ageing of Trade receivables and discussions on impairment.
The credit risk on trade receivables is limited because the counterparts are worldwide international electronic manufacturing firms of which 8 are stock quoted with financial data available on a quarterly basis and credit ratings assigned by international credit rating agencies.
The group does not hold any collateral for any of its financial assets.
(v) Liquidity risk managementThe company secured at its bankers credit lines of 48 mio for working capital needs. (see note 1.3.7. i) In 2007 on average, less than 33 mio of these lines were used . ( less than 70 percent). Bankers have expressed their intention in case needed that credit lines can be further extended. The credit lines are in principal renewable every year. We refer to note 1.3.7 j for a breakdown of the maturities of long term debt.
A breakdown of the cash flows of all financial liabilities at amortized cost is as follows.
2007 Financial liabilities at amortized cost
Current 70,129,856 2009 1,514,757 2010 1,330,325 2011 1,119,639 2012 678,667 2013 243,588 Beyond 2013 369,069
2006 Financial liabilities at amortized cost
Current 55,009,387 2008 574,135 2009 368,711 2010 318,763 2011 265,109 2012 202,464 Beyond 2012 408,918

68
2005 Financial liabilities at amortized cost
Current 35,823,167 2007 1,356,912 2008 8,404,972 2009 336,709 2010 288,121 2011 234,828 Beyond 2011 611,381
All non-hedging financial derivatives have maturities in 2008 and thus are to be considered as current. The group has derivative contracts to purchase 23,460,000 US dollars equally spread over the year. These US dollars will be used to pay its trade debts in US dollar throughout the year.
ad. Commitments The company signed a letter of intent to acquire the land and building located opposite one of their factories in Kampenhout (Belgium) for a purchase price of EUR 1,500,000. The purchase was finalized in February 2008.
Subsequent to yearend the company has committed to acquire 100% of the shares of Platzgummer Gmbh. The company specializes in developing and producing customized automation solutions and is located at Karlsfeld, close to Munich (Germany). Platzgummer’s customers are German and international suppliers to the automobile, metal and packaging industries.
In accordance with IFRS 3.71 and 3.67 we provide you with following information in relation to this business combination. (a) IPTE GmbH will acquire the shares of Platzgummer
GmbH.(b) The acquisition will take effect as of 1 January 2008(c) The acquisition of Platzgummer GmbH is taking
place in two stages. 80% of the shares are acquired in February 2008. The remaining 20 per cent will be purchased in January 2011.
(d) The price for 100 per cent of the shares is EUR 4.5 million. An additional payment can be made if the results in the next three years exceed minimum targets.
This additional payment has been set as a function of future results during this three-year period. The 20 per cent of shares that IPTE is not acquiring immediately are held by Platzgummer’s executive management. No equity instruments will be issued as part of this business combination.
(e) No operations will be disposed of as a result of the combination
(f) At takeover date, Platzgummer has an equity of EUR 1.8 million. The company has no bank debts. Platzgummer has posted an annual turnover of around EUR 10 million in recent years. The EBIT margin was 8 per cent.
(g) The operations of Platzgummer will be included in the consolidated financial statements of IPTE NV as of 1 January 2008. The assessment of the fair value of the acquired business is still to be determined.
(h) The income statement per December 31, 2007 does not include any profit or loss as a result of this business combination. No costs were incurred in 2007 in relation to this acquisition.
ae. Related party transactions The company purchased EUR 1,951,223 in the course of 2007 (respectively EUR 1,3 million in 2006 and EUR 1.7 million in 2005) from PMS 724 GmbH. The purchases mainly relate to parts for machinery. The Board of Directors has discussed the nature and character of these purchases and concluded that they are contracted in the normal course of business and concluded they were contracted at arm’s length conditions.The shares of PMS 724 GmbH are owned for 100 % by a shareholder of IPTE NV who is also a member of the Board of directors.
Board of Directors and Management
The total amount of emoluments to the members of the Board of Directors and Management amount to EUR 1,245,000 in 2007, EUR 1,024,000 in 2006 and EUR 1,037,000 in 2005. The interest charges paid to Management as remuneration for the subordinated loan are included in the financial expenses and amount to EUR 55,747 in 2007 (EUR 80,000 in 2006).The total amount of shares held by the members of the

69
Annual report IPTE 2007Consolidated Financial Statements
Board of Directors amounted to 4,330,791 in 2007, 3,125,889 in 2006 and 3,125,889 in 2005.The total amount of warrants held by members of the Board of Directors amounted to 0 in 2007, 1,458,332 in 2006 and 1,458,332 in 2005.
af. Disclosure attest and non attest fees charged by the Statutory Auditor
In accordance with the law of 20 July 2006, article 101, please find below a summary of the attest fees and non attest fees of the statutory auditor Deloitte Bedrijfsrevisoren and its network of professional service firms.
Attest fee (consolidated level)
2007
Agreed fee 149,995
Non Attest fees (consolidated level)
2007
Tax advice 66,803Other attest services 11,100Legal missions 3,000Due diligence services
42,310
Lease Start Date
Lease End Date Review Date Annual Rent Area (square meters)
Belgium Connectronics NV Rozendaalstraat 14,
8900 Ieper
01/01/2003 Annual renewable for 1 year
31/12/2006 22,654 813
Connectronics, Division of IPTE NV Frankrijklaan 22, 8970 Poperinge
01/01/2007 31/12/2015 - 178,800 4,257
Connectronics, Division of IPTE NV Frankrijklaan 18, 8970 Poperinge
01/01/2007 31/12/2015 - 47,822 1,107
Connectronics, Division of IPTE NV Vlaanderenlaan 2,
8970 Poperinge
01/01/2004 31/05/2009 - 18,184 615
IPTE NV Beernem, division IPTE NV
1/11/2006 30/10/2015 3 year 6 months notice
27,600 600
Germany IPTE Germany GmbH Schleifweg 14, 90562 Heroldsberg
01/04/2005 31/03/2015 31/03/2014 334,948 3,524
Connectronics GmbH Siemensstr . 11, 72636
Frickenhausen
01/11/2000 31/12/2010 31/12/2009 239,078 4,320
Romania Connectronics Romania SRL Str Borsului 14/H,
Santion – Bihor County
01/04/2004 31/12/2007 - 300,000 7,200
Slovakia Connect Systems Slovakia spol. sro. Stanicna 1045,
95212 Vrable
01/01/1995 indefinite 3 months notice 58,572 1,200
Czech Republic
Connectronics sroBillundska 2756 272 01 Kladno
01/01/2007 Annual renewable
- 221,952 5,284
Portugal IPTE Iberia -Automaçao Industrial LDA Zone Ind. de Ovar,
3880-108 Ovar
01/07/2004 indefinite 3 months notice 30,000 500
China IPTE Industrial Automation (Shanghai) Co. LTD Building C,
No 88, Lane 3509, South Hongmei Road, Shanghai
01/05/2006 30/04/2009 3 months notice 30,480 1,200
ag. Operational lease commitments

70
In accordance with article 105 of the Company Law, this annual report includes the directors’ report and a condensed version of the individual statutory accounts of IPTE NV.The directors’ report, the statutory auditor’s opinion and the fully annual accounts of IPTE NV are available at the registered office of the company at no cost.
2.1 Report Board of Directors
We are pleased, as required by legal and regulatory provisions, to report to you on the activities of our company during the past financial year and to present the unconsolidated accounts, closed on 31 December 2007, for your approval.
Capital and ownership of the sharesOn 10 October 2007, 1,458,332 warrants were exercised and converted into 1,458,332 new shares. The capital increase amounted to EUR 90,523.09 and a share premium of EUR 6,909,577.01 was recorded. (Total increase in shareholders’ equity: EUR 6,999,993.60).
Following this capital increase the issued capital of the company amounts to EUR 429,934.29, represented by 6,934,424 shares without nominal value. All shares are fully paid-in.
At 31 December 2007, the company still had 182,250 warrants outstanding, which have been allocated to employees (exercise period from 2001 to 2010, exercisable
price at EUR 20.00). Upon exercise, these warrants entitle their holders to 182,250 new shares of IPTE NV.
ActivitiesOn 1 January 2007 IPTE took over BARCO’s PCB surface mounting activity. This surface mounting activity takes place in two plants, one at Poperinge (Belgium), the other at Kladno (Czech Republic). The Poperinge plant was acquired by purchase of all its assets/liabilities by IPTE NV. The Kladno (Czech Republic) activity was acquired by a 100% subsidiary of the IPTE group in the Czech Republic. As a result of this acquisition, IPTE NV’s annual accounts contain not only the automation activity in Genk and Beernem, but also a surface mounting plant in Poperinge.
Sales of this activity have contributed to the EUR 97.4 million increase in the operating income of this company compared with 2006 (increase in operating income from EUR 21.3 million to EUR 118 million). Through this transaction, IPTE NV was able to add Barco as its largest customer to its customer portfolio.
Commentary on the annual accountsFinancial situation at 31 December 2007Shareholders’ equity (after distribution of profit) amounts to EUR 48,859,585.22. This is an increase of EUR 13,740,020.47 compared with 31 December 2006. This increase is explained by the capital increase of (EUR 6,999,993.60), the movements in capital grants (EUR -6,024) and the profit for the year carried forward (EUR 6,746,050.87).
All amounts in K EUR
31/12/2006 capital increase capital grants
profit/(loss) carried forward
31/12/2007
Capital 339,411.20 90,523.09 0.00 0.00 429,934.29Share premium account 31,143,064.80 6,909,577.01 0.00 0.00 38,052,641.81
Legal reserve 33,941.11 (106.5) 0.00 9,158.39 42,993.00
Profit/(loss) carried forward 3,545,919.64 0.00 0.00 6,736,892.48 10,282,812.12
Capital grants 57,228.00 0.00 -6,024.00 0.00 51,204.00Total shareholders’ equity 35,119,564.75 6,999,993.60 -6,024.00 6,746,050.87 48,859,585.22
2. INDIVIDUAL FINANCIAL STATEMENTS

71
Annual report IPTE 2007Consolidated Financial Statements
IPTE NV ended the year with an operating income of EUR 118.7 million (EUR 21.3 million in 2006) and a net profit of EUR 6.7 million, compared with a loss of EUR 0.9 million in 2006.These positive results were achieved in both the automation activity and the surface mounting activity.The surface mounting activity was taken over at a net value of EUR 14,660,995.81, broken down as follows:
Intangible assets 57,279.60Tangible assets 1,126,659.71Financial assets 3,914.68Stocks 12,792,866.73Amounts receivable 4,925,175.74Prepaid charges 65,005.32Provisions (65,800.00)Trade payables (3,813,876.20)Remuneration & social security liabilities (388,752.80)Deferred income (41,476.97)
The Board of Directors has analyzed the risks and uncertainties with which the enterprise is confronted. The Board of Directors is of the opinion that no specific risks and uncertainties need to be reported other than the operating risks that are inherent in the macro-economic climate and the risks for which provisions have been made in the books.
Appropriation of the profit:The Board of Directors proposes that the profit for the financial year (EUR 6,746,050.87) plus the profit brought forward from the previous year (EUR 3,545,915.65) be appropriated as follows:
Announcements Important events after the closing of the financial year:No significant events have occurred after the closing of the 2007 financial year that could significantly influence the company’s development.
Branches:The enterprise has facilities at Poperinge (surface mounting activity), Genk and Beernem (automation).
Financial risk management:The enterprise limits its financial risks. Fluctuations in market prices, exchange rate differences on sales and purchases and inter-company loans are risks inherent to the company’s activity. The company is seeking constantly to minimize the financial risks inherent in its activities. To minimize its foreign rate risks, the company has entered into option contracts and forward contracts to purchase USD. These contracts have a negative market value of KEUR 380 and were included in the financial costs for the year.
Research and development:The company constantly undertakes research and development to strengthen and guarantee its future market position. Remuneration of the statutory auditor:As required by article 101 of the law of 20 July 2006, we mention the fees for audit and non-audit activities paid to the statutory auditor and to firms with which the statutory auditor collaborates on a professional basis: 1. Audit fees 80,000 2. Other legal assignments 3,000 3. Tax advice 51,468 4. Due diligence services 42,310
Addition to the legal reserves 9,158.39Profit to be carried forward 10,282,812.12Following this appropriation, shareholders’ equity at 31 December 2007 is composed as follows:Capital 429,934.29Share premium account 38,052,641.81Legal reserve 42,993Capital grants 51,204.00 Profit carried forward 10,282,812,12Total shareholders’ equity 48,859,585.22
72
Announcement pursuant to articles 95 and 119 of the Companies Code:1. With respect to the capital structure we refer to the first item of this report.
2. There are no legal or statutory limitations on the transfer of securities.
3. There are no holders of securities to which special rights of control are attached.
4. There are no share plans for employees where the rights of control are not exercised directly by employees.
5. There are no legal or statutory limitations to the exercise of voting rights.
6. There are no shareholder agreements which could limit the exercise of voting rights.
7. The company is governed by a Board of Directors composed of at least 5 directors, who may or may not be shareholders. They are appointed by the General Meeting of Shareholders. The mandates of departing directors who are not reelected end immediately after the annual meeting of the year in which their mandate ends. Directors may be dismissed at any time by the General Meeting. Departing directors may be reelected. Any Board member may resign by written notification to the Board of Directors. At least 2 directors must be independent directors. A person is viewed as an indirect director when he:
- is not a member of the executive management of the Company, nor of the control bodies or of the executive management of the other companies of the group;
- has no family ties with the other directors that could influence his independent judgement;
- is not part of the executive management or board of directors of one of the dominating shareholders, nor has been elected upon the proposal of one of the dominating shareholders, nor has business, financial or other relationships with these persons that are such as could influence his opinion;
- maintains no other relationship with the Company which, in the opinion of the Board of Directors, is such as could potentially influence his judgement; such influence is not deemed to lie in the remuneration that this director receives, nor in his limited personal ownership of shares in the Company.
Only the extraordinary general meeting is authorized to make amendments to the articles of association and, in particular, to decide on the accelerated dissolution of the company, on any increase or decrease of company capital, any merger with one or more companies, changes in the company purpose and the conversion of the company into a company having another legal form. 8. The Board of Directors is authorized to acquire the shares of the company by purchase or exchange, directly or via a person acting in his own name but for the company’s account, in order to avoid imminent and serious detriment to the company, without the prior decision of the General Meeting by way of application of the provisions of the Companies Code. The Board of Directors is authorized to sell treasury shares without the prior decision of the General Meeting on the stock market or as the consequence of an offer for sale directed at all shareholders at the same conditions, in order to avoid imminent and serious detriment to the company, without the prior decision of the General Meeting by way of application of the provisions of the Companies Code. On 24 April 2007 the General Meeting moreover renewed the authorization of the Board of Directors to acquire own shares, by purchase or exchange, directly or via a person acting in his own name but for the company’s account, and more specifically:
- this acquisition can cover up to 547,609 shares;- the buying in shall take place at a price no lower than € 4 and no higher than € 8 per share. This authorization shall be valid for a period of no more than 18 months.

73
Annual report IPTE 2007Consolidated Financial Statements
9. There are no significant agreements to which the issuer is a party and which come into effect, undergo changes or expire in the event of a change in control of the issuer after a public takeover bid, or the consequences of the same, except if they are of such that publication of the same would seriously damage the issuer; this derogatory regulation not being applicable in those cases where the issuer is specifically obliged to publish such information under other legal requirements.
10. There are no agreements concluded between the issuer and its directors or employees which provide for remuneration in the event that, as the result of a public takeover bid, directors resign or are required to take redundancy without valid reason or the employment of employees is terminated.
Genk, March 17, 2008

74
2.2 Condensed financial statements (in 000 EUR)BALANCE SHEET 2007 2006AssetsFIxED ASSETS 90,586 87,263I.FORMATION EXPENSES 0 0II.INTANGIBLE ASSETS 41 84III.TANGIBLE ASSETS 3.377 1.633
A. Land & buildings 1.335 1.451B. Plant, macchinery & equipment 920 5C. Furniture and vehicles 250 177D. Leasing and other similar rights 669 0E. Other tangible assets 0 0F. Assets under construction 203 0
IV.FINANCIAL ASSETS 87,168 85,546A. Affiliated enterprises 87,119 85,520 1.Participating interests 74,161 74,158 2.Amounts receivable 12,958 11,362B. Other enterprises linked by particip. interests 0 0 1.Participating interests 0 0 2.Amounts receivable 0 0C. Other financial assets 49 26 1.Shares 0 0 2.Amounts receivable and cash guarantees 49 26
CURRENT ASSETS 48,160 18,630V.AMOUNTS RECEIVABLE AFTER ONE YEAR I.FORMATION EXPENSES 0 0
A.Trade debtors 0 0B. Other amounts receivable 0 0
VI.STOCKS AND CONTRACTS IN PROGRESS 26,217 11,623A.Stocks 16,997 2,262 1.Raw materials 9,796 970 2.Work in progress 4,854 766 3.Finished goods 2,347 526 4.Goods purchased for resale 0 0 5.Immovable property acquired or constructed for resale 0 0 6.Advance payments 0 0B.Contracts in progress 9,220 9,361
VII.AMOUNTS RECEIVABLE WITHIN ONE YEAR 21,676 6,121A. Own shares 17,615 5,862B. Other amounts receivable 4,061 259
VIII.INVESTMENTS 0 0A. Own shares 0 0B. Other investments and deposits 0 0
IX.CASH AT BANK AND IN HAND 137 747X.DEFERRED CHARGES AND ACCRUED INCOME AT BANK AND IN HAND 130 139TOTAL ASSETS 138,746 105,893
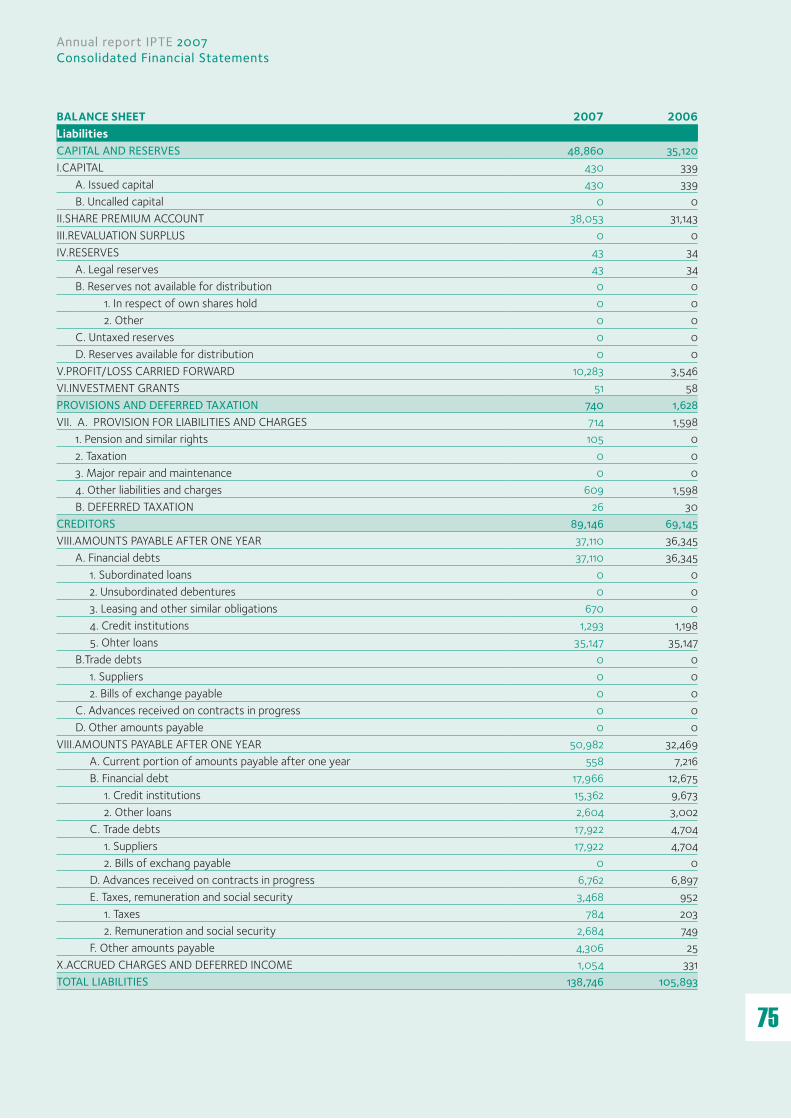
75
Annual report IPTE 2007Consolidated Financial Statements
BALANCE SHEET 2007 2006LiabilitiesCAPITAL AND RESERVES 48,860 35,120I.CAPITAL 430 339
A. Issued capital 430 339B. Uncalled capital 0 0
II.SHARE PREMIUM ACCOUNT 38,053 31,143III.REVALUATION SURPLUS 0 0IV.RESERVES 43 34
A. Legal reserves 43 34B. Reserves not available for distribution 0 0 1. In respect of own shares hold 0 0 2. Other 0 0C. Untaxed reserves 0 0D. Reserves available for distribution 0 0
V.PROFIT/LOSS CARRIED FORWARD 10,283 3,546VI.INVESTMENT GRANTS 51 58PROVISIONS AND DEFERRED TAxATION 740 1,628VII. A. PROVISION FOR LIABILITIES AND CHARGES 714 1,598
1. Pension and similar rights 105 02. Taxation 0 03. Major repair and maintenance 0 04. Other liabilities and charges 609 1,598B. DEFERRED TAXATION 26 30
CREDITORS 89,146 69,145VIII.AMOUNTS PAYABLE AFTER ONE YEAR 37,110 36,345
A. Financial debts 37,110 36,345 1. Subordinated loans 0 0 2. Unsubordinated debentures 0 0 3. Leasing and other similar obligations 670 0 4. Credit institutions 1,293 1,198 5. Ohter loans 35,147 35,147B.Trade debts 0 0 1. Suppliers 0 0 2. Bills of exchange payable 0 0C. Advances received on contracts in progress 0 0D. Other amounts payable 0 0
VIII.AMOUNTS PAYABLE AFTER ONE YEAR 50,982 32,469 A. Current portion of amounts payable after one year 558 7,216 B. Financial debt 17,966 12,675 1. Credit institutions 15,362 9,673 2. Other loans 2,604 3,002 C. Trade debts 17,922 4,704 1. Suppliers 17,922 4,704 2. Bills of exchang payable 0 0 D. Advances received on contracts in progress 6,762 6,897 E. Taxes, remuneration and social security 3,468 952 1. Taxes 784 203 2. Remuneration and social security 2,684 749 F. Other amounts payable 4,306 25
X.ACCRUED CHARGES AND DEFERRED INCOME 1,054 331TOTAL LIABILITIES 138,746 105,893
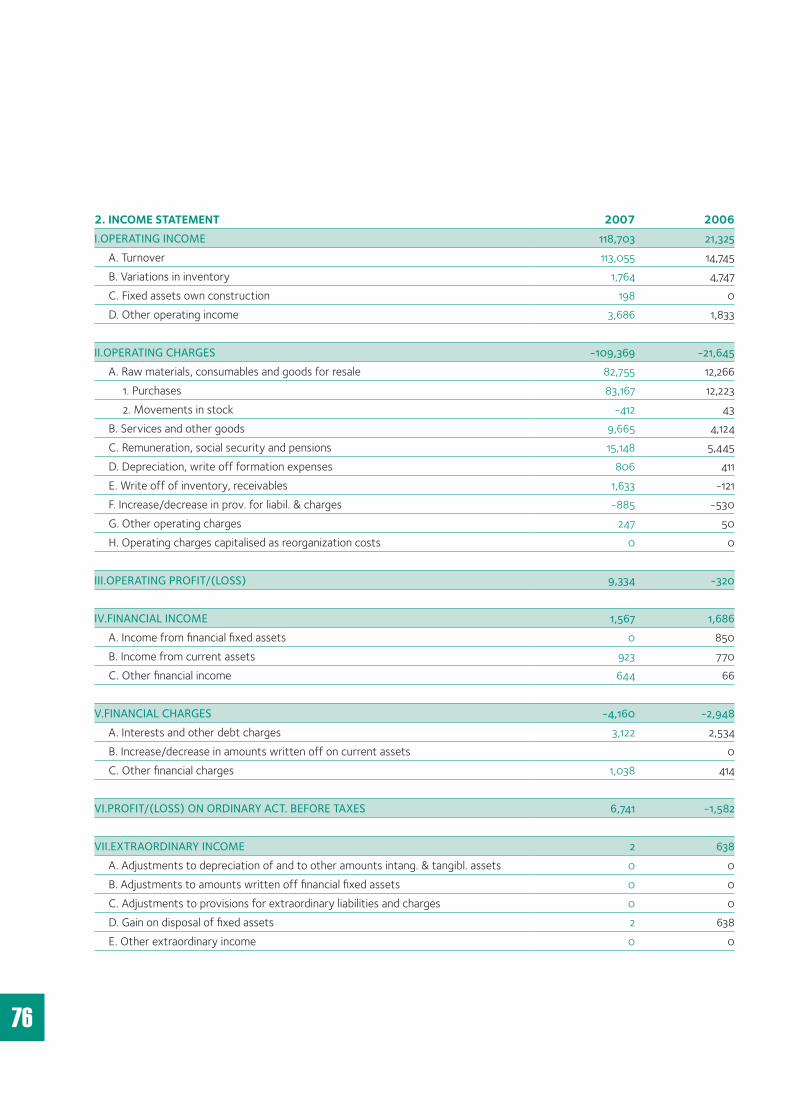
76
2. INCOME STATEMENT 2007 2006I.OPERATING INCOME 118,703 21,325 A. Turnover 113,055 14,745 B. Variations in inventory 1,764 4,747 C. Fixed assets own construction 198 0 D. Other operating income 3,686 1,833
II.OPERATING CHARGES -109,369 -21,645 A. Raw materials, consumables and goods for resale 82,755 12,266 1. Purchases 83,167 12,223 2. Movements in stock -412 43 B. Services and other goods 9,665 4,124 C. Remuneration, social security and pensions 15,148 5,445 D. Depreciation, write off formation expenses 806 411 E. Write off of inventory, receivables 1,633 -121 F. Increase/decrease in prov. for liabil. & charges -885 -530 G. Other operating charges 247 50 H. Operating charges capitalised as reorganization costs 0 0
III.OPERATING PROFIT/(LOSS) 9,334 -320
IV.FINANCIAL INCOME 1,567 1,686 A. Income from financial fixed assets 0 850 B. Income from current assets 923 770 C. Other financial income 644 66
V.FINANCIAL CHARGES -4,160 -2,948 A. Interests and other debt charges 3,122 2,534 B. Increase/decrease in amounts written off on current assets 0 C. Other financial charges 1,038 414
VI.PROFIT/(LOSS) ON ORDINARY ACT. BEFORE TAxES 6,741 -1,582
VII.ExTRAORDINARY INCOME 2 638 A. Adjustments to depreciation of and to other amounts intang. & tangibl. assets 0 0 B. Adjustments to amounts written off financial fixed assets 0 0 C. Adjustments to provisions for extraordinary liabilities and charges 0 0 D. Gain on disposal of fixed assets 2 638 E. Other extraordinary income 0 0

77
Annual report IPTE 2007Consolidated Financial Statements
VIII.ExTRAORDINARY CHARGES 0 0 A. Extraord. deprec. of & extraord. amounts written off form. 0 0 expenses, tang. and intang. assets 0 0 B. Amounts written off financial fixed assets 0 0 C. Provisions for extraord. liabilities and charges 0 0 D. Loss on disposal of fixed assets 0 0 E. Other extraordinary charges 0 0 F. Extraordinary costs capitalised as restructuring costs 0 0
Ix.PROFIT (LOSS) FOR THE YEAR BEFORE TAxES 6,743 -944A. Transfers from deferred taxes 3 7B. Transfers to deferred taxes 0 0
x.INCOME TAxES 0 0 A. Income taxes 0 0 B. Adjustment of income taxes and write-back of tax provisions 0 0
xI.PROFIT (LOSS) FOR THE YEAR 6,746 -937
xII.TRANSFER TO UNTAxED RESERVES 0 0
xIII.PROFIT (LOSS) FOR THE YEAR AVAIL. FOR APPROPRIATION 6,746 -937
APPROPRIATION ACCOUNT 2007 2006A. PROFIT/(LOSS) TO BE APPROPRIATED 10,292 3,546 1. Profit/(loss) for the period avalable for appropriation 6,746 -937 2. Profit/(loss) brought forward 3,546 4,483B. TRANSFERS FROM CAPITAL AND RESERVES 0 0 1. From capital and share premium account 0 0 2. From reserves 0 0C. TRANSFERS TO CAPITAL AND RESERVES -9 0 1. To capital and share premium account 0 0 2. To legal reserve -9 0 3. To other reserves 0 0 D. RESULT TO BE CARRIED FORWARD -10,283 -3,546 1. Profit to be carried forward -10,283 -3,546 2. Loss to be carried forward 0 0E. SHAREHOLDERS’ CONTRIBUTION IN RESPECT OF LOSSES 0 0F. DISTRIBUTION OF PROFIT 0 0 1. Dividends 0 0 2. Directors’ emoluments 0 0 3. Other allocations 0 0

78
2.3 Summary of the valuation rules
1. ASSETSI. Formation Expenses Formation expenses are expensed as incurred.
II Intangible fixed assetsIntangible fixed assets are valued at acquisition cost. These assets are amortized over the contractual period, if any, or the estimated useful life, using the straight-line method: Research and Development Costs: 20 %- 33 %Goodwill: 20 %Brands: 10 % III. Tangible fixed assetsTangible fixed assets are valued at acquisition cost or production cost in case of own construction. Tangible fixed assets are depreciated over their estimated useful economic lives using the following: Annual depreciation rates are:-Buildings: 5 % double-declining-Plant, machinery and equipment: 20 % straight-line-Furniture: 20 % straight-line-Vehicles: 25 % straight-line-Computer equipment: 33 % straight-line-Second-hand equipment 50-100 % straight-line
Fixed assets under construction:-Formation expenses related to buildings: 20 % double declining-Buildings: 5 % double-declining-Furniture: 20 % straight-line
IV. Financial fixed assetsFinancial fixed assets are valued at acquisition cost. The Board of Directors evaluates with sincerity, prudence and good faith whether impairment is permanent in nature and determines the corresponding write down.
V. Inventories and Work in progressInventories are valued at acquisition cost according to the weighted moving average pricing method. Obsolete or slow-moving inventories are written down if the book value exceeds the net realizable value. The results of work in progress for projects are recognized in accordance to the completed contract method. Losses on projects are recognized immediately. The production costs include the costs of raw materials and consumables; direct labour costs and other direct attributable production costs.
VI. ReceivablesReceivables are recorded at their face value. They are written down in case their estimated realizable value at closing date is below their book value.Receivables in foreign currencies are valued at the year-end exchange rates. Exchange gains or losses resulting from the conversion are included in the profit and loss statement.
VII. Cash and cash equivalentsCash and cash equivalents are recorded at their face value.
2. LIABILITIESI. Short-term and long-term debtsThese debts are recorded at their face value.Debts in foreign currencies are valued at the year-end exchange rates. Exchange gains or losses resulting from the conversion are included in the profit and loss statement.
II. Provisions for liabilities and charges.At the end of the year, the Board of Directors determines with sincerity, prudence and good faith the provisions necessary to cover risks or potential losses arising from the current period or from the prior periods.

79
Annual report IPTE 2007Consolidated Financial Statements


Annual report IPTE 2007Key figures
0
100
200
300
400
500
0
500
1000
1500
2000
-6,000
-5,000
-4,000
-3,000
-2,000
-1,000
0
1,000
2,000
3,000
100
150
200
250
300
0
1
2
3
4
5
-1,5
-1,0
-0,5
0,0
0,5
1,0
1,5
2,0
18832168
-5627
-701
-2236
0.34
1.56
0.37
-1.02
20072006200520042003 20072006200520042003 20072006200520042003
-0.13
-6000
-4000
-2000
0
2000
4000
6000
8000
10000
1200010 883
1 883
-5 627
-701
2 168
138.3
255.3
126.6128.5
110.3
Sales (in EUR ‘million)
Factory Automation Contract Manufacturing
Contract manufacturing by region Factory automation by market
Contract manufacturing by market Factory automation by region
Net result per share (in EUR) Net result (in EUR ‘000)
9% Europe and rest of the World
15% Consumer electronics
8% Other
4% Subcontracting6% Telecommunications
15% The Netherlands
12% Germany
64% Belgium
47% Western Europe
20% USAand rest of the World
15% Eastern Europe
2% Northern Europe
10% Benelux
6% Southern Europe
67% Automotive
10% Medical products
63% Professional products
11% Telecommunications2% Other
14% Automotive
2005 2006 2007 2005 2006 2007
Jan
07
Feb
07
Mar
07
Apr 0
7
May
07
Jun
07
Jul 0
7
Aug
07
Sep
07
Oct
07
Nov
07
Dec
07
Closing Price (Euronext Brussels)Volume (000)
Closing Price (Euronext Brussels)Bel20
0
1
2
3
4
5
6
7
8
9
10
11
12
0
20000
40000
60000
80000
100000
120000
Jan
07
Feb
07
Mar
07
Apr 0
7
May
07
Jun
07
Jul 0
7
Aug
07
Sep
07
Oct
07
Nov
07
Dec
07
50
00
50
100
150
Jan
07
Feb
07
Mar
07
Apr 0
7
May
07
Jun
07
Jul 0
7
Aug
07
Sep
07
Oct
07
Nov
07
Dec
07
Closing Price (Euronext Brussels)Volume (000)
Closing Price (Euronext Brussels)Bel20
0
1
2
3
4
5
6
7
8
9
10
11
12
0
20000
40000
60000
80000
100000
120000
Jan
07
Feb
07
Mar
07
Apr 0
7
May
07
Jun
07
Jul 0
7
Aug
07
Sep
07
Oct
07
Nov
07
Dec
07
50
00
50
100
150
0
100
200
300
400
500
0
500
1000
1500
2000
-6,000
-5,000
-4,000
-3,000
-2,000
-1,000
0
1,000
2,000
3,000
100
150
200
250
300
0
1
2
3
4
5
-1,5
-1,0
-0,5
0,0
0,5
1,0
1,5
2,0
18832168
-5627
-701
-2236
0.34
1.56
0.37
-1.02
20072006200520042003 20072006200520042003 20072006200520042003
-0.13
-6000
-4000
-2000
0
2000
4000
6000
8000
10000
1200010 883
1 883
-5 627
-701
2 168
138.3
255.3
126.6128.5
110.3
Sales (in EUR ‘million)
Factory Automation Contract Manufacturing
Contract manufacturing by region Factory automation by market
Contract manufacturing by market Factory automation by region
Net result per share (in EUR) Net result (in EUR ‘000)
9% Europe and rest of the World
15% Consumer electronics
8% Other
4% Subcontracting6% Telecommunications
15% The Netherlands
12% Germany
64% Belgium
47% Western Europe
20% USAand rest of the World
15% Eastern Europe
2% Northern Europe
10% Benelux
6% Southern Europe
67% Automotive
10% Medical products
63% Professional products
11% Telecommunications2% Other
14% Automotive
2005 2006 2007 2005 2006 2007
0
100
200
300
400
500
0
500
1000
1500
2000
-6,000
-5,000
-4,000
-3,000
-2,000
-1,000
0
1,000
2,000
3,000
100
150
200
250
300
0
1
2
3
4
5
-1,5
-1,0
-0,5
0,0
0,5
1,0
1,5
2,0
18832168
-5627
-701
-2236
0.34
1.56
0.37
-1.02
20072006200520042003 20072006200520042003 20072006200520042003
-0.13
-6000
-4000
-2000
0
2000
4000
6000
8000
10000
1200010 883
1 883
-5 627
-701
2 168
138.3
255.3
126.6128.5
110.3
Sales (in EUR ‘million)
Factory Automation Contract Manufacturing
Contract manufacturing by region Factory automation by market
Contract manufacturing by market Factory automation by region
Net result per share (in EUR) Net result (in EUR ‘000)
9% Europe and rest of the World
15% Consumer electronics
8% Other
4% Subcontracting6% Telecommunications
15% The Netherlands
12% Germany
64% Belgium
47% Western Europe
20% USAand rest of the World
15% Eastern Europe
2% Northern Europe
10% Benelux
6% Southern Europe
67% Automotive
10% Medical products
63% Professional products
11% Telecommunications2% Other
14% Automotive
2005 2006 2007 2005 2006 2007
KEY FIGURES
Stock market quotation (at 31/12/2007) Shares Highest price 11.39 EURLowest price 4.7 EURAverage price (accounting average) 7.36 EURPrice at 31/12/2007 11 EUR
Number of shares 6 934 424Number of warrants 182 850Average volume traded per day 9 481Stock market capitalisation (at 31/12/2007) 76 278 664
AnnuAl results IPte GrouP At 31 DeCember 000 EUR 2007 % 2006 % 2005 %Sales 255,290 100.0 138,282 100.0 126,662 100.0Cost of sales -208,396 -81.6 -109,917 -79.5 -97,886 -77.3Gross profit 46,894 18.4 28,365 20.5 28,776 22.7Research and development expenses -7,791 -3.1 -6,255 -4.5 -5,802 -4.6General and administrative expenses -13,891 -5.4 -9,134 -6.6 -8,757 -6.9Selling expenses -12,889 -5.0 -9,886 -7.1 -10,010 -7.9Other operating income/expense (net) 104 0.0 304 0.2 -10 -0.0Profit from operations 12,427 4.9 3,394 2.5 4,197 3.3Financial income/charges (net) -2,726 -1.1 -1,377 -1.0 -2,041 -1.6Profit before taxes 9,701 3.8 2,017 1.5 2,156 1.7Income taxes 1,182 0.5 -134 -0.1 12 0.0Profit after taxes 10,883 4.3 1,883 1.4 2,168 1.7Attributable to:Equity holders of the parent 10,868 4.3 1,857 1.3 2,046 1.6Minority interest 15 0.0 26 0.0 122 0.1Number of shares: 6,934,424Number of warrants: 182,850Profit/(loss) per share in EUR 1.57 0.34 0.37Diluted profit/loss per share in EUR 1.57 0.27 0.37
bAlAnCe sheet IPte GrouP At 31 DeCember 000 EUR 2007 2006 2005Intangible fixed assets 254 221 254Goodwill 5,943 5,943 5,943Property, plant and equipment 17,102 12,226 12,000Deferred tax assets 1,615 1,000 901Amounts receivable after one year 1,240 1,490 1,502Inventories and contracts in progress 46,243 28,914 23,988Trade receivables 52,919 34,781 26,267Other receivables 2,865 2,396 2,539Cash, bank deposits and current investments 3,414 2,309 3,694Other current assets 212 289 390Total assets 131,807 89,569 77,478
Equity 41,655 23,920 22,894Subordinated loan 0 7,200 7,000Provisions 2,016 1,356 2,342Deferred tax liability 115 1,000 901Long-term financial debts 4,630 1,810 2,750Bank loans and overdrafts 25,650 23,156 18,147Trade payables 40,818 21,440 14,852Current liabilities 16,923 9,687 8,592Total liabilities 131,807 89,569 77,478

Geleenlaan 53600 Genk - Belgium
Tel: +32 (0)89 623 000Fax: +32 (0)89 623 010
www.ipte.com
Market driven solutions
ANNUAL REPORT 2007
Company profile 1
Interview with Managing Director Huub Baren 2
IPTE Worldwide 4
Contract Manufacturing 6
Factory Automation 12
Report from the Board of Directors 18
Human Resources 22
Corporate Governance 24
Consolidated Financial Statements 29
Individual Financial Statements 70
Investor relationsIPTE NV - Geleenlaan 5 - 3600 Genk - BELGIUMTel: +32 (0)89 623 000 - Fax: +32 (0)89 623 010www.ipte.com - e-mail: [email protected] Baren, Managing Director IPTE NVHugo Ciroux, CFO IPTE NV
Contents
Financial calendar
General shareholders meeting 2007 April 29, 2008
Result Q1 May 15, 2008
Result Q2 August 13, 2008
Result Q3 November 13, 2008
Annual results 2008 February 19, 2009
General shareholders meeting 2008 April 28, 2009