Container Baler Upgrade & Monitoring Results CIF Project … · Operations and Monitoring of the...
20
Container Baler Upgrade & Monitoring Results CIF Project # 271 April 2012 Prepared by: Mary Little Tel: 905-372-4994, Email: [email protected] This Project has been delivered with the assistance of Waste Diversion Ontario’s Continuous Improvement Fund, a fund financed by Ontario municipalities and stewards of blue box waste in Ontario. Notwithstanding this support, the views expressed are the views of the author(s), and Waste Diversion Ontario and Stewardship Ontario accept no responsibility for these views. © 2011 Waste Diversion Ontario and Stewardship Ontario All rights reserved. No part of this publication may be reproduced, recorded or transmitted in any form or by any means, electronic, mechanical, photographic, sound, magnetic or other, without advance written permission from the owner.
Transcript of Container Baler Upgrade & Monitoring Results CIF Project … · Operations and Monitoring of the...
Container Baler Upgrade & Monitoring Results CIF Project # 271
April 2012
Prepared by:
Mary Little Tel: 905-372-4994, Email: [email protected]
This Project has been delivered with the assistance of Waste Diversion Ontario’s Continuous Improvement Fund, a fund financed by Ontario municipalities and stewards of blue box waste in Ontario. Notwithstanding this support, the views expressed are the views of the author(s), and Waste Diversion Ontario and Stewardship Ontario accept no responsibility for these views. © 2011 Waste Diversion Ontario and Stewardship Ontario All rights reserved. No part of this publication may be reproduced, recorded or transmitted in any form or by any means, electronic, mechanical, photographic, sound, magnetic or other, without advance written permission from the owner.
April 2012 County of Northumberland CIF Project #271 Page 1 of 19
Executive Summary
This report outlines the monitoring results of the most recently funded equipment installation of the new container baler; NEXGEN Galaxy Dual Ram. The return on capital investment is 3.3 years with CIF funding. The County of Northumberland has seen an increase in baling efficiency by an annual savings of $70,600 per year. This has been achieved by averaging 67% faster bale times, increasing average bale densities by up to 71% and a reduction in downtime. The Northumberland MRF was built in 1996 and is located in Grafton ON, situated along the 401 corridor approximately 1.5 hours east of the Region of Durham and 1 hour west of Quinte Region and 1 hour south of the City of Peterborough. The facility currently manages 15,380 tonnes per annum (TPA), 60 tonnes per day (TPD). The facility has a province wide Certificate of Approval (C of A) and is licensed to receive 350 tonnes per day of blue box material. To improve overall processing performance and reduce operating costs, the Northumberland MRF has conducted the following capital improvements over a 4 year planning period:
Installation of a new drum feeder (2009-E&E funded); Installation of a new triple deck fibre screen system (2009-E&E funded); Installation of a new fibre sort line equipped with optical sort technology
(2009-not funded); ESCO Study (2010-CIF funded) Installation of a new container baler and supporting metal infeed conveyor
(2011-CIF funded); Installation of a new fibre baler ( 2012-not funded); and, Purchase of new rolling stock inclusive of skid steer and forklift (2012-not
funded).

April 2012 County of Northumberland CIF Project #271 Page 2 of 19
Table of Contents
1.0 Introduction�…�…�…�…�…�…�…�…�…�…�…�…�…�…�…�…�…�…�…�…�…�…�…�…�…�…�…�…�….1 2.0 Program Background�…�…�…�…�…�…�…�…�…�…�…�…�…�…�…�…�…�…�…�…�…�…�…�….3 3.0 Project Description and Objectives�…�…�…�…�…�…�…�…�…�…�…�…�…�…�…�…...4-5 4.0 Monitoring Results�…�…�…�…�…�…�…�…�…�…�…�…�…�…�…�…�…�…�…�…�…�…�…�…�…..6-10 5.0 Conclusions�…�…�…�…�…�…�…�…�…�…�…�…�…�…�…�…�…�…�…�…�…�…�…�…�…�…�…�…�….11 Appendix 1 �– Baler Specification Sheet�…�…�…�…�…�…�…�…�…�…�…�…�…�….12-15 Appendix 2 �– Baler Weight and Time Trials�…�…�…�…�…�…�…�…�…�…�…�….16-19

April 2012 County of Northumberland CIF Project #271 3 of 19
1.0 Introduction County of Northumberland (County) retained 2cg Inc. (2cg) to document the System Operations and Monitoring of the newly purchased baler for the container sort line, CIF project #271. This monitoring report provides pre installation data of the original container baler inclusive of bale densities, performance levels and related operational costs associated with the baler. Upon commissioning of the newly installed baler comparative data was collected to determine the overall effectiveness of the new baler. The timeframe for this Project spans from late 2010 (pre installation) to early 2012 (post installation).
2.0 Program Background The County of Northumberland has committed to operating the Material Recovery Facility. As a result, capital equipment replacement reserves are included within the annual budget. In 2011, the County received 2.1 million in material sales representing an average composite index of $170 per tonne of marketed material, reflecting comparable revenue with the 2011 provincial composite index of $169/tonne. The Net annual operating cost of the Northumberland MRF in 2011 was $100/tonne. The reported population for the County of Northumberland is 83,043 (37,000 h.h.). The geographic area of the County is approximately 3,000 square kilometers composed of a mix of urban and rural areas.
Figure 1 Area Map depicting location of the County of Northumberland

April 2012 County of Northumberland CIF Project #271 4 of 19
The publically owned and operated Northumberland MRF is a 55,000 sq. ft. single stream facility that is currently processing approximately 15,380 tonnes per year (60 tonnes per operating day) on a single shift. The facility manages a broad spectrum of plastics inclusive of film plastic and all rigid container grades. The MRF (C of A A311713) is licensed to receive material from the province with a maximum inbound limit of 350 tonnes per operating day (260 days per year). Blue Box processing services provided by the County (March 2012) include;
Single Stream processing of residential and IC&I sector blue box material throughout the County;
Two stream processing of City of Kawartha Lakes blue box material; and Direct bale processing of dedicated loads of fibre from private contractors.
Photo 1 depicts the County of Northumberland MRF. Photo 1 �– County of Northumberland Material Recycling Facility- Grafton, ON
3.0 Project Description and Objectives
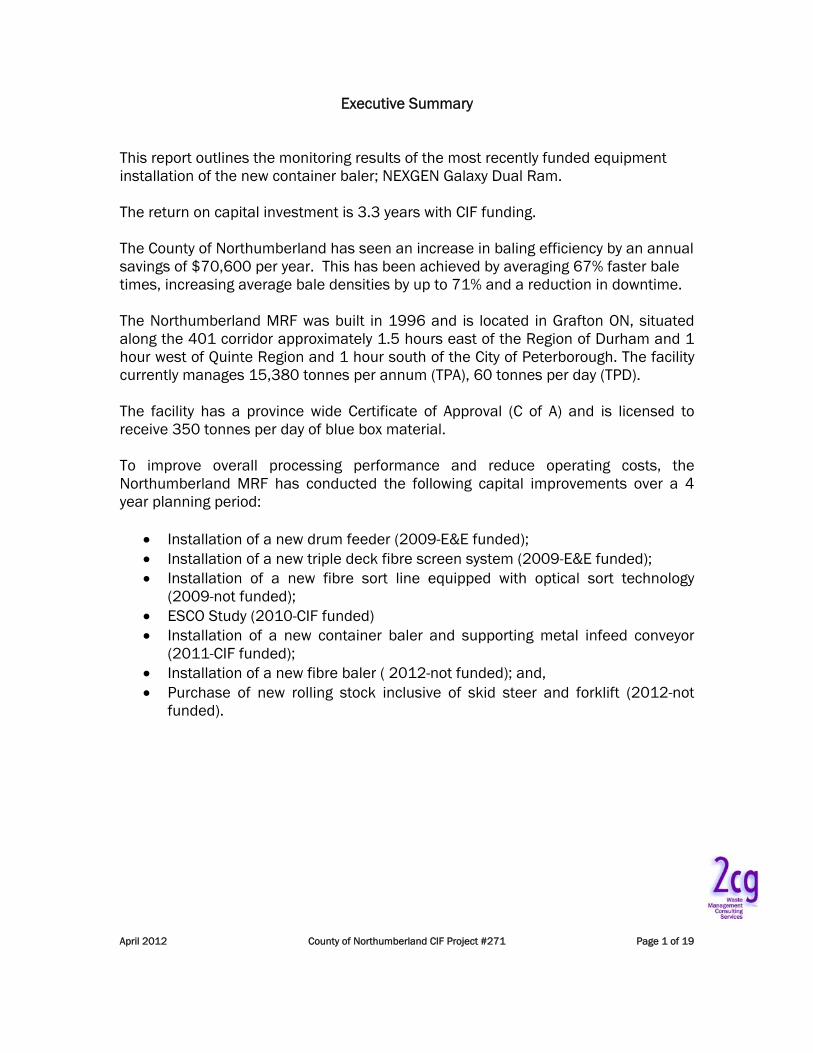
The original container baler (5042 American-purchased 1991) required continuous maintenance and exceeded its operating effectiveness. Within the past 5 years, the baler experienced annual maintenance cost of $25,000/year. The associated additional staffing costs related to the baling operations equate to $28,000 per year and the lighter payloads of plastic material (less than 40,000 lbs. per load) are estimated to account for a further $17,000 per year in lost revenues representing an overall annual cost of close to $70,000 per year. A budget of approximately $113,000 would have been needed to fully refurbish the 20 year old baler based on the overall wear of the floor, walls, expansion chamber, infeed conveyor, ram and cylinder. In addition to the high operating costs to maintain the aged container baler, the
April 2012 County of Northumberland CIF Project #271 5 of 19
County experienced limited processing capacity of the inbound container material due to the slower bale cycling times and bale breakages resulting in re-baling of plastic material.
Photo 2- 1991 American Baler 5042
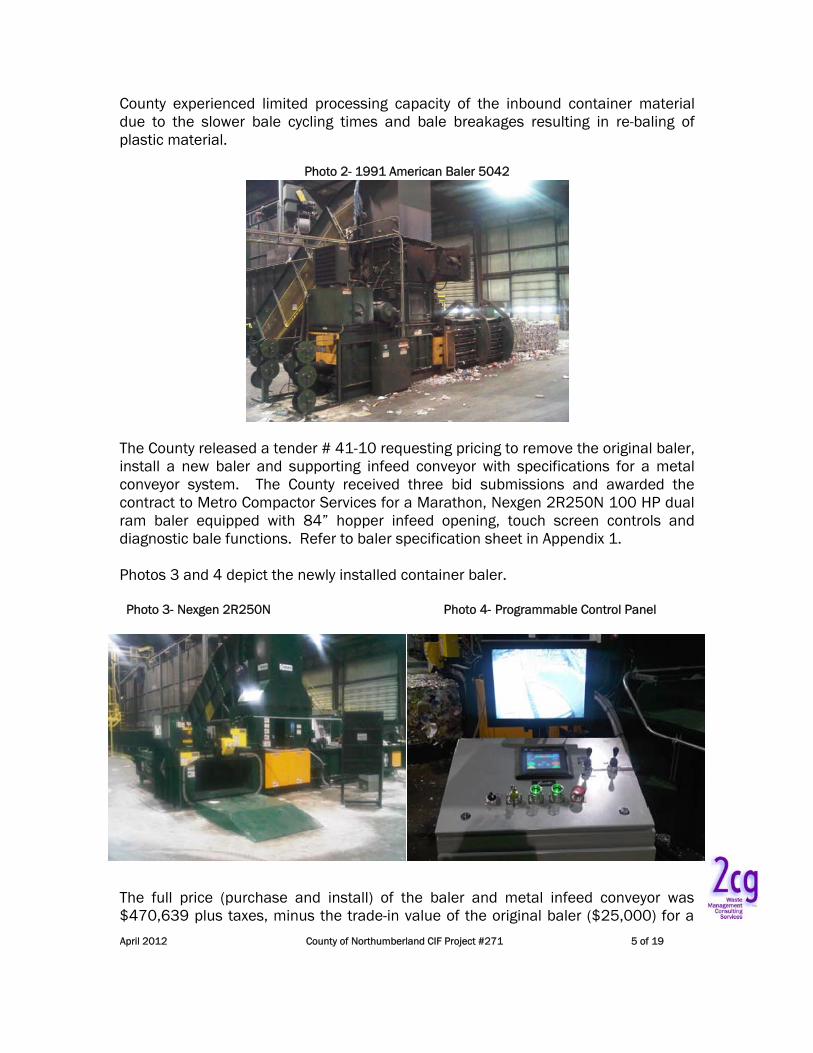
The County released a tender # 41-10 requesting pricing to remove the original baler, install a new baler and supporting infeed conveyor with specifications for a metal conveyor system. The County received three bid submissions and awarded the contract to Metro Compactor Services for a Marathon, Nexgen 2R250N 100 HP dual ram baler equipped with 84�” hopper infeed opening, touch screen controls and diagnostic bale functions. Refer to baler specification sheet in Appendix 1. Photos 3 and 4 depict the newly installed container baler. Photo 3- Nexgen 2R250N Photo 4- Programmable Control Panel The full price (purchase and install) of the baler and metal infeed conveyor was $470,639 plus taxes, minus the trade-in value of the original baler ($25,000) for a

April 2012 County of Northumberland CIF Project #271 6 of 19
total price of $445,639. The breakdown of the component pricing is as follows:
baler $330,639 metal infeed conveyor $100,000, installation $15,000
Additional cost associated with electrical connection that was not covered by the installation was approximately $25,000. Delivery timeframe was 16 weeks from point of order and installation timeframe was approximately 5 days. The majority of the installation time was devoted to the removal and assembly of the metal infeed conveyor (4 days). The old baler was removed in the afternoon of a Friday, installed on a regular plant shutdown day (Saturday) and was operating on Sunday. Staff training involved approximately a half a day of `classroom�’ health and safety training and two full days of operator training. Staff anticipated that by replacing the existing baler with a new baler would achieve the following performances objectives;
reduce downtime/maintenance costs, increase bale density, improve revenue from material sales, and increase overall container processing capacity.
Prior to the new baler installation, County staff recorded bale weights, timing and dimensions for container materials as a baseline.
4.0 Monitoring Results
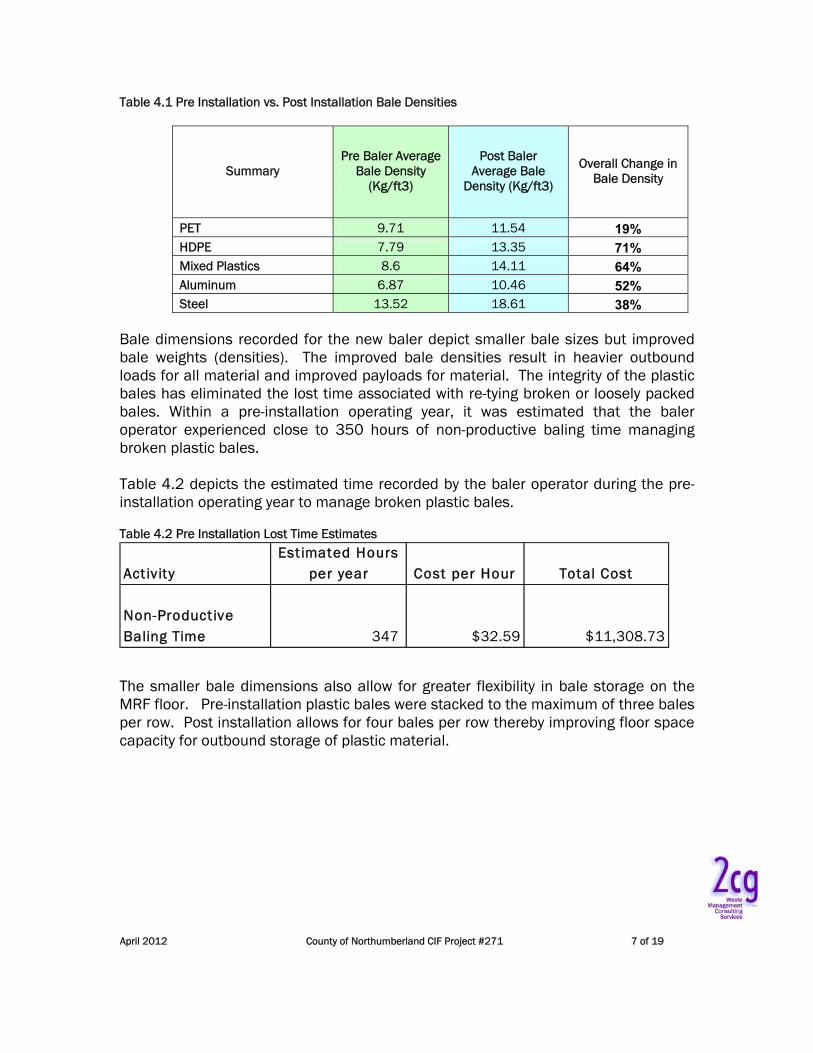
Bale Weights Bale weights were recorded in the fall (November & December) of 2011 from the original baler output to establish a baseline of information to compare with the March 2012 results from the new baler. Table 4.1 depicts the pre and post installation Bale dimensions and densities comparisons for the original American 5042 baler and the newly installed Nexgen 2R250N baler. Bale densities for HDPE and Mixed Plastic experienced the greatest improvement with HDPE depicting 71% greater density with the new baler and Mixed Plastic depicting 64% greater density. PET bales preformed somewhat lower but still depicted 19% greater bale densities than during pre-installation.
April 2012 County of Northumberland CIF Project #271 7 of 19
Table 4.1 Pre Installation vs. Post Installation Bale Densities
Summary Pre Baler Average
Bale Density (Kg/ft3)
Post Baler Average Bale
Density (Kg/ft3)
Overall Change in Bale Density
PET 9.71 11.54 19% HDPE 7.79 13.35 71% Mixed Plastics 8.6 14.11 64% Aluminum 6.87 10.46 52% Steel 13.52 18.61 38%
Bale dimensions recorded for the new baler depict smaller bale sizes but improved bale weights (densities). The improved bale densities result in heavier outbound loads for all material and improved payloads for material. The integrity of the plastic bales has eliminated the lost time associated with re-tying broken or loosely packed bales. Within a pre-installation operating year, it was estimated that the baler operator experienced close to 350 hours of non-productive baling time managing broken plastic bales. Table 4.2 depicts the estimated time recorded by the baler operator during the pre-installation operating year to manage broken plastic bales. Table 4.2 Pre Installation Lost Time Estimates
Act ivityEst imated Hours
per year Cost per Hour Total Cost
Non-Productive Baling Time 347 $32.59 $11,308.73
The smaller bale dimensions also allow for greater flexibility in bale storage on the MRF floor. Pre-installation plastic bales were stacked to the maximum of three bales per row. Post installation allows for four bales per row thereby improving floor space capacity for outbound storage of plastic material.

April 2012 County of Northumberland CIF Project #271 8 of 19
Weights The improvement of bale weights resulted in greater outbound trailer weights. PET, HDPE and Mixed Plastic receive an additional 2.2 cents per kilogram for loads exceeding the 18,144 kilograms (40,000 pounds) threshold. For baseline comparison purposes, Table 4.3 depicts the average bale weights and trailer loads for plastic materials during the pre and post installation period. It can be noted that with the original American 5042 Baler all outbound plastic loads did not meet the minimum threshold for additional revenue. All plastic material loads with the new Marathon Nexgen Baler exceeded the minimum threshold and achieved the additional 2.2 cents per kilogram for material sold. Table 4.3 Trailer Weights
Summary
Pre Baler Average Bale
Weights (Kg)
Pre Baler Average
Bales Per Trailer
Pre Baler Average
Trailer Load (Kg)
Post Baler
Average Bale
Weights (Kg)
Post Baler Average
Bales Per Trailer
Post Baler Average Trailer
Load (Kg)
PET 335 52
17,423 564 43
24,089
HDPE 336 48
17,578 653 32
20,903
Mixed Plastics 403 44
17,791 644 32
20,600 During post-installation, the revenue received from the improved trailer weights represented an annual increase of $17,360 per year in plastic material sales. Table 4.4 depicts the annual revenue gain from exceeding the minimum threshold of 18,144 kilograms per trailer load. Table 4.4 Post Installation Annual Revenue Gain
Materials Shipped 2011 Tonnes Additional Revenue (2.2 cents/Kg)
PET 408 $8,970 HDPE 215 $4,735 Mixed Plastics 166 $3,654
Total 789 $17,359
April 2012 County of Northumberland CIF Project #271 9 of 19
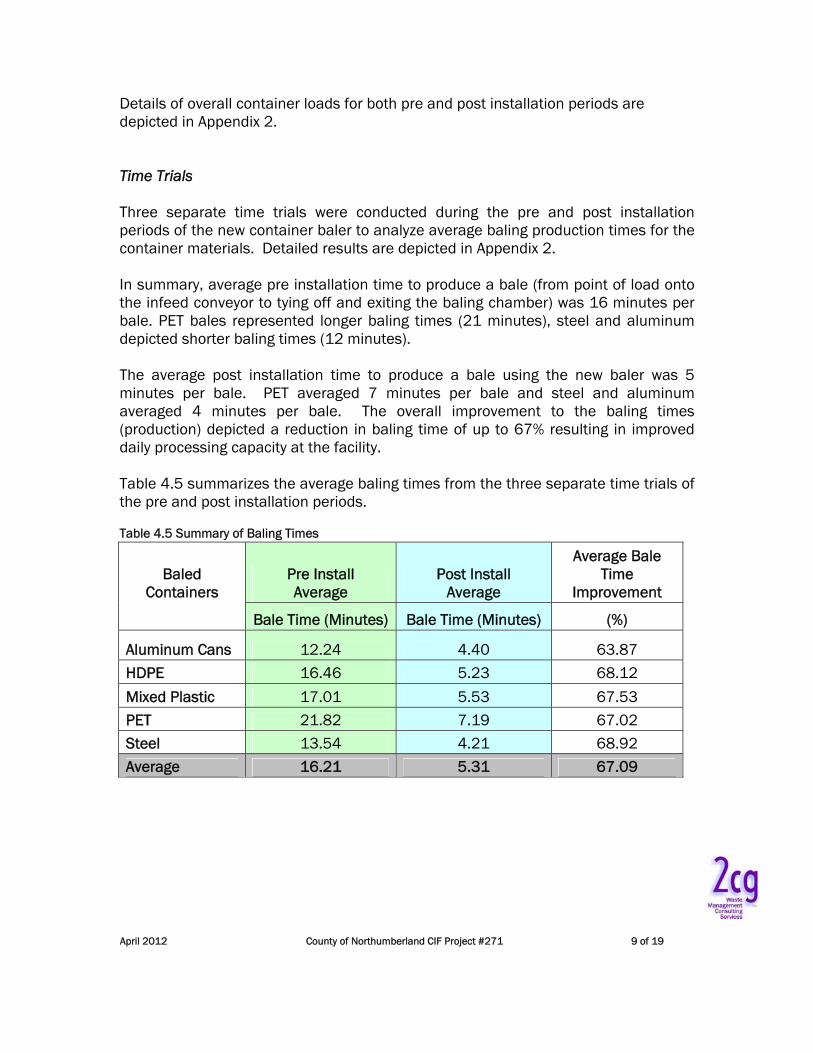
Details of overall container loads for both pre and post installation periods are depicted in Appendix 2. Time Trials Three separate time trials were conducted during the pre and post installation periods of the new container baler to analyze average baling production times for the container materials. Detailed results are depicted in Appendix 2. In summary, average pre installation time to produce a bale (from point of load onto the infeed conveyor to tying off and exiting the baling chamber) was 16 minutes per bale. PET bales represented longer baling times (21 minutes), steel and aluminum depicted shorter baling times (12 minutes). The average post installation time to produce a bale using the new baler was 5 minutes per bale. PET averaged 7 minutes per bale and steel and aluminum averaged 4 minutes per bale. The overall improvement to the baling times (production) depicted a reduction in baling time of up to 67% resulting in improved daily processing capacity at the facility. Table 4.5 summarizes the average baling times from the three separate time trials of the pre and post installation periods.
Table 4.5 Summary of Baling Times
Baled Containers
Pre Install Average
Post Install Average
Average Bale Time
Improvement
Bale Time (Minutes) Bale Time (Minutes) (%)
Aluminum Cans 12.24 4.40 63.87 HDPE 16.46 5.23 68.12 Mixed Plastic 17.01 5.53 67.53 PET 21.82 7.19 67.02 Steel 13.54 4.21 68.92 Average 16.21 5.31 67.09

April 2012 County of Northumberland CIF Project #271 10 of 19
The gain in production throughput (baling time) eliminated the requirement of part time baling operations, representing a further savings of approximately $17,000 per year for a total staff savings of $28,300 per year. Table 4.6 depicts the annual savings in staffing costs (non-productive time and part time staff) as a result of the new baler installation. Table 4.6 Operational Cost Savings
Activity Estimated Hours
per year Cost per Hour Annual Savings
Non-Productive Baling Time 347 $32.59 $11,308.73
Part-Time Baler Operator 830 $20.48 $16,998.40
Total $28,307.13

April 2012 County of Northumberland CIF Project #271 11 of 19
8.0 Conclusions The County of Northumberland has seen an increase in baling efficiency by an annual savings of $70,600 per year. This has been achieved by averaging 67% faster bale times, increasing average bale densities by up to 71% and a reduction in downtime. The payback period for the capital investment of the new container baler for the County of Northumberland is 3.3 years. Table 4.7 depicts a summary of the annual savings gained by the County as a result of the new baler installation. Table 4.7 Summary of Annual Savings
Activity Annual Savings Non-Productive Baling Time $ 11,308.00 Part-Time Baler Operator $ 16,998.00 Additional Revenue $ 17,359.00 Annual Baler Maintenance $ 25,000.00
Annual Savings $ 70,665.00 Table 4.8 summarizes the payback period including the financial assistance from CIF. Table 4.8 Return on Investment (ROI)
Activity Annual Savings Baler $ 330,639 Conveyor $ 100,000 Installation $ 15,000 Total Capital Investment $ 445,639 CIF Funding $ 213,205 Annual Savings $ 70,665 ROI with CIF Funding (Years) 3.3

April 2012 County of Northumberland CIF Project #271 12 of 19
Appendix 1 Baler Specification Sheet
April 2012 County of Northumberland CIF Project #271 13 of 19

April 2012 County of Northumberland CIF Project #271 14 of 19

April 2012 County of Northumberland CIF Project #271 15 of 19

April 2012 County of Northumberland CIF Project #271 16 of 19
Appendix 2
Baler Weights and Time Trials

April 2012 County of Northumberland CIF Project #271 17 of 19
Pre-Installation Bale Weights (2010) Pre Installation Bale Weight
(Kg) Bales Per
Trailer Trailer Load
(Kg)
Jun-10 PET 334 52 17,390 HDPE 363 48 17,460 Mixed 400 44 17,630 Aluminum 502 30 15,080 Steel 948 25 23,700
Pre Installation Bale Weight (Kg)
Bales Per Trailer
Trailer Load (Kg)
Jul-10 PET 326 52 16,960 HDPE 367 48 17,656 Mixed 408 44 17,952 Aluminum 498 32 15,960 Steel 937 23 21,570
Pre Installation Bale Weight (Kg)
Bales Per Trailer
Trailer Load (Kg)
Aug-10 PET 344 52 17,920 HDPE 368 48 17,710 Mixed 401 44 17,644 Aluminum 514 31 15,440 Steel 994 24 23,870
Pre Installation Average Bale Weights (Kg)
Average Bales Per
Trailer
Average Trailer Load
(Kg)
Average Bale Density (Kg/ft3)
Summary PET 335 52 17,423 9.71 HDPE 366 48 17,578 7.79 Mixed Plastics 403 44 17,791 8.6 Aluminum 505 31 15,493 6.87 Steel 960 24 23,047 13.52
April 2012 County of Northumberland CIF Project #271 18 of 19
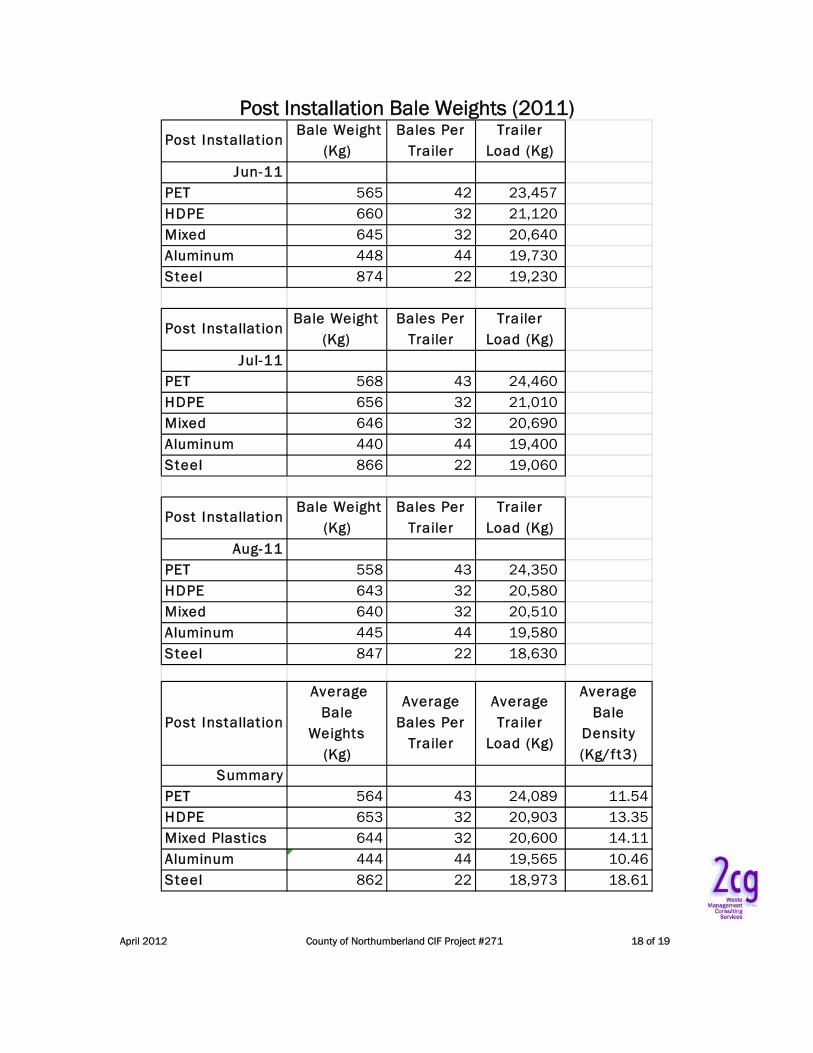
Post Installation Bale Weights (2011) Post Installat ion
Bale Weight (Kg)
Bales Per Trailer
Trailer Load (Kg)
Jun-11PET 565 42 23,457 HDPE 660 32 21,120 Mixed 645 32 20,640 Aluminum 448 44 19,730 Steel 874 22 19,230
Post Installat ionBale Weight
(Kg)Bales Per
TrailerTrailer
Load (Kg)Jul-11
PET 568 43 24,460 HDPE 656 32 21,010 Mixed 646 32 20,690 Aluminum 440 44 19,400 Steel 866 22 19,060
Post Installat ion Bale Weight
(Kg)Bales Per
TrailerTrailer
Load (Kg)Aug-11
PET 558 43 24,350 HDPE 643 32 20,580 Mixed 640 32 20,510 Aluminum 445 44 19,580 Steel 847 22 18,630
Post Installat ion
Average Bale
Weights (Kg)
Average Bales Per
Trailer
Average Trailer
Load (Kg)
Average Bale
Density (Kg/ft3)
SummaryPET 564 43 24,089 11.54HDPE 653 32 20,903 13.35Mixed Plast ics 644 32 20,600 14.11Aluminum 444 44 19,565 10.46Steel 862 22 18,973 18.61

April 2012 County of Northumberland CIF Project #271 19 of 19
Time Trials (Pre and Post Installation)
Baled Containers
Pre Installation Oct. 2011
Post Installation Feb. 2012
Bale Time Improvement
Bale Time (Minutes) Bale Time (Minutes) (%)
Aluminium Cans 11.2 4.55 59.38
HDPE 15.23 5.2 65.86
Mixed Plastic 16.2 5.23 67.72
PET 20.23 7.12 64.80
Steel 13.05 4.25 67.43
Average 15.18 5.27 65.04
Baled Containers
Pre Installation Nov. 2011
Post Install Mar. 2012
Bale Time Improvement
Bale Time (Minutes) Bale Time (Minutes) (%)
Aluminium Cans 12.5 4.15 66.80
HDPE 17.59 5.36 69.53
Mixed Plastic 16.37 5.23 68.05
PET 24.12 8.01 66.79
Steel 14.25 4.35 69.47
Average 16.97 5.42 68.13
Baled Containers
Pre Install Dec. 2011
Post Install Mar.12
Bale Time Improvement
Bale Time (Minutes) Bale Time (Minutes) (%)
Aluminium Cans 13.02 4.50 65.44
HDPE 16.56 5.14 68.96
Mixed Plastic 18.45 6.12 66.83
PET 21.12 6.45 69.46
Steel 13.33 4.02 69.84
Average 16.50 5.25 68.11