NASA News release 2011/01/13. NASA : Base Period 1951 - 1980.
CONSUMER PRICE INDEX
(BASE PERIOD NOVEMBER 2009 = 100)
No. 551
FEBRUARY 2016

StatisticalNews
Price Statistics 15 MARCH 2016
The CPI measures the average
change over time in prices of goods
and services consumed by people for
day-to-day living. The construction of
the CPI combines economic theory,
sampling and other statistical
techniques using data from other
surveys to produce a weighted
measure of average price changes in
the Nigerian economy. The weighting
occurs to capture the importance of
the selected commodities in the
entire index. The production of the CPI
requires skills of economists,
statisticians, computer scientists,
data collectors and others.
Key in the construction of the price
index is the selection of the market
basket of goods and services. Every
month, 10,534 informants spread
across the country provide price data
for the computation of the CPI. The
market items currently comprise of
740 goods and services regularly
priced.
The first stage in the calculation of the
CPI is the collection of prices on each
item (740 goods and services) from
outlets in each sector (rural or urban)
for each state. Prices are then
averaged for each item according to
sector across the state. The next step
is to use the average price to calculate
the basic index for each commodity:
The current year price of each
commodity is compared with a base
year’s price to obtain a relative price.
Next we use the Laspeyres formula to
compute an aggregated index for
each class (which has a multitude of
commodities which have similar
consumption purposes): Here the
sum of the product of weights
(obtained from the expenditure
survey) and relative prices for each
item is divided by the sum of the
weight of the items in that class, and
the result multiplied by 100 gives the
required index number. This index
number is still classified according to
the urban or rural classification sector
for each of the 36 states and the FCT.
This yields 85 classes then 48 groups
which are then reclassified into 12
Divisions to derive:
1. The country composite index
2. The Urban National index
3. The Rural National index
4. The Combined Urban and Rural
State Composite index
The survey methodology generates
3774 all items indices for all states
and the FCT.
This edition of the Statistical News
contains the revised Consumer Price
Index (CPI) based on Nigeria Living
Standard Survey (NLSS) 2003/2004.
The consumption expenditure data
were re-valued to November 2009,
which is the base period for the
revised CPI.
The May 2003 and September 1985
based indices are being continued
using factors derived from the new
CPI. All of these indices will yield the
same price change for any commodity
group contained in all the series. A
new sub index – Imported Food Index-
is available in the revised CPI.
Note: The urban and rural indices
were weighted with the ratio of their
populations to the national i.e. 0.455
and 0.545 respectively to compute
the composite indices at the 12
COICOP functions and all items levels.
This may cause variance between a
recalculated all items index using the
BRIEF METHODOLOGY:

StatisticalNews
Price Statistics 15 MARCH 2016
weights published on table 2 and the
published all items index because the
published weights were computed
only from consumption expenditure
survey result. The following
breakdown highlights a non-
exhaustive list of the components of
the current CPI:
FOOD AND NON ALCOHOLIC BEVERAGES
Food
Bread and cereals
Meat
Fish
Milk, cheese and eggs
Oils and fats
Fruit
Vegetables
Potatoes, Yam & other tubers
Food products n.e.c
Coffee, tea and cocoa
Soft drinks
ALCOHOLIC BEVERAGES, TOBACCO AND KOLA
Spirits
Wine
Tobacco
Narcotics
CLOTHING AND FOOTWEAR
Clothing materials, other articles of clothing
Garments
Cleaning, repair and hire of clothing
Shoes and other footwear
Repair and hire of footwear
HOUSING, WATER, ELECTRICITY, GAS
Actual and imputed rentals for housing
Water supply
Miscellaneous services relating to the dwelling
Electricity
Gas
Liquid fuel
Solid fuels
FURNISHINGS, HOUSEHOLD EQUIPMENT
Furniture and furnishings
Carpets and other floor coverings
Repair of Furniture
Household textiles
Major household appliances whether electric or not
Repair of household appliances

StatisticalNews
Price Statistics 15 MARCH 2016
Glassware, tableware and household utensils
Non-durable household goods
Domestic services and household services
HEALTH
Pharmaceutical products
Medical services
Dental services
Paramedical services
Hospital services
TRANSPORT
Motor cars
Motor cycles
Bicycles
Vehicle spare parts
Fuels and lubricants for personal transportation
Maintenance and repair of personal transport
Passenger transport by road
Passenger transport by air
Passenger transport by sea and inland waterways
COMMUNICATION
Postal services
Telephone and telefax equipment
Telephone and telefax services
RECREATION AND CULTURE
Audio-visual, photographic and information processing equipment
Photographic development
Musical instrument
Recreational and sporting services
Games of chance
EDUCATION
Books & stationery
RESTAURANTS AND HOTELS
Catering services
Accommodation services
MISCELLANEOUS GOODS AND SERVICES
Hairdressing salons and personal grooming establishments
Appliances, articles and products for personal care
Jewellery, clocks and watches
Insurance
Other services.

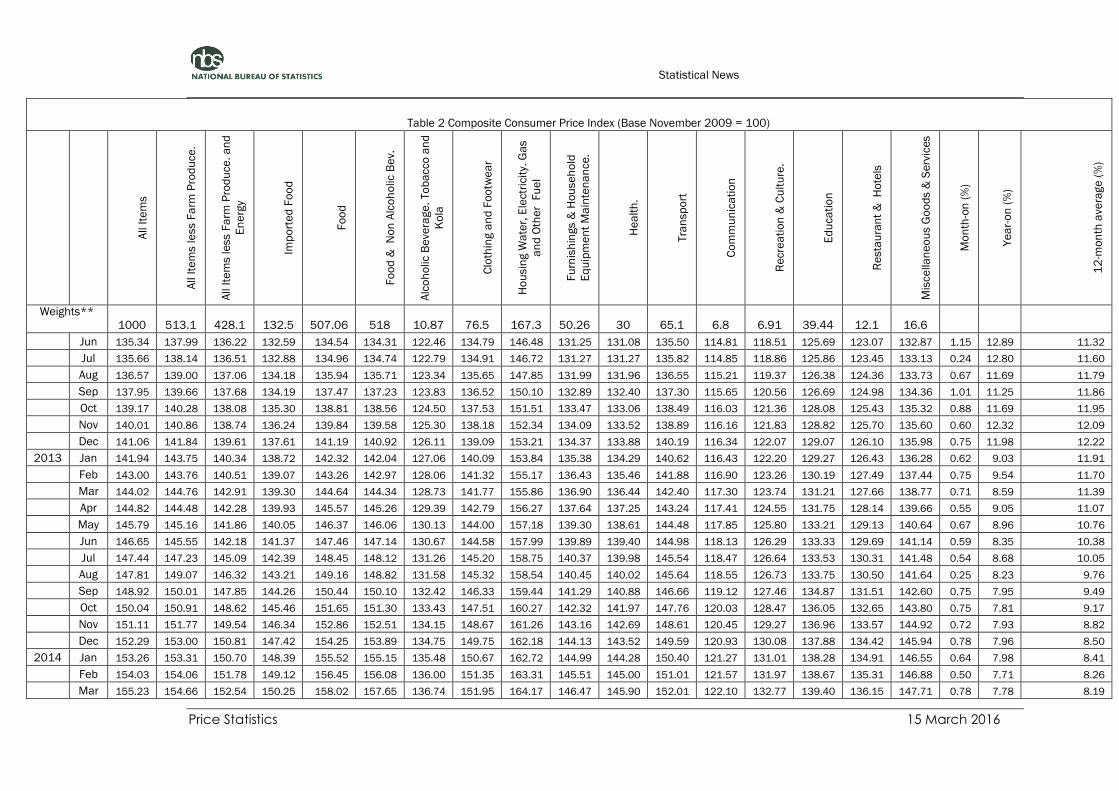
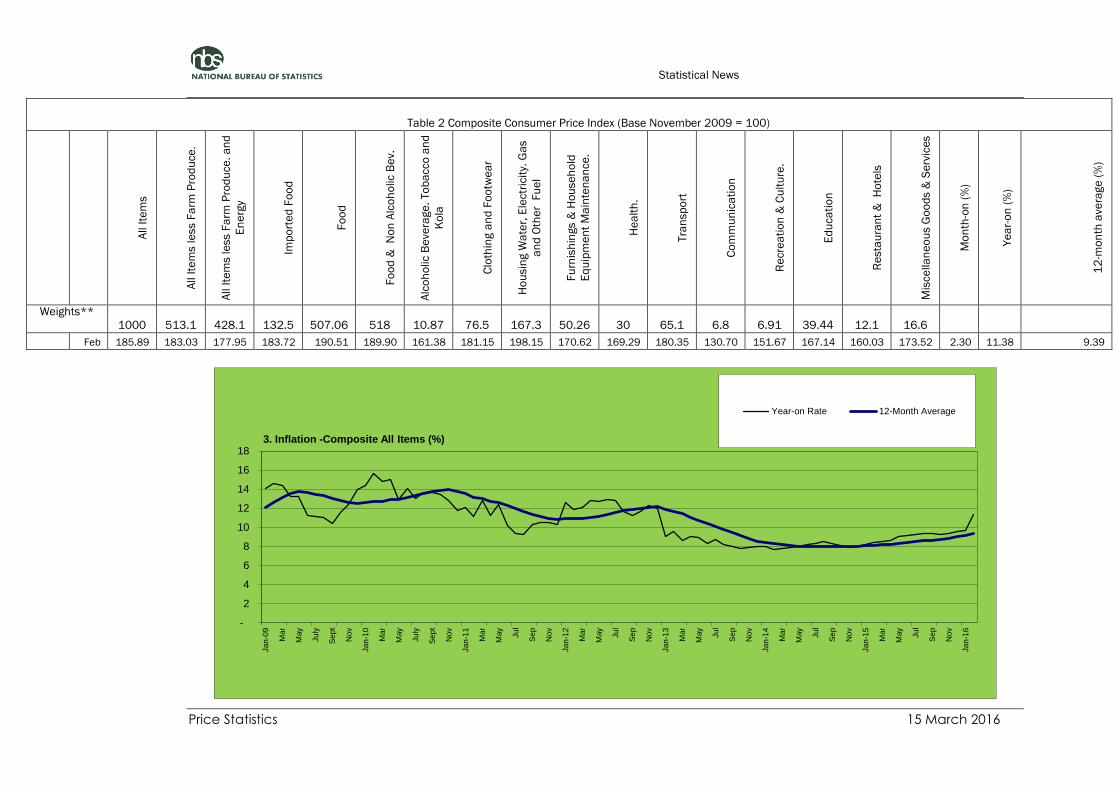
In February, the Consumer Price Index
(CPI) which measures inflation
recorded a significant uptick. The
headline index increased by 11.4%
(year-on-year) in February, roughly
1.76% points higher from rates
recorded in January (9.6%). The faster
pace of increases which led to the
overall increase in the headline index
were recorded across almost all major
divisions which contribute to the
Headline index with the exception of
the Restaurants and Hotels division
which increased, albeit at a slower
pace.
After increasing at the same pace for
two months, the pace of increases of
food prices as recorded by the Food
sub-index increased at faster pace in
February. The Food index increased
by 11.3%, up by 0.71% points from
rates recorded in January. During the
month, all major food groups which
contribute to the Food sub-index
increased at a faster pace during the
month with the exception of the
Potatoes, Yams and Other Tubers;
and Sugar, jam, honey, chocolate and
confectionery groups.
The “All Items less Farm Produce” or
Core sub-index, increased at a faster
pace in February as imported items
as well as other domestic shocks
resulted in ripple effects across many
divisions that contribute to the Core.
The index increased by 11.0% in
February, roughly 2.2% points from
rates recorded in January.
On a month-on-month basis, the
Headline Index increased at a faster
pace in February relative to January.
The index increased by 2.3%, in
February, roughly 1.4% points from
rates recored in January, as all
divisions that contribute to the index
increased with the exception of the
It should be noted that the Headline
Index is made up of the Core Index
and Farm Produce items. As.
Processed Foods are included in both
the Core and Food sub-indices, this
implies that these sub-indices are not
mutually-exclusive.
Restaurants and Hotels division
increasing at a slower pace.
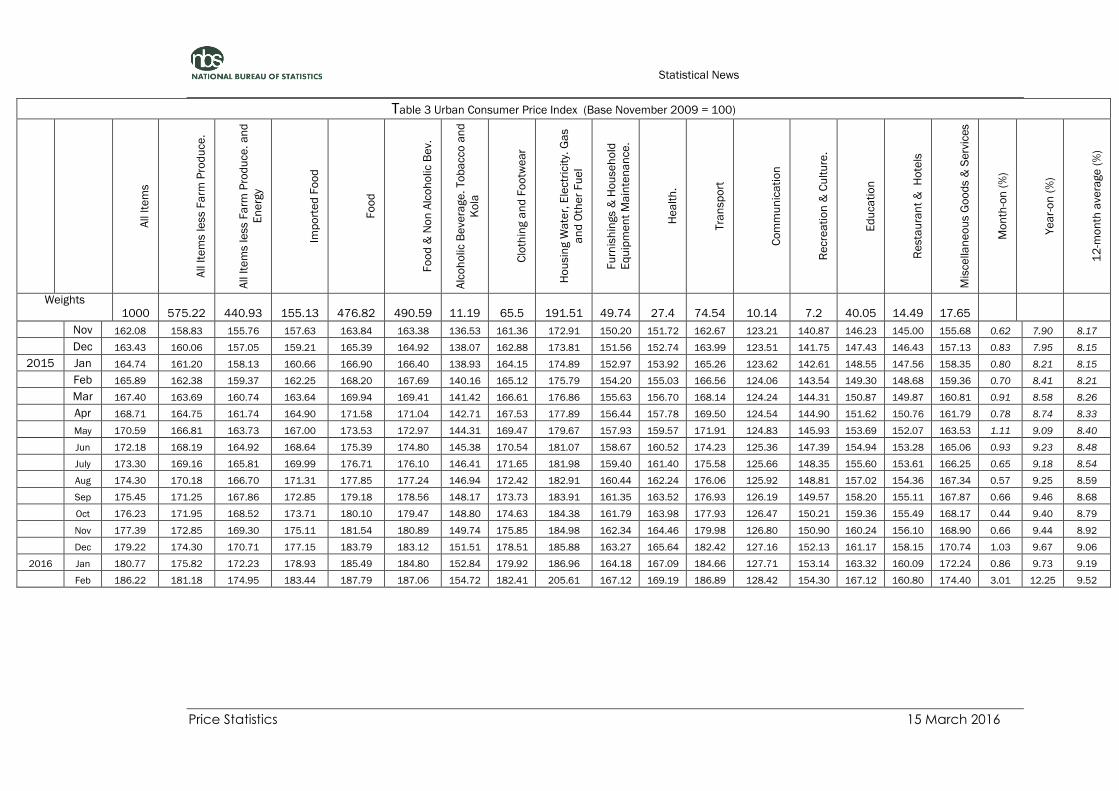
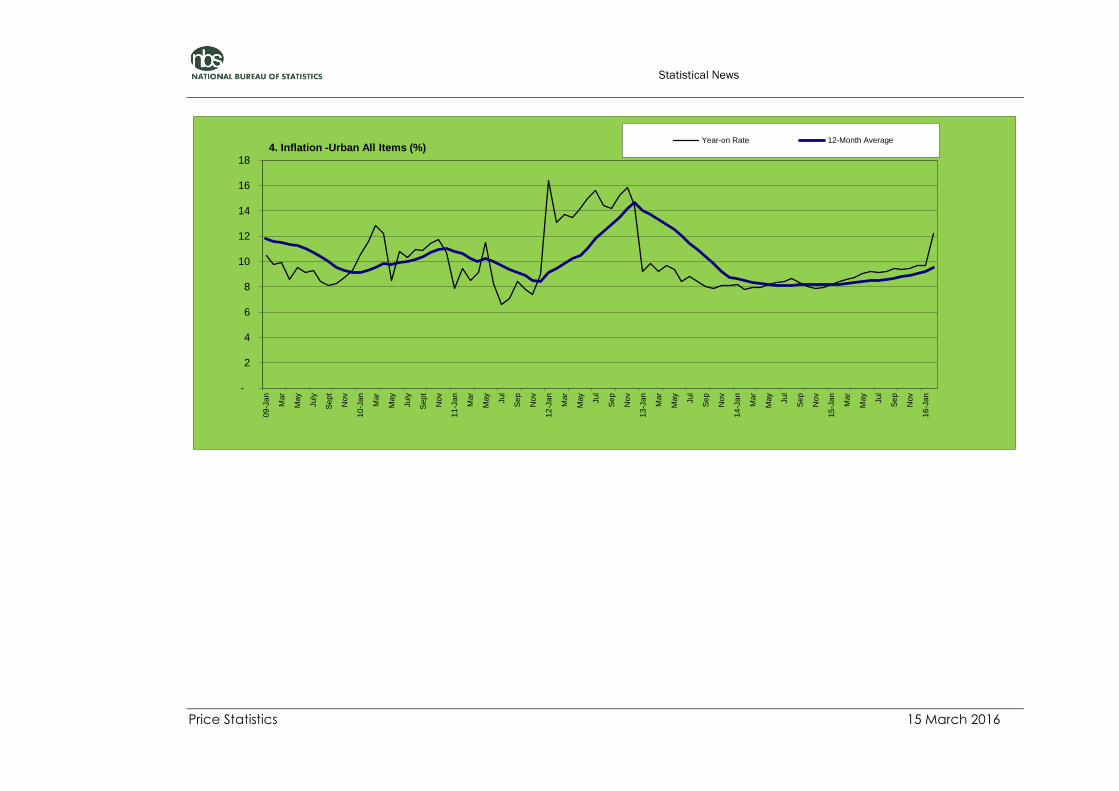
In January, both the Urban and Rural
indices recorded marked increases.
The Urban index rose by 12.3% (year-
on-year) from 9.7% recorded the
month earlier, and the Rural index
increased by 10.7% in February from
9.5% in January. On a month-on-
month basis, both the Urban and
Rural indices increased at a faster
pace, as the Urban index increased by
3.0% in February from 0.9% in
January, while the Rural index index
increased by 1.8% from 0.9% in
January.
The percentage change in the
average composite CPI for the twelve-
month period ending in February
2016 over the average of the CPI for
the previous twelve-month period was
9.4%, higher from 9.1% recorded in
January. The corresponding twelve-
month year-on-year average
percentage change for the Urban
index increased from 9.2% in January
to 9.5% in February, while the
corresponding Rural index also
increased from 9.0% in January to
9.2% in Febuary.
ALL ITEMS INDEX
COMPOSITION OF THE MAJOR
INDEX AND SUB-INDICES
All Items = Farm Produce +
Core index
Food = Farm Produce +
Processed Foods
Core = All Items – Farm
Produce

Imported food items as well as other
necessary inputs to producing key
local stapels such as bread continue
to drive the food index higher. The
Food index increased by 11.3% (Year-
on-year) 0.7% points higher from
rates recorded in January. The highest
price increases were recorded in the
Fish, Vegetables and Bread and
Cereals groups for the second
consecutive month. On a month-on-
month basis, the Food sub-index
increased by 1.4% in February, 0.45%
points higher from rates recorded in
January. All groups which contribute
to the Food Sub-index increased at a
faster pace, with the exceptions of the
Potatoes, Yams and Other Tubers;
Sugar, jam, honey, chocolate and
confectionery; and Milk, Eggs and
Cheese groups. The average annual
rate of change of the Food sub-index
for the twelve-month period ending in
February 2016 over the previous
twelve month average was 10.2%,
0.2%points from the average annual
rate of change recorded in January
(10.0%).
The “All items less Farm Produce” or
Core sub-index, which excludes the
prices of volatile agricultural produce
increased at a faster pace in
February. The index increased by
11.0% during the month, 2.2% points
from 8.8% in January as all key
divisions which contribute to the index
increased at a faster pace with the
exception of the Restaurants and
Hotels division. On a month-on-
month basis, the Core Sub-index
increased at a faster pace in
February, increasing by 2.7% from
0.8% in January. In February, the
highest price increases were recorded
in the Electricity, Books and
Stationery groups, and Liquid Fuels
groups. The average twelve month
annual rate of rise of the index was
recorded at 8.7% for the twelve-
month period ending in February
2016, 0.3% points higher from the
twelve month rate of change recorded
in January.
For enquiries relating to this CPI report, please contact:
[email protected] and [email protected]
Follow us on twitter @nigerianstat and online at www.nigerianstat.gov.ng
FOOD INDEX
ALL ITEMS LESS FARM PRODUCE

Statistical News
Price Statistics 15 March 2016
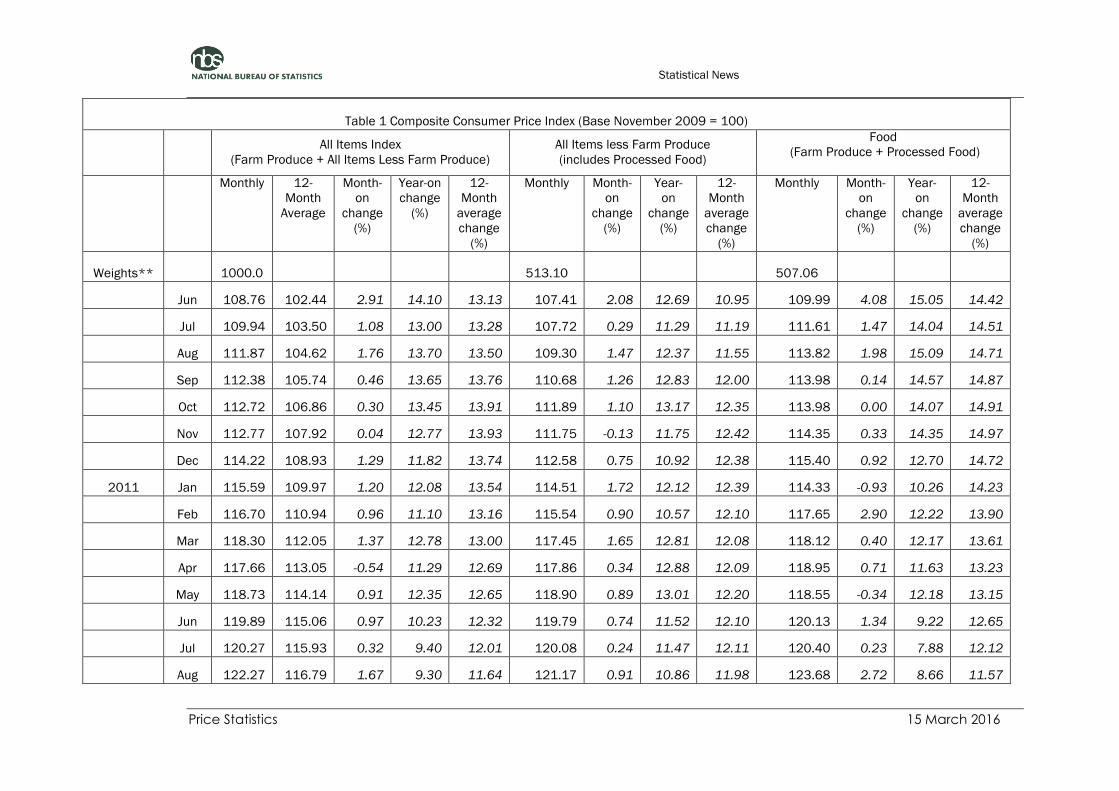
Table 1 Composite Consumer Price Index (Base November 2009 = 100)
All Items Index
(Farm Produce + All Items Less Farm Produce)
All Items less Farm Produce
(includes Processed Food)
Food
(Farm Produce + Processed Food)
Monthly 12-
Month
Average
Month-
on
change
(%)
Year-on
change
(%)
12-
Month
average
change
(%)
Monthly Month-
on
change
(%)
Year-
on
change
(%)
12-
Month
average
change
(%)
Monthly Month-
on
change
(%)
Year-
on
change
(%)
12-
Month
average
change
(%)
Weights** 1000.0 513.10 507.06
2009 Jan 90.15 86.02 0.55 14.03 12.03 91.14 -0.11 8.01 5.52 89.46 0.92 18.44 16.54
Feb 90.83 86.99 0.75 14.58 12.57 91.68 0.60 7.18 5.59 90.22 0.84 20.04 17.45
Mar 91.36 87.94 0.59 14.37 13.10 91.98 0.33 11.84 6.51 90.94 0.81 16.23 17.74
Apr 91.90 88.84 0.59 13.27 13.51 92.52 0.59 10.85 7.30 91.62 0.74 15.34 17.89
May 93.59 89.75 1.84 13.21 13.79 94.19 1.80 9.88 7.85 93.50 2.05 15.74 17.95
June 95.32 90.55 1.85 11.19 13.69 95.32 1.20 8.47 8.26 95.60 2.25 13.14 17.50
July 97.29 91.36 2.07 11.09 13.44 96.80 1.55 8.28 8.55 97.87 2.37 12.87 16.81
Aug 98.39 92.18 1.13 11.05 13.31 97.27 0.49 8.04 8.91 98.90 1.05 12.75 16.28
Sep 98.88 92.95 0.50 10.39 13.07 98.09 0.85 7.43 8.94 99.49 0.60 12.47 15.86
Oct 99.35 93.81 0.48 11.59 12.80 98.87 0.79 8.93 9.02 99.92 0.44 13.52 15.40
Nov 100.00 94.73 0.65 12.37 12.61 100.00 1.14 10.70 9.14 100.00 0.08 13.48 15.02
Dec 102.15 95.77 2.15 13.93 12.54 101.50 1.50 11.25 9.23 102.40 2.40 15.52 14.84
2010 Jan 103.13 96.85 0.96 14.40 12.59 102.14 0.63 12.06 9.57 103.70 1.27 15.92 14.67
Feb 105.04 98.03 1.85 15.65 12.70 104.50 2.32 13.98 10.14 104.84 1.10 16.21 14.41
Mar 104.90 99.16 -0.14 14.81 12.76 104.11 -0.37 13.18 10.27 105.30 0.44 15.79 14.39
Apr 105.72 100.31 0.79 15.04 12.92 104.41 0.28 12.84 10.44 106.56 1.19 16.31 14.49
May 105.68 101.32 -0.04 12.91 12.89 105.22 0.78 11.71 10.60 105.68 -0.83 13.02 14.27
Statistical News
Price Statistics 15 March 2016
Table 1 Composite Consumer Price Index (Base November 2009 = 100)
All Items Index
(Farm Produce + All Items Less Farm Produce)
All Items less Farm Produce
(includes Processed Food)
Food
(Farm Produce + Processed Food)
Monthly 12-
Month
Average
Month-
on
change
(%)
Year-on
change
(%)
12-
Month
average
change
(%)
Monthly Month-
on
change
(%)
Year-
on
change
(%)
12-
Month
average
change
(%)
Monthly Month-
on
change
(%)
Year-
on
change
(%)
12-
Month
average
change
(%)
Weights** 1000.0 513.10 507.06
Jun 108.76 102.44 2.91 14.10 13.13 107.41 2.08 12.69 10.95 109.99 4.08 15.05 14.42
Jul 109.94 103.50 1.08 13.00 13.28 107.72 0.29 11.29 11.19 111.61 1.47 14.04 14.51
Aug 111.87 104.62 1.76 13.70 13.50 109.30 1.47 12.37 11.55 113.82 1.98 15.09 14.71
Sep 112.38 105.74 0.46 13.65 13.76 110.68 1.26 12.83 12.00 113.98 0.14 14.57 14.87
Oct 112.72 106.86 0.30 13.45 13.91 111.89 1.10 13.17 12.35 113.98 0.00 14.07 14.91
Nov 112.77 107.92 0.04 12.77 13.93 111.75 -0.13 11.75 12.42 114.35 0.33 14.35 14.97
Dec 114.22 108.93 1.29 11.82 13.74 112.58 0.75 10.92 12.38 115.40 0.92 12.70 14.72
2011 Jan 115.59 109.97 1.20 12.08 13.54 114.51 1.72 12.12 12.39 114.33 -0.93 10.26 14.23
Feb 116.70 110.94 0.96 11.10 13.16 115.54 0.90 10.57 12.10 117.65 2.90 12.22 13.90
Mar 118.30 112.05 1.37 12.78 13.00 117.45 1.65 12.81 12.08 118.12 0.40 12.17 13.61
Apr 117.66 113.05 -0.54 11.29 12.69 117.86 0.34 12.88 12.09 118.95 0.71 11.63 13.23
May 118.73 114.14 0.91 12.35 12.65 118.90 0.89 13.01 12.20 118.55 -0.34 12.18 13.15
Jun 119.89 115.06 0.97 10.23 12.32 119.79 0.74 11.52 12.10 120.13 1.34 9.22 12.65
Jul 120.27 115.93 0.32 9.40 12.01 120.08 0.24 11.47 12.11 120.40 0.23 7.88 12.12
Aug 122.27 116.79 1.67 9.30 11.64 121.17 0.91 10.86 11.98 123.68 2.72 8.66 11.57

Statistical News
Price Statistics 15 March 2016
Table 1 Composite Consumer Price Index (Base November 2009 = 100)
All Items Index
(Farm Produce + All Items Less Farm Produce)
All Items less Farm Produce
(includes Processed Food)
Food
(Farm Produce + Processed Food)
Monthly 12-
Month
Average
Month-
on
change
(%)
Year-on
change
(%)
12-
Month
average
change
(%)
Monthly Month-
on
change
(%)
Year-
on
change
(%)
12-
Month
average
change
(%)
Monthly Month-
on
change
(%)
Year-
on
change
(%)
12-
Month
average
change
(%)
Weights** 1000.0 513.10 507.06
Sep 124.00 117.76 1.41 10.34 11.36 123.48 1.91 11.57 11.88 124.78 0.89 9.48 11.15
Oct 124.60 118.75 0.49 10.54 11.13 124.80 1.07 11.54 11.75 124.98 0.16 9.66 10.80
Nov 124.65 119.74 0.04 10.54 10.95 124.55 -0.20 11.46 11.72 125.35 0.30 9.62 10.42
Dec 125.97 120.72 1.06 10.28 10.83 124.76 0.17 10.82 11.71 128.12 2.21 11.02 10.30
2012 Jan 130.19 121.94 3.35 12.63 10.89 129.11 3.48 12.75 11.77 129.26 0.89 13.05 10.54
Feb 130.55 123.09 0.28 11.87 10.95 129.30 0.14 11.90 11.87 129.10 -0.13 9.73 10.34
Mar 132.63 124.28 1.59 12.11 10.91 135.06 4.46 15.00 12.07 132.11 2.34 11.85 10.33
Apr 132.80 125.55 0.13 12.87 11.05 135.18 0.09 14.70 12.24 132.33 0.16 11.25 10.30
May 133.80 126.80 0.75 12.69 11.10 136.65 1.08 14.93 12.42 133.89 1.18 12.94 10.39
Jun 135.34 128.09 1.15 12.89 11.32 137.99 0.98 15.20 12.73 134.54 0.48 11.99 10.62
Jul 135.66 129.37 0.24 12.80 11.60 138.14 0.11 15.04 13.03 134.96 0.32 12.09 10.96
Aug 136.57 130.56 0.67 11.69 11.79 139.00 0.62 14.71 13.35 135.94 0.72 9.91 11.06
Sep 137.95 131.73 1.01 11.25 11.86 139.66 0.47 13.10 13.47 137.47 1.12 10.16 11.10
Oct 139.17 132.94 0.88 11.69 11.95 140.28 0.44 12.40 13.53 138.81 0.98 11.06 11.22
Nov 140.01 134.22 0.60 12.32 12.09 140.86 0.41 13.09 13.65 139.84 0.74 11.55 11.37

Statistical News
Price Statistics 15 March 2016
Table 1 Composite Consumer Price Index (Base November 2009 = 100)
All Items Index
(Farm Produce + All Items Less Farm Produce)
All Items less Farm Produce
(includes Processed Food)
Food
(Farm Produce + Processed Food)
Monthly 12-
Month
Average
Month-
on
change
(%)
Year-on
change
(%)
12-
Month
average
change
(%)
Monthly Month-
on
change
(%)
Year-
on
change
(%)
12-
Month
average
change
(%)
Monthly Month-
on
change
(%)
Year-
on
change
(%)
12-
Month
average
change
(%)
Weights** 1000.0 513.10 507.06
Dec 141.06 135.48 0.75 11.98 12.22 141.84 0.70 13.69 13.87 141.19 0.97 10.20 11.30
2013 Jan 141.94 136.46 0.62 9.03 11.91 143.75 1.35 11.34 13.74 142.32 0.80 10.11 11.05
Feb 143.00 137.50 0.75 9.54 11.70 143.76 0.00 11.18 13.66 143.26 0.66 10.97 11.15
Mar 144.02 138.44 0.71 8.59 11.39 144.76 0.70 7.18 12.96 144.64 0.96 9.48 10.95
Apr 144.82 139.45 0.55 9.05 11.07 144.48 -0.20 6.87 12.28 145.57 0.64 10.01 10.84
May 145.79 140.45 0.67 8.96 10.76 145.16 0.47 6.23 11.53 146.37 0.55 9.32 10.55
Jun 146.65 141.39 0.59 8.35 10.38 145.55 0.27 5.47 10.70 147.46 0.75 9.61 10.35
Jul 147.44 142.37 0.54 8.68 10.05 147.23 1.16 6.58 10.01 148.45 0.67 9.99 10.19
Aug 147.81 143.31 0.25 8.23 9.76 149.07 1.25 7.25 9.40 149.16 0.48 9.72 10.17
Sep 148.92 144.22 0.75 7.95 9.49 150.01 0.63 7.41 8.94 150.44 0.86 9.44 10.10
Oct 150.04 145.13 0.75 7.81 9.17 150.91 0.60 7.58 8.55 151.65 0.80 9.25 9.95
Nov 151.11 146.05 0.72 7.93 8.82 151.77 0.57 7.75 8.14 152.86 0.80 9.31 9.77
Dec 152.29 146.99 0.78 7.96 8.50 153.00 0.81 7.87 7.69 154.25 0.91 9.25 9.70
2014 Jan 153.26 147.93 0.64 7.98 8.41 153.31 0.20 6.65 7.32 155.52 0.82 9.27 9.63
Feb 154.03 148.85 0.50 7.71 8.26 154.06 0.49 7.17 7.00 156.45 0.60 9.21 9.48
Mar 155.23 149.78 0.78 7.78 8.19 154.66 0.39 6.84 6.98 158.02 1.00 9.25 9.46
Apr 156.19 150.73 0.62 7.85 8.09 155.32 0.43 7.51 7.03 159.27 0.79 9.41 9.42

Statistical News
Price Statistics 15 March 2016
Table 1 Composite Consumer Price Index (Base November 2009 = 100)
All Items Index
(Farm Produce + All Items Less Farm Produce)
All Items less Farm Produce
(includes Processed Food)
Food
(Farm Produce + Processed Food)
Monthly 12-
Month
Average
Month-
on
change
(%)
Year-on
change
(%)
12-
Month
average
change
(%)
Monthly Month-
on
change
(%)
Year-
on
change
(%)
12-
Month
average
change
(%)
Monthly Month-
on
change
(%)
Year-
on
change
(%)
12-
Month
average
change
(%)
Weights** 1000.0 513.10 507.06
May 157.41 151.70 0.78 7.96 8.01 156.33 0.65 7.69 7.15 160.56 0.81 9.70 9.45
Jun 158.62 152.70 0.77 8.17 8.00 157.37 0.67 8.12 7.37 161.88 0.82 9.78 9.46
Jul 159.65 153.71 0.65 8.28 7.97 157.71 0.22 7.12 7.41 163.11 0.77 9.88 9.46
Aug 160.42 154.76 0.48 8.53 8.00 158.41 0.45 6.26 7.33 164.01 0.55 9.96 9.48
Sep 161.31 155.80 0.55 8.32 8.03 159.43 0.64 6.28 7.23 165.00 0.60 9.68 9.50
Oct 162.13 156.80 0.51 8.06 8.05 160.34 0.58 6.25 7.12 165.82 0.50 9.34 9.51
Nov 163.09 157.80 0.59 7.93 8.05 161.27 0.58 6.26 6.99 166.84 0.62 9.14 9.49
Dec 164.44 158.82 0.82 7.98 8.05 162.53 0.78 6.22 6.85 168.37 0.92 9.15 9.48
2015 Jan 165.77 159.86 0.81 8.16 8.06 163.72 0.73 6.79 6.86 169.85 0.88 9.21 9.47
Feb 166.90 160.93 0.68 8.36 8.12 164.83 0.68 6.99 6.85 171.10 0.74 9.36 9.49
Mar 168.42 162.03 0.91 8.49 8.18 166.19 0.83 7.46 6.91 172.84 1.02 9.38 9.49
Apr 169.71 163.16 0.76 8.66 8.24 167.22 0.62 7.66 6.92 174.39 0.90 9.49 9.50
May 171.58 164.34 1.10 9.00 8.33 169.23 1.20 8.25 6.97 176.27 1.08 9.78 9.51
June 173.17 165.55 0.93 9.17 8.42 170.59 0.80 8.40 7.01 178.13 1.06 10.04 9.53
July 174.37 166.77 0.69 9.22 8.50 171.64 0.61 8.83 7.15 179.50 0.77 10.05 9.55
Aug 175.40 168.02 0.59 9.34 8.57 172.69 0.61 9.01 7.38 180.63 0.63 10.13 9.57
Sep 176.46 169.29 0.61 9.39 8.66 173.66 0.56 8.93 7.61 181.78 0.64 10.17 9.61
Oct 177.20 170.54 0.42 9.30 8.76 174.36 0.40 8.74 7.81 182.61 0.45 10.13 9.68
Nov 178.37 171.81 0.66 9.37 8.88 175.35 0.57 8.73 8.02 184.06 0.79 10.32 9.78
Dec 180.15 173.12 0.99 9.55 9.01 176.71 0.78 8.73 8.22 186.20 1.16 10.59 9.90
2016 Jan 181.71 174.45 0.87 9.62 9.13 178.19 0.84 8.84 8.39 187.92 0.92 10.64 10.02

Statistical News
Price Statistics 15 March 2016
Table 1 Composite Consumer Price Index (Base November 2009 = 100)
All Items Index
(Farm Produce + All Items Less Farm Produce)
All Items less Farm Produce
(includes Processed Food)
Food
(Farm Produce + Processed Food)
Monthly 12-
Month
Average
Month-
on
change
(%)
Year-on
change
(%)
12-
Month
average
change
(%)
Monthly Month-
on
change
(%)
Year-
on
change
(%)
12-
Month
average
change
(%)
Monthly Month-
on
change
(%)
Year-
on
change
(%)
12-
Month
average
change
(%)
Weights** 1000.0 513.10 507.06
Feb 185.89 176.03 2.30 11.38 9.39 183.03 2.72 11.04 8.73 190.51 1.38 11.35 10.18
0
5
10
15
20
25
09
-Ja
n
Ap
r
Ju
l
Oct
10
-Ja
n
Ap
r
Ju
l
Oct
11
-Ja
n
Ap
r
Ju
l
Oct
12
-Ja
n
Ap
r
Ju
l
Oct
13
-Ja
n
Ap
r
Ju
l
Oct
14
-Ja
n
Ap
r
Ju
l
Oct
15
-Ja
n
Ap
r
Ju
l
Oct
16
-Ja
n
1. Inflation: Composite Year-on Change (%)
Food All Items less Farm Produce All Items

Statistical News
Price Statistics 15 March 2016
0
2
4
6
8
10
12
14
16
18
20
09
-Ja
n
Ap
r
Ju
l
Oct
10
-Ja
n
Ap
r
Ju
l
Oct
11
-Ja
n
Ap
r
Ju
l
Oct
12
-Ja
n
Ap
r
Ju
l
Oct
13
-Ja
n
Ap
r
Ju
l
Oct
14
-Ja
n
Ap
r
Ju
l
Oct
15
-Ja
n
Ap
r
Ju
l
Oct
16
-Ja
n
2. Inflation: Composite 12-Month Average Change (%)
Food All Items less Farm Produce All Items
Statistical News
Price Statistics 15 March 2016
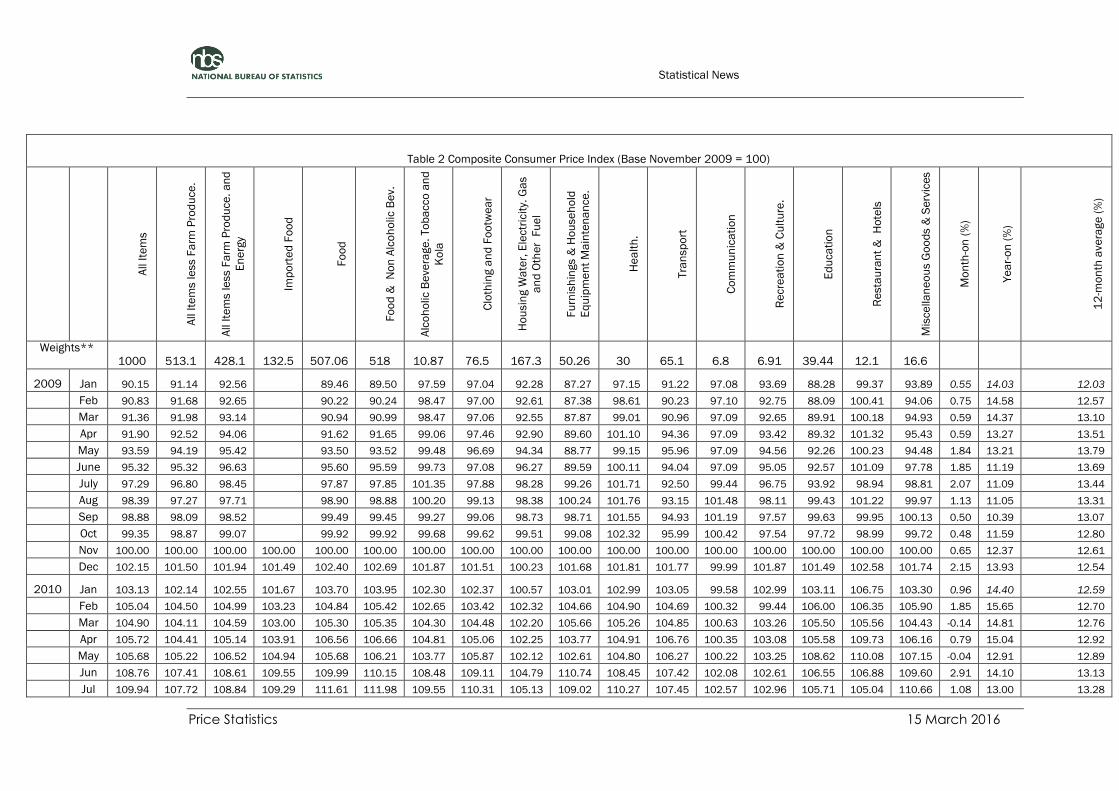
Table 2 Composite Consumer Price Index (Base November 2009 = 100)
All I
tem
s
All I
tem
s le
ss F
arm
Pro
du
ce
.
All I
tem
s le
ss F
arm
Pro
du
ce
. a
nd
En
erg
y
Imp
ort
ed
Fo
od
Fo
od
Fo
od
&
No
n A
lco
ho
lic B
ev.
Alc
oh
olic B
eve
rage
. To
ba
cco
an
d
Ko
la
Clo
thin
g a
nd
Fo
otw
ea
r
Ho
usin
g W
ate
r, E
lectr
icit
y. G
as
an
d O
the
r F
ue
l
Fu
rnis
hin
gs &
Ho
use
ho
ld
Eq
uip
me
nt
Ma
inte
na
nce
.
He
alt
h.
Tra
nsp
ort
Co
mm
un
ica
tio
n
Re
cre
ati
on
& C
ult
ure
.
Ed
uca
tio
n
Re
sta
ura
nt
&
Ho
tels
Mis
ce
lla
ne
ou
s G
oo
ds &
Se
rvic
es
Mo
nth
-on
(%
)
Ye
ar-
on
(%
)
12
-mo
nth
ave
rage
(%
)
Weights**
1000 513.1 428.1 132.5 507.06 518 10.87 76.5 167.3 50.26 30 65.1 6.8 6.91 39.44 12.1 16.6
2009 Jan 90.15 91.14 92.56 89.46 89.50 97.59 97.04 92.28 87.27 97.15 91.22 97.08 93.69 88.28 99.37 93.89 0.55 14.03 12.03
Feb 90.83 91.68 92.65 90.22 90.24 98.47 97.00 92.61 87.38 98.61 90.23 97.10 92.75 88.09 100.41 94.06 0.75 14.58 12.57
Mar 91.36 91.98 93.14 90.94 90.99 98.47 97.06 92.55 87.87 99.01 90.96 97.09 92.65 89.91 100.18 94.93 0.59 14.37 13.10
Apr 91.90 92.52 94.06 91.62 91.65 99.06 97.46 92.90 89.60 101.10 94.36 97.09 93.42 89.32 101.32 95.43 0.59 13.27 13.51
May 93.59 94.19 95.42 93.50 93.52 99.48 96.69 94.34 88.77 99.15 95.96 97.09 94.56 92.26 100.23 94.48 1.84 13.21 13.79
June 95.32 95.32 96.63 95.60 95.59 99.73 97.08 96.27 89.59 100.11 94.04 97.09 95.05 92.57 101.09 97.78 1.85 11.19 13.69
July 97.29 96.80 98.45 97.87 97.85 101.35 97.88 98.28 99.26 101.71 92.50 99.44 96.75 93.92 98.94 98.81 2.07 11.09 13.44
Aug 98.39 97.27 97.71 98.90 98.88 100.20 99.13 98.38 100.24 101.76 93.15 101.48 98.11 99.43 101.22 99.97 1.13 11.05 13.31
Sep 98.88 98.09 98.52 99.49 99.45 99.27 99.06 98.73 98.71 101.55 94.93 101.19 97.57 99.63 99.95 100.13 0.50 10.39 13.07
Oct 99.35 98.87 99.07 99.92 99.92 99.68 99.62 99.51 99.08 102.32 95.99 100.42 97.54 97.72 98.99 99.72 0.48 11.59 12.80
Nov 100.00 100.00 100.00 100.00 100.00 100.00 100.00 100.00 100.00 100.00 100.00 100.00 100.00 100.00 100.00 100.00 100.00 0.65 12.37 12.61
Dec 102.15 101.50 101.94 101.49 102.40 102.69 101.87 101.51 100.23 101.68 101.81 101.77 99.99 101.87 101.49 102.58 101.74 2.15 13.93 12.54
2010 Jan 103.13 102.14 102.55 101.67 103.70 103.95 102.30 102.37 100.57 103.01 102.99 103.05 99.58 102.99 103.11 106.75 103.30 0.96 14.40 12.59
Feb 105.04 104.50 104.99 103.23 104.84 105.42 102.65 103.42 102.32 104.66 104.90 104.69 100.32 99.44 106.00 106.35 105.90 1.85 15.65 12.70
Mar 104.90 104.11 104.59 103.00 105.30 105.35 104.30 104.48 102.20 105.66 105.26 104.85 100.63 103.26 105.50 105.56 104.43 -0.14 14.81 12.76
Apr 105.72 104.41 105.14 103.91 106.56 106.66 104.81 105.06 102.25 103.77 104.91 106.76 100.35 103.08 105.58 109.73 106.16 0.79 15.04 12.92
May 105.68 105.22 106.52 104.94 105.68 106.21 103.77 105.87 102.12 102.61 104.80 106.27 100.22 103.25 108.62 110.08 107.15 -0.04 12.91 12.89
Jun 108.76 107.41 108.61 109.55 109.99 110.15 108.48 109.11 104.79 110.74 108.45 107.42 102.08 102.61 106.55 106.88 109.60 2.91 14.10 13.13
Jul 109.94 107.72 108.84 109.29 111.61 111.98 109.55 110.31 105.13 109.02 110.27 107.45 102.57 102.96 105.71 105.04 110.66 1.08 13.00 13.28

Statistical News
Price Statistics 15 March 2016
Table 2 Composite Consumer Price Index (Base November 2009 = 100)
All I
tem
s
All I
tem
s le
ss F
arm
Pro
du
ce
.
All I
tem
s le
ss F
arm
Pro
du
ce
. a
nd
En
erg
y
Imp
ort
ed
Fo
od
Fo
od
Fo
od
&
No
n A
lco
ho
lic B
ev.
Alc
oh
olic B
eve
rage
. To
ba
cco
an
d
Ko
la
Clo
thin
g a
nd
Fo
otw
ea
r
Ho
usin
g W
ate
r, E
lectr
icit
y. G
as
an
d O
the
r F
ue
l
Fu
rnis
hin
gs &
Ho
use
ho
ld
Eq
uip
me
nt
Ma
inte
na
nce
.
He
alt
h.
Tra
nsp
ort
Co
mm
un
ica
tio
n
Re
cre
ati
on
& C
ult
ure
.
Ed
uca
tio
n
Re
sta
ura
nt
&
Ho
tels
Mis
ce
lla
ne
ou
s G
oo
ds &
Se
rvic
es
Mo
nth
-on
(%
)
Ye
ar-
on
(%
)
12
-mo
nth
ave
rag
e (
%)
Weights**
1000 513.1 428.1 132.5 507.06 518 10.87 76.5 167.3 50.26 30 65.1 6.8 6.91 39.44 12.1 16.6
Aug 111.87 109.30 110.42 109.29 113.82 114.13 112.28 112.78 106.20 110.27 112.32 108.58 100.60 105.02 106.02 107.32 111.16 1.76 13.70 13.50
Sep 112.38 110.68 111.71 113.56 113.98 113.53 108.95 112.41 109.88 112.10 111.97 112.18 101.82 108.37 108.36 107.12 111.74 0.46 13.65 13.76
Oct 112.72 111.89 111.99 114.09 113.98 114.07 111.75 112.82 110.97 113.22 114.78 107.05 102.90 109.57 110.11 108.50 110.64 0.30 13.45 13.91
Nov 112.77 111.75 111.33 115.09 114.35 114.26 112.16 112.01 112.61 113.10 111.11 111.72 102.00 107.76 107.69 108.17 112.80 0.04 12.77 13.93
Dec 114.22 112.58 112.49 115.39 115.40 115.46 111.90 113.66 113.19 113.25 112.75 112.94 102.35 107.76 109.14 109.59 112.06 1.29 11.82 13.74
2011 Jan 115.59 114.51 113.01 96.04 114.33 118.69 110.64 114.40 113.86 113.55 111.35 109.23 103.62 108.35 110.22 110.48 113.15 1.20 12.08 13.54
Feb 116.70 115.54 115.50 124.02 117.65 117.93 113.41 116.04 114.73 115.62 114.66 117.21 104.89 106.30 110.59 112.27 114.18 0.96 11.10 13.16
Mar 118.30 117.45 117.47 119.42 118.12 118.18 112.74 116.54 116.02 115.92 117.53 115.47 105.09 107.36 111.04 112.23 112.77 1.37 12.78 13.00
Apr 117.66 117.86 117.94 119.12 118.95 117.99 114.51 116.18 121.02 115.44 117.20 114.77 105.07 107.06 111.37 113.35 114.73 -0.54 11.29 12.69
May 118.73 118.90 118.98 120.55 118.55 118.49 115.08 118.21 121.18 116.56 116.63 115.74 105.69 107.39 111.90 113.77 115.59 0.91 12.35 12.65
Jun 119.89 119.79 119.81 111.89 120.13 119.54 114.21 118.00 121.58 116.30 119.85 118.48 105.64 107.93 112.20 114.27 117.93 0.97 10.23 12.32
Jul 120.27 120.08 119.85 112.60 120.40 120.23 112.36 117.66 122.47 117.56 118.31 120.73 106.17 111.09 112.64 115.03 119.83 0.32 9.40 12.01
Aug 122.27 121.17 121.08 115.97 123.68 123.40 116.40 118.75 124.51 119.95 120.43 121.94 106.36 109.53 112.90 115.10 121.49 1.67 9.30 11.64
Sep 124.00 123.48 122.67 117.63 124.78 124.23 116.23 119.93 126.10 119.21 122.34 122.28 106.20 109.75 113.77 115.69 121.56 1.41 10.34 11.36
Oct 124.60 124.80 123.95 116.95 124.98 124.28 117.61 120.59 128.50 119.47 121.76 122.20 106.65 117.05 113.96 116.61 121.97 0.49 10.54 11.13
Nov 124.65 124.55 123.49 124.21 125.35 125.12 118.94 121.86 128.08 120.24 122.68 123.29 107.08 115.72 114.17 116.85 125.48 0.04 10.54 10.95
Dec 125.97 124.76 123.63 125.30 128.12 127.78 119.02 122.31 131.91 119.94 122.83 128.74 106.53 113.33 114.60 118.86 122.66 1.06 10.28 10.83
2012 Jan 130.19 129.11 129.22 121.59 129.26 130.83 123.19 121.09 131.77 120.60 122.70 127.83 108.66 114.51 115.04 120.03 125.87 3.35 12.63 10.89
Feb 130.55 129.30 129.37 121.64 129.10 129.08 123.20 121.12 131.83 120.61 122.71 127.85 108.66 114.51 115.06 120.04 125.88 0.28 11.87 10.95
Mar 132.63 135.06 134.49 129.90 132.11 131.91 120.55 133.73 139.70 130.19 129.67 134.41 113.39 116.70 125.60 121.36 131.57 1.59 12.11 10.91
Apr 132.80 135.18 134.70 131.29 132.33 132.13 121.33 134.11 139.51 130.74 130.15 134.63 113.98 117.55 125.01 121.86 132.00 0.13 12.87 11.05
May 133.80 136.65 136.30 132.53 133.89 133.67 121.97 134.67 139.75 131.09 130.78 135.11 114.35 118.43 125.50 122.60 132.56 0.75 12.69 11.10
Statistical News
Price Statistics 15 March 2016
Table 2 Composite Consumer Price Index (Base November 2009 = 100)
All I
tem
s
All I
tem
s le
ss F
arm
Pro
du
ce
.
All I
tem
s le
ss F
arm
Pro
du
ce
. a
nd
En
erg
y
Imp
ort
ed
Fo
od
Fo
od
Fo
od
&
No
n A
lco
ho
lic B
ev.
Alc
oh
olic B
eve
rage
. To
ba
cco
an
d
Ko
la
Clo
thin
g a
nd
Fo
otw
ea
r
Ho
usin
g W
ate
r, E
lectr
icit
y. G
as
an
d O
the
r F
ue
l
Fu
rnis
hin
gs &
Ho
use
ho
ld
Eq
uip
me
nt
Ma
inte
na
nce
.
He
alt
h.
Tra
nsp
ort
Co
mm
un
ica
tio
n
Re
cre
ati
on
& C
ult
ure
.
Ed
uca
tio
n
Re
sta
ura
nt
&
Ho
tels
Mis
ce
lla
ne
ou
s G
oo
ds &
Se
rvic
es
Mo
nth
-on
(%
)
Ye
ar-
on
(%
)
12
-mo
nth
ave
rag
e (
%)
Weights**
1000 513.1 428.1 132.5 507.06 518 10.87 76.5 167.3 50.26 30 65.1 6.8 6.91 39.44 12.1 16.6
Jun 135.34 137.99 136.22 132.59 134.54 134.31 122.46 134.79 146.48 131.25 131.08 135.50 114.81 118.51 125.69 123.07 132.87 1.15 12.89 11.32
Jul 135.66 138.14 136.51 132.88 134.96 134.74 122.79 134.91 146.72 131.27 131.27 135.82 114.85 118.86 125.86 123.45 133.13 0.24 12.80 11.60
Aug 136.57 139.00 137.06 134.18 135.94 135.71 123.34 135.65 147.85 131.99 131.96 136.55 115.21 119.37 126.38 124.36 133.73 0.67 11.69 11.79
Sep 137.95 139.66 137.68 134.19 137.47 137.23 123.83 136.52 150.10 132.89 132.40 137.30 115.65 120.56 126.69 124.98 134.36 1.01 11.25 11.86
Oct 139.17 140.28 138.08 135.30 138.81 138.56 124.50 137.53 151.51 133.47 133.06 138.49 116.03 121.36 128.08 125.43 135.32 0.88 11.69 11.95
Nov 140.01 140.86 138.74 136.24 139.84 139.58 125.30 138.18 152.34 134.09 133.52 138.89 116.16 121.83 128.82 125.70 135.60 0.60 12.32 12.09
Dec 141.06 141.84 139.61 137.61 141.19 140.92 126.11 139.09 153.21 134.37 133.88 140.19 116.34 122.07 129.07 126.10 135.98 0.75 11.98 12.22
2013 Jan 141.94 143.75 140.34 138.72 142.32 142.04 127.06 140.09 153.84 135.38 134.29 140.62 116.43 122.20 129.27 126.43 136.28 0.62 9.03 11.91
Feb 143.00 143.76 140.51 139.07 143.26 142.97 128.06 141.32 155.17 136.43 135.46 141.88 116.90 123.26 130.19 127.49 137.44 0.75 9.54 11.70
Mar 144.02 144.76 142.91 139.30 144.64 144.34 128.73 141.77 155.86 136.90 136.44 142.40 117.30 123.74 131.21 127.66 138.77 0.71 8.59 11.39
Apr 144.82 144.48 142.28 139.93 145.57 145.26 129.39 142.79 156.27 137.64 137.25 143.24 117.41 124.55 131.75 128.14 139.66 0.55 9.05 11.07
May 145.79 145.16 141.86 140.05 146.37 146.06 130.13 144.00 157.18 139.30 138.61 144.48 117.85 125.80 133.21 129.13 140.64 0.67 8.96 10.76
Jun 146.65 145.55 142.18 141.37 147.46 147.14 130.67 144.58 157.99 139.89 139.40 144.98 118.13 126.29 133.33 129.69 141.14 0.59 8.35 10.38
Jul 147.44 147.23 145.09 142.39 148.45 148.12 131.26 145.20 158.75 140.37 139.98 145.54 118.47 126.64 133.53 130.31 141.48 0.54 8.68 10.05
Aug 147.81 149.07 146.32 143.21 149.16 148.82 131.58 145.32 158.54 140.45 140.02 145.64 118.55 126.73 133.75 130.50 141.64 0.25 8.23 9.76
Sep 148.92 150.01 147.85 144.26 150.44 150.10 132.42 146.33 159.44 141.29 140.88 146.66 119.12 127.46 134.87 131.51 142.60 0.75 7.95 9.49
Oct 150.04 150.91 148.62 145.46 151.65 151.30 133.43 147.51 160.27 142.32 141.97 147.76 120.03 128.47 136.05 132.65 143.80 0.75 7.81 9.17
Nov 151.11 151.77 149.54 146.34 152.86 152.51 134.15 148.67 161.26 143.16 142.69 148.61 120.45 129.27 136.96 133.57 144.92 0.72 7.93 8.82
Dec 152.29 153.00 150.81 147.42 154.25 153.89 134.75 149.75 162.18 144.13 143.52 149.59 120.93 130.08 137.88 134.42 145.94 0.78 7.96 8.50
2014 Jan 153.26 153.31 150.70 148.39 155.52 155.15 135.48 150.67 162.72 144.99 144.28 150.40 121.27 131.01 138.28 134.91 146.55 0.64 7.98 8.41
Feb 154.03 154.06 151.78 149.12 156.45 156.08 136.00 151.35 163.31 145.51 145.00 151.01 121.57 131.97 138.67 135.31 146.88 0.50 7.71 8.26
Mar 155.23 154.66 152.54 150.25 158.02 157.65 136.74 151.95 164.17 146.47 145.90 152.01 122.10 132.77 139.40 136.15 147.71 0.78 7.78 8.19

Statistical News
Price Statistics 15 March 2016
Table 2 Composite Consumer Price Index (Base November 2009 = 100)
All I
tem
s
All I
tem
s le
ss F
arm
Pro
du
ce
.
All I
tem
s le
ss F
arm
Pro
du
ce
. a
nd
En
erg
y
Imp
ort
ed
Fo
od
Fo
od
Fo
od
&
No
n A
lco
ho
lic B
ev.
Alc
oh
olic B
eve
rage
. To
ba
cco
an
d
Ko
la
Clo
thin
g a
nd
Fo
otw
ea
r
Ho
usin
g W
ate
r, E
lectr
icit
y. G
as
an
d O
the
r F
ue
l
Fu
rnis
hin
gs &
Ho
use
ho
ld
Eq
uip
me
nt
Ma
inte
na
nce
.
He
alt
h.
Tra
nsp
ort
Co
mm
un
ica
tio
n
Re
cre
ati
on
& C
ult
ure
.
Ed
uca
tio
n
Re
sta
ura
nt
&
Ho
tels
Mis
ce
lla
ne
ou
s G
oo
ds &
Se
rvic
es
Mo
nth
-on
(%
)
Ye
ar-
on
(%
)
12
-mo
nth
ave
rag
e (
%)
Weights**
1000 513.1 428.1 132.5 507.06 518 10.87 76.5 167.3 50.26 30 65.1 6.8 6.91 39.44 12.1 16.6
Apr 156.19 155.32 153.11 151.10 159.27 158.89 137.51 152.66 164.91 147.00 146.32 152.58 122.59 133.55 139.86 136.89 148.38 0.62 7.85 8.09
May 157.41 156.33 154.01 152.37 160.56 160.17 138.30 154.06 166.00 148.24 147.40 153.76 123.09 134.47 140.85 138.07 149.58 0.78 7.96 8.01
Jun 158.62 157.37 154.99 153.43 161.88 161.48 139.33 155.29 167.33 149.30 148.42 154.83 123.71 135.30 141.33 139.17 150.67 0.77 8.17 8.00
Jul 159.65 157.71 155.35 154.00 163.11 162.70 140.24 156.15 168.27 150.32 149.12 155.44 124.06 136.51 141.77 139.93 151.33 0.65 8.28 7.97
Aug 160.42 158.41 156.04 154.88 164.01 163.59 140.96 156.81 168.71 151.10 149.92 156.25 124.23 137.40 142.64 140.51 152.04 0.48 8.53 8.00
Sep 161.31 159.43 157.07 155.97 165.00 164.57 141.76 157.63 169.39 152.17 150.55 156.93 124.56 137.87 143.88 141.30 152.86 0.55 8.32 8.03
Oct 162.13 160.34 157.99 156.95 165.82 165.39 142.61 158.63 170.06 153.10 151.42 157.65 124.91 138.36 145.01 142.35 153.85 0.51 8.06 8.05
Nov 163.09 161.27 158.93 158.02 166.84 166.41 143.37 159.83 170.81 154.21 152.41 158.41 125.27 138.91 146.00 143.25 154.87 0.59 7.93 8.05
Dec 164.44 162.53 160.24 159.45 168.37 167.94 144.74 161.29 171.78 155.47 153.54 159.69 125.48 139.64 146.98 144.59 156.21 0.82 7.98 8.05
2015 Jan 165.77 163.72 161.41 160.84 169.85 169.40 145.66 162.66 172.94 156.89 154.74 160.77 125.64 140.55 148.11 145.80 157.36 0.81 8.16 8.06
Feb 166.90 164.83 162.53 162.31 171.10 170.64 146.73 163.78 173.93 158.00 155.86 161.75 126.06 141.28 149.04 146.86 158.41 0.68 8.36 8.12
Mar 168.42 166.19 163.93 163.65 172.84 172.38 147.92 165.22 175.11 159.49 157.37 163.06 126.27 142.03 150.28 148.04 159.86 0.91 8.49 8.18
Apr 169.71 167.22 164.87 165.01 174.39 173.92 148.90 166.13 176.23 160.34 158.31 164.48 126.54 142.62 150.99 148.92 160.77 0.76 8.66 8.24
May 171.58 169.23 166.75 166.89 176.27 175.79 150.48 168.14 178.24 161.94 160.18 166.52 126.88 143.73 152.69 150.42 162.57 1.10 9.00 8.33
Jun 173.17 170.59 167.95 168.55 178.13 177.63 151.69 169.46 179.54 162.92 161.00 168.35 127.32 145.03 154.02 151.79 164.28 0.93 9.17 8.42
July 174.37 171.64 168.93 169.98 179.50 178.99 152.76 170.69 180.60 163.60 162.02 169.56 127.64 145.95 154.89 152.57 165.30 0.69 9.22 8.50
Aug 175.40 172.69 169.84 171.35 180.63 180.11 153.51 171.56 181.65 164.45 162.79 170.24 127.91 146.29 156.38 153.41 166.30 0.59 9.34 8.57
Sep 176.46 173.66 170.85 172.80 181.78 181.26 154.62 172.64 182.56 165.44 163.67 171.17 128.10 146.91 157.82 154.26 166.91 0.61 9.39 8.66
Oct 177.20 174.36 171.53 173.66 182.61 182.09 155.33 173.51 183.04 165.74 164.13 172.13 128.39 147.50 158.97 154.79 167.49 0.42 9.30 8.76
Nov 178.37 175.35 172.42 175.13 184.06 183.51 156.24 174.71 183.66 166.23 164.63 173.99 128.75 148.16 159.90 155.44 168.36 0.66 9.37 8.88
Dec 180.15 176.71 173.76 177.08 186.20 185.64 157.81 177.06 184.59 167.19 165.79 176.05 129.32 149.44 160.76 157.16 170.29 0.99 9.55 9.01
2016 Jan 181.71 178.19 175.18 178.89 187.92 187.35 159.34 178.61 185.73 168.12 167.24 177.87 129.83 150.39 162.93 158.89 171.88 0.87 9.62 9.13
Statistical News
Price Statistics 15 March 2016
Table 2 Composite Consumer Price Index (Base November 2009 = 100)
All I
tem
s
All I
tem
s le
ss F
arm
Pro
du
ce
.
All I
tem
s le
ss F
arm
Pro
du
ce
. a
nd
En
erg
y
Imp
ort
ed
Fo
od
Fo
od
Fo
od
&
No
n A
lco
ho
lic B
ev.
Alc
oh
olic B
eve
rage
. To
ba
cco
an
d
Ko
la
Clo
thin
g a
nd
Fo
otw
ea
r
Ho
usin
g W
ate
r, E
lectr
icit
y. G
as
an
d O
the
r F
ue
l
Fu
rnis
hin
gs &
Ho
use
ho
ld
Eq
uip
me
nt
Ma
inte
na
nce
.
He
alt
h.
Tra
nsp
ort
Co
mm
un
ica
tio
n
Re
cre
ati
on
& C
ult
ure
.
Ed
uca
tio
n
Re
sta
ura
nt
&
Ho
tels
Mis
ce
lla
ne
ou
s G
oo
ds &
Se
rvic
es
Mo
nth
-on
(%
)
Ye
ar-
on
(%
)
12
-mo
nth
ave
rag
e (
%)
Weights**
1000 513.1 428.1 132.5 507.06 518 10.87 76.5 167.3 50.26 30 65.1 6.8 6.91 39.44 12.1 16.6
Feb 185.89 183.03 177.95 183.72 190.51 189.90 161.38 181.15 198.15 170.62 169.29 180.35 130.70 151.67 167.14 160.03 173.52 2.30 11.38 9.39
-
2
4
6
8
10
12
14
16
18
Ja
n-0
9
Mar
May
Ju
ly
Se
pt
Nov
Ja
n-1
0
Mar
May
Ju
ly
Se
pt
Nov
Ja
n-1
1
Mar
May
Ju
l
Se
p
Nov
Ja
n-1
2
Mar
May
Ju
l
Se
p
Nov
Ja
n-1
3
Mar
May
Ju
l
Se
p
Nov
Ja
n-1
4
Mar
May
Ju
l
Se
p
Nov
Ja
n-1
5
Mar
May
Ju
l
Se
p
Nov
Ja
n-1
6
3. Inflation -Composite All Items (%)
Year-on Rate 12-Month Average

Statistical News
Price Statistics 15 March 2016
Table 3 Urban Consumer Price Index (Base November 2009 = 100)
All I
tem
s
All I
tem
s le
ss F
arm
Pro
du
ce
.
All I
tem
s le
ss F
arm
Pro
du
ce
. a
nd
En
erg
y
Imp
ort
ed
Fo
od
Fo
od
Fo
od
& N
on
Alc
oh
olic B
ev.
Alc
oh
olic B
eve
rage
. To
ba
cco
an
d
Ko
la
Clo
thin
g a
nd
Fo
otw
ea
r
Ho
usin
g W
ate
r, E
lectr
icit
y. G
as
an
d O
the
r F
ue
l
Fu
rnis
hin
gs &
Ho
use
ho
ld
Eq
uip
me
nt
Ma
inte
na
nce
.
He
alt
h.
Tra
nsp
ort
Co
mm
un
ica
tio
n
Re
cre
ati
on
& C
ult
ure
.
Ed
uca
tio
n
Re
sta
ura
nt
&
Ho
tels
Mis
ce
lla
ne
ou
s G
oo
ds &
Se
rvic
es
Mo
nth
-on
(%
)
Ye
ar-
on
(%
)
12
-mo
nth
ave
rage
(%
)
Weights
1000 575.22 440.93 155.13 476.82 490.59 11.19 65.5 191.51 49.74 27.4 74.54 10.14 7.2 40.05 14.49 17.65
2009 Jan 92.81 96.59 97.75 90.49 90.54 97.63 97.80 96.37 96.26 96.28 94.00 99.30 97.80 92.27 102.03 95.97 0.04 10.44 11.84
Feb 93.56 96.30 97.58 91.99 92.04 98.60 98.20 95.48 96.22 98.14 93.00 99.30 97.77 90.92 103.17 95.25 0.81 9.77 11.56
Mar 93.90 96.51 98.02 92.37 92.44 98.83 97.89 95.53 96.52 98.29 94.11 99.30 96.72 92.98 104.15 95.14 0.36 9.91 11.54
Apr 94.34 97.36 98.83 92.55 92.62 99.92 98.62 96.39 97.99 99.65 95.74 99.30 97.80 89.74 104.41 95.63 0.47 8.62 11.32
May 95.67 98.22 98.69 94.08 94.13 100.07 96.89 98.07 96.19 97.95 97.11 99.30 98.94 96.34 104.17 98.22 1.42 9.55 11.25
Jun
e 97.24 98.76 99.66 96.27 96.32 100.65 97.04 98.55 97.35 99.34 96.67 99.30 99.88 96.67 106.18 98.06 1.63 9.17 11.04
July 98.87 99.46 100.32 98.36 98.40 102.14 99.86 100.16 98.78 100.85 95.65 100.84 100.08 97.57 100.09 98.54 1.68 9.32 10.74
Aug 99.61 99.72 99.42 99.28 99.31 100.66 99.86 100.62 99.67 100.33 95.10 102.11 101.21 97.44 105.17 99.86 0.74 8.40 10.42
Sep 99.77 99.50 99.16 99.81 99.82 99.82 99.69 100.31 101.12 98.80 95.97 101.51 100.47 99.48 99.68 100.80 0.16 8.07 9.97
Oct 99.76 99.87 99.31 99.61 99.62 99.79 100.33 100.79 100.92 99.95 96.79 100.93 100.06 98.95 97.97 100.66 0.00 8.30 9.54
Nov 100.00 100.00 100.00 100.00 100.00 100.00 100.00 100.00 100.00 100.00 100.00 100.00 100.00 100.00 100.00 100.00 100.00 0.24 8.78 9.28
Dec 101.40 101.31 101.76 100.54 101.61 101.69 99.94 100.88 101.42 100.81 101.55 101.96 99.22 104.24 100.74 103.23 101.55 1.40 9.30 9.12
2010 Jan 102.59 102.46 102.68 101.06 102.83 102.84 100.73 103.08 102.61 101.93 102.42 103.47 99.71 105.77 102.53 108.25 102.84 1.17 10.53 9.14
Feb 104.40 105.38 105.39 103.10 102.91 103.63 101.64 103.60 104.44 103.60 105.37 103.94 100.07 99.38 107.98 106.73 106.27 1.76 11.58 9.30
Mar 105.98 105.74 105.93 103.51 106.14 105.93 103.80 105.91 104.82 106.09 106.83 108.08 100.89 107.09 106.80 107.46 106.09 1.51 12.86 9.56
Apr 105.89 105.41 105.64 103.44 106.30 106.06 103.87 105.98 103.93 105.49 106.86 106.71 100.77 108.29 106.61 111.51 107.00 -0.09 12.24 9.86
May 103.83 103.70 104.87 104.46 103.84 104.65 101.98 104.71 99.18 103.02 104.10 105.89 101.19 105.01 105.75 109.31 104.83 -1.94 8.52 9.77
Jun 107.72 106.99 107.96 109.97 108.50 108.59 106.75 108.72 105.22 108.70 107.89 106.23 103.42 103.98 106.77 108.62 109.27 3.75 10.78 9.90
Jul 109.07 107.91 108.43 109.05 110.39 110.55 109.18 110.42 103.87 108.37 111.56 109.30 103.99 102.80 106.65 106.42 110.57 1.25 10.31 9.99
Aug 110.49 108.95 109.94 111.03 112.77 112.85 109.96 112.10 102.96 110.68 112.96 110.01 100.88 106.37 108.07 111.63 111.67 1.30 10.92 10.20
Sep 110.63 109.41 110.52 112.95 112.62 112.43 106.63 112.39 105.99 110.46 110.04 112.15 101.36 110.09 107.63 107.27 109.24 0.13 10.89 10.43
Oct 111.19 110.01 110.10 114.31 113.46 113.52 109.63 111.56 110.75 109.37 110.76 105.81 101.41 109.02 108.43 105.98 110.82 0.51 11.46 10.69
Nov 111.75 111.29 111.09 113.44 112.76 112.85 110.00 112.20 111.04 111.11 111.84 110.39 101.15 109.68 107.94 107.83 113.08 0.50 11.75 10.93
Dec 112.25 111.17 111.03 113.48 113.42 113.36 109.71 113.78 111.83 111.53 112.91 111.66 100.85 109.18 109.29 111.29 112.71 0.45 10.70 11.04

Statistical News
Price Statistics 15 March 2016
Table 3 Urban Consumer Price Index (Base November 2009 = 100)
All I
tem
s
All I
tem
s le
ss F
arm
Pro
du
ce
.
All I
tem
s le
ss F
arm
Pro
du
ce
. a
nd
En
erg
y
Imp
ort
ed
Fo
od
Fo
od
Fo
od
& N
on
Alc
oh
olic B
ev.
Alc
oh
olic B
eve
rage
. To
ba
cco
an
d
Ko
la
Clo
thin
g a
nd
Fo
otw
ea
r
Ho
usin
g W
ate
r, E
lectr
icit
y. G
as
an
d O
the
r F
ue
l
Fu
rnis
hin
gs &
Ho
use
ho
ld
Eq
uip
me
nt
Ma
inte
na
nce
.
He
alt
h.
Tra
nsp
ort
Co
mm
un
ica
tio
n
Re
cre
ati
on
& C
ult
ure
.
Ed
uca
tio
n
Re
sta
ura
nt
&
Ho
tels
Mis
ce
lla
ne
ou
s G
oo
ds &
Se
rvic
es
Mo
nth
-on
(%
)
Ye
ar-
on
(%
)
12
-mo
nth
ave
rage
(%
)
Weights
1000 575.22 440.93 155.13 476.82 490.59 11.19 65.5 191.51 49.74 27.4 74.54 10.14 7.2 40.05 14.49 17.65
2011 Jan 110.67 108.52 105.96 67.19 111.70 116.52 107.80 114.90 110.79 112.37 111.65 108.28 105.83 108.12 111.17 113.25 111.57 -1.40 7.88 10.81
Feb 114.24 114.13 114.36 117.57 115.51 115.16 110.25 115.13 115.51 114.44 118.61 111.63 101.90 103.74 111.66 114.88 114.59 3.22 9.43 10.62
Mar 114.98 114.88 114.17 118.03 115.96 116.26 109.84 115.69 118.24 115.12 120.51 111.93 101.83 105.12 111.60 115.93 113.84 0.65 8.50 10.26
Apr 115.53 116.28 116.15 114.89 116.39 115.46 112.29 116.27 116.09 114.77 117.78 112.23 102.48 106.12 111.60 115.11 115.49 0.48 9.11 10.01
May 115.77 116.84 116.74 116.00 116.67 116.21 112.85 117.22 115.98 116.38 120.06 116.18 102.78 105.64 111.69 115.94 114.66 0.21 11.50 10.25
Jun 116.64 116.65 116.26 112.40 117.97 117.21 112.12 117.23 116.33 115.36 121.10 116.51 102.02 106.47 111.71 116.84 114.71 0.75 8.28 10.03
Jul 116.28 116.77 115.56 111.77 118.05 117.57 112.18 117.43 118.28 116.74 118.79 119.04 103.35 104.92 112.50 117.32 115.83 -0.31 6.61 9.71
Aug 118.29 118.67 117.81 113.42 119.86 119.13 113.81 117.93 119.91 119.73 121.11 122.07 103.43 107.89 112.59 116.12 116.86 1.73 7.06 9.38
Sep 119.97 121.32 119.56 115.52 120.68 119.75 114.14 118.37 124.85 120.22 123.56 121.34 103.72 108.22 113.21 117.67 117.18 1.42 8.44 9.18
Oct 119.87 121.18 119.15 115.53 120.91 119.98 114.56 119.13 125.57 120.30 121.69 121.25 104.26 111.06 113.22 118.80 116.67 -0.09 7.80 8.88
Nov 119.98 121.12 118.93 118.97 120.85 119.75 115.51 120.93 125.14 119.73 123.31 122.84 104.96 108.61 113.69 118.98 120.47 0.09 7.36 8.52
Dec 122.34 122.00 119.60 121.12 124.52 123.82 115.19 120.19 128.04 119.20 122.14 128.17 104.63 107.89 114.60 121.11 117.37 1.97 8.99 8.40
2012 Jan 128.87 128.21 127.40 113.45 125.46 127.09 119.33 119.67 135.40 120.61 123.28 127.44 105.86 108.92 114.86 123.37 119.92 5.34 16.45 9.12
Feb 129.23 128.41 127.55 113.50 126.26 126.22 119.33 119.69 135.48 120.62 123.29 127.47 105.86 108.92 114.88 123.37 119.92 0.28 13.12 9.44
Mar 130.74 132.57 132.06 129.47 129.08 128.92 113.18 135.16 136.90 127.35 128.98 137.60 110.55 115.11 124.24 122.92 131.41 1.17 13.70 9.89
Apr 131.07 132.98 132.58 130.72 129.37 129.21 114.59 136.31 136.95 128.09 129.35 137.58 111.10 116.40 124.44 123.07 132.27 0.25 13.45 10.26
May 132.12 133.96 133.63 132.08 131.09 130.89 115.50 136.79 137.16 128.42 130.09 138.16 111.75 117.76 125.32 123.52 132.98 0.81 14.13 10.50
Jun 134.15 135.84 133.97 132.06 131.43 131.26 116.09 137.04 146.51 128.30 130.43 138.29 112.14 117.62 125.46 123.72 133.39 1.53 15.01 11.06
Jul 134.45 135.48 133.62 132.39 131.72 131.56 116.38 137.01 146.91 128.47 130.79 138.67 112.19 118.35 125.88 124.18 133.63 0.23 15.63 11.81
Aug 135.39 136.72 134.31 133.76 132.52 132.35 117.02 137.90 148.34 129.48 131.54 139.64 112.60 119.25 126.07 126.04 134.80 0.70 14.46 12.42
Sep 136.96 137.66 135.40 133.93 134.15 133.97 117.34 138.91 151.07 130.33 132.30 140.37 113.29 121.01 126.60 126.24 136.09 1.16 14.16 12.89
Oct 138.16 138.31 135.64 134.48 135.30 135.10 117.61 139.67 152.91 131.22 132.99 141.55 113.65 121.93 127.93 126.85 136.86 0.87 15.26 13.51
Nov 138.98 138.89 136.05 134.55 136.19 135.97 118.07 140.07 154.18 131.78 133.25 142.12 113.69 122.81 128.61 127.16 136.96 0.59 15.84 14.20

Statistical News
Price Statistics 15 March 2016
Table 3 Urban Consumer Price Index (Base November 2009 = 100)
All I
tem
s
All I
tem
s le
ss F
arm
Pro
du
ce
.
All I
tem
s le
ss F
arm
Pro
du
ce
. a
nd
En
erg
y
Imp
ort
ed
Fo
od
Fo
od
Fo
od
& N
on
Alc
oh
olic B
ev.
Alc
oh
olic B
eve
rage
. To
ba
cco
an
d
Ko
la
Clo
thin
g a
nd
Fo
otw
ea
r
Ho
usin
g W
ate
r, E
lectr
icit
y. G
as
an
d O
the
r F
ue
l
Fu
rnis
hin
gs &
Ho
use
ho
ld
Eq
uip
me
nt
Ma
inte
na
nce
.
He
alt
h.
Tra
nsp
ort
Co
mm
un
ica
tio
n
Re
cre
ati
on
& C
ult
ure
.
Ed
uca
tio
n
Re
sta
ura
nt
&
Ho
tels
Mis
ce
lla
ne
ou
s G
oo
ds &
Se
rvic
es
Mo
nth
-on
(%
)
Ye
ar-
on
(%
)
12
-mo
nth
ave
rage
(%
)
Weights
1000 575.22 440.93 155.13 476.82 490.59 11.19 65.5 191.51 49.74 27.4 74.54 10.14 7.2 40.05 14.49 17.65
Dec 140.03 139.80 136.87 136.74 137.58 137.35 118.76 141.15 155.10 132.05 133.56 143.15 113.83 122.84 129.03 127.28 137.21 0.76 14.46 14.64
2013 Jan 140.75 142.34 137.91 137.84 138.64 138.40 120.05 141.83 155.42 132.36 134.00 143.61 113.92 122.94 129.36 127.46 137.63 0.52 9.22 14.01
Feb 141.96 142.35 137.91 137.85 139.86 139.61 120.96 143.04 156.70 133.28 135.29 144.91 114.35 124.06 130.50 128.62 138.91 0.86 9.85 13.70
Mar 142.84 141.99 139.30 138.47 140.72 140.47 121.68 143.95 157.55 134.23 136.29 145.87 114.89 124.84 131.49 129.11 140.04 0.62 9.25 13.30
Apr 143.72 142.58 140.13 138.60 141.97 141.70 122.47 144.73 158.32 134.64 136.69 146.27 114.96 125.38 131.60 129.26 140.30 0.62 9.66 12.97
May 144.53 142.68 138.72 139.03 142.73 142.46 122.91 145.81 158.84 135.62 137.80 147.32 115.50 126.35 132.81 130.43 141.56 0.56 9.39 12.56
Jun 145.47 143.13 139.09 140.38 143.89 143.59 123.65 146.53 159.90 135.91 138.62 148.13 115.69 126.63 132.96 131.29 142.12 0.65 8.44 12.00
Jul 146.35 145.40 142.90 141.45 144.96 144.67 123.94 147.16 160.80 136.55 139.24 148.92 116.08 127.18 133.16 131.75 142.41 0.60 8.85 11.44
Aug 146.81 147.67 144.13 142.64 145.80 145.49 124.15 147.25 160.82 136.65 139.26 149.10 116.23 127.22 133.34 132.12 142.67 0.31 8.43 10.95
Sep 147.94 147.73 145.34 143.73 147.07 146.75 125.29 148.49 161.70 137.62 140.21 150.19 116.80 128.40 134.50 133.17 143.72 0.77 8.01 10.44
Oct 149.07 148.62 145.96 144.96 148.31 147.99 126.15 149.81 162.59 138.45 141.36 151.35 117.69 129.47 135.61 134.44 144.98 0.77 7.90 9.85
Nov 150.22 149.40 146.73 145.84 149.58 149.25 127.04 151.05 163.78 139.01 142.05 152.38 118.11 130.34 136.69 135.43 145.85 0.77 8.09 9.24
Dec 151.40 150.39 147.75 146.72 151.00 150.65 127.64 152.19 164.85 139.76 142.74 153.43 118.65 131.14 137.72 135.89 146.76 0.79 8.12 8.75
2014 Jan 152.24 150.67 147.64 147.71 152.28 151.92 128.39 153.03 165.19 140.73 143.38 153.64 118.66 131.74 137.76 136.10 147.06 0.56 8.16 8.66
Feb 153.02 151.56 148.86 148.58 153.21 152.84 128.90 153.64 165.85 141.09 144.39 154.39 119.18 132.42 138.42 136.49 147.49 0.51 7.79 8.49
Mar 154.17 152.07 149.70 149.75 154.73 154.35 129.60 154.09 166.68 142.10 145.21 155.31 119.86 133.57 139.24 137.39 148.31 0.75 7.94 8.38
Apr 155.14 152.63 150.01 150.66 156.07 155.68 130.46 154.71 167.40 142.68 145.52 155.67 120.21 134.46 139.76 138.42 149.53 0.63 7.95 8.25
May 156.37 153.61 150.81 151.81 157.39 156.99 131.11 156.12 168.51 143.84 146.54 156.94 120.65 135.36 140.69 139.57 150.75 0.79 8.20 8.15
Jun 157.63 154.60 151.81 152.76 158.76 158.35 132.25 157.46 169.84 144.89 147.77 158.03 121.26 136.19 141.30 140.85 151.81 0.81 8.36 8.15
Jul 158.73 155.26 152.26 153.53 160.11 159.67 133.18 158.26 170.69 146.37 148.53 158.93 121.91 138.15 141.95 141.51 152.48 0.70 8.46 8.12
Aug 159.54 156.09 153.06 154.56 161.08 160.64 133.93 158.76 171.15 147.23 149.35 159.92 122.02 139.39 142.77 142.20 153.05 0.51 8.67 8.14
Sep 160.30 156.88 153.80 155.59 161.97 161.52 134.76 159.15 171.61 147.99 149.99 160.85 122.59 139.77 143.92 143.04 153.64 0.48 8.36 8.17
Oct 161.09 157.88 154.76 156.48 162.74 162.29 135.58 160.14 172.27 148.95 150.69 161.68 122.77 140.31 145.22 144.03 154.56 0.50 8.06 8.18
Statistical News
Price Statistics 15 March 2016
Table 3 Urban Consumer Price Index (Base November 2009 = 100)
All I
tem
s
All I
tem
s le
ss F
arm
Pro
du
ce
.
All I
tem
s le
ss F
arm
Pro
du
ce
. a
nd
En
erg
y
Imp
ort
ed
Fo
od
Fo
od
Fo
od
& N
on
Alc
oh
olic B
ev.
Alc
oh
olic B
eve
rage
. To
ba
cco
an
d
Ko
la
Clo
thin
g a
nd
Fo
otw
ea
r
Ho
usin
g W
ate
r, E
lectr
icit
y. G
as
an
d O
the
r F
ue
l
Fu
rnis
hin
gs &
Ho
use
ho
ld
Eq
uip
me
nt
Ma
inte
na
nce
.
He
alt
h.
Tra
nsp
ort
Co
mm
un
ica
tio
n
Re
cre
ati
on
& C
ult
ure
.
Ed
uca
tio
n
Re
sta
ura
nt
&
Ho
tels
Mis
ce
lla
ne
ou
s G
oo
ds &
Se
rvic
es
Mo
nth
-on
(%
)
Ye
ar-
on
(%
)
12
-mo
nth
ave
rage
(%
)
Weights
1000 575.22 440.93 155.13 476.82 490.59 11.19 65.5 191.51 49.74 27.4 74.54 10.14 7.2 40.05 14.49 17.65
Nov 162.08 158.83 155.76 157.63 163.84 163.38 136.53 161.36 172.91 150.20 151.72 162.67 123.21 140.87 146.23 145.00 155.68 0.62 7.90 8.17
Dec 163.43 160.06 157.05 159.21 165.39 164.92 138.07 162.88 173.81 151.56 152.74 163.99 123.51 141.75 147.43 146.43 157.13 0.83 7.95 8.15
2015 Jan 164.74 161.20 158.13 160.66 166.90 166.40 138.93 164.15 174.89 152.97 153.92 165.26 123.62 142.61 148.55 147.56 158.35 0.80 8.21 8.15
Feb 165.89 162.38 159.37 162.25 168.20 167.69 140.16 165.12 175.79 154.20 155.03 166.56 124.06 143.54 149.30 148.68 159.36 0.70 8.41 8.21
Mar 167.40 163.69 160.74 163.64 169.94 169.41 141.42 166.61 176.86 155.63 156.70 168.14 124.24 144.31 150.87 149.87 160.81 0.91 8.58 8.26
Apr 168.71 164.75 161.74 164.90 171.58 171.04 142.71 167.53 177.89 156.44 157.78 169.50 124.54 144.90 151.62 150.76 161.79 0.78 8.74 8.33
May 170.59 166.81 163.73 167.00 173.53 172.97 144.31 169.47 179.67 157.93 159.57 171.91 124.83 145.93 153.69 152.07 163.53 1.11 9.09 8.40
Jun 172.18 168.19 164.92 168.64 175.39 174.80 145.38 170.54 181.07 158.67 160.52 174.23 125.36 147.39 154.94 153.28 165.06 0.93 9.23 8.48
July 173.30 169.16 165.81 169.99 176.71 176.10 146.41 171.65 181.98 159.40 161.40 175.58 125.66 148.35 155.60 153.61 166.25 0.65 9.18 8.54
Aug 174.30 170.18 166.70 171.31 177.85 177.24 146.94 172.42 182.91 160.44 162.24 176.06 125.92 148.81 157.02 154.36 167.34 0.57 9.25 8.59
Sep 175.45 171.25 167.86 172.85 179.18 178.56 148.17 173.73 183.91 161.35 163.52 176.93 126.19 149.57 158.20 155.11 167.87 0.66 9.46 8.68
Oct 176.23 171.95 168.52 173.71 180.10 179.47 148.80 174.63 184.38 161.79 163.98 177.93 126.47 150.21 159.36 155.49 168.17 0.44 9.40 8.79
Nov 177.39 172.85 169.30 175.11 181.54 180.89 149.74 175.85 184.98 162.34 164.46 179.98 126.80 150.90 160.24 156.10 168.90 0.66 9.44 8.92
Dec 179.22 174.30 170.71 177.15 183.79 183.12 151.51 178.51 185.88 163.27 165.64 182.42 127.16 152.13 161.17 158.15 170.74 1.03 9.67 9.06
2016 Jan 180.77 175.82 172.23 178.93 185.49 184.80 152.84 179.92 186.96 164.18 167.09 184.66 127.71 153.14 163.32 160.09 172.24 0.86 9.73 9.19
Feb 186.22 181.18 174.95 183.44 187.79 187.06 154.72 182.41 205.61 167.12 169.19 186.89 128.42 154.30 167.12 160.80 174.40 3.01 12.25 9.52
Statistical News
Price Statistics 15 March 2016
-
2
4
6
8
10
12
14
16
18
09
-Ja
n
Mar
May
Ju
ly
Se
pt
Nov
10
-Ja
n
Mar
May
Ju
ly
Se
pt
Nov
11
-Ja
n
Mar
May
Ju
l
Se
p
No
v
12
-Ja
n
Mar
May
Ju
l
Se
p
Nov
13
-Ja
n
Mar
May
Ju
l
Se
p
Nov
14
-Ja
n
Mar
May
Ju
l
Se
p
Nov
15
-Ja
n
Mar
May
Ju
l
Se
p
Nov
16
-Ja
n
4. Inflation -Urban All Items (%)Year-on Rate 12-Month Average

Statistical News
Price Statistics 15 March 2016
Table 4 Rural Consumer Price Index (Base November 2009 = 100)
All I
tem
s
All I
tem
s le
ss F
arm
Pro
du
ce
.
All I
tem
s le
ss F
arm
Pro
du
ce
. a
nd
En
erg
y
Imp
ort
ed
Fo
od
Fo
od
Fo
od
& N
on
Alc
oh
olic B
ev.
Alc
oh
olic B
eve
rage
. To
ba
cco
an
d
Ko
la
Clo
thin
g a
nd
Fo
otw
ea
r
Ho
usin
g W
ate
r, E
lectr
icit
y. G
as a
nd
Oth
er
Fu
el
Fu
rnis
hin
gs &
Ho
use
ho
ld E
qu
ipm
en
t
Ma
inte
na
nce
.
He
alt
h.
Tra
nsp
ort
Co
mm
un
ica
tio
n
Re
cre
ati
on
& C
ult
ure
.
Ed
uca
tio
n
Re
sta
ura
nt
&
Ho
tels
Mis
ce
lla
ne
ou
s G
oo
ds &
Se
rvic
es
Mo
nth
-on
(%
)
Ye
ar-
on
(%
)
12
-mo
nth
ave
rage
(%
)
Weights
1000.
0
503.1 417.4 113.7 532.3 540.9 10.6 85.7 147.2 50.7 32.2 57.2 4.0 6.7 38.9 10.1 15.8
2009 Jan 88.88 88.54 90.03 89.10 89.13 97.53 96.21 87.15 81.73 97.89 86.56 95.21 91.20 84.46 97.85 92.13 0.79 15.92 12.13
Feb 89.52 89.48 90.24 89.60 89.62 98.30 95.68 89.02 81.93 99.02 85.58 95.24 89.72 85.40 98.83 93.05 0.72 17.15 13.09
Mar 90.16 89.83 90.75 90.45 90.49 98.03 96.14 88.84 82.53 99.63 85.68 95.23 90.20 86.98 97.90 94.74 0.71 16.73 13.91
Apr 90.73 90.21 91.74 91.30 91.32 97.99 96.18 88.53 84.44 102.35 92.04 95.23 90.79 88.92 99.54 95.26 0.64 15.73 14.64
May 92.60 92.26 93.82 93.30 93.31 98.76 96.46 89.68 84.20 100.20 94.04 95.23 91.91 88.37 97.97 91.29 2.06 15.11 15.10
June 94.41 93.67 95.14 95.37 95.34 98.58 97.11 93.43 84.81 100.76 89.65 95.23 92.13 88.65 98.17 97.54 1.95 12.21 15.07
July 96.53 95.52 97.54 97.70 97.66 100.36 95.73 95.94 99.56 102.46 87.23 98.27 94.75 90.44 98.28 99.03 2.25 11.97 14.83
Aug 97.81 96.10 96.87 98.77 98.73 99.65 98.33 95.59 100.59 102.99 89.89 100.95 96.24 101.34 98.95 100.05 1.32 12.38 14.80
Sep 98.46 97.42 98.21 99.38 99.33 98.60 98.36 96.76 97.23 103.93 93.19 100.92 95.81 99.77 100.11 99.56 0.67 11.55 14.66
Oct 99.16 98.39 98.96 100.03 100.02 99.54 98.85 97.91 97.95 104.38 94.64 100.00 96.01 96.55 99.58 98.91 0.71 13.24 14.49
Nov 100.00 100.00 100.00 100.00 100.00 100.00 100.00 100.00 100.00 100.00 100.00 100.00 100.00 100.00 100.00 100.00 100.00 0.85 14.16 14.32
Dec 102.78 101.66 102.09 102.29 103.06 103.53 103.49 102.03 99.24 102.40 102.03 101.61 100.63 99.90 102.11 102.04 101.90 2.78 16.56 14.32
2010 Jan 103.59 101.87 102.45 102.17 104.42 104.87 103.62 101.77 98.87 103.91 103.46 102.70 99.47 100.67 103.59 105.49 103.70 0.78 16.55 14.39
Feb 105.58 103.76 104.66 103.33 106.44 106.92 103.49 103.27 100.55 105.54 104.51 105.32 100.52 99.50 104.34 106.03 105.58 1.92 17.93 14.49
Mar 103.99 102.75 103.47 102.58 104.60 104.86 104.71 103.29 100.02 105.30 103.95 102.14 100.42 100.07 104.42 103.97 103.05 -1.50 15.35 14.40
Apr 105.59 103.56 104.72 106.63 106.78 107.16 105.59 104.29 100.84 102.34 103.29 106.80 100.00 98.73 104.72 108.25 105.46 1.54 16.37 14.47
May 107.23 106.48 107.90 105.35 107.20 107.51 105.26 106.84 104.57 102.26 105.39 106.60 99.41 101.78 111.01 110.72 109.10 1.55 15.79 14.54
Jun 109.63 107.76 109.15 109.20 111.23 111.46 109.92 109.43 104.42 112.44 108.92 108.42 100.96 101.46 106.36 105.43 109.87 2.24 16.13 14.86
Jul 110.66 107.57 109.19 109.48 112.64 113.16 109.85 110.22 106.18 109.56 109.20 105.91 101.39 103.09 104.92 103.88 110.74 0.94 14.63 15.07
Aug 113.02 109.59 110.82 111.36 114.69 115.19 114.21 113.35 108.91 109.93 111.79 107.38 100.38 103.88 104.31 103.73 110.74 2.13 15.56 15.33

Statistical News
Price Statistics 15 March 2016
Table 4 Rural Consumer Price Index (Base November 2009 = 100)
All I
tem
s
All I
tem
s le
ss F
arm
Pro
du
ce
.
All I
tem
s le
ss F
arm
Pro
du
ce
. a
nd
En
erg
y
Imp
ort
ed
Fo
od
Fo
od
Fo
od
& N
on
Alc
oh
olic B
ev.
Alc
oh
olic B
eve
rage
. To
ba
cco
an
d
Ko
la
Clo
thin
g a
nd
Fo
otw
ea
r
Ho
usin
g W
ate
r, E
lectr
icit
y. G
as a
nd
Oth
er
Fu
el
Fu
rnis
hin
gs &
Ho
use
ho
ld E
qu
ipm
en
t
Ma
inte
na
nce
.
He
alt
h.
Tra
nsp
ort
Co
mm
un
ica
tio
n
Re
cre
ati
on
& C
ult
ure
.
Ed
uca
tio
n
Re
sta
ura
nt
&
Ho
tels
Mis
ce
lla
ne
ou
s G
oo
ds &
Se
rvic
es
Mo
nth
-on
(%
)
Ye
ar-
on
(%
)
12
-mo
nth
ave
rage
(%
)
Weights
1000.
0
503.1 417.4 113.7 532.3 540.9 10.6 85.7 147.2 50.7 32.2 57.2 4.0 6.7 38.9 10.1 15.8
Sep 113.84 111.74 112.71 114.06 115.11 114.45 110.89 112.43 113.12 113.46 113.57 112.21 102.21 106.93 108.96 106.99 113.83 0.73 15.62 15.66
Oct 113.99 113.47 113.57 113.90 114.40 114.53 113.51 113.88 111.16 116.43 118.14 108.08 104.14 110.03 111.52 110.60 110.50 0.13 14.95 15.79
Nov 113.62 112.13 111.53 116.46 115.68 115.44 113.96 111.85 113.93 114.75 110.50 112.82 102.71 106.16 107.49 108.46 112.57 -0.33 13.62 15.72
Dec 115.87 113.76 113.71 116.98 117.06 117.22 113.72 113.57 114.32 114.69 112.61 114.00 103.61 106.57 109.02 108.17 111.52 1.99 12.74 15.39
2011 Jan 119.70 119.52 118.90 120.13 116.53 120.50 113.01 113.98 116.42 114.53 111.09 110.03 101.78 108.53 109.43 108.18 114.47 3.30 15.55 15.31
Feb 118.76 116.72 116.45 129.40 119.44 120.24 116.05 116.79 114.08 116.61 111.36 121.88 107.37 108.44 109.70 110.10 113.84 -0.79 12.48 14.86
Mar 121.07 119.60 120.23 120.58 119.92 119.79 115.15 117.26 114.16 116.58 115.04 118.42 107.81 109.23 110.57 109.14 111.88 1.95 16.42 14.96
Apr 119.44 119.17 119.43 122.65 121.09 120.10 116.35 116.11 125.13 116.01 116.72 116.89 107.23 107.84 111.18 111.88 114.09 -1.35 13.12 14.69
May 121.21 120.62 120.85 124.36 120.11 120.40 116.94 119.04 125.52 116.71 113.77 115.37 108.12 108.85 112.08 111.96 116.37 1.48 13.04 14.46
Jun 122.60 122.41 122.77 111.47 121.93 121.49 115.95 118.64 125.97 117.09 118.81 120.12 108.66 109.16 112.60 112.13 120.62 1.15 11.83 14.10
Jul 123.61 122.84 123.44 113.28 122.37 122.45 112.52 117.85 125.97 118.24 117.90 122.14 108.53 116.24 112.76 113.13 123.17 0.82 11.70 13.84
Aug 125.60 123.27 123.81 118.09 126.87 126.97 118.57 119.43 128.36 120.14 119.86 121.82 108.82 110.89 113.16 114.24 125.36 1.61 11.13 13.46
Sep 127.36 125.28 125.27 119.40 128.21 127.97 117.97 121.24 127.15 118.37 121.32 123.06 108.27 111.03 114.24 114.03 125.21 1.40 11.88 13.16
Oct 128.55 127.83 127.97 118.15 128.38 127.86 120.15 121.82 130.95 118.78 121.82 122.99 108.64 122.05 114.57 114.79 126.39 0.94 12.78 12.98
Nov 128.55 127.42 127.30 128.59 129.12 129.61 121.80 122.64 130.52 120.67 122.16 123.66 108.86 121.65 114.58 115.08 129.67 0.00 13.15 12.95
Dec 129.00 127.07 127.00 128.80 131.13 131.09 122.22 124.09 135.14 120.56 123.41 129.22 108.11 117.88 114.60 116.99 127.08 0.35 11.33 12.82
2012 Jan 131.28 129.86 130.74 128.39 132.43 133.95 126.42 122.28 128.74 120.59 122.21 128.15 111.00 119.17 115.20 117.25 130.84 1.77 9.68 12.33
Feb 131.65 130.03 130.89 128.43 131.76 131.74 126.42 122.31 128.80 120.61 122.22 128.17 111.00 119.17 115.21 117.25 130.85 0.28 10.86 12.19
Mar 134.40 137.14 136.51 130.26 134.90 134.69 127.43 132.31 142.68 133.25 130.22 129.98 114.58 117.93 126.73 120.21 131.74 2.09 11.01 11.76
Apr 134.41 137.02 136.48 131.77 135.03 134.82 127.70 132.02 142.29 133.59 130.72 130.33 115.10 118.35 125.48 120.99 131.82 0.01 12.54 11.72
May 135.41 138.89 138.53 132.91 136.55 136.33 128.13 132.63 142.57 133.92 131.28 130.66 115.29 118.77 125.65 121.92 132.24 0.74 11.71 11.62
Jun 136.53 139.79 138.10 133.03 137.44 137.22 128.48 132.64 146.27 134.35 131.57 131.28 115.72 119.04 125.88 122.57 132.47 0.83 11.36 11.58
Jul 136.87 140.37 138.92 133.29 137.98 137.75 128.95 132.91 146.38 134.22 131.63 131.56 115.76 119.07 125.85 122.89 132.73 0.25 10.73 11.50

Statistical News
Price Statistics 15 March 2016
Table 4 Rural Consumer Price Index (Base November 2009 = 100)
All I
tem
s
All I
tem
s le
ss F
arm
Pro
du
ce
.
All I
tem
s le
ss F
arm
Pro
du
ce
. a
nd
En
erg
y
Imp
ort
ed
Fo
od
Fo
od
Fo
od
& N
on
Alc
oh
olic B
ev.
Alc
oh
olic B
eve
rage
. To
ba
cco
an
d
Ko
la
Clo
thin
g a
nd
Fo
otw
ea
r
Ho
usin
g W
ate
r, E
lectr
icit
y. G
as a
nd
Oth
er
Fu
el
Fu
rnis
hin
gs &
Ho
use
ho
ld E
qu
ipm
en
t
Ma
inte
na
nce
.
He
alt
h.
Tra
nsp
ort
Co
mm
un
ica
tio
n
Re
cre
ati
on
& C
ult
ure
.
Ed
uca
tio
n
Re
sta
ura
nt
&
Ho
tels
Mis
ce
lla
ne
ou
s G
oo
ds &
Se
rvic
es
Mo
nth
-on
(%
)
Ye
ar-
on
(%
)
12
-mo
nth
ave
rage
(%
)
Weights
1000.
0
503.1 417.4 113.7 532.3 540.9 10.6 85.7 147.2 50.7 32.2 57.2 4.0 6.7 38.9 10.1 15.8
Aug 137.76 140.91 139.36 134.53 139.10 138.87 129.41 133.49 147.18 134.69 132.21 132.13 116.02 119.26 126.63 122.99 132.85 0.65 9.68 11.37
Sep 138.99 141.34 139.58 134.40 140.55 140.31 130.00 134.25 148.92 135.68 132.39 132.92 116.25 119.99 126.78 123.98 132.90 0.89 9.13 11.13
Oct 140.21 141.92 140.11 135.99 142.02 141.77 131.03 135.45 149.86 135.99 133.05 133.98 116.61 120.67 128.20 124.31 134.03 0.88 9.07 10.82
Nov 141.10 142.50 140.98 137.65 143.19 142.93 131.97 136.30 150.26 136.68 133.70 134.18 116.85 120.81 128.99 124.54 134.48 0.63 9.76 10.55
Dec 142.13 143.54 141.90 138.33 144.51 144.24 132.84 137.11 151.05 136.95 134.11 135.67 117.03 121.23 129.10 125.20 134.96 0.73 10.18 10.46
2013 Jan 143.17 144.93 142.37 139.46 145.71 145.43 133.62 138.42 151.98 138.53 134.49 136.12 117.12 121.36 129.19 125.64 135.15 0.73 9.05 10.39
Feb 144.10 144.93 142.68 140.10 146.42 146.14 134.71 139.66 153.37 139.70 135.57 137.35 117.60 122.37 129.93 126.62 136.22 0.65 9.46 10.28
Mar 145.28 147.08 145.92 140.00 148.25 147.94 135.40 139.76 153.88 139.80 136.54 137.55 117.89 122.62 130.97 126.52 137.70 0.82 8.09 10.02
Apr 146.38 146.51 144.39 140.49 149.15 148.85 136.17 141.23 154.67 142.17 137.93 139.00 118.03 124.46 132.77 127.27 139.11 0.76 8.91 9.73
May 147.11 147.23 144.48 140.91 149.78 149.49 137.12 142.31 155.26 143.03 139.29 139.94 118.41 125.16 133.54 128.12 139.87 0.50 8.65 9.48
Jun 147.90 147.56 144.77 142.20 150.82 150.51 137.54 142.75 155.88 143.91 140.03 140.16 118.73 125.80 133.63 128.42 140.31 0.54 8.33 9.24
Jul 148.64 148.76 146.91 143.17 151.75 151.43 138.40 143.37 156.58 144.23 140.59 140.56 119.01 125.98 133.85 129.17 140.69 0.50 8.60 9.06
Aug 148.95 150.25 148.16 143.70 152.35 152.03 138.80 143.50 156.22 144.29 140.66 140.59 119.05 126.12 134.10 129.21 140.77 0.20 8.12 8.93
Sep 150.04 151.91 149.94 144.70 153.65 153.32 139.51 144.29 157.14 145.01 141.45 141.50 119.57 126.47 135.18 130.19 141.64 0.74 7.95 8.83
Oct 151.14 152.82 150.84 145.88 154.83 154.50 140.65 145.36 157.92 146.21 142.48 142.50 120.47 127.43 136.41 131.22 142.80 0.73 7.79 8.72
Nov 152.17 153.75 151.89 146.76 155.99 155.65 141.31 146.45 158.77 147.32 143.20 143.19 120.88 128.17 137.19 132.08 144.13 0.68 7.85 8.56
Dec 153.33 155.19 153.37 148.01 157.36 157.03 141.96 147.47 159.54 148.48 144.14 144.08 121.32 128.98 138.02 133.27 145.23 0.76 7.88 8.38
2014 Jan 154.38 155.52 153.26 148.95 158.61 158.27 142.67 148.42 160.16 149.20 144.94 145.34 122.10 130.16 138.71 133.99 146.11 0.68 7.83 8.28
Feb 155.13 156.15 154.22 149.57 159.54 159.20 143.20 149.16 160.71 149.87 145.43 145.87 122.30 131.33 138.88 134.39 146.36 0.49 7.66 8.13
Mar 156.39 156.81 154.92 150.67 161.16 160.81 144.00 149.91 161.58 150.78 146.37 146.89 122.80 131.84 139.54 135.18 147.19 0.81 7.65 8.09
Apr 157.32 157.57 155.71 151.46 162.33 161.98 144.74 150.70 162.34 151.28 146.89 147.57 123.41 132.54 139.94 135.67 147.41 0.59 7.47 7.97
May 158.53 158.60 156.68 152.85 163.59 163.23 145.65 152.09 163.42 152.58 148.02 148.62 124.00 133.48 140.99 136.88 148.59 0.77 7.76 7.90
Jun 159.71 159.67 157.65 153.99 164.85 164.49 146.60 153.22 164.75 153.66 148.86 149.61 124.66 134.30 141.36 137.83 149.71 0.74 7.98 7.87

Statistical News
Price Statistics 15 March 2016
Table 4 Rural Consumer Price Index (Base November 2009 = 100)
All I
tem
s
All I
tem
s le
ss F
arm
Pro
du
ce
.
All I
tem
s le
ss F
arm
Pro
du
ce
. a
nd
En
erg
y
Imp
ort
ed
Fo
od
Fo
od
Fo
od
& N
on
Alc
oh
olic B
ev.
Alc
oh
olic B
eve
rage
. To
ba
cco
an
d
Ko
la
Clo
thin
g a
nd
Fo
otw
ea
r
Ho
usin
g W
ate
r, E
lectr
icit
y. G
as a
nd
Oth
er
Fu
el
Fu
rnis
hin
gs &
Ho
use
ho
ld E
qu
ipm
en
t
Ma
inte
na
nce
.
He
alt
h.
Tra
nsp
ort
Co
mm
un
ica
tio
n
Re
cre
ati
on
& C
ult
ure
.
Ed
uca
tio
n
Re
sta
ura
nt
&
Ho
tels
Mis
ce
lla
ne
ou
s G
oo
ds &
Se
rvic
es
Mo
nth
-on
(%
)
Ye
ar-
on
(%
)
12
-mo
nth
ave
rage
(%
)
Weights
1000.
0
503.1 417.4 113.7 532.3 540.9 10.6 85.7 147.2 50.7 32.2 57.2 4.0 6.7 38.9 10.1 15.8
Jul 160.66 159.76 157.94 154.39 166.01 165.63 147.49 154.10 165.75 154.24 149.50 150.01 124.80 134.91 141.63 138.69 150.36 0.60 8.09 7.83
Aug 161.41 160.35 158.52 155.14 166.84 166.47 148.22 154.88 166.19 154.96 150.29 150.66 125.00 135.50 142.53 139.16 151.20 0.47 8.37 7.86
Sep 162.41 161.55 159.80 156.28 167.90 167.52 148.95 156.05 167.06 156.32 150.94 151.17 125.17 136.05 143.84 139.92 152.20 0.62 8.24 7.88
Oct 163.26 162.40 160.68 157.34 168.76 168.38 149.85 157.07 167.75 157.22 152.00 151.75 125.71 136.48 144.83 141.02 153.26 0.52 8.02 7.90
Nov 164.19 163.30 161.59 158.34 169.71 169.33 150.47 158.24 168.63 158.20 152.99 152.27 126.04 137.05 145.81 141.87 154.19 0.57 7.90 7.91
Dec 165.53 164.59 162.90 159.66 171.24 170.85 151.63 159.64 169.67 159.36 154.22 153.42 126.19 137.65 146.61 143.13 155.43 0.82 7.96 7.91
2015 Jan 166.87 165.81 164.16 160.99 172.67 172.28 152.59 161.14 170.91 160.78 155.49 154.38 126.39 138.63 147.74 144.40 156.52 0.81 8.09 7.94
Feb 168.00 166.88 165.18 162.36 173.87 173.48 153.53 162.39 171.96 161.78 156.62 155.07 126.76 139.19 148.82 145.43 157.61 0.67 8.29 7.99
Mar 169.52 168.28 166.59 163.65 175.63 175.23 154.62 163.79 173.24 163.30 158.03 156.16 127.02 139.92 149.78 146.59 159.05 0.91 8.40 8.05
Apr 170.78 169.29 167.48 165.10 177.11 176.70 155.41 164.71 174.45 164.20 158.81 157.42 127.22 140.50 150.46 147.46 159.90 0.74 8.56 8.14
May 172.63 171.25 169.27 166.80 178.93 178.52 156.93 166.75 176.62 165.91 160.76 159.13 127.62 141.66 151.86 149.10 161.78 1.08 8.90 8.24
Jun 174.24 172.59 170.48 168.47 180.79 180.36 158.20 168.31 177.87 167.09 161.48 160.58 127.98 142.83 153.25 150.63 163.63 0.93 9.10 8.33
July 175.50 173.70 171.54 169.97 182.22 181.79 159.29 169.62 179.04 167.74 162.59 161.62 128.31 143.72 154.29 151.78 164.51 0.73 9.24 8.43
Aug 176.55 174.78 172.46 171.38 183.32 182.89 160.22 170.58 180.23 168.41 163.30 162.40 128.58 143.94 155.85 152.71 165.44 0.60 9.38 8.52
Sep 177.52 175.67 173.34 172.77 184.33 183.90 161.27 171.44 181.05 169.48 163.86 163.28 128.72 144.45 157.51 153.65 166.12 0.55 9.30 8.61
Oct 178.22 176.37 174.04 173.61 185.08 184.64 162.06 172.27 181.54 169.68 164.31 164.19 129.01 144.99 158.65 154.31 166.94 0.39 9.16 8.70
Nov 179.40 177.44 175.03 175.14 186.52 186.07 162.94 173.45 182.20 170.11 164.82 165.83 129.35 145.64 159.62 154.99 167.92 0.66 9.26 8.81
Dec 181.11 178.73 176.30 177.02 188.57 188.11 164.37 175.54 183.16 171.11 165.96 167.49 130.03 146.95 160.41 156.43 169.93 0.95 9.41 8.93
2016 Jan 182.69 180.16 177.64 178.86 190.32 189.85 166.07 177.23 184.37 172.05 167.38 168.90 130.57 147.83 162.60 157.98 171.60 0.88 9.48 9.05
Feb 185.96 184.57 180.45 183.96 193.15 192.65 168.18 179.77 190.88 174.13 169.38 171.58 131.65 149.19 167.17 159.48 172.81 1.79 10.69 9.25

Statistical News
Price Statistics 15 March 2016
-
2
4
6
8
10
12
14
16
18
20
09
-Ja
n
Mar
May
Ju
ly
Se
pt
Nov
10
-Ja
n
Mar
May
Ju
ly
Se
pt
Nov
11
-Ja
n
Mar
May
Ju
l
Se
p
Nov
12
-Ja
n
Mar
May
Ju
l
Se
p
Nov
13
-Ja
n
Mar
May
Ju
l
Se
p
Nov
14
-Ja
n
Mar
May
Ju
l
Se
p
Nov
15
-Ja
n
Mar
May
Ju
l
Se
p
Nov
16
-Ja
n
5. Inflation -Rural All Items (%)
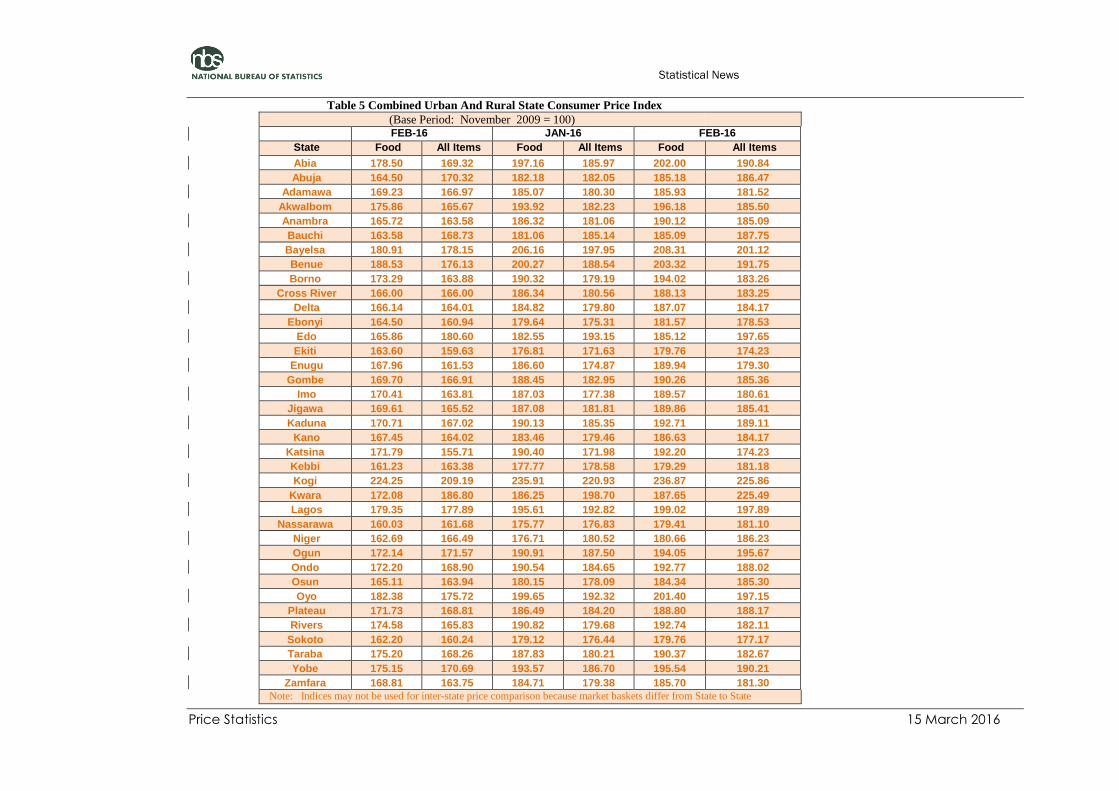
Statistical News
Price Statistics 15 March 2016
Table 5 Combined Urban And Rural State Consumer Price Index
(Base Period: November 2009 = 100)
FEB-16 JAN-16 FEB-16
State Food All Items Food All Items Food All Items
Abia 178.50 169.32 197.16 185.97 202.00 190.84
Abuja 164.50 170.32 182.18 182.05 185.18 186.47
Adamawa 169.23 166.97 185.07 180.30 185.93 181.52
AkwaIbom 175.86 165.67 193.92 182.23 196.18 185.50
Anambra 165.72 163.58 186.32 181.06 190.12 185.09
Bauchi 163.58 168.73 181.06 185.14 185.09 187.75
Bayelsa 180.91 178.15 206.16 197.95 208.31 201.12
Benue 188.53 176.13 200.27 188.54 203.32 191.75
Borno 173.29 163.88 190.32 179.19 194.02 183.26
Cross River 166.00 166.00 186.34 180.56 188.13 183.25
Delta 166.14 164.01 184.82 179.80 187.07 184.17
Ebonyi 164.50 160.94 179.64 175.31 181.57 178.53
Edo 165.86 180.60 182.55 193.15 185.12 197.65
Ekiti 163.60 159.63 176.81 171.63 179.76 174.23
Enugu 167.96 161.53 186.60 174.87 189.94 179.30
Gombe 169.70 166.91 188.45 182.95 190.26 185.36
Imo 170.41 163.81 187.03 177.38 189.57 180.61
Jigawa 169.61 165.52 187.08 181.81 189.86 185.41
Kaduna 170.71 167.02 190.13 185.35 192.71 189.11
Kano 167.45 164.02 183.46 179.46 186.63 184.17
Katsina 171.79 155.71 190.40 171.98 192.20 174.23
Kebbi 161.23 163.38 177.77 178.58 179.29 181.18
Kogi 224.25 209.19 235.91 220.93 236.87 225.86
Kwara 172.08 186.80 186.25 198.70 187.65 225.49
Lagos 179.35 177.89 195.61 192.82 199.02 197.89
Nassarawa 160.03 161.68 175.77 176.83 179.41 181.10
Niger 162.69 166.49 176.71 180.52 180.66 186.23
Ogun 172.14 171.57 190.91 187.50 194.05 195.67
Ondo 172.20 168.90 190.54 184.65 192.77 188.02
Osun 165.11 163.94 180.15 178.09 184.34 185.30
Oyo 182.38 175.72 199.65 192.32 201.40 197.15
Plateau 171.73 168.81 186.49 184.20 188.80 188.17
Rivers 174.58 165.83 190.82 179.68 192.74 182.11
Sokoto 162.20 160.24 179.12 176.44 179.76 177.17
Taraba 175.20 168.26 187.83 180.21 190.37 182.67
Yobe 175.15 170.69 193.57 186.70 195.54 190.21
Zamfara 168.81 163.75 184.71 179.38 185.70 181.30
Note: Indices may not be used for inter-state price comparison because market baskets differ from State to State

Statistical News
Price Statistics 15 March 2016