Consumer preferences and utility - YMCA University of ... preferences and utility ... behaviour used...
38
Consumer preferences and utility Modelling consumer preferences
Transcript of Consumer preferences and utility - YMCA University of ... preferences and utility ... behaviour used...

Consumer preferences and utility
Modelling consumer preferences
Consumer preferences and utility
How can we possibly model the decision of consumers ? What will they consume? How much of each good?
Actually, a very simple framework is enough ! This framework can explain a lot of the
behaviour of people on markets.
Consumer preferences and utility
Last week’s “general rule”: A rational consumer will always choose
the best basket of goods amongst all the ones it can afford
But we need to clarify : What we mean by rational What we mean by best What we mean by afford
Today
Next week
Consumer preferences and utility
The utility function as a measure of satisfaction
Indifference curves as a representation of preferences
The marginal rate of substitution
The Utility function
Historically, utility as a measure of satisfaction is grounded in utilitarianism
Jeremy Bentham (1748-1831): “It is the property of an object to produce pleasure, well-being or happiness”
Stanley Jevons (1835-1882): The father of the “marginalist revolution”, who generalised this concept to consumer behaviour
The Utility function
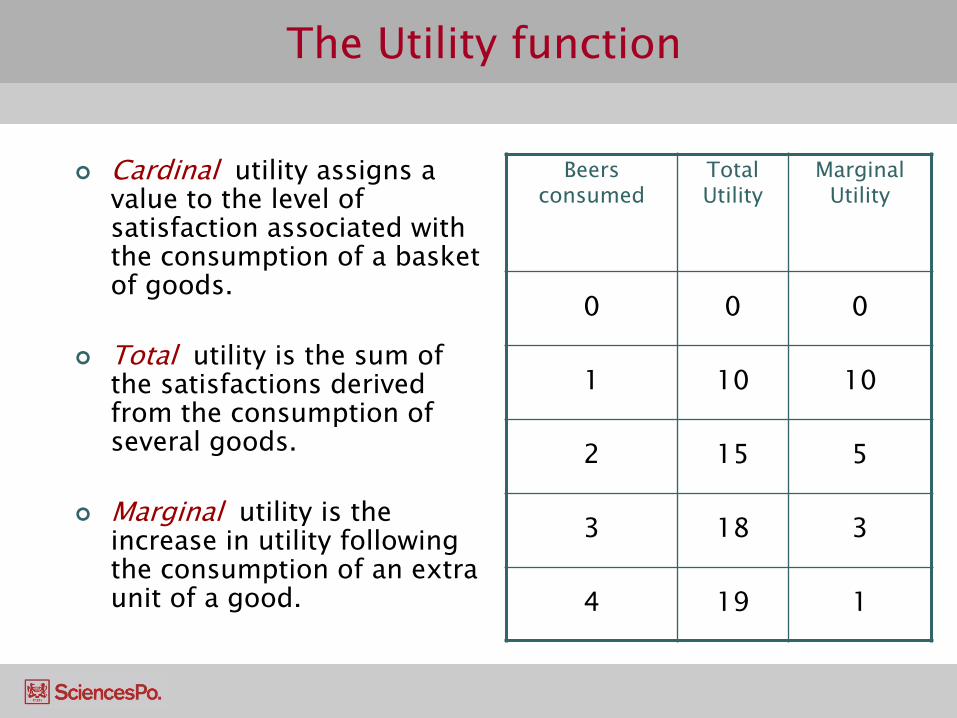
Cardinal utility assigns a value to the level of satisfaction associated with the consumption of a basket of goods.
Total utility is the sum of the satisfactions derived from the consumption of several goods.
Marginal utility is the increase in utility following the consumption of an extra unit of a good.
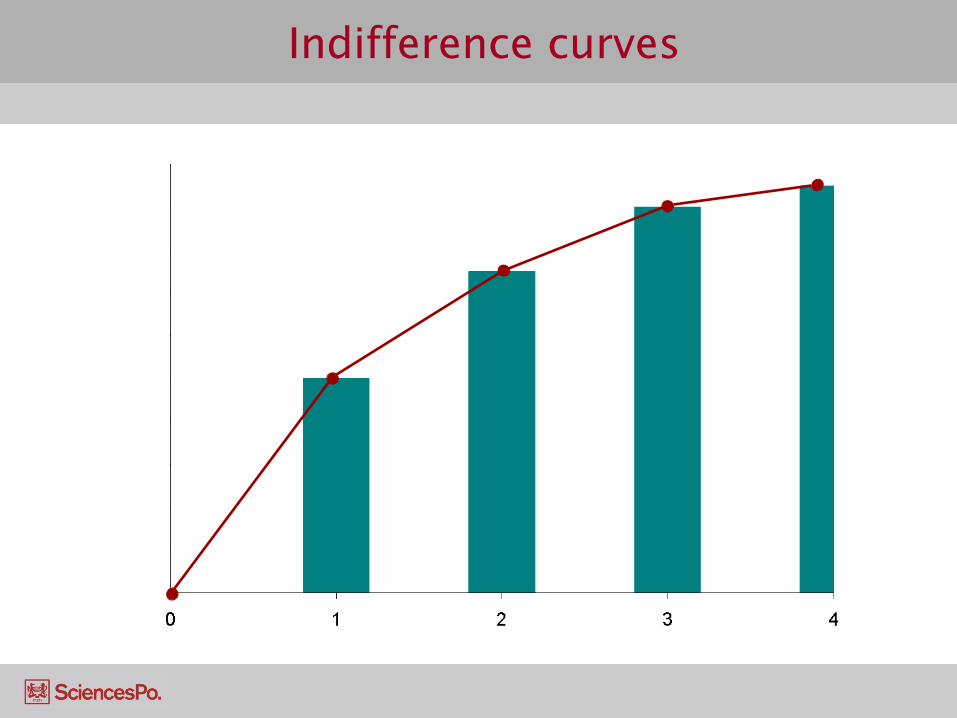
Beers consumed
Total Utility
Marginal Utility
0 0 0
1 10 10
2 15 5
3 18 3
4 19 1
The Utility function
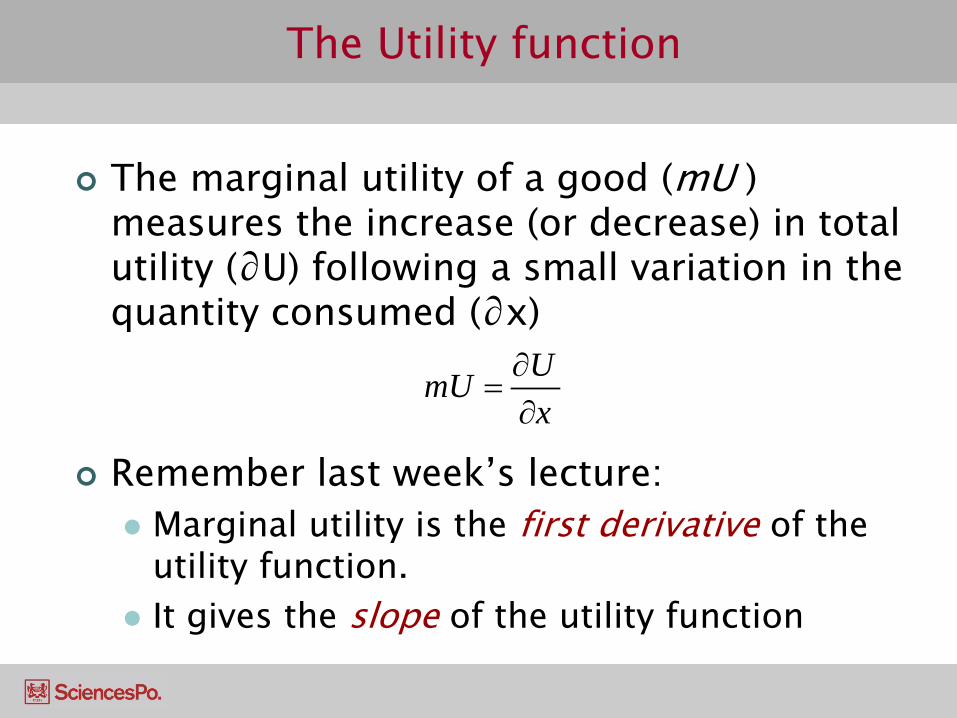
The marginal utility of a good (mU ) measures the increase (or decrease) in total utility (∂U) following a small variation in the quantity consumed (∂x)
Remember last week’s lecture:
Marginal utility is the first derivative of the utility function.
It gives the slope of the utility function
UmUx
∂=∂

The Utility function
mU = 10
mU = 5
mU = 3
mU = 1
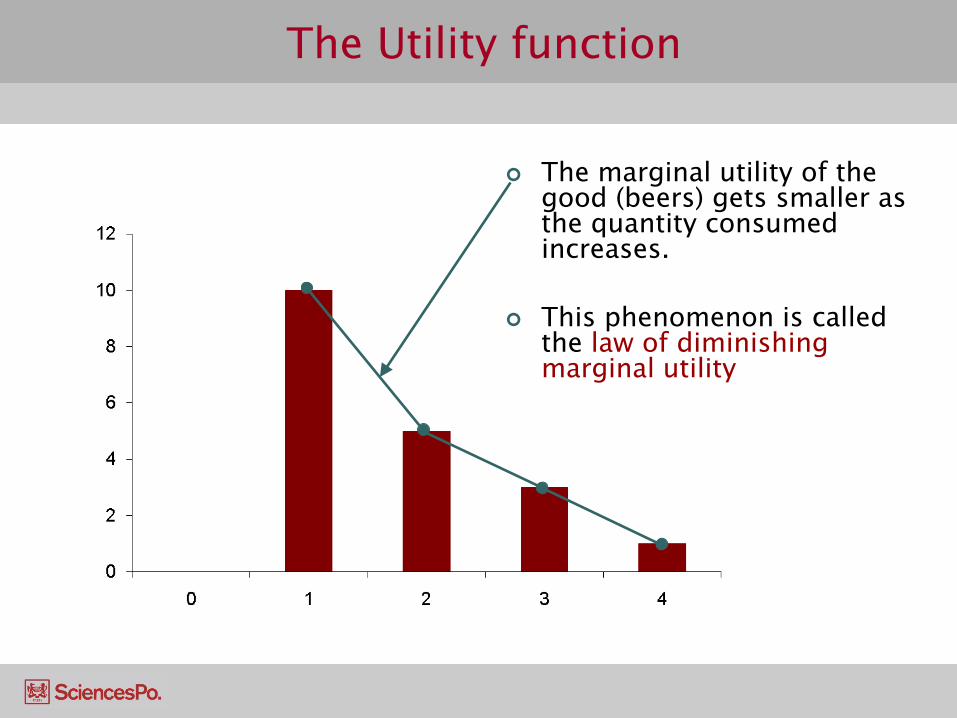
The Utility function
The marginal utility of the good (beers) gets smaller as the quantity consumed increases.
This phenomenon is called the law of diminishing marginal utility
The Utility function
The initial, historical approach to consumer behaviour used this concept of cardinal utility
However, this is a problematic concept: Is it possible to quantify the satisfaction derived from consuming
a good ? Is it possible for the quantities of utility derived from 2 different
goods to be compared ? More importantly, do consumers actually think that way when
they choose goods ???
This problem was solved by the introduction of ordinal utility More general, more realistic and more powerful
The Utility function
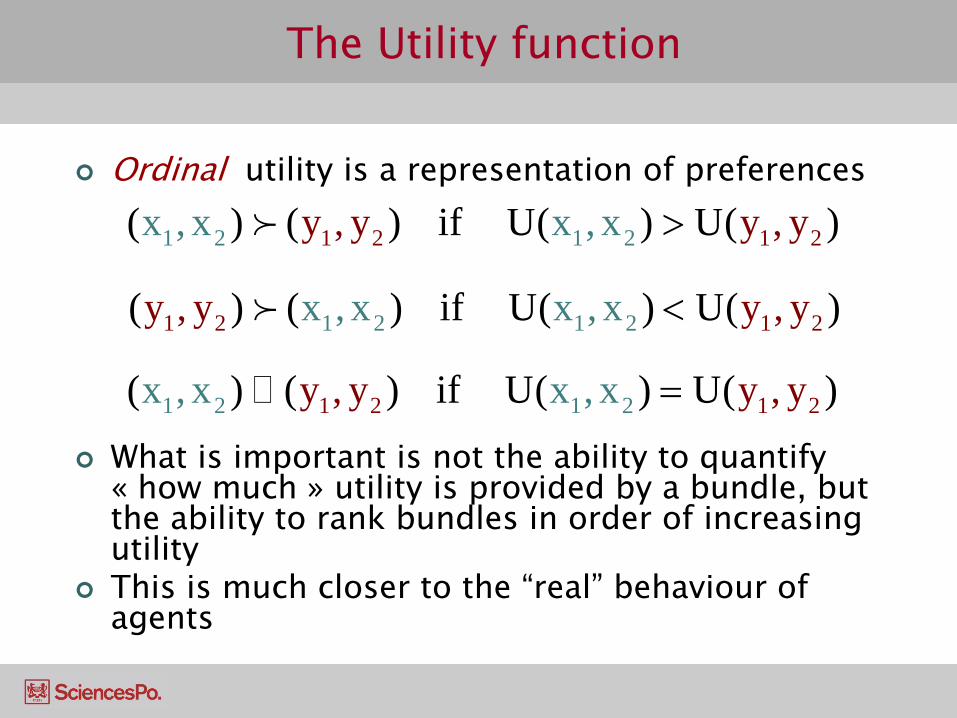
Ordinal utility is a representation of preferences
What is important is not the ability to quantify
« how much » utility is provided by a bundle, but the ability to rank bundles in order of increasing utility
This is much closer to the “real” behaviour of agents
1 2 11 22 1 2( ) ( ) if U( )y , y U( )x , x x , x y , y>
1 2 11 22 1 2( ) ( ) if U( )x , x U( )x , xy , y y , y<
1 2 11 22 1 2( ) ( ) if U( )y , y U( )x , x x , x y , y=
The Utility function
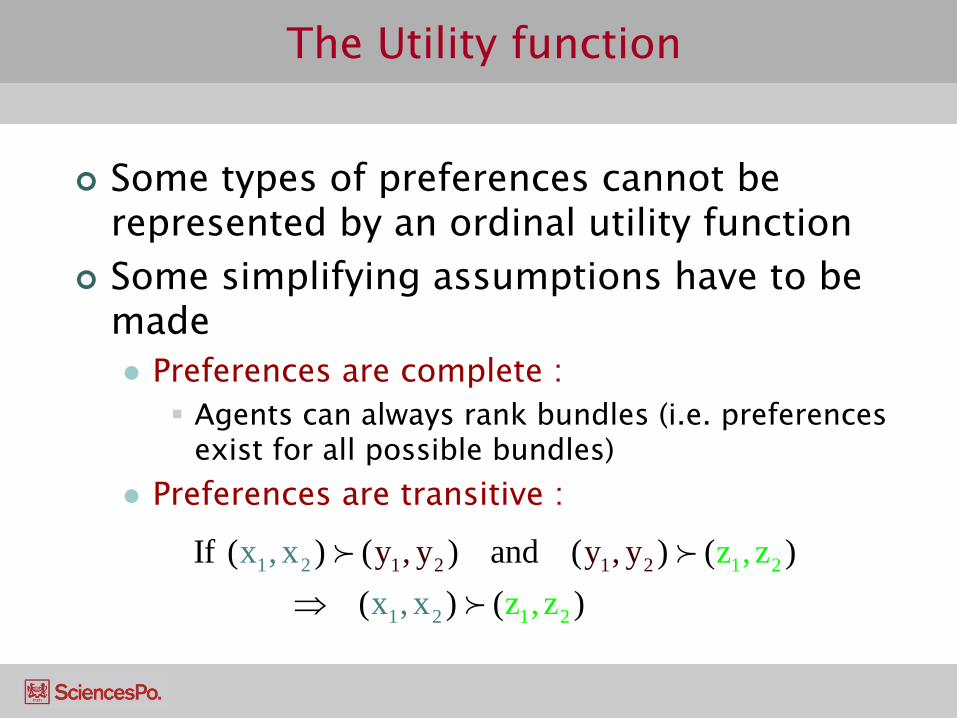
Some types of preferences cannot be represented by an ordinal utility function
Some simplifying assumptions have to be made Preferences are complete : Agents can always rank bundles (i.e. preferences
exist for all possible bundles) Preferences are transitive :
1 2 1 21
1
2
2
1
1
2
2
If ( ) ( ) and ( ) ( )(
x , xx , x
z ,y , y y) ( )
y zz
,z ,⇒
The Utility function
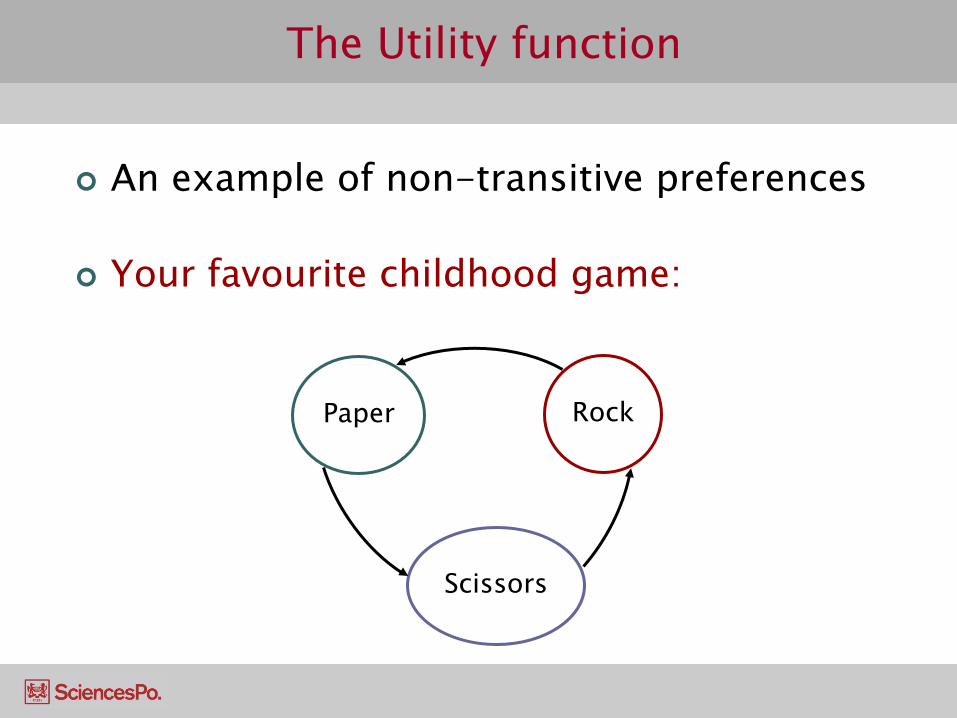
An example of non-transitive preferences
Your favourite childhood game:
Rock Paper
Scissors

The Utility function
You are exploring the desert, you get lost, and you run out of fuel and supplies. Luckily, another truck finds you and offers some help,
but you have to choose amongst some options. None is 100% satisfactory because they also have to
keep some resources to be able to get back.
How do you rank those options ?
Fuel Supplies Map Option 1 Full tank Very little Yes Option 2 Full tank Plentiful No Option 3 None Plentiful Yes
The Utility function
Such preferences cannot be represented by an ordinal utility function !! This is a first example of how consumer theory
simplifies a complex reality
Consumer theory (and economic theory in general) often “breaks down” in extreme situations People’s behaviour becomes governed by
different priorities

Consumer preferences and utility
The utility function as a measure of satisfaction
Indifference curves as a representation of preferences
The marginal rate of substitution
Indifference curves
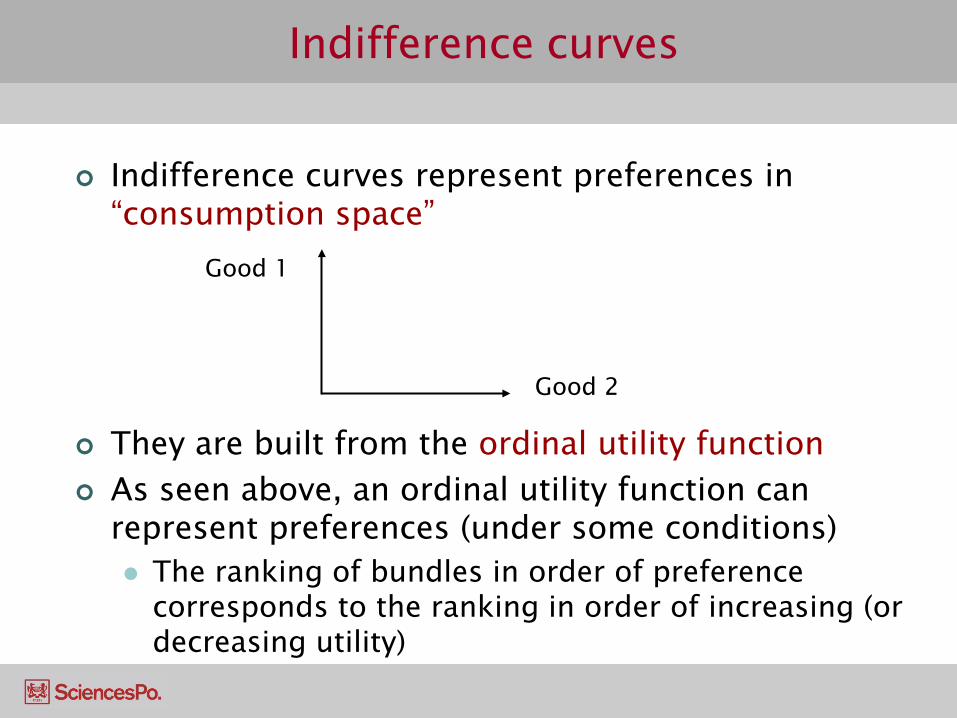
Indifference curves represent preferences in “consumption space”
They are built from the ordinal utility function As seen above, an ordinal utility function can
represent preferences (under some conditions) The ranking of bundles in order of preference
corresponds to the ranking in order of increasing (or decreasing utility)
Good 1
Good 2
Indifference curves

Indifference curves
Utility function for a single good
Indifference curves
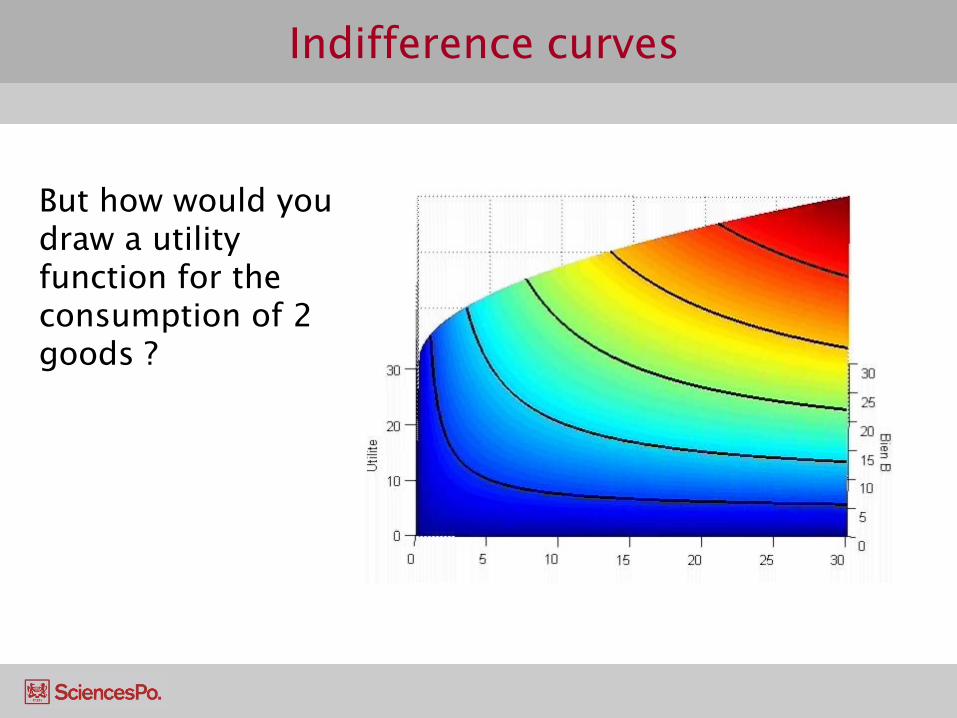
But how would you draw a utility function for the consumption of 2 goods ?

Indifference curves
Seen from above, the 3-D diagram looks like this...
Lines of constant utility
Indifference curves
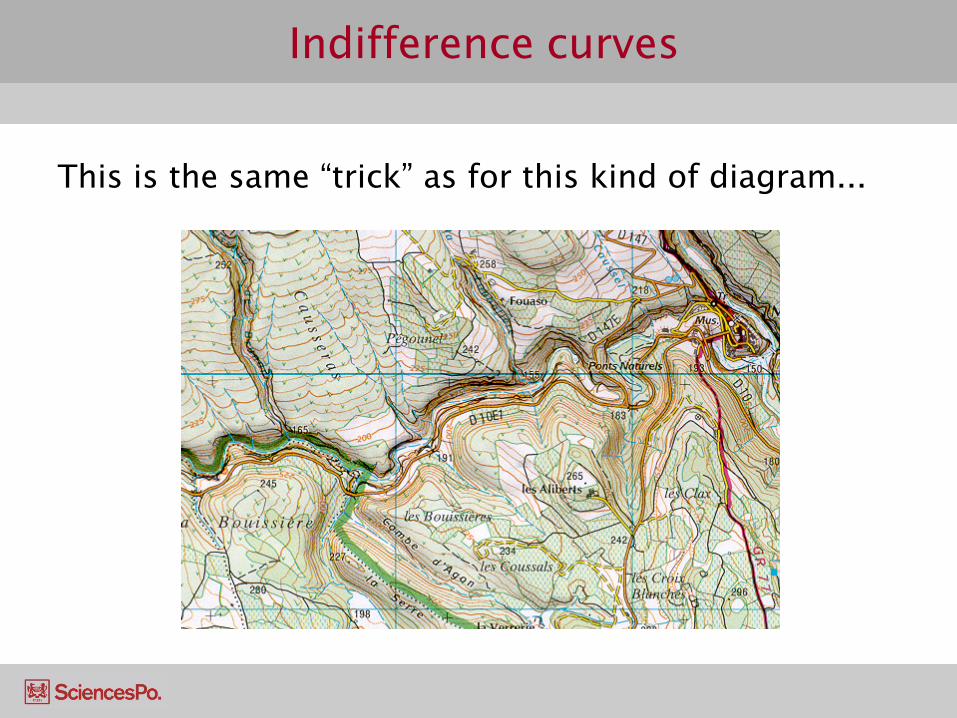
This is the same “trick” as for this kind of diagram...
Indifference curves
Indifference curves are a graphical (2-D) representation of a 3-D utility function Just like the contour lines of a 2-D road map
represent the 3rd dimension (altitude)
A given indifference curve represents all the baskets of goods that provide the same utility to a consumer The consumer is therefore indifferent to all these
baskets
Indifference curves
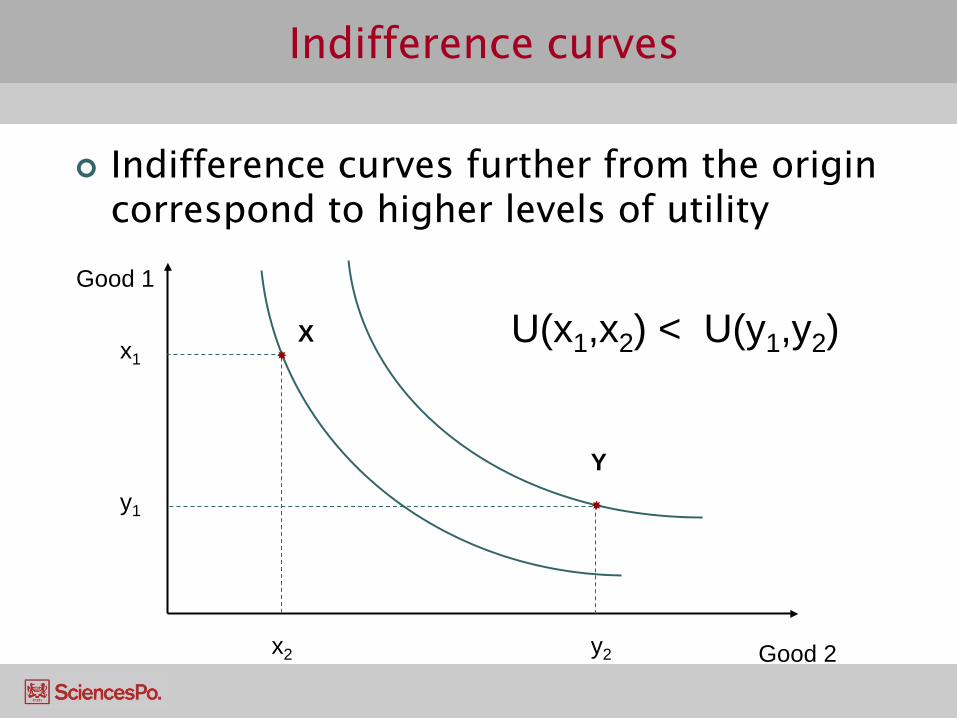
Indifference curves further from the origin correspond to higher levels of utility
Good 1
Good 2
x1
x2
X U(x1,x2) < U(y1,y2)
y1
y2
Y
Indifference curves
Because they are derived from a utility function, indifference curves are a representation of preferences
However, at this point, indifference curves can still take a wide range of shapes Some examples are in the exercise for next week
For a general theory of choice, economists like
“well-behaved” indifference curves 2 more simplifying assumptions need to be made

Indifference curves
Monotonicity (non-satiation)
In other words, “more is always preferred to less”
Extra units of a good always increase utility, so consumers always prefer to have more of a good
The implication is that regardless of which indifference curve you are on, there always exists a higher one right next to it.
Indifference curves
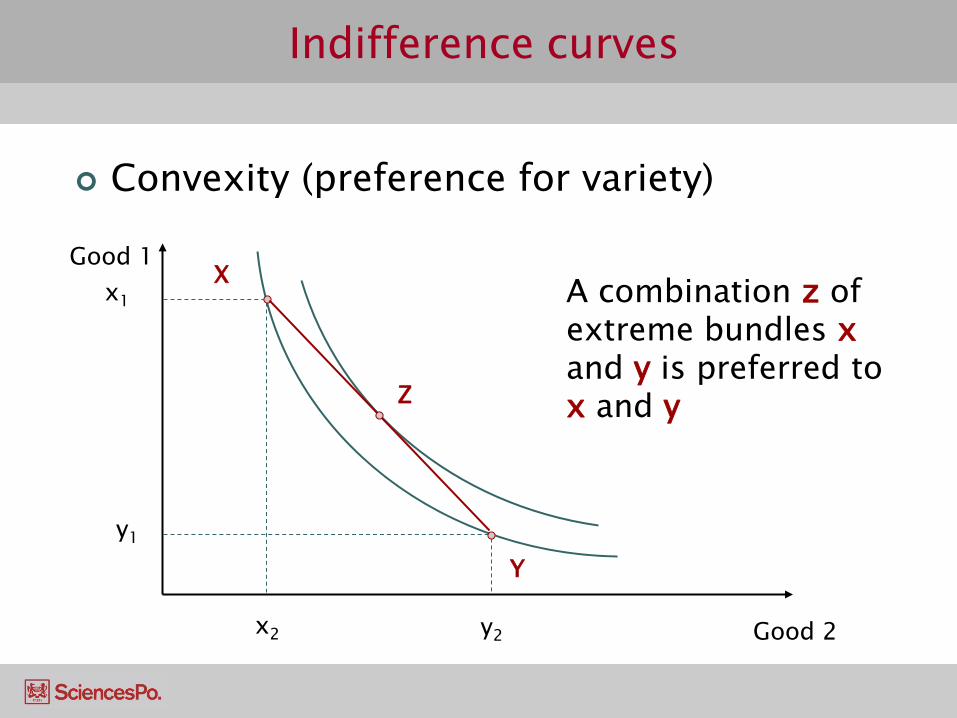
Convexity (preference for variety)
Good 1
Good 2
y1
y2
Y
x1
x2
X A combination z of extreme bundles x and y is preferred to x and y Z
Indifference curves
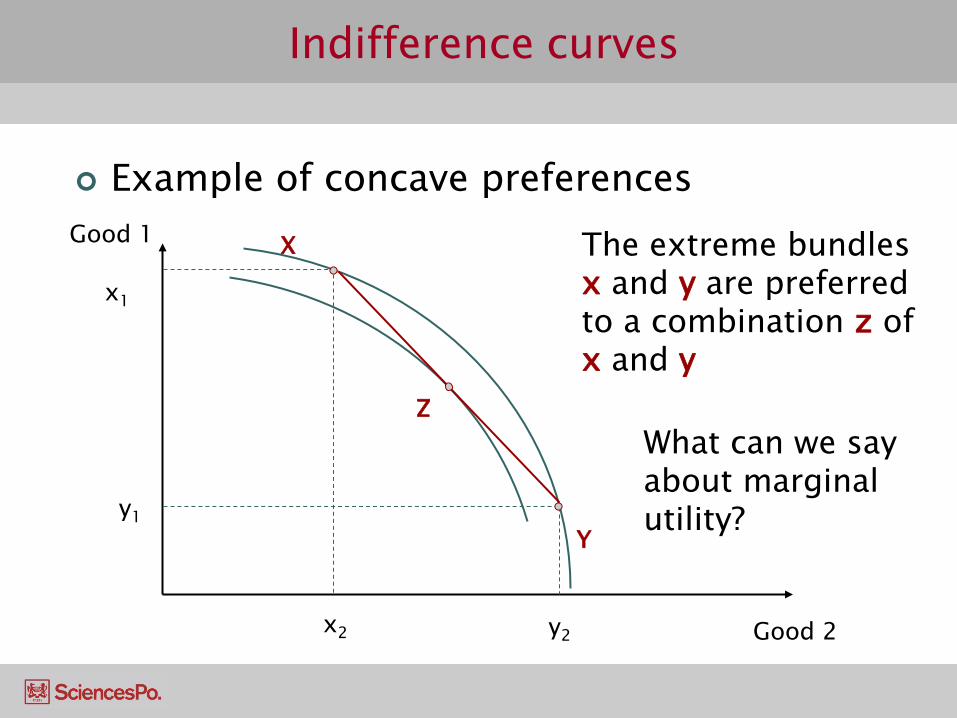
Example of concave preferences Good 1
Good 2
y1
y2
Y
x1
x2
X The extreme bundles x and y are preferred to a combination z of x and y
Z
What can we say about marginal utility?

Indifference curves
“Well-behaved” indifference curves don’t cross
Good 1
Good 2
Y
X
Let’s assume they can
Z
x y y z and , x z so
but z x>This violates monotonicity (more is preferred to less)
Consumer preferences and utility
The utility function as a measure of satisfaction
Indifference curves as a representation of preferences
The marginal rate of substitution
The marginal rate of substitution
What is a rate of substitution ? You currently have a bundle composed of 10
tubs of ice-cream and 3 DVDs. You want to keep your satisfaction the same How many tubs of ice-cream are you
prepared to give up to get some extra DVDs?
The rate at which you are prepared to exchange is known as the “rate of substitution”
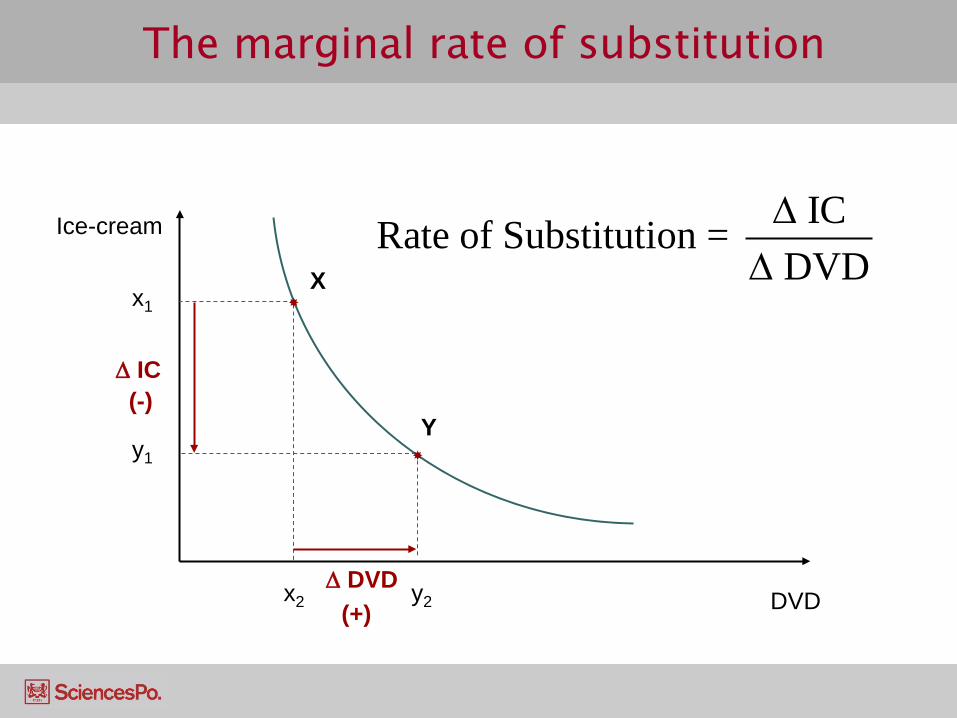
The marginal rate of substitution
Ice-cream
DVD
y1
y2
Y
x1
x2
X
∆ DVD (+)
∆ IC (-)
ICRate of Substitution = DVD∆
∆
The marginal rate of substitution
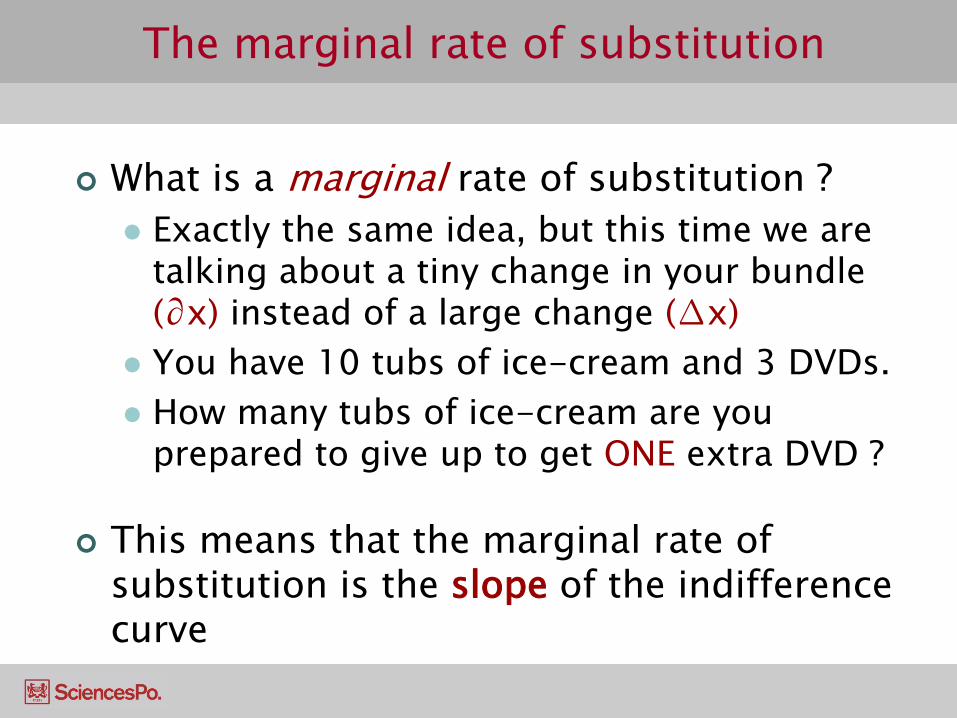
What is a marginal rate of substitution ? Exactly the same idea, but this time we are
talking about a tiny change in your bundle (∂x) instead of a large change (∆x)
You have 10 tubs of ice-cream and 3 DVDs. How many tubs of ice-cream are you
prepared to give up to get ONE extra DVD ?
This means that the marginal rate of substitution is the slope of the indifference curve
The marginal rate of substitution
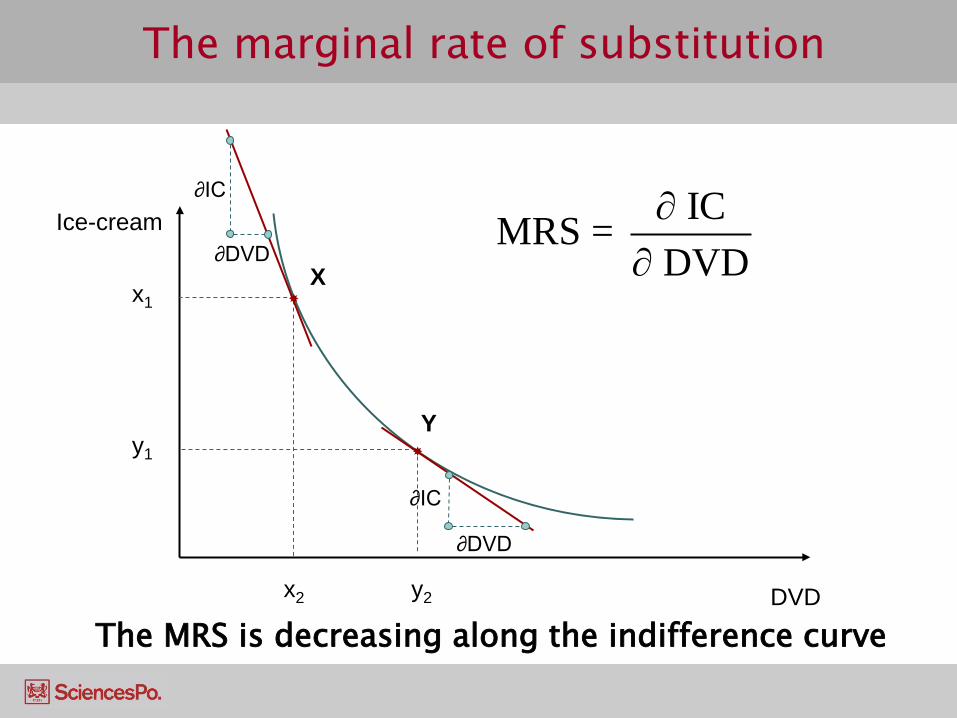
Ice-cream
DVD
y1
y2
Y
x1
x2
X
ICMRS = DVD∂
∂
∂IC
∂DVD
∂IC
∂DVD
The MRS is decreasing along the indifference curve

The marginal rate of substitution
So the marginal rate of substitution is the slope of the indifference curve
The amount of ice-cream you are willing
to give up for an extra DVD is lower the less ice-cream you have This suggests a link with the idea of
decreasing marginal utility
Is there a way of clarifying this link ?

The marginal rate of substitution
Ice-cream
DVD
x1
x2
X
Let’s “zoom in” on the indifference curve until it looks flat
Giving up ∂IC ice-cream causes a loss of utility
ICmU IC× ∂
DVDmU DVD× ∂
Receiving ∂DVD DVDs causes a gain of utility
Because we are still on the same indifference curve, loss=gain

The marginal rate of substitution
The loss of utility from giving up one good equals the gain from receiving the other good
Or equivalently:
Rearranging (dividing both sides by mUIC and ∂DVD):
The MRS is equal to the ratio of marginal utilities!
IC DVDmU IC mU DVD 0× ∂ + × ∂ =
IC DVDmU IC mU DVD× ∂ = − × ∂
DVD
IC
mUICMRSDVD mU∂
= = −∂
The marginal rate of substitution
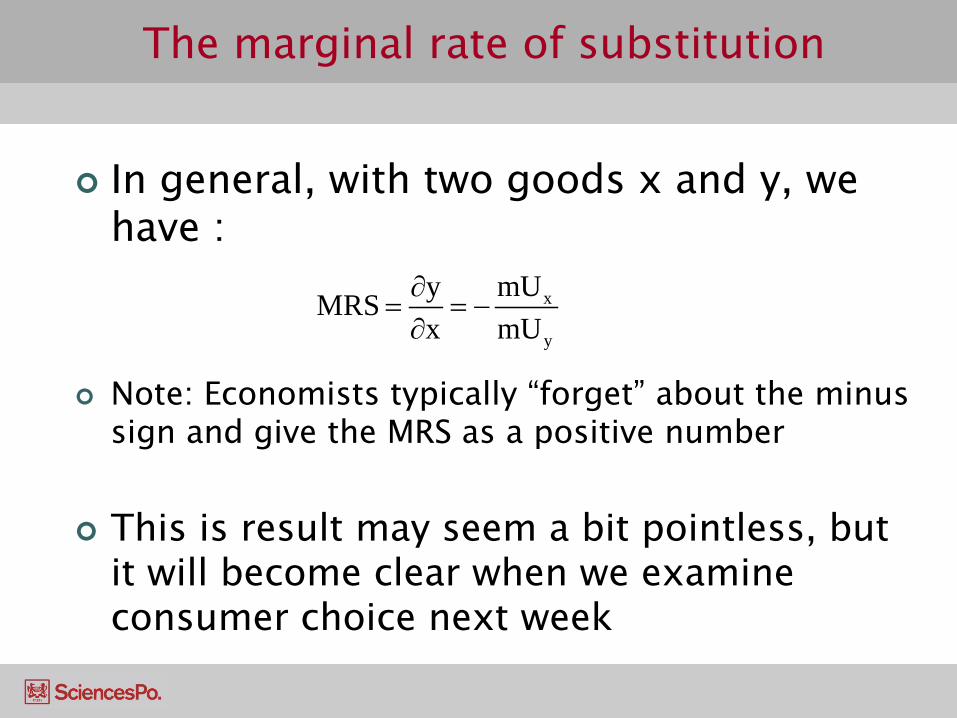
In general, with two goods x and y, we have :
Note: Economists typically “forget” about the minus sign and give the MRS as a positive number
This is result may seem a bit pointless, but
it will become clear when we examine consumer choice next week
x
y
mUyMRSx mU∂
= = −∂