
Construction Sector - EMIS Insight - Turkey... · The list of future projects ... Turkish...
42
- 1 - Any redistribution of this information is strictly prohibited. Copyright © 2014 EMIS, all rights reserved. Produced by: Any redistribution of this information is strictly prohibited. Copyright © 2014 EMIS, all rights reserved. Construction Sector Turkey July 2014
-
Upload
truongkhue -
Category
Documents
-
view
222 -
download
5
Transcript of Construction Sector - EMIS Insight - Turkey... · The list of future projects ... Turkish...

- 1 - Any redistribution of this information is strictly prohibited.
Copyright © 2014 EMIS, all rights reserved.
Produced by:
Any redistribution of this information is strictly prohibited.
Copyright © 2014 EMIS, all rights reserved.
Construction Sector Turkey
July 2014

- 2 - Any redistribution of this information is strictly prohibited.
Copyright © 2014 EMIS, all rights reserved.
Table of Contents
I. Sector Overview
1. Sector Highlights
2. Economic Importance
3. Construction Sector Indicators
4. Construction Sector Forecast
5. Main Sector Indices
6. Employment
7. Employment and Salary Indices
8. International Operation of Turkish Contractors in 2010-2013
9. International Operations of Turkish Contractors to Date
10.M&A
II. Construction and Occupancy Permits
1. Construction Permits by Number of Buildings
2. Floor Area of Construction Permits
3. Construction Permits Value
4. Occupancy Permits by Number of Buildings
5. Floor Area of Occupancy Permits
6. Occupancy Permits Value
III.Homes and Commercial Centers
1. Home Prices and Sales
2. New House Price Index
3. Housing Loans
4. Housing Lending by Quarters
5. Shopping Centers
IV.Related Industries
1. Cement & Clinker Industry
2. Steel Industry
V. Latest Developments
1. Latest Developments Part I
2. Latest Developments Part II
VI. Main Players
1. Tekfen Holding
2. Tekfen Holding (cont’d)
3. Enka Insaat
4. Enka Insaat (cont’d)
5. Nurol Insaat
6. Nurol REIT
7. Cimsa
8. Cimsa (cont’d)

- 3 - Any redistribution of this information is strictly prohibited.
Copyright © 2014 EMIS, all rights reserved.
I. Sector Overview

- 4 - Any redistribution of this information is strictly prohibited.
Copyright © 2014 EMIS, all rights reserved.
Sector Highlights
The Turkish construction sector grew by 7.1% in 2013, up from 0.6% in the previous year, becoming one of the main drivers of the local economy. The construction permits statistics point to a sustained growth of the sector in 2014. Despite the weaker performance in the last quarter of 2013 and the first three months of 2014, the industry's growth rate remains higher than that of the entire economy. The medium and long-term outlook for the sector remains optimistic due to growing population and the rapid urban development as well as the rising incomes in the country.
Performance
In 2013, the government introduced an Urban Transformation project, which envisages the replacement of risky buildings with new earthquake-resistant ones. Some 6.5 million buildings should be demolished and reconstructed over 15 to 20 years, with some 400,000 units planned to be destructed in 2014. The project will provide an additional impetus to the demand in the construction and related industries, such as cement manufacturing.
The government has launched a number of large-scale infrastructure projects, including a third bridge over the Bosphorus strait and a third airport
in Istanbul, which will further underpin the industry's growth. The list of future projects includes two nuclear power plants in Mersin and Sinop,
pipelines construction and an artificial waterway called Canal Istanbul.
The Turkish construction industry is highly competitive. The leading companies, including Enka, Gama, Tekfen, TAV, STFA, Dogus,
Yuksel, Mak-Yol and Nurol, boast a long track record of successfully implemented projects both at home and abroad. Turkish construction companies won contracts for a total of 374 projects worth USD 31.3bn, highest figure ever, in 45 countries in 2013. The Turkish contractors are mainly active in the CIS and MENA regions.
The number of people employed in the construction sector stood at 1.9 million at the end of April 2014, or 7.3% of the total workforce in Turkey. The
number of construction workers peaked to a record high 1.926 million people in October 2013, representing 7.9% of the country's total labour force.
Urban Transformation
Infrastructure projects
Main players
Employment

- 5 - Any redistribution of this information is strictly prohibited.
Copyright © 2014 EMIS, all rights reserved.
Source:
Economic Importance
Turkey construction sector in figures
Turkstat, Ministry of Economy, Turkish Treasury
Indicator 2008 2009 2010 2011 2012 2013
Household consumption (TRY mn) 695,620 714,245 819,224 965,772 1,044,049 1,165,985
Share of housing and rent in household consumption (%) 29.1 28.2 27.1 25.8 25.8 n/a
Consumer price inflation (%) 10.1 6.5 6.4 10.5 6.2 7.4
Construction in public sector gross fixed capital formation (TRY mn) 30,071 29,113 36,751 41,728 45,000 61,254
Public sector gross fixed capital formation (TRY mn) 36,725 35,335 43,407 49,075 54,424 73,151
Construction in private sector gross fixed capital formation (TRY mn) 60,222 44,960 55,731 76,240 82,108 80,445
Private sector gross fixed capital formation (TRY mn) 152,369 125,383 164,409 234,088 231,695 244,295
Gross fixed capital formation (TRY mn) 189,094 160,718 207,816 283,163 287,121 317,446
Foreign capital inflow in construction industry (USD mn) 337 209 310 301 1,428 206
Turkey’s total net foreign direct investment, USD mn 19,762 8,629 9,058 16,171 13,224 12,868
Construction value (TRY mn) 44,658 36,578 45,670 57,751 62,157 68,930
Share in GDP (%) 4.7 3.8 4.2 4.5 4.4 4.4
Construction industry real growth (%) -8.1 -16.1 18.3 11.5 0.6 7.1
GDP real growth (%) 0.7 -4.8 9.2 8.8 2.1 4.0
GDP, TRY mn 950,534 952,559 1,098,799 1,297,713 1,416,798 1,561,510
GDP, USD mn 742,094 616,703 731,608 773,980 786,283 820,012
GDP per capita, USD 10,444 8,561 10,003 10,428 10,459 10,782
- 6 - Any redistribution of this information is strictly prohibited.
Copyright © 2014 EMIS, all rights reserved.
Comments
Source:
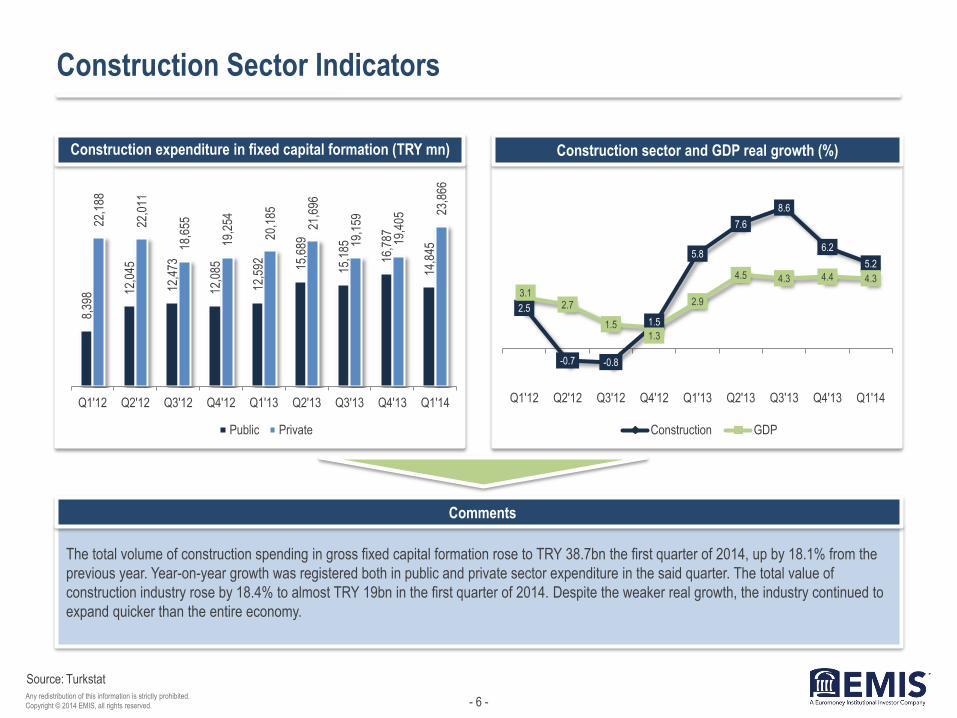
Construction Sector Indicators
The total volume of construction spending in gross fixed capital formation rose to TRY 38.7bn the first quarter of 2014, up by 18.1% from the
previous year. Year-on-year growth was registered both in public and private sector expenditure in the said quarter. The total value of
construction industry rose by 18.4% to almost TRY 19bn in the first quarter of 2014. Despite the weaker real growth, the industry continued to
expand quicker than the entire economy.
Construction expenditure in fixed capital formation (TRY mn) Construction sector and GDP real growth (%)
Turkstat
8,3
98 12,
045
12,
473
12,
085
12,
592
15,
689
15,
185
16,
787
14,
845
22,
188
22,
011
18,
655
19,
254
20,
185
21,
696
19,
159
19,
405
23,
866
Q1'12 Q2'12 Q3'12 Q4'12 Q1'13 Q2'13 Q3'13 Q4'13 Q1'14
Public Private
2.5
-0.7 -0.8
1.5
5.8
7.6
8.6
6.2
5.2
3.1 2.7
1.5 1.3
2.9
4.5 4.3 4.4 4.3
Q1'12 Q2'12 Q3'12 Q4'12 Q1'13 Q2'13 Q3'13 Q4'13 Q1'14
Construction GDP

- 7 - Any redistribution of this information is strictly prohibited.
Copyright © 2014 EMIS, all rights reserved.
Source:
Construction Sector Forecast
Turkey construction sector forecast
BMI
Indicator 2013 2014 2015 2016 2016
Construction value (TRY bn) 70.46 78.91 88.11 98.24 109.34
Construction industry real growth (%) 6.50 5.35 5.78 5.63 5.30
Construction industry of GDP (%) 4.5 4.6 4.7 4.8 4.8
Gross fixed capital formation (TRY bn) 315.30 338.79 367.16 401.58 443.35
Construction industry employment (‘000) 1,616.3 1,710.2 1,817.1 1,927.3 2,036.9
Construction industry employees as % of total
labour force 3.22 3.36 3.52 3.68 3.85
Infrastructure industry value (TRY bn) 33.47 38.08 43.19 48.77 54.86
Infrastructure Industry Value As % of Total
Construction 47.5 48.3 49.0 49.6 50.2
Infrastructure Industry Value Real Growth (%) 6.1 7.1 7.5 7.0 6.5
Infrastructure Industry Value as % of GDP 2.1 2.2 2.3 2.4 2.4
Residential and Non-residential Building
Industry Value (TRY bn) 36.99 40.84 44.92 49.47 54.48
Residential and Non-residential Building
Industry Value As % of Total Construction 52.49 51.75 50.98 50.36 49.82
Residential and Non-residential Building
Industry Value Real Growth (%) 6.86 3.76 4.12 4.26 4.12
Residential and Non-residential Building
Industry Value as % of GDP 2.36 2.38 2.39 2.40 2.40

- 8 - Any redistribution of this information is strictly prohibited.
Copyright © 2014 EMIS, all rights reserved.
Source:
Main Sector Indices
Construction production and turnover indices Construction cost index
Turkstat
0
20
40
60
80
100
120
140
160
180
200
Production index Turnover index
150
155
160
165
170
175
180
185
190
195
200
205
Residential buildings
Commercial, office, medical and school
- 9 - Any redistribution of this information is strictly prohibited.
Copyright © 2014 EMIS, all rights reserved.
Source:
Comments
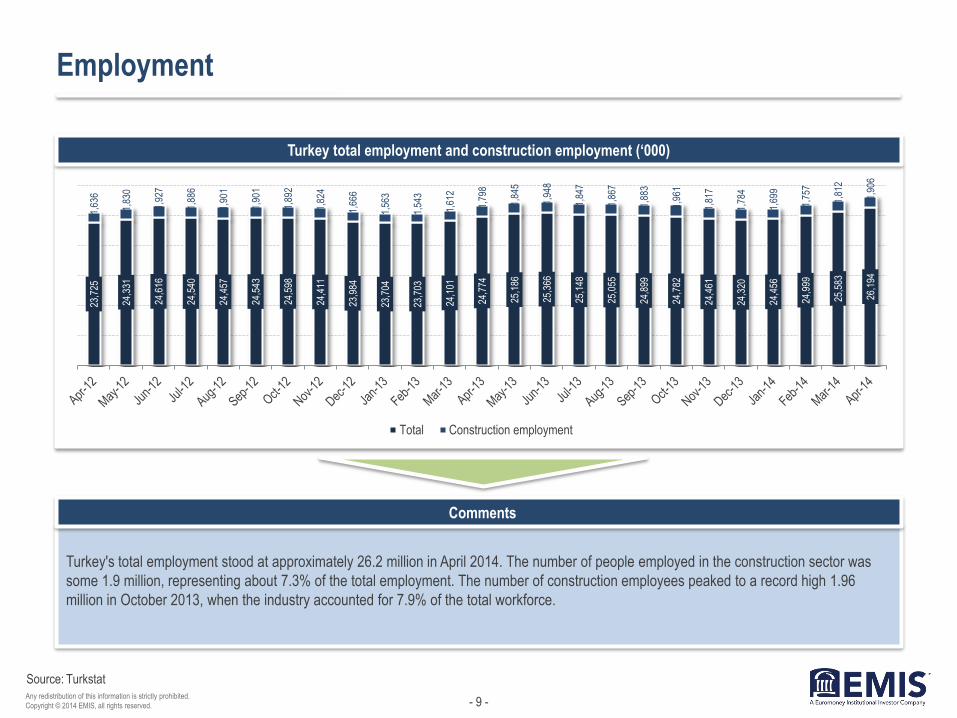
Employment
Turkey's total employment stood at approximately 26.2 million in April 2014. The number of people employed in the construction sector was
some 1.9 million, representing about 7.3% of the total employment. The number of construction employees peaked to a record high 1.96
million in October 2013, when the industry accounted for 7.9% of the total workforce.
Turkey total employment and construction employment (‘000)
Turkstat
23,7
25
24,3
31
24,6
16
24,5
40
24,4
57
24,5
43
24,5
98
24,4
11
23,9
84
23,7
04
23,7
03
24,1
01
24,7
74
25,1
86
25,3
66
25,1
48
25,0
55
24,8
99
24,7
82
24,4
61
24,3
20
24,4
56
24,9
99
25,5
83
26,1
94
1,63
6
1,83
0
1,92
7
1,88
6
1,90
1
1,90
1
1,89
2
1,82
4
1,66
6
1,56
3
1,54
3
1,61
2
1,79
8
1,84
5
1,94
8
1,84
7
1,86
7
1,88
3
1,96
1
1,81
7
1,78
4
1,69
9
1,75
7
1,81
2
1,90
6
Total Construction employment

- 10 - Any redistribution of this information is strictly prohibited.
Copyright © 2014 EMIS, all rights reserved.
Source:
Employment and Salary Indices
Employment and salary indices Labour construction cost index
Turkstat
0
20
40
60
80
100
120
140
160
Employment index Gross wage & salary index
Hourly labour cost index Hours worked index
160
170
180
190
200
210
220
230
for residential buildings
for commercial, office, medicalbuildings

- 11 - Any redistribution of this information is strictly prohibited.
Copyright © 2014 EMIS, all rights reserved.
Comments
Source:
International Operations of Turkish Contractors in 2010-2013
Turkish contractors have signed international projects worth USD 31.3bn in 2013, up by 35.5%, compared with 2010. The biggest share of the
projects in terms of value are in Turkmenistan with a 23% share, followed by Russia and Iraq with shares of 16.9% and 11.6%, respectively.
Most of the projects, about 14% of the total, were for the construction of roads, tunnels and bridges, followed by residential projects.
International projects by country International projects by type
TMB
Turkmenistan 23.0%
Russia 16.9%
Iraq 11.6%
Saudi Arabia 5.2%
Azerbaijan 4.9%
Kazakhstan 4.5% Libya 3.6%
Iran 2.9% Qatar 2.5%
Other 24.9%
Road-Tunnel-Bridge 14.0%
Residential 12.6%
Airport 8.0%
Sports Facilities 7.0%
Business Center 7.0%
Power plant 5.6%
Tourist Facility 5.2%
Petrochemical 4.5%
Industrial 3.2% Railway 2.9%
Other 30.0%

- 12 - Any redistribution of this information is strictly prohibited.
Copyright © 2014 EMIS, all rights reserved.
Comments
Source:
International Operations of Turkish Contractors to Date
The total value of the international business of Turkish contractors amounted to USD 274.2bn between 1972 and 2013. The Turkish
companies were most active in Russia, Turkmenistan and Libya. Most of the projects implemented by the Turkish contractors over this period
were residential, road/bridge/tunnel and airport developments.
Intl business of Turkish contractors (USD bn) Distribution by country (1972-2013)
TMB
4.5
11.4 12.4
24.1 25.2 24.6
21.7 23.1
20.5
29.4 31.3
2003 2004 2005 2006 2007 2008 2009 2010 2011 2012 2013Russia 18.0%
Turkmenistan 14.6%
Libya 10.2%
Iraq 7.1%
Kazakhstan 6.4%
Saudi Arabia 4.8%
Qatar 4.5% UAE 3.2%
Azerbaijan 3.2%
Algeria 3.0%
Other 25.0%

- 13 - Any redistribution of this information is strictly prohibited.
Copyright © 2014 EMIS, all rights reserved.
Source:
M&A
Mergers and acquisitions in construction and related industries (2011–July 2014)
DealWatch
Date Target Company Deal Type Stake % Buyer Country of
Buyer Deal Industries
Deal Value
(USDmn)
Feb-11 Italicementi Set Group Acquisition 100 Limak
Holding Turkey
Cement and Concrete Product
Manufacturing 400
Jun-12 Kumas Kutahya Manyezit
Isletmeleri Privatization 100
Gozde
Girisim Turkey Nonmetallic Mineral Products 286
Jul-14 Sancim Bilecik Cimento Acquisition 100 Cimsa
Cimento Turkey
Cement and Concrete Product
Manufacturing 221
Mar-12 AE Arma Elektropanc Acquisition 80 Imtech Netherlands Construction 187
Apr-12 Ozisik Insaat Acquisition 93
Cemas
Dokum
Sanayi
Turkey Construction 116
Nov-12 Yesil Insaat Acquisition 100 Borova Yapi Turkey Construction 106
Nov-13 Cemre Insaat Minority stake purchase 37 Jadwa
Investment Saudi Arabia
Residential Building
Construction 100
May-11 Afyon Cimento Minority stake purchase 26
Institutional
and private
investors
Turkey Cement Manufacturing 82
Jan-12 Graniser Granit Seramik
Sanayi Acquisition 75
Bancroft
Private Equity
United
Kingdom
Ceramic Wall and Floor Tile
Manufacturing 75
Feb-13 Akfil Holding ; Garanti Koza
Akis Adi Ortakligi Minority stake purchase
Garanti-Koza
Insaat Turkey
Land Subdivision and Land
Development 62

- 14 - Any redistribution of this information is strictly prohibited.
Copyright © 2014 EMIS, all rights reserved.
II. Construction and Occupancy Permits

- 15 - Any redistribution of this information is strictly prohibited.
Copyright © 2014 EMIS, all rights reserved.
Comments
Source:
Construction Permits by Number of Buildings
Local municipalities granted construction permits for 117,663 buildings in 2013, the highest number in three years. Most of the permits
are for residential buildings, followed by the wholesale and retail segment. A total 2,563 permits for the construction of office buildings were
issued during the year, registering the highest rise of over 34%.
Number of buildings (‘000) Distribution by buildings type (2013)
Turkstat
75.5
114.3 114.2 106.7
95.2 92.3
139.6
101.9 104.8
117.7
2004 2005 2006 2007 2008 2009 2010 2011 2012 2013
Residential building with
two and more dwellings 66%
Single dwelling building 19%
Wholesale & retail trade 3%
Industrial & Warehouses
3%
Other 9%

- 16 - Any redistribution of this information is strictly prohibited.
Copyright © 2014 EMIS, all rights reserved.
Comments
Source:
Floor Area of Construction Permits
The total floor area of buildings with newly-issued construction permits rose by almost 10% to 168.9 million m2 in 2013. Residential buildings with two and
more dwellings accounted for the biggest share of permits in terms of floor area, followed by public entertainment, education, hospital or institutional care
buildings and industrial buildings.
The highest increase of 26.5% was registered in the floor area of permits issued for hotels and other accommodation buildings, followed by industrial
buildings and warehouses with an 18.7% growth. A decrease of 22.6% was registered in the floor area of permits issued for the construction of buildings
used in wholesale and retail trade.
Floor area of issued construction permits (million m2) Floor area by building type 2013
Turkstat
69.7
106.4
122.9 125.1
103.8 100.7
176.4
123.6
153.7
168.9
2004 2005 2006 2007 2008 2009 2010 2011 2012 2013
Residential building with two and more dwellings 72%
Public entertainment,
education, hospital 6%
Industrial & warehouses
5% Wholesale &
retail 4%
Office 4%
Other 9%

- 17 - Any redistribution of this information is strictly prohibited.
Copyright © 2014 EMIS, all rights reserved.
Comments
Source:
Construction Permits Value
The total value of buildings with newly-issued construction permits rose by 15.5% to an all time high of TRY 121.8bn in 2013. Residential
buildings with two and more dwellings represented nearly 73% of the value of the newly-issued construction permits. The highest growth of
36.9% was registered in the value of permits issued for hotels and other accommodation buildings, which totalled TRY 3.3bn. Industrial
buildings and warehouses segment followed with a 24.8% increase to TR 5.5bn. The only shrinking segment was that of wholesale and retail
trade buildings, with a drop of 19.6% to TRY 4.8bn in the value of issued construction permits.
Value of issued construction permits (TRY bn) Value by building type (2013)
Turkstat
24.1
40.5
56.2 61.3 59.0
54.4
101.9
80.8
105.5
121.8
2004 2005 2006 2007 2008 2009 2010 2011 2012 2013
Residential building with
two and more dwellings 73%
Public entertainment
6% Industrial &
Warehouses 5%
Office 4%
Wholesale & retail 4%
Other 9%

- 18 - Any redistribution of this information is strictly prohibited.
Copyright © 2014 EMIS, all rights reserved.
Comments
Source:
Occupancy Permits by Number of Buildings
The total number of buildings with newly-issued occupancy permits rose by 23.9% to 118,036 in 2013. Residential buildings with two
and more dwellings accounted for 63 of the newly-issued occupancy permits. The highest annual increase of was registered in the occupancy
permits issued to hotels & accommodation buildings and traffic & communication buildings, which more than doubled to 1,661 and 153,
respectively.
Number of buildings (‘000) Distribution by buildings type (2013)
Turkstat
40.8
64.1 73.4
68.1 76.1
94.8
82.1
98.3 95.2
118.0
2004 2005 2006 2007 2008 2009 2010 2011 2012 2013
Residential building with
two and more dwellings 63%
Single dwelling
building 22%
Wholesale & retail trade 6%
Industrial & Warehouses
3%
Other 6%

- 19 - Any redistribution of this information is strictly prohibited.
Copyright © 2014 EMIS, all rights reserved.
Comments
Source:
Floor Area of Occupancy Permits
The total floor area of buildings with newly-issued occupancy permits rose by 28.3 to 134.1 million m2 in 2012. Most of the permits were
issued to residential buildings, followed by buildings for wholesale and retail trade. The highest annual increase was registered in the floor
area of permits issued for traffic and communication buildings as well as for hotels and accommodation buildings.
Floor area of issued occupancy permits (million m2) Floor area by building type (2013)
Turkstat
31.0
50.3 57.2
63.4 71.0
94.6 85.3
105.7 104.5
134.1
2004 2005 2006 2007 2008 2009 2010 2011 2012 2013
Residential building with
two and more dwellings
71.5%
Wholesale & retail 6.3%
Industrial & warehousing
5.8%
Public entertainment,
education, hospital 3.8%
Other 12.5%

- 20 - Any redistribution of this information is strictly prohibited.
Copyright © 2014 EMIS, all rights reserved.
Comments
Source:
Occupancy Permits Value
The total value of buildings with newly-issued occupancy permits surged by 36.5% to record high TRY 94.9bn in 2013. Significant growth was
seen in all segments with the highest increases registered in the value of permits issued for traffic and communication buildings with 85.5% as
well as for hotels and accommodation buildings with 74.2%.
Value of issued occupancy permits (TRY bn) Value by building type (2013)
Turkstat
10.3
18.4 25.1
30.4
39.0
49.4 47.4
67.0 69.5
94.9
2004 2005 2006 2007 2008 2009 2010 2011 2012 2013
Residential building with two and more
dwellings 72.5%
Wholesale & retail 6.1%
Industrial & Warehouses
5.5% Public
entertainment, education,
hospital 3.8%
Single dwelling building 3.4%
Other 9%

- 21 - Any redistribution of this information is strictly prohibited.
Copyright © 2014 EMIS, all rights reserved.
III. Homes and Commercial Centers
- 22 - Any redistribution of this information is strictly prohibited.
Copyright © 2014 EMIS, all rights reserved.
Source:
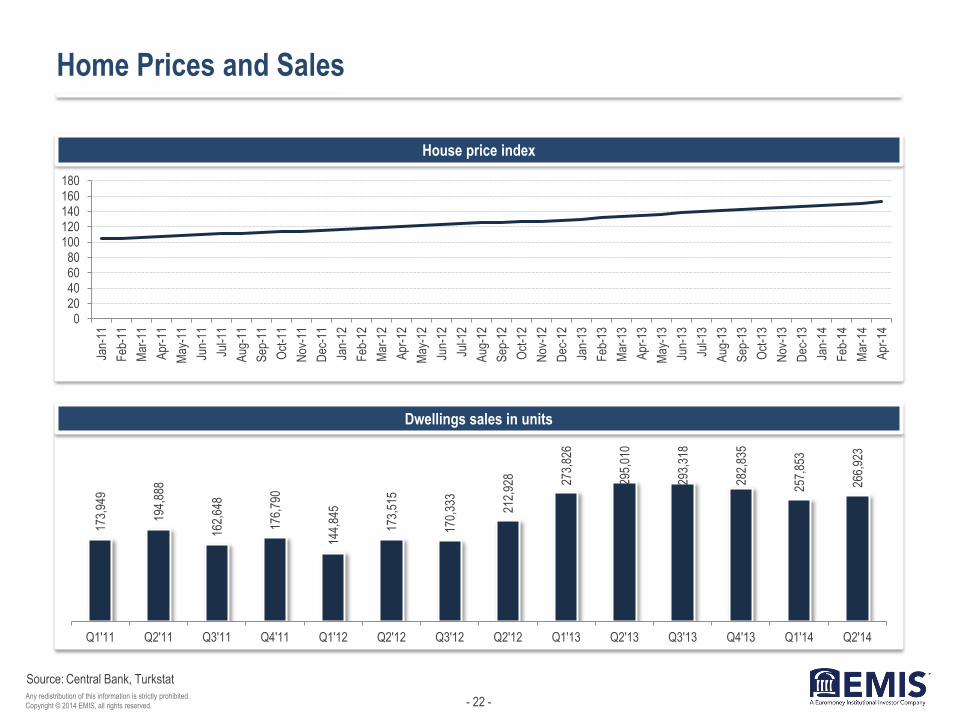
Home Prices and Sales
House price index
Dwellings sales in units
Central Bank, Turkstat
020406080
100120140160180
Jan-
11
Feb
-11
Mar
-11
Apr
-11
May
-11
Jun-
11
Jul-1
1
Aug
-11
Sep
-11
Oct
-11
Nov
-11
Dec
-11
Jan-
12
Feb
-12
Mar
-12
Apr
-12
May
-12
Jun-
12
Jul-1
2
Aug
-12
Sep
-12
Oct
-12
Nov
-12
Dec
-12
Jan-
13
Feb
-13
Mar
-13
Apr
-13
May
-13
Jun-
13
Jul-1
3
Aug
-13
Sep
-13
Oct
-13
Nov
-13
Dec
-13
Jan-
14
Feb
-14
Mar
-14
Apr
-14
173,
949
194,
888
162,
648
176,
790
144,
845
173,
515
170,
333
212,
928 27
3,82
6
295,
010
293,
318
282,
835
257,
853
266,
923
Q1'11 Q2'11 Q3'11 Q4'11 Q1'12 Q2'12 Q3'12 Q2'12 Q1'13 Q2'13 Q3'13 Q4'13 Q1'14 Q2'14

- 23 - Any redistribution of this information is strictly prohibited.
Copyright © 2014 EMIS, all rights reserved.
Comments
Source:
New House Price Index
New house prices rose by 0.34% month-on-month and by 12.05% year-on-year in June 2014, according to New House Price Index calculated
by REIDIN.com and GYODER. The prices increased by 13.62% in 2013 and by 44.3% since January 2010 when the index was introduced.
New house price index Monthly growth of new house prices (%)
Central Bank, REIDIN-GYODER
0
20
40
60
80
100
120
140
160
Jan-
11
Mar
-11
May
-11
Jul-1
1
Sep
-11
Nov
-11
Jan-
12
Mar
-12
May
-12
Jul-1
2
Sep
-12
Nov
-12
Jan-
13
Mar
-13
May
-13
Jul-1
3
Sep
-13
Nov
-13
Jan-
14
Mar
-14
0.55
0.23
1.02
0.31
0.54
1.84 1.88
2.66
1.51
1.06 0.98
0.28 0.49
0.34 0.41
1.03
0.47 0.34
Jan-
13
Feb
-13
Mar
-13
Apr
-13
May
-13
Jun-
13
Jul-1
3
Aug
-13
Sep
-13
Oct
-13
Nov
-13
Dec
-13
Jan-
14
Feb
-14
Mar
-14
Apr
-14
May
-14
Jun-
14

- 24 - Any redistribution of this information is strictly prohibited.
Copyright © 2014 EMIS, all rights reserved.
Comments
Source:
Housing Loans
The volume of housing loans increased by 284% to over TRY 110bn in 2013. Housing loans accounted for over 45% of consumer loans and
10.5% of total loans at the end of 2013.
Most of the housing loans are extended for 5 to 10 years and the size of an average housing loan is some TRY 84,000 (USD 38,000).
Housing loans and average interest rate Housing loans outstanding (TRY bn)
Central Bank, GYODER
0.81
0.92
1.04
1.20
1.10 1.05
0.98 0.83
0.76 0.69
0.91 0.89
0.65 0.71 0.73 0.75 0.75 0.78 0.78 0.81
0.85 0.92
1.06 1.10
Q1'11 Q2'11 Q3'11 Q4'11 Q1'12 Q2'12 Q3'12 Q2'12 Q1'13 Q2'13 Q3'13 Q4'13
Monthly interest rate (%) Extended loans (100 mn TRY)
12.79
23.20
32.23 38.78
44.69
60.69
74.51
85.95
110.43
2005 2006 2007 2008 2009 2010 2011 2012 2013

- 25 - Any redistribution of this information is strictly prohibited.
Copyright © 2014 EMIS, all rights reserved.
Comments
Source:
Housing Lending by Quarters
The number and volume on newly-extended housing loans peaked in the second quarter of 2013 with the decline in interest rates. Over
198,000 borrowers received housing loans worth more than TRY 16.8bn in the second quarter of 2013.
Volume of newly issued housing loans (TRY bn) Number of borrowers of new housing loans (‘000)
Banks Association of Turkey
9.8 9.4
5.3 5.3 4.8
6.8 6.5
10.3
12.3
16.9
11.2
9.9
7.2
Q1'11 Q2'11 Q3'11 Q4'11 Q1'12 Q2'12 Q3'12 Q4'12 Q1'13 Q2'13 Q3'13 Q4'13 Q1'14
135.2 124.6
75.1 79.2 66.6
87.8 85.4
133.0
152.5
198.0
130.4 114.9
85.6
Q1'11 Q2'11 Q3'11 Q4'11 Q1'12 Q2'12 Q3'12 Q4'12 Q1'13 Q2'13 Q3'13 Q4'13 Q1'14

- 26 - Any redistribution of this information is strictly prohibited.
Copyright © 2014 EMIS, all rights reserved.
Source:
Shopping Centers
Total number and leasable space of shopping centers
In 2013, 30 new Turkish shopping centers opened
doors adding over 1.0 million m2 to the total leasable
area across the country.
At the end of 2013, the country had 326 shopping
centres with combined leasable area of 9.25 million
m2. Local investors account for around 66% of the
operating shopping centres in terms of leasable area.
The share of foreign investors is 27% and the
remaining ownership is mixed.
By the end of 2016, the total number of shopping
centres in Turkey is expected to increase to some
450. Their total leasable area is seen at around 13.6
million m2.
Leasable area per capita (m2)
GYODER
3.1 4.1 5.1 5.8 6.5 7.6 8.2 9.2 11.2
12.8 13.6 117 145
189 207 232
264 296
326
389 431 449
0
100
200
300
400
500
0
2
4
6
8
10
12
14
16
2006 2007 2008 2009 2010 2011 2012 2013 2014(e)
2015(e)
2016(e)
Leasable area ('000 m2) Number of shopping centres
57.6
71.2 79.9
88.6
101.9 108.8
122.5
2007 2008 2009 2010 2011 2012 2013

- 27 - Any redistribution of this information is strictly prohibited.
Copyright © 2014 EMIS, all rights reserved.
IV. Related Industries

- 28 - Any redistribution of this information is strictly prohibited.
Copyright © 2014 EMIS, all rights reserved.
Source:
Cement & Clinker Industry
Cement and clinker production (million tons)
Turkey is the largest European and world's fourth
biggest cement producer after China, India and the
United States.
The Turkish cement producers increased their output
by 11.7% % to 71.3 million tons in 2013, according to
data of Turkish Cement Manufacturers Association
(TCMB).
The total output figure does not include production of
manufacturers, which are not TCMB members.
Domestic sales of TCMB members rose by 13% to
53.9 million tons in 2013. They had a combined an
annual capacity of 107.7 million tons of cement and
68.5 million tons of clinker at the end of 2013.
The annual turnover of the Turkish cement sector is
estimated at some USD 4bn.
Domestic cement sales (million tons)
TCMB
49.3 51.4 54.0 62.7 63.4 63.9
71.3
41.6 44.7 46.2 52.8 54.3 54.8
60.2
2007 2008 2009 2010 2011 2012 2013
Cement Clinker
42.5 40.6 40
47.7 52.3 53.9
60.9
2007 2008 2009 2010 2011 2012 2013

- 29 - Any redistribution of this information is strictly prohibited.
Copyright © 2014 EMIS, all rights reserved.
Comments
Source:
Steel Industry
Turkey's crude steel production decreased by 3.4% to 34.6 million tons in 2013 but kept its place as the eighth biggest steel manufacturer in
the world despite the decline. The country's production reached a record high 35.9 million tons in 2012.
Turkish steel exports declined 7.9% in value terms to USD 15.78bn in 2013, while imports rose by 14.1% to USD 12.81bn.
Crude steel production and consumption (million tons) Steel & iron foreign trade (million tons)
DCUD
25.8 26.8 25.3
29.1
34.1 35.9 34.7
23.8 21.5
18.0
23.6
26.9 28.5
31.3
2007 2008 2009 2010 2011 2012 2013
Production Consumption
16.7
20.0 18.7
17.6 18.5
20.3 19
13.9 13.6
10.5 11.1 10.7 11.6
14.9
2007 2008 2009 2010 2011 2012 2013
Exports Imports
- 30 - Any redistribution of this information is strictly prohibited.
Copyright © 2014 EMIS, all rights reserved.
V. Latest Developments

- 31 - Any redistribution of this information is strictly prohibited.
Copyright © 2014 EMIS, all rights reserved.
Latest Developments Part I
Infrastructure
investment Turkey will need to invest some USD 700bn in infrastructure projects until 2023, Deputy Prime Minister Ali Babacan
said in late June 2014. Of these, about USD 200bn are to be spent through public-private-partnerships (PPP).
Enka
In July 2014, Turkish energy-to-construction firm Enka Insaat and Bechtel, the largest U.S. engineering company,
were selected by the government of Kosovo to build a new 60-kilometer motorway linking the capital Pristina with
neighboring Macedonia. The project will cost EUR 600mn. This is the second motorway contract awarded to the
consortium in Kosovo.
Gas Storage
Construction
In July 2014, World Bank approved an additional financing of USD 400mn to the already existing Gas Sector
Development Project in Turkey. The additional loan would finance the cost overrun in the Tuz Golu gas storage
facility. The original USD 325mn project, approved in 2005, consists of two component and the gas storage facility
and a network expansion.
Bosphorus
Bridges
In May 2014, Turkish construction firm IC Ictas and Italy's Astaldi announced the financial close of a USD 2.3bn
loan extended by a group of local lenders for the construction of a third Bosphorus bridge. The overall value of the
project is about USD 2.9bn. The concession has a 10-year duration with 30 months allocated for construction.
Tekfen
In May 2014, Tekfen Holding said its contracting subsidiary Tekfen Insaat's 40% subsidiary Azfen JV and Italian oil
services company Saipem have won a USD 735mn contract to build a natural gas pipeline in Shah Deniz Phase II
natural gas project in Azerbaijan.

- 32 - Any redistribution of this information is strictly prohibited.
Copyright © 2014 EMIS, all rights reserved.
Latest Developments Part II
Ronesans
Insaat In May 2014, Turkish builder Ronesans Insaat started the construction of a USD 450mn St. Petersburg Kola
Industrial Park in Russia. The development will include industrial buildings, warehouses and office buildings.
Third
Istanbul
Airport
The government will not provide state guarantee for the construction of the third airport project in Istanbul, Treasury
Undersecretary, Ibrahim Canakci, said in May 2014. The EUR 22.15bn project was won by the Cengiz-Kolin-Limak-
Mapa-Kalyon consortium, which will operate the airport for 25 years. The airport will have six runways and service
150 million passengers annually.
Elitas, Kur
and Intas
A consortium made up of Turkish construction companies Elitas, Kur and Intas won a USD 415mn tender to build
the 60 Metre Street in Sulaymaniyah, in Iraq's Kurdistan region. The project is scheduled to be completed in three
years.
TANAP The construction of Trans-Anatolian Natural Gas Pipeline (TANAP) will start in April 2015, the project's general
manager, Saltuk Duzyol, said in April 2014. The USD 20bn pipeline will transport natural gas from the Shah Deniz II
field in Azerbaijan to Europe starting from 2018 or 2019. The construction was initially planned to start in 2013.
Akkuyu
nuclear plant
In February 2014, Russia's Atomstroyexport said it will may start the construction Turkey's first nuclear plant in
Akkuyu on the Mediterranean coast as soon as it receives environmental impact report approval in April or May this
year. The total cost of the 4,800 MW plant is estimated at USD 20bn.
- 33 - Any redistribution of this information is strictly prohibited.
Copyright © 2014 EMIS, all rights reserved.
VI. Main Players

- 34 - Any redistribution of this information is strictly prohibited.
Copyright © 2014 EMIS, all rights reserved.
Highlights
Source:
Tekfen Holding
Financial performance (TRY mn)
Contracting group performance (TRY mn)
Tekfen Holding was established in 1956 as an
engineering and consultancy firm. Currently the group
comprises contracting, agri industry, real estate and
other divisions.
Tekfen continued operations in eight countries in
2013. It had a backlog of USD 3bn at the end of 2013.
Backlog abroad constitutes 84% of the total.
This portfolio, concentrating mainly on three
geographical regions, namely the Caspian Region,
Middle East and North Africa, includes, besides
Turkey, Azerbaijan, Turkmenistan, Iraq, Saudi Arabia,
Qatar, Morocco and Libya.
The group has three manufacturing plants in Derince,
Ceyhan in Turkey and in Baku, Azerbaijan.
Tekfen Holding had total assets of TRY 4.7bn and
workforce of over 15,500 people at the end of 2013.
Company data
3,949 3,846 3,991
300
-64
151 281 10 272
2012 2013 2014 (projected)
Revenues Net profit EBIDTA
2,395 2,327 2,445
24
-217
37 142
-100
167
2012 2013 2014 (projected)
Revenues Net profit EBIDTA

- 35 - Any redistribution of this information is strictly prohibited.
Copyright © 2014 EMIS, all rights reserved.
Source:
Tekfen Holding (cont’d)
Revenue breakdown (2013)
Investment (TRY mn)
Backlog by countries (end-2013)
Workforce (2013)
Company data
Contracting 60.5%
Agri industry 37.0%
Real estate 0.8%
Other 1.7%
Contracting 87.8%
Agri-industry 6.7%
Real estate 2.2%
Other 3.3%
78.4
142.6
24.7
11.4
49.9
158.4 6.7
0.8 1.0
96.5 193.3 184.1
0
50
100
150
200
250
2011 2012 2013
Contracting Agri Industry
Other (incl. real estate) Total
Turkey 15.8% Turkmenistan 1.1%
Azerbaijan 55.3%
Saudi Arabia 3.5% Marocco 1.4%
Qatar 18.4%
Libya 3.3%
Iraq 1.2%

- 36 - Any redistribution of this information is strictly prohibited.
Copyright © 2014 EMIS, all rights reserved.
Highlights
Source:
Enka Insaat
Financial performance (USD mn)
Construction operations performance
Enka was founded in 1957. It active in construction, power
generation, real estate investment and management,
trading and manufacturing.
The company undertakes projects in Turkey, Russia and
the CIS region, the MENA region and Europe, usually with
international contractors and often with its long-standing
partner U.S.-based Bechtel.
Enka Insaat had a project backlog of USD 3.17bn in the
construction segment at the end of 2013. The group
employs over 25,300.
Company data
5,037 5,746
6,547
509 628 656 857 708 1,032
2011 2012 2013
Revenues Net profit EBIDTA
993
1,384
2,550
259 125
357
2011 2012 2013
Revenues EBIDTA

- 37 - Any redistribution of this information is strictly prohibited.
Copyright © 2014 EMIS, all rights reserved.
Source:
Enka Insaat (cont’d)
Real estate performance (USD mn)
Revenue distribution (2013)
Backlog by countries (end-2013)
Ownership
Company data
407 442
478
306 308 346
2011 2012 2013
Revenues EBIDTA
Construction 37.7%
Power generation
48.6%
Real estate 7.1%
Trade & manufacturing
6.6%
Iraq 37.1%
US Embassy Projects 14.3%
Russia 10.4%
Oman 9.8%
Gabon 6.9%
Turkey 6.7%
USA 6.1%
Libya 3.1%
Kazakhstan 1.9%
Other 3.7%
Tara family 50.1%
Gulcelik family 31.6%
Enka Foundation
6.0%
Free float 12.3%
- 38 - Any redistribution of this information is strictly prohibited.
Copyright © 2014 EMIS, all rights reserved.
Highlights
Source:
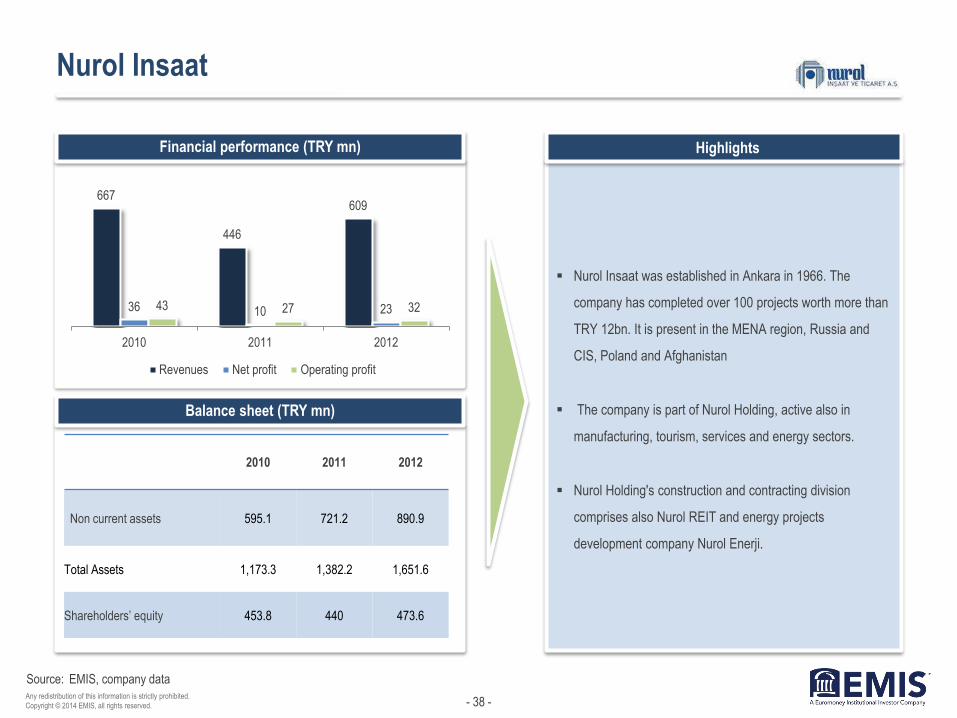
Nurol Insaat
Financial performance (TRY mn)
Balance sheet (TRY mn)
Nurol Insaat was established in Ankara in 1966. The
company has completed over 100 projects worth more than
TRY 12bn. It is present in the MENA region, Russia and
CIS, Poland and Afghanistan
The company is part of Nurol Holding, active also in
manufacturing, tourism, services and energy sectors.
Nurol Holding's construction and contracting division
comprises also Nurol REIT and energy projects
development company Nurol Enerji.
EMIS, company data
2010 2011 2012
Non current assets 595.1 721.2 890.9
Total Assets 1,173.3 1,382.2 1,651.6
Shareholders’ equity 453.8 440 473.6
667
446
609
36 10 23 43 27 32
2010 2011 2012
Revenues Net profit Operating profit

- 39 - Any redistribution of this information is strictly prohibited.
Copyright © 2014 EMIS, all rights reserved.
Highlights
Source:
Nurol REIT
Financial performance (TRY mn)
Ownership
Nurol REIT, part of Nurol Group, was established in
September 1997. It was listed on the Istanbul Stock
Exchange in December 1999.
The company’s current portfolio includes Nurol Plaza
office building and Nurol Zekeriyakoy Houses in
Istanbul, Nurol Residence and Karum Business and
Shopping Center in Ankara and shopping, culture and
entertainment center Oasis in seaside resort Bodrum.
The company has another three mix-use
developments - Nurol Tower, Nurol Park and
Seyrantepe projects, all in Istanbul.
Nurol REIT plans to invest USD 340mn in Nurol Park
project, which it will develop on the land of former
Hurriyet Medya Tower, acquired from Dogan Group for
USD 127.5mn.
Company data
Nurol Insaat 31.97%
Nurol Yatirim Bankasi 15.97%
Free float 52.03%
Other 0.04%
2011 2012 2013
Net sales 4.6 4.3 8.4
Net profit/loss 1 7.1 -17.3
Total assets 178.6 508.1 840.5

- 40 - Any redistribution of this information is strictly prohibited.
Copyright © 2014 EMIS, all rights reserved.
Highlights
Source:
Cimsa
Financial performance (TRY mn)
Owenership
Cement producer Cimsa, established in 1972, is part
of industrial conglomerate Sabanci Holding and is
listed on Borsa Istanbul.
The company operates five integrated factories,
located in Mersin, Kayseri, Eskisehir, Nigde and
Afyon. It has a grinding facility in Ankara, s terminal in
Marmara region and a cement packing plant in
Malatya. The company has 35 ready-mix concreate
plants across Turkey.
In 2012, Cimsa acquired 51% of cement manufacturer
Afyon Cimento from Italy's ItalCementi Group for USD
32.4mn and in July 2014 it agreed to purchase rival
Sancim for USD 220.7mn.
Cimsa is the third largest white cement manufacturer
worldwide. It is present in 46 countries through
subsidiaries and terminals, including in Spain,
Germany, Romania and Russia.
Company data
801 857
954
123 111
302 201 192 234
2011 2012 2013
Revenues Net profit EBITDA
Sabanci Holding 49.42%
Aberdeen Asset Management 13.79%
Adana Cimento 5.11%
Akcansa Cimento 8.98%
Sabanci Foundation 0.11%
Other 22.59%

- 41 - Any redistribution of this information is strictly prohibited.
Copyright © 2014 EMIS, all rights reserved.
Source:
Cimsa (cont’d)
Cement production (million tons)
Clinker production (million tons)
Cement products by type (2013)
Clinker products by type (2013)
Company data
5.6
6.1
6.3
2011 2012 2013
4.9
5.2
5.5
2011 2012 2013
Grey cement 84%
White cement 16%
Other products 1%
Grey clinker 81%
White clinker 19%
Other products 1%

- 42 - Any redistribution of this information is strictly prohibited.
Copyright © 2014 EMIS, all rights reserved.
Contact:
Corporate Headquarters
Nestor House
Playhouse Yard
London EC4V 5EX
UK
Voice: +44 207 779 8471
Fax: +44 207 779 8224
Americas Headquarters
225 Park Avenue South
New York, New York 10003
US
Voice: +1 212 610 2900
Fax: +1 212 610 2950
Asia Headquarters
Eucharistic Congress Bldg. No.
III
4th Floor, 5 Convent Street
Mumbai 400 001
India
Voice: +91 22 22881123
Fax: +91 22 22881137
Disclaimer:
The material is based on sources which we believe are reliable, but no warranty, either expressed or implied, is provided in relation to the accuracy or completeness
of the information. The views expressed are our best judgment as of the date of issue and are subject to change without notice. EMIS and Euromoney Institutional
Investor PLC take no responsibility for decisions made on the basis of these opinions.
Any redistribution of this information is strictly prohibited. Copyright © 2014 EMIS, all rights reserved. A Euromoney Institutional Investor company.
About EMIS Insight
EMIS Insight is a unit of EMIS that produces proprietary strategic research and analysis. The service features market overviews, industry trend analysis, legislation
and profiles of the leading sector companies provided by locally-based analysts.
About EMIS
Founded in 1994, EMIS (formerly known as ISI Emerging Markets) was acquired by Euromoney Institutional Investor PLC in 1999. EMIS works from over 15 offices
around the world to deliver electronic information products, by subscription, to institutional customers globally. EMIS provides hard-to-get information covering more
than 100 emerging markets. Its flagship products are EMIS Intelligence and EMIS Professional.
EMIS clients include top investment banks, corporations, law firms, consultants, investment and insurance companies, universities and libraries, multilateral
organizations, and others.