CONSTI GROUP PLC - investor.consti.fiHighlights of the financial year 2017 2 15/02/2018 Building...
28
CONSTI GROUP PLC FINANCIAL STATEMENTS 1 JANUARY – 31 DECEMBER 2017 CEO Esa Korkeela Building renovation specialist | www.consti.fi
Transcript of CONSTI GROUP PLC - investor.consti.fiHighlights of the financial year 2017 2 15/02/2018 Building...

CONSTI GROUP PLCFINANCIAL STATEMENTS
1 JANUARY – 31 DECEMBER 2017
CEO Esa Korkeela
Building renovation specialist | www.consti.fi

Contents
Highlights and Group performance
Cash flow and financial position
Market outlook, guidance and summary
Appendix
Building renovation specialist | www.consti.fi
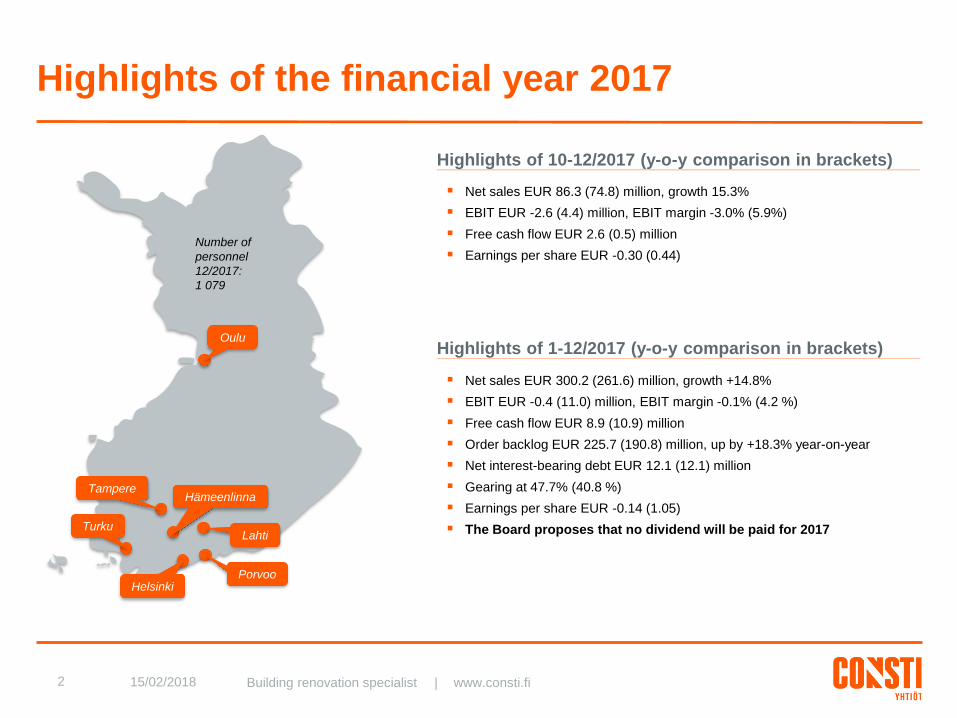
Highlights of the financial year 2017
2 15/02/2018 Building renovation specialist | www.consti.fi
Oulu
Turku
Helsinki
Lahti
HämeenlinnaTampere
Number of
personnel
12/2017:
1 079
Net sales EUR 86.3 (74.8) million, growth 15.3%
EBIT EUR -2.6 (4.4) million, EBIT margin -3.0% (5.9%)
Free cash flow EUR 2.6 (0.5) million
Earnings per share EUR -0.30 (0.44)
Highlights of 10-12/2017 (y-o-y comparison in brackets)
Porvoo
Net sales EUR 300.2 (261.6) million, growth +14.8%
EBIT EUR -0.4 (11.0) million, EBIT margin -0.1% (4.2 %)
Free cash flow EUR 8.9 (10.9) million
Order backlog EUR 225.7 (190.8) million, up by +18.3% year-on-year
Net interest-bearing debt EUR 12.1 (12.1) million
Gearing at 47.7% (40.8 %)
Earnings per share EUR -0.14 (1.05)
The Board proposes that no dividend will be paid for 2017
Highlights of 1-12/2017 (y-o-y comparison in brackets)

Consti Group’s sales overview – Diverse business and
customer mix with strong focus on growth centres
3 15/02/2018 Building renovation specialist | www.consti.fi
BUSINESS
SEGMENTS
GEOGRAPHICAL
LOCATIONS
CUSTOMER
GROUPS
2016 Net sales: EUR 262m
39%
28%
33% Technical Building Services
Renovation Contracting
Building Facades
78%
10%
12%
Helsinki & Uusimaa
Tampere & Pirkanmaa
Others
35%
26%
24%
15%Housing companies
Public sector
Real estate investors
Corporations
Share of Service: 15%
2017 Net sales: EUR 300m
37%
26%
37% Technical Building Services
Renovation Contracting
Building Facades
78%
11%
10%
Helsinki & Uusimaa
Tampere & Pirkanmaa
Others
32%
35%
17%
15%Housing companies
Public sector
Real estate investors
Corporations
Share of Service: 16 %
1) Business area splits excluding eliminations

95
.4
10
2.6
10
3.9
11
6.1
54
.5
68
.7
75
.0
80
.9
70
.5 89
.2
88
.6 11
3.9
27
.2
32
.2
40
.4
46
.8
21
5.9 25
6.2
26
1.6 30
0.2
'14 '15 '16 '17 '14 '15 '16 '17 '14 '15 '16 '17 '14 '15 '16 '17 '14 '15 '16 '17
TechnicalBuilding
Services (TBS)
. RenovationContracting
. BuildingFacades
. Service . Consti Group
Net sales development in 2017:
Net sales grew in all business areas
15/02/20184
Annual net sales development by business area 2014 – 2017 (EUR m)
Building renovation specialist | www.consti.fi
Comments
■ FY2017 net sales EUR 300.2 million
• y-o-y sales growth 14.8% (EUR 38.6 million)
• organic growth 9.8% (EUR 25.5 million)
• acquisition growth 5.0% (EUR 13.1 million)
– Building Facades +28.6%
– Technical Building Services +11.8%
– Renovation Contracting +7.8%
– Service operations, which are included in
business areas’ figures, grew by 15.6%
• In Building Facades, growth came
mainly from Greater Helsinki area’s
Facade business
• In TBS, growth due to higher sales in
business premises
• In Renovation Contracting, growth
continued in the Greater Helsinki area
and were also increased due to the
acquisitions made during the second
half of the yearNot a separate
business area
1) Business area splits excluding eliminations

18
1.3
19
1.7 2
12
.6
18
5.6
19
0.8 2
12
.9 22
7.9
19
8.8
22
5.7
Q4
/15
Q1
/16
Q2
/16
Q3
/16
Q4
/16
Q1
/17
Q2
/17
Q3
/17
Q4
/17
63
.6
51
.2
75
.6
30
.3
66
.1
59
.5
83
.0
30
.7
10
4.9
Q4
/15
Q1
/16
Q2
/16
Q3
/16
Q4
/16
Q1
/17
Q2
/17
Q3
/17
Q4
/17
74
.9
51
.4
64
.8 70
.6 74
.8
57
.3
78
.8
77
.8
86
.3
Q4
/15
Q1
/16
Q2
/16
Q3/1
6
Q4
/16
Q1
/17
Q2
/17
Q3
/17
Q4/1
7
Quarterly performance overview:
Net sales, order intake and order backlog increased
15/02/20185 Building renovation specialist | www.consti.fi
Quarterly net sales (EUR m) Quarterly order intake (EUR m) Quarterly order backlog (EUR m)

30.323.7
28.0 25.7 26.5 26.032.8
25.831.5
20.7
16.8
17.2 19.6 21.316.0
20.7
21.4
22.8
25.2
11.8
20.727.0
29.1
16.9
27.634.1
35.4
-1.2 -1.0 -1.1 -1.7 -2.1 -1.6 -2.3 -3.5 -3.3
74.9
51.4
64.870.6
74.8
57.3
78.8 77.8
86.3
-5
15
35
55
75
95
Q4/15 Q1/16 Q2/16 Q3/16 Q4/16 Q1/17 Q2/17 Q3/17 Q4/17
Qu
art
erly N
et sa
les (
EU
R m
illio
n)
Quarterly net sales development:
Fourth quarter net sales up by 15.3%
15/02/20186
Quarterly net sales development Q4/2015 – Q4/2017 (EUR m)
Building renovation specialist | www.consti.fi
Comments
■ Q4/2017 net sales EUR 86.3 million (74.8
million)
• y-o-y sales growth 15.3% (EUR 11.5
million)
• organic growth 9.1% (EUR 6.8 million)
• acquisition growth 6.3% (EUR 4.7 million)
– In Building Facades, growth of 21.7%
attributable to good performance
particularly in the Greater Helsinki area’s
facade business.
– In TBS, increase of 18.8% due to higher
sales in business premises.
– In Renovation Contracting, growth of
6.7% supported by continued growth in
the Greater Helsinki area and by the
acquisitions made during the second half
of the year.
Technical Building Services (TBS)
Renovation Contracting
Building Facades
Eliminations

0.2
2.6
3.74.4
0.3
2.7
-0.8
-2.6
0.4 %
4.0 %
5.3 %
5.9 %
0.5 %
3.4 %
-1.0 %
-3.0 %
-4%
-2%
0%
2%
4%
6%
8%
-4
-2
0
2
4
6
8
Q1/16 Q2/16 Q3/16 Q4/16 Q1/17 Q2/17 Q3/17 Q4/17
Qu
arte
rly E
BIT
ma
rgin
(line
gra
ph
)
Quart
erly E
BIT
(E
UR
mill
ion, bar
gra
ph)
EBIT EBIT margin
Quarterly EBIT development: Corrective actions for improving
profitability initiated and ongoing (1/2)
15/02/20187
Quarterly EBIT development Q4/2015 – Q4/2017 (EUR m)
Building renovation specialist | www.consti.fi
Comments
■ Q4/17 EBIT amounted to EUR -2.6 (4.4) million,
or -3.0% (5.9 %) of net sales
– Profitability problems in project management
and execution weakened Q4 operating result
– Consti has continued to assess ongoing and
completed projects, which still have remaining
disagreements and unfinished work.
– Based on the assessments, we further
adjusted our cost and profitability estimates for
the project base and made provisions and
write-offs mainly to the Technical Building
Services business area, as well as one
ongoing project in our Renovation Contracting
business area.
– In addition, the operating result was weakened
by the execution of the remaining performance
obligations from certain already identified
projects that generate low gross margin on
sales.
■ Full-year 2017 EUR -0.4m (11.0m), or -0.1%
(4.2%) of net sales

TBS
15/02/20188 Building renovation specialist | www.consti.fi
Comments (continued)
■ Corrective actions:
– Reorganisation of the Technical Building Services business area
• New organisation in place as of 1 Jan 2018
• Implementation of processes ongoing
• Support functions streamlined
• Increased margin requirements
• Realigned requirements for selecting offered worksites
• New Branch level leader in TBS and multiple changes at project level
executed
• With the reorganisation, our aim is
– to improve the accountability of our businesses and
– ability to response to market needs as well as
– to clarify service offering and to improve project management
– Decentralised operating model unchanged
• Branch units have accountability
• Discipline restored on project steering and reporting
• Clarified financial reporting responsibilities
New TBS organisation
Technical installations
Service
Pipeline renovations
Three different delivery processes:
■ Technical installations:
– Subcontracting and parallel contracting
■ Pipeline renovations:
– Main contracting
– Main contracting -model related processes
(from RC & BF) to be implemented
■ Service:
– Separate TBS Service unit
Quarterly EBIT development: Corrective actions for improving
profitability initiated and ongoing (1/2)

-3.5 -1.7 -0.6 -0.8 -0.4 -3.3 -1.8 -4.7 -1.9
21.417.7
34.0
14.219.9 18.6
32.3
14.3
32.0
27.7
9.9
14.5
3.5
12.211.0
21.0
7.6
58.218.0
25.3
27.6
13.3
34.333.2
31.5
13.4
16.7
63.6
51.2
75.6
30.3
66.159.5
83.0
30.7
104.9
-5
15
35
55
75
95
Q4/15 Q1/16 Q2/16 Q3/16 Q4/16 Q1/17 Q2/17 Q3/17 Q4/17
Qu
art
erly O
rde
r in
take
(E
UR
mill
ion
)
Quarterly order intake development: Major new orders in RC
supporting strong order intake in Q4/2017
15/02/20189
Quarterly order intake development Q4/2015 – Q4/2017 (EUR m)
Building renovation specialist | www.consti.fi
Comments
■ Q4/2017 order intake EUR 104.9 million
(66.1m), up by 58.8% y-o-y
– Order intake growth was strong in
Renovation Contracting (+376,6%)
and in TBS (+60,9%) while decrease
in Building Facades (-51.2%) y-o-y
– Significant growth in RC due to a deal
regarding the complete renovation of
Hotel Scandic Marski in Helsinki and
an order for the complete renovation of
two properties in Helsinki, Oy
Ässäkeskus Ab and KOy Vallilan’s
premises.
■ Full-year 2017 order intake EUR 278.1m
(223.1m), up by 24.7% y-o-y
– Renovation and renewal projects in
RC and business premises related
projects in TBS were highlighted in
order intake in 2017.
Technical Building Services (TBS)
Renovation Contracting
Building Facades
Eliminations

Strong order intake particularly in Renovation contracting
in the fourth quarter
15/02/201810
TECHNICAL BUILDING
SERVICES
Building renovation specialist | www.consti.fi
RENOVATION
CONTRACTING
BUILDING
FACADES
EXAMPLES OF NEW ORDERS:
■ Scandic Hotel Marski,
Helsinki
ꟷ Complete renovation of the
hotel property
■ Oy Ässäkeskus Ab and KOy
Vallila’s premises, Helsinki
ꟷ Oy Ässäkeskus Ab’s facility
modifications and repairs to
technical building services
systems
ꟷ KOy Vallilan toimisto
complete renovation of three
buildings
■ Tasalämpö Oy, Tampere
ꟷ Extension of business
premises and improvement
of technical building
services
Q4/17 order intake:EUR 58.2m (+376.6 % yoy)
EXAMPLES OF NEW ORDERS:
■ Scandic Hotel Marski,
Helsinki
ꟷ Renewal of technical
building services systems
■ Sipoonlahden koulu, Sipoo
ꟷ HVAC
■ Satoseija As Oy, Tampere
ꟷ Improvement of technical
building services systems
Q4/17 order intake:EUR 32.0m (+60.9% yoy)
EXAMPLES OF NEW ORDERS:
■ Helsingin kaupungin asunnot
Oy, Pelimannintie 15, Helsinki
ꟷ First phase renovation
including three residential
apartments and a
maintenance building
■ As Oy Eerikinkatu 33, Helsinki
ꟷ Renovation of facades and
balconies including repair of
windows and exterior doors
■ As Oy Arkadia 12, Helsinki
ꟷ Repair of facades, repair of
rooftop and renewal of
ventilation balconies
Q4/17 order intake:EUR 16.7 m (-51.2% yoy)

69.2 67.576.3 70.6 70.7 74.0 77.7 70.5 72.5
57.1 54.7
57.2
46.1 43.5 41.344.3
36.9
78.2
55.0 69.5
79.1
68.9 76.6
97.6
105.9
91.4
75.0181.3
191.7
212.6
185.6190.8
212.9
227.9
198.8
225.7
0
50
100
150
200
250
Q4/15 Q1/16 Q2/16 Q3/16 Q4/16 Q1/17 Q2/17 Q3/17 Q4/17
Qu
art
erly O
rde
r b
acklo
g (
EU
R m
illio
n)
Quarterly order backlog development:
Backlog up by 18 % y-o-y
15/02/201811
Quarterly order backlog development Q4/2015 – Q4/2017 (EUR m)
Building renovation specialist | www.consti.fi
Comments
■ Q4/2017 order backlog at EUR 225.7
million (190.8m), year-on-year growth
+18.3%
– Order backlog grew particularly in
Renovation Contracting (+79.8% year-
on-year) due to major new orders
received during the quarter.
– In Technical Building Services and in
Building Facades order backlog was
close to comparison period level with
changes of +2.5% and -2,1% year-on-
year
Technical Building Services (TBS)
Renovation Contracting
Building Facades
Eliminations
Cash Flow and Financial Position
15/02/201812 Building renovation specialist | www.consti.fi

3.5
0.6
3.1
4.54.9
0.8
3.2
-0.2
-2.1
1.8
3.4
0.4
6.6
0.5-0.5
4.0
2.92.6
-4
-2
0
2
4
6
8
10
Q4/15 Q1/16 Q2/16 Q3/16 Q4/16 Q1/17 Q2/17 Q3/17 Q4/17
Fre
e c
ash
flo
w a
nd
EB
ITD
A (
EU
R m
illio
n)
EBITDA Free cash flow
Quarterly free cash flow development:
Free cash flow EUR 8.9 million in FY2017
15/02/201813
Quarterly free cash flow and EBITDA Q4/2015 – Q4/2017 (EUR m)
Building renovation specialist | www.consti.fi
Comments
■ Q4/2017 free cash flow amounted to
EUR 2.6m (0.5m)
– The cash flow from operating activities
grew during the period due to the
released working capital, even though
the operating result weakened.
■ Full-year 2017 free cash flow EUR 8.9m
(10.9m)
– Cash conversion ratio of 521.4% (82.8
%) for the full year
■ Average cash conversion ratio of 118% in
the period of Q4/15 – Q4/17
– Consti’s long-term target to achieve
cash conversion ratio in excess of 90
percent
1) The cash conversion is the amount of free cash flow divided by EBITDA. Free cash flow means net cash flow from operating activities before financial items and taxes, less capital used for purchase of intangible assets and property, plant and
equipment
521%
Average cash
conversion1) 118%

-7.3
-10.0
-8.4
-11.2
-7.9
-7.0
-7.9
-11.3
-16.1
-18
-16
-14
-12
-10
-8
-6
-4
-2
0
Q4/15 Q1/16 Q2/16 Q3/16 Q4/16 Q1/17 Q2/17 Q3/17 Q4/17
Ne
t w
ork
ing
ca
pita
l a
t p
eri
od
-en
d (
EU
R m
illio
n)
Quarterly net working capital development:
NWC released during Q4/2017
15/02/201814
Quarterly net working capital1) Q4/2014 – Q4/2017 (EUR m)
Building renovation specialist | www.consti.fi
Comments
■ Net working capital EUR -16.1m (-7.9m)
at the end of Q4/2017
– Release of NWC from year-end 2016
amounted to EUR 8.2m (0.6m)
1) Net working capital calculated as follows: Inventories + Trade and other receivables + Deferred tax receivables – Trade and other payables - Provisions

17.4 15.0 17.8 11.7 12.1 15.0 15.5 13.4 12.1
31.4 %33.4 %
31.5 % 32.5 %34.5 %
37.2 %
32.9 % 31.9 %28.6 %
70.9 %
61.4 %
76.1 %
44.6 %40.8 %
49.7 %
55.0 %
48.6 % 47.7 %
0%
10%
20%
30%
40%
50%
60%
70%
80%
90%
100%
0
2
4
6
8
10
12
14
16
18
20
Q4/15 Q1/16 Q2/16 Q3/16 Q4/16 Q1/17 Q2/17 Q3/17 Q4/17
Net debt (EURm, LHS) Equity ratio (%, RHS) Gearing (%, RHS)
Quarterly balance sheet structure:
Net debt level unchanged
15/02/201815
Quarterly net debt, equity ratio and gearing Q4/2015 – Q4/2017
Building renovation specialist | www.consti.fi
Comments
■ Q4/2017 net debt at EUR 12.1m (12.1m)
– Refinancing of long-term debt in July
2017
■ Q4/2017 equity ratio 28.6% (34.5 %)
■ Q4/2017 gearing at 47.7% (40.8 %)

Market Outlook, guidance and summary
15/02/201816 Building renovation specialist | www.consti.fi

50
60
70
80
90
100
110
120
130
140
150
Jan
-07
Ma
y-0
7S
ep
-07
Jan
-08
Ma
y-0
8S
ep-0
8Jan
-09
Ma
y-0
9S
ep
-09
Jan
-10
Ma
y-1
0S
ep
-10
Jan
-11
Ma
y-1
1S
ep
-11
Jan
-12
Ma
y-1
2S
ep
-12
Jan
-13
Ma
y-1
3S
ep
-13
Jan
-14
Ma
y-1
4S
ep
-14
Jan
-15
Ma
y-1
5S
ep
-15
Jan-1
6M
ay-1
6S
ep
-16
Jan
-17
Ma
y-1
7S
ep
-17
Jan
-18
ES
I a
nd
CC
I fo
r F
inla
nd
(Ja
n 2
00
7 -
Ja
n 2
01
8)
Economic Sentiment Indicator
Construction Confidence Indicator
Lead indicators for Finnish construction suggest a
favourable market environment going forward
15/02/201817
Note: Mean-adjusted figures
Source: European Commission, January 2018
Building renovation specialist | www.consti.fi
Comments
■ Economic sentiment in Finland
rose above the long-term average
in August 2016
■ Construction confidence surpassed
the long-term average level in
summer 2015 and has steadily
remained above that level
■ Both indicators at good level in the
end of 2017Long-term
average
Economic Sentiment and Construction Confidence / Finland (2007 – 1/2018)

11.1 11.4 11.5 11.8 12.2 12.6 12.8 13.0 13.2 13.4
14.513.1
11.810.9 10.8
12.913.9 14.1
13.1 12.7
25.624.5
23.422.7 23.0
25.426.7 27.1
26.4 26.2
0
5
10
15
20
25
30
2011A 2012A 2013A 2014A 2015A 2016A 2017E 2018F 2019F 2020O
Stable growth in renovation to continue
18
Finnish new building and renovation market development
Building renovation specialist | www.consti.fi
■ The peak of the economic cycle in
construction sector in progress.
– Challenges in availability of
building technology and
renovation professionals
■ Total construction market forecast for
2017: Euroconstruct +4.8% and
CFCI +4.4%
■ New building forecast for 2017:
Euroconstruct +7.8% and CFCI
+7.3%
■ Renovation forecast for 2017:
Euroconstruct + 1.8% and CFCI
+1.5%
– 1970s apartments’ total
renovations, and renovations for
saving energy, in public sector
schools and hospitals in particular
– Major refurbishments for office
and commercial buildingsSource: Euroconstruct, November 2017
CFCI = The Confederation of Finnish Construction Industries, October 2017
Renovation volume (real)EURmrd New building volume (real)
CAGR
2017-20:
+1.6%
CAGR
2017-20:
-2.8%
15/02/2018
-3.3%

Demand-driven renovation market growth supported by a
number of key structural growth drivers
15/02/201819
Source: Statistics Finland
Building renovation specialist | www.consti.fi
Ageing building stock Energy efficiency
Urbanisation and concentration of
renovation in growth centers
Modifications of the use of buildings
Increased need for building
technology and automation
11.3 12.9
35.9 32.0
53.3 53.0
35.8 36.8
22.6
2.4
7.1 6.5
15.8 19.2
29.835.4
21.9 24.2
13.8
4.2
18.4 19.4
51.7 51.2
83.2
88.4
57.761.0
36.5
6.7
0
10
20
30
40
50
60
70
80
90
100
-1920 1921 -39
1940 -59
1960 -69
1970 -79
1980 -89
1990 -99
2000 -09
2010 -16
Others
~2025-2035~2017
Million
m2 Finnish building stock by construction year
Construction year
Buildings achieve age of 50 years (approx):
~2045

Realisation of Consti’s long-term financial targets in 2017
20
1) Cash conversion defined as free cash flow divided by EBITDA. Free cash flow equals operating cash flow before net financial items and taxes less investments in tangible and intangible assets
2) While taking other factors such as financial position, cash flow and growth opportunities into consideration.
15/02/2018 Building renovation specialist | www.consti.fi
Growth Profitability Cash flow Capital structure Dividends
Average annual
growth in net sales
of at least 10%
Adjusted EBIT-
margin exceeding 5
percent
Cash conversion
ratio exceeding 90
percent1
Net debt to adjusted
EBITDA ratio of less
than 2.5x while
maintaining an
efficient capital
structure
The Company’s aim
is to distribute as
dividends at least 50
percent of the
Company’s annual
net profit2
FY 2017 FY 2017 FY 2017 FY 2017 FY 2017 proposal
Target was achieved
in FY 2017
FY2017 EBIT
weakened by
profitability problems
in project
management and
execution.
Target was achieved
in FY 2017
Target was not
achieved in FY 2017.
Board proposes that
no dividend will be
paid for 2017
+14.8% -0.1% 521% 7.04 -
Guidance for financial year 2018
15/02/201821 Building renovation specialist | www.consti.fi
“The Company estimates
that its operating result for
2018 will grow compared to
2017.”

Summary
15/02/201822 Building renovation specialist | www.consti.fi
Order intake and order backlog continued to increase year-on-year
Profitability problems in project management and execution weakened FY2017 operating
result. Corrective actions are ongoing and will be finalized during the first quarter of 2018.
Free cash flow EUR 8.9 million in FY 2017
Positive renovation outlook and strong order backlog to support FY2018
FY2018 operating result to grow compared to 2017
FY2017 net sales up by 14.8 %, share of organic growth 9.8 %
2.
1.
3.
4.
5.
6.

Appendix
15/02/201823 Building renovation specialist | www.consti.fi

15/02/201824 Building renovation specialist | www.consti.fi

Acquisitions in 2017: four acquisitions during FY 2017
25 15/02/2018 Building renovation specialist | www.consti.fi
Tampere
Consti offering
TBS BF RC Service
Oulun Talosaneeraus Oy - - -
Pisara Steel Oy - -
KP Kuoppamäki Oy - -
Lumicon Oy - -
Helsinki
Oulun talosaneeraus Oy (acquired in January),
net sales in 2016 approximately EUR 8 million
Oulu
KP Kuoppamäki Oy (acquired in July),
net sales in 2016 approximately EUR 6 million
New acquisitions:• Support strategic growth areas
• Pipeline renovations
• Promising specialty renovation markets
such as roof renovations
• Geographic growth
Pisara-Steel Oy (acquired in March),
net sales in 2016 approximately EUR 2.4 million
Lumicon Oy (acquired in October),
net sales in 2016 approximately EUR 2 million
€216k €222k
€183k €181k
670700
806
895
0
100
200
300
400
500
600
700
800
900
1,000
0
50
100
150
200
250
300
350
2014 2015 2016 2017
Median project size # of projects
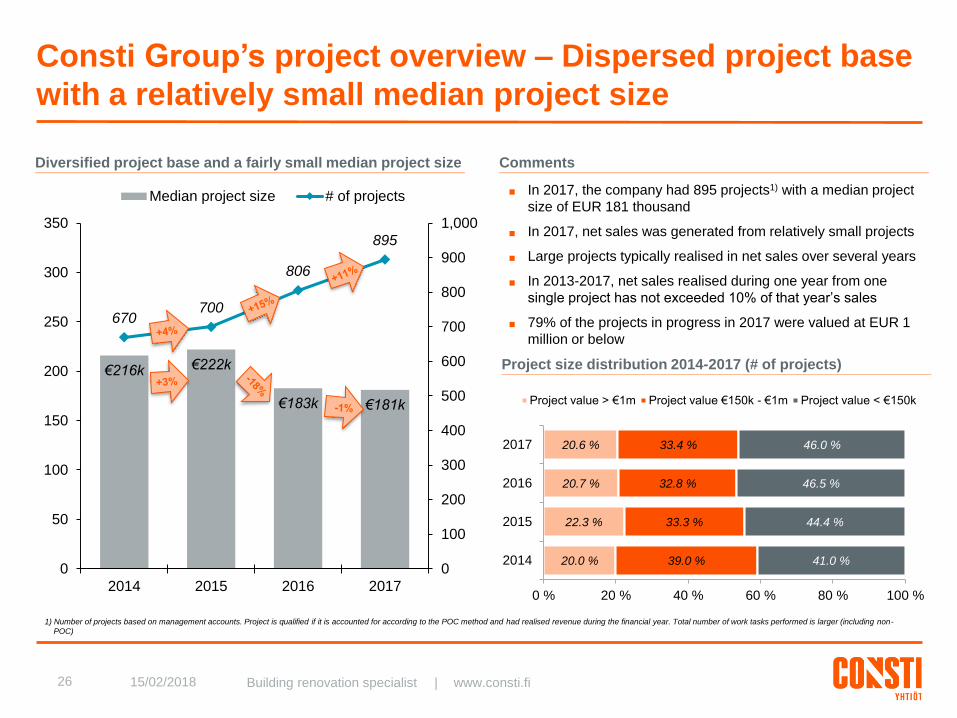
Consti Group’s project overview – Dispersed project base
with a relatively small median project size
15/02/201826
Diversified project base and a fairly small median project size
Building renovation specialist | www.consti.fi
Comments
■ In 2017, the company had 895 projects1) with a median project
size of EUR 181 thousand
■ In 2017, net sales was generated from relatively small projects
■ Large projects typically realised in net sales over several years
■ In 2013-2017, net sales realised during one year from one
single project has not exceeded 10% of that year’s sales
■ 79% of the projects in progress in 2017 were valued at EUR 1
million or below
1) Number of projects based on management accounts. Project is qualified if it is accounted for according to the POC method and had realised revenue during the financial year. Total number of work tasks performed is larger (including non-
POC)
Project size distribution 2014-2017 (# of projects)
20.0 %
22.3 %
20.7 %
20.6 %
39.0 %
33.3 %
32.8 %
33.4 %
41.0 %
44.4 %
46.5 %
46.0 %
0 % 20 % 40 % 60 % 80 % 100 %
2014
2015
2016
2017
Project value > €1m Project value €150k - €1m Project value < €150k

15/02/201827 Building renovation specialist | www.consti.fi
FINANCIAL STATEMENTS
1-12/2017
CONSTI GROUP PLC
FY2017CONSTI GROUP PLC
HOPEATIE 2
FI-00440, HELSINKI
BUSINESS ID 2203605-05
WWW.CONSTI.FI