Consolidated Results of Operations (US GAAP)
48
Consolidated Results of Operations (US GAAP) Fourth quarter, year ended March 2010 Nomura Holdings, Inc. April 2010
Transcript of Consolidated Results of Operations (US GAAP)

Consolidated Results of Operations (US GAAP)Fourth quarter, year ended March 2010
Nomura Holdings, Inc.
April 2010

This document is produced by Nomura Holdings, Inc. ("Nomura"). Copyright 2010 Nomura Holdings, Inc. All rights reserved. Nothing in this document shall be considered as an offer to sell or solicitation of an offer to buy any security, commodity or other
instrument, including securities issued by Nomura or any affiliate thereof. Offers to sell, sales, solicitations to buy, or purchases ofany securities issued by Nomura or any affiliate thereof may only be made or entered into pursuant to appropriate offeringmaterials or a prospectus prepared and distributed according to the laws, regulations, rules and market practices of thejurisdictions in which such offers or sales may be made.
No part of this document shall be reproduced, stored in a retrieval system or transmitted in any form or by any means, electronic,mechanical, photocopying, recording or otherwise, without the prior written permission of Nomura.
Th i f ti d i i t i d i thi d t h b bt i d f b li d t b li bl b t
2
The information and opinions contained in this document have been obtained from sources believed to be reliable, but norepresentations or warranty, express or implied, are made that such information is accurate or complete and no responsibility orliability can be accepted by Nomura for errors or omissions or for any losses arising from the use of this information.
This document contains statements that may constitute, and from time to time our management may make "forward-lookingstatements" within the meaning of the safe harbor provisions of The Private Securities Litigation Reform Act of 1995. Any suchstatements must be read in the context of the offering materials pursuant to which any securities may be offered or sold in theUnited States. These forward-looking statements are not historical facts but instead represent only our belief regarding futureevents, many of which, by their nature, are inherently uncertain and outside our control. Important factors that could cause actualresults to differ from those in specific forward-looking statements include, without limitation, economic and market conditions,political events and investor sentiments, liquidity of secondary markets, level and volatility of interest rates, currency exchangerates, security valuations, competitive conditions and size, and the number and timing of transactions.
The consolidated financial information in this document is unaudited.

OutlinePresentation Financial supplement
Overview of fourth quarter results (p. 4) Overview of full year results (p. 5) Overview of fourth quarter results by division (p. 6) Overview of fourth quarter results by region (p. 7) Retail (p. 8) Asset Management (p 9)
Consolidated financial highlights (p. 21) Consolidated balance sheet (p. 22) Full Year business segment highlights (p. 23) Fourth quarter business segment highlights (p. 24) Retail (p. 25) Global Markets (p. 26) Investment Banking (p. 27)
3
Asset Management (p. 9) Investment Banking (p. 10–11) Global Markets (p. 12–13) Wholesale business net revenue share (p. 14) Robust financial position (p. 15) Diversification of long-term funding (p. 16) Level 3 assets (p. 17) Key performance indicators (p. 18–19)
g (p ) Merchant Banking (p. 28) (Reference) Wholesale (p. 29) Asset Management (p. 30) Segment “Other” (p. 31) Non-interest expenses (p. 32) Retail related data (p. 33–37) Global Markets related data (p. 38) Investment Banking related data (p. 39) Merchant Banking related data (p. 40) Asset Management related data (p. 41–42) Value at risk (p. 43) Number of employees (p. 44) Consolidated income (p. 45) Adjustment of consolidated results and segment results: Income (loss)
before income taxes (p. 46) Main revenue items (p. 47)

Overview of fourth quarter resultsHighlights
Net revenue of 277.9 billion yen, income before income taxes of 28.6 billion yen, net income of 18.4 billion yen.
Profitable for four straight quarters; all five business divisions in profit for first time in fiscal year under review.
Acted as lead manager on the largest IPO in Japan and globally for fiscal year under review.
Saw growth in client base and expanded client assets in Retail and Asset Management
Net revenue of 1,150.8 billion yen, income before income taxes of 105.2 billion yen, net income of 67.8 billion yen.
Returned to profit on full year basis with all business divisions contributing to profit. All regions profitable.
Retail focused on providing consulting services, recording average monthly net purchases of around 1 trillion yen; net revenue up 30% compared to same period last year.
In addition to our solid Retail business in Japan, Wholesale is now a second revenue engine operating globally and
Fourth quarter results Full year results
Y1,150.8bnNet revenueY277.9bn
Y28.6bn
Y18.4bn
Y105.2bn
Y67.8bn
Retail and Asset Management. Client base also grew in Wholesale and US build out
continued.
g p g g ymaking a significant contribution to revenues.
Booked 118.6 billion yen in accounting losses not attributable to business segments, including credit valuation adjustments of 74 billion yen and 17 billion yen in conversion expenses related to convertible bonds.
4
Income before income taxes
Net income1
Net revenue
Income before income taxes
Net income1
1. Net income attributable to Nomura Holdings.
Fourth quarter results Full year results

1,150.8
Net revenue
Income before income taxes
ROE(%)
Overview of full year resultsNet revenue, income/loss before income taxes and ROE Income before income taxes for year ended Mar 2010
(billions of yen) (billions of yen)
Adjustments1
Own credit & CVA (¥73.9bn) Nomura CB conversion cost s (¥17.0bn)
787.3
312.6
-64.6
-780.3
105.2
-3.3%
-40.2%
3.7%
FY07 FY08 FY09
5
105.2
118.6 223.8
Income before income taxes
Income before income taxes (business
segments)2
Adjustment1
( ) Unrealized gain on investment securities ¥9.4bn Nomura public offering fee (¥16.0bn)
1. Accounting items not attributable to business segments2. Including corporate items

Retail
Retail client assets: ¥73.5trn Monthly average net purchases over ¥1trn 126,000 new individual accounts opened
Overview of fourth quarter results by division
Asset Management
Global Markets
Expanded client platform #1 overall dealer for JGB1
LSE market share (customer trades) #1 2
US business build out gaining momentum
Breakdown of fourth quarter net revenue and overview of business segment results
(billions of yen)
Retail95.5
#1 in Japan-related ECM and M&A league tables4
Lead manager in Dai-ichi Life IPO, the largest IPO for the fiscal year
Sole M&A advisor for KKR acquisition of Pets at Home.
Assets under management: ¥23.4trn Public investment trust market share3 20.3% Received several awards
Investment Banking Merchant Banking
Investments: ¥370bn (-0.6% YoY) Made progress in increasing value of
investee companies
6
1. Source : Ministry of Finance Japan2. Source : London Stock Exchange. Nomura only, excludes Instinet.3. Share of investment trust market in Japan. Source: The Investment Trusts Association, Japan. Data related to Nomura Asset Management.4. Source : Thomson ReutersNote: All data as of March 31, 2010, unless otherwise indicated.
Global Markets
133.0
Merchant Banking
7.6
Investment Banking
27.8
Asset Management
18.0

Overview of fourth quarter results by region
Q4
USEMEA
Significant momentum across all core products in FI, Equities (Global Markets)
Steady progress in on-boarding of derivative clients (Global Markets)
Joint lead manager in IPO for North American company (Seabridge Gold) (Investment Banking)
LSE market share (customer trades) #11(Global Markets)
#2 research ranking2 (Global Markets)
Sole M&A advisor for KKR acquisition of Pets at Home (Investment Banking)
Joint bookrunner on index linked UK gilt (Investment Banking)
Breakdown of fourth quarter net revenue; fourth quarter highlights by region
7
Full year
Asia ex-Japan Japan
Market share increased on exchanges across region e.g. South Korea, Hong Kong, India(Global Markets)
Won mandates on high profile deals in DCM (Philippines) and M&A (National Australia Bank/AXA) (Investment Banking)
Strengthened on-shore business platforms(Global Markets)
126,000 new individual accounts opened(Retail)
#1 Overall dealer for JGB3 (Global Markets) #1 Monthly share on TSE (Global Markets) #1 in Nikkei analyst survey4
#1 in Japan-related ECM and M&A league tables5 (Investment Banking)
Made progress in increasing value of investee companies (Merchant Banking)1. Source : London Stock Exchange. Nomura only, excludes Instinet.
2. Source : Institutional Investor3. Source : Ministry of Finance Japan4. Source : Nikkei5. Source : Thomson ReutersNote: All data as of March 31, 2010, unless otherwise indicated.
Non-Japan
Japan
Net revenue by
region

2,500
3,000
3,500
4,000 Stocks BondsInvestment Trusts Others
Retail: Focus on consulting services Total purchases by retail clients Accounts with balance
(billions of yen) (thousand accounts)
POIPO
4 517
4,751
4,883
4,600
4,800
5,000
0
500
1,000
1,500
2,000
8
・
FY2010.3
Q1 Q2 Q3 Q4
FY2010.3
Q1 Q2 Q3 Q4
Nomura Retail flagship ad campaign graphic, roughly translated as “I’ll ask Nomura for advice”.
4,494 4,517
4,000
4,200
4,400
それ、野村にきいてみよう。
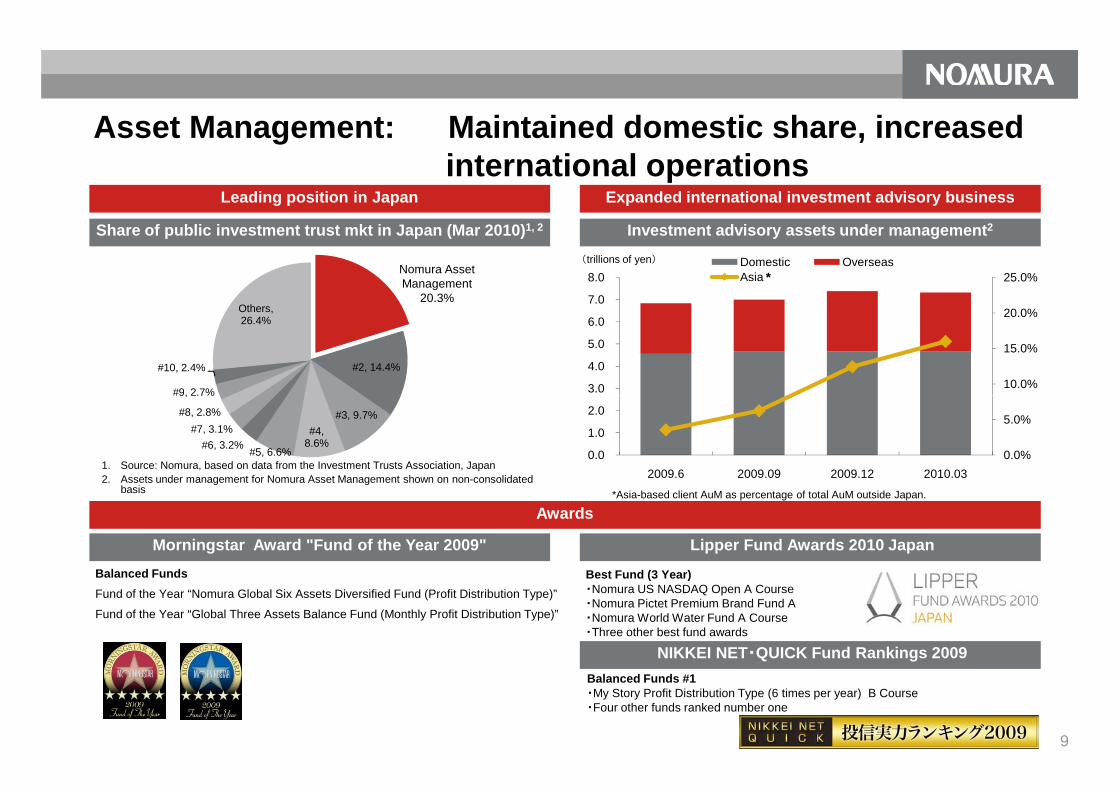
Share of public investment trust mkt in Japan (Mar 2010)1, 2
Leading position in Japan
(trillions of yen)
Investment advisory assets under management2
Expanded international investment advisory business
#2, 14.4%
#9, 2.7%
#10, 2.4%
Others, 26.4%
Nomura Asset Management
20.3%
Asset Management: Maintained domestic share, increasedinternational operations
10.0%
15.0%
20.0%
25.0%
3.0
4.0
5.0
6.0
7.0
8.0 Domestic OverseasAsia *
9
Awards
Best Fund (3 Year)・Nomura US NASDAQ Open A Course・Nomura Pictet Premium Brand Fund A ・Nomura World Water Fund A Course・Three other best fund awards
Morningstar Award "Fund of the Year 2009" Lipper Fund Awards 2010 JapanBalanced FundsFund of the Year “Nomura Global Six Assets Diversified Fund (Profit Distribution Type)”
Fund of the Year “Global Three Assets Balance Fund (Monthly Profit Distribution Type)”
1. Source: Nomura, based on data from the Investment Trusts Association, Japan2. Assets under management for Nomura Asset Management shown on non-consolidated
basis
#3, 9.7%#4,
8.6%#5, 6.6%#6, 3.2%
#7, 3.1%#8, 2.8%
#9, 2.7%
*Asia-based client AuM as percentage of total AuM outside Japan.
0.0%
5.0%
0.0
1.0
2.0
2009.6 2009.09 2009.12 2010.03
NIKKEI NET・QUICK Fund Rankings 2009Balanced Funds #1・My Story Profit Distribution Type (6 times per year) B Course・Four other funds ranked number one

Investment Banking: ECM share in Japan
Rank Bank Proceeds(billons of yen)
Mkt.share
No. ofdeals
1 Nomura 2,691 35.0% 56
2 Goldman Sachs & Co 765 10.0% 7
3 Daiwa Securities Group 593 7.7% 16
4 Mizuho Financial Group 445 5.8% 14
Japan-related equity capital markets (Rank value) Japan-related equity capital mkts bookrunner league table (Apr-Mar)
(billions of yen)
6,342
5,000
6,000
7,000 Industry TotalNomura
10
5 Morgan Stanley 345 4.5% 5
6 JPMorgan 313 4.1% 4
7 Barclays Capital 266 3.5% 3
8 Bank of America Merrill Lynch 220 2.9% 6
9 Mitsubishi UFJ 190 2.5% 13
10 Citi 168 2.2% 1
Industry Total 7,687 100% 113
2,691
-
1,000
2,000
3,000
4,000
FY 02 FY 03 FY 04 FY 05 FY 06 FY 07 FY 08 FY 09
Note: Excluding offerings outside Japan by non-Japanese firms listed in Japan.Nomura estimate for fiscal 2009.
Source: Nomura, based on Japan Securities Dealers Association data.
Source: Thomson Reuters; (excluding self-funding)

M&
A
EMEA Asia ex-Japan
Tata Power
Anglo American
Defence advisor for Anglo American against
Xstrata’s bid
US$42.5billion Jul 2009 £1.1billion Aug 2009
SEGRO PLC
Financial Advisor to Brixton
Advisor to KKR on acquisition of Pets at
Home
Undisclosed Jan 2010
KKR
Givaudan Societe Generale UC Rusal
CIC
US$939million Sep 2009
Sole Financial Advisor to CIC
Kumho Asiana
Kumho Asiana’s divestment of Daewoo Engineering &
Construction
US$2.5billion Pending
Financial Advisor
Maxis Shanda Games Limited
Investment Banking: Noteworthy international deals
National Australia Bank
Financial Advisorto National Australia
Bank
US$ 13.3 billion Pending
Proposed acquisition of AXA Asia Pacific Holdings
ECM
DC
M
11
FCCB
Sole Bookrunner
US$ 300 million Nov 2009
Tata Power
Rights Issue
Joint Bookrunner
CHF 420million Jun 2009
Givaudan Societe Generale
Rights Issue
Co-Bookrunner
€4.8billion Oct 2009
IPO
Joint Bookrunner
US$2.2billion Jan 2010
UC Rusal
1.92% due Nov 20122.34% due Nov 2014
Joint Bookrunner
¥44.8billion Nov 2009
Republic of Poland
¥65billion Dec 2009
1.17% due Dec 2014
Joint Bookrunner
GDF
6.250% due Jun 2020
Joint Bookrunner
EUR 5billion Mar 2010
Hellenic Republic
Maxis
IPO
Joint Bookrunner
US$3.3 billion Nov 2009
IPO
POWL Bookrunner & Co-Lead Manager
US$ 1.0 billion Sep 2009
Shanda Games Limited
10-yr Shibosai BondGuaranteed by JBIC
Joint Arranger and Documentation Agent
¥35billion Jul 2009
Republic of Indonesia
2.51% note due Sep 20112.67% note due Sep 20122.96% note due Sep 2014
Joint lead manager
¥30billion Sep 2009
Korea Development Bank
11.5% Senior Security notes due Feb 2015
Joint bookrunner andJoint lead manager
US$ 350million Feb 2010
Star Energy Geothermal

Global Markets: Derivatives business expansion
EMEA Japan Asia ex-Japan Americas
179
Number of accounts with ISDA Master Agreements1 – indexed, Dec 2009 = 100
1. Number of priority clients that have executed ISDA Master Agreements since Lehman acquisition.
100
135
2009.12 2010.3
100
114
2009.12 2010.3
100
116
2009.12 2010.3
100
2009.12 2010.3
12

Global Markets: Americas business build outGlobal Equities Global Fixed Income
Cash equities (EMEA, Asian and US equities)1 Rates2 FX2
13
Equity derivatives 3 Credit2
1. Average daily trade volume, index.2. Average daily trades. For equity derivatives, average daily trades of live single stock and index futures, index.3. Quarterly revenue, index.Note: Volume uplift compared to pre-integration or go-live month for each business. Excludes Instinet.
100
879
1,065
Securitized products2
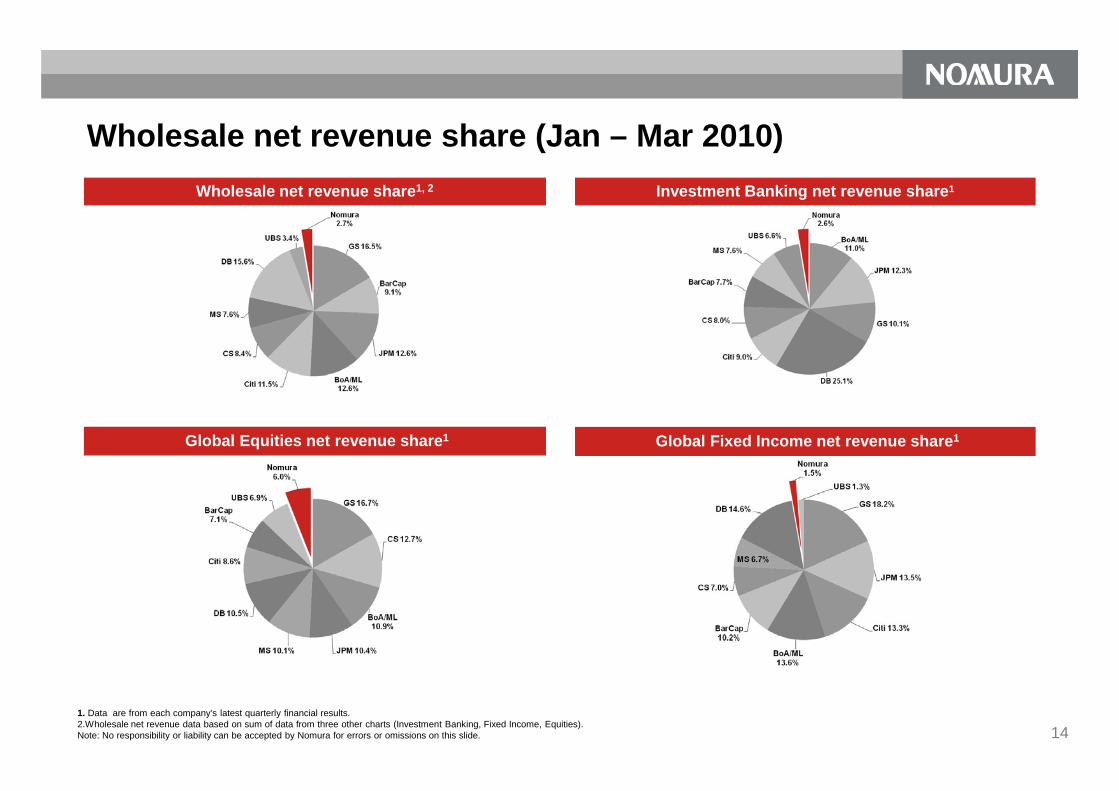
Wholesale net revenue share (Jan – Mar 2010)Wholesale net revenue share1, 2 Investment Banking net revenue share1
14
Global Equities net revenue share1 Global Fixed Income net revenue share1
1. Data are from each company’s latest quarterly financial results. 2.Wholesale net revenue data based on sum of data from three other charts (Investment Banking, Fixed Income, Equities).Note: No responsibility or liability can be accepted by Nomura for errors or omissions on this slide.

Robust financial position
Total assets ¥32.2trn Shareholders’ equity
¥2.1trn Gross leverage 15.2x Net leverage 9.3x Level 3 assets (net)1
¥0.9trn Liquidity ¥5 2trn
(billions of yen)(Preliminary) 31 Dec 31 Mar
Tier 1 1,989 2,000
Tier 2 559 560
Tier 3 303 306
Total capital 2,789 2,806
RWA 11,127 11,525
Tier 1 ratio 17.8% 17.3%
(Balance sheet data) Financial indicators Gross leverage and net leverage
Capital ratio History of leverage ratios
15.2
9.3
8.0
10.0
12.0
14.0
16.0
18.0
20.0Gross leverage ratioNet leverage ratio
Liquidity ¥5.2trn
A-
A+A
AA-AA
BBB+BBBBBB-
Tier 1 Common ratio3 17.7% 17.3%
Total capital ratio 25.0% 24.3%
15
Tier 1 capital / Risk Weighted Assets 2 Notch gap
Comparison of capital ratios Comparison of credit ratings4
= Tier 1 ratio = Tier 1 common ratio3
1. Preliminary (before review).2. Competitor data in gray dotted area as of March 31, 2010, and others as of December 2009. Nomura data as of March 31, 2010.3. Tier 1 common ratio is defined as Tier 1 capital minus hybrid capital and minority interest.4. S&P ratings Note: No responsibility or liability can be accepted by Nomura for errors or omissions on this slide.
6.02009.1Q 2009.2Q 2009.3Q 2009.4Q 2010.1Q 2010.2Q 2010.3Q 2010.4Q
17.3%17.3%
012345678
DB UBS BARC JPM BoA Citi GS MS CS Nomura野村 MS GS Citi JPM BoA CS DB UBS BARCNomura

Diversification of long-term funding
Accelerating diversification of long-term funding in terms of currencies and regions.
Issued first US dollar-denominated note in US (USD3.0bn) Issued euro-denominated bond in Europe (EUR 250m),
issued GBP-denominated bond (GBP 500m). 46% of funding for the year was done through major
currencies (USD, euro) 52% of funds raised outside Japan in past year.
Currency breakdownHighlights
10%
23%
Others
JPY
USD
EUR
Regional breakdownUS dollar denominated notes
16
Issued first benchmark US dollar-denominated senior notes in US market.
In addition to US investors, European, Middle Eastern, and Asian investors also participated for a globally diversified mix.
4 times oversubscribed22%
52%
Outstanding (as of Mar 2010) FY2010
Japan
Non Japan
10%23%10%
Outstanding (as of Mar 2010) FY2010
25 February 2010
$1.5bn 5.0%5yr Senior Unsecured Notes due on Mar-15
&$1.5bn 6.7%
10yr Senior Unsecured Notes due on Mar-20
Sole Bookrunner
Funding in FY2010
Funding in FY2010

Level 3 assets
(billions of yen)
Breakdown of Level 3 assets, net Level 3 assets2 / Tier 1 capital ratioHighlights
Level 3 assets declined by ¥1.7trn on full year basis to ¥1.4trn.
Declined by ¥200bn QoQ . ¥900bn after netting off derivative assets and liabilities. Declined to 44% of Tier 1 capital on net basis. Prudently managing and aiming to exit private equity
investments, which account for largest component of Level 3 assets
98% 100%
120%
2,000
2,500
OthersBank and corporate debt securities and loans for trading purposesMortgage and other mortgage backed securitiesDerivative contracts (liabilities)EquitiesPrivate EquityDerivative contracts (assets)Net Level 3 Assets / Tier 1 Capital
171. Preliminary (before review)2. Level 3 assets after netting off derivative assets and liabilities.
3 assets. Continue to closely manage Level 3 and other illiquid
assets.
38%
23%
11%8%9%
11%85%
55%44%
0%
20%
40%
60%
80%
-1,000
-500
0
500
1,000
1,500
1Q 2Q 3Q 4Q

Key performance indicators (KPI)Retail Asset Management
67.268.9
71.0 73.5
22.2
22.9 23.1 23.4
FY2010.31Q 2Q 3Q 4Q
FY2010.31Q 2Q 3Q 4Q
Assets under management(trillions of yen)
Retail client assets(trillions of yen)
18
Global Equities Global Fixed Income
1Q 2Q 3Q 4Q
FY2010.31Q 2Q 3Q 4Q
FY2010.31Q 2Q 3Q 4Q
1Q 2Q 3Q 4Q
Share1Share1
1: Data are from each company’s (BarCap, BoA/ML, Citi, CS, DB, GS, JPM, MS, UBS, and Nomura) latest quarterly financial results available at the time.Note: No responsibility or liability can be accepted by Nomura for errors or omissions on this slide.
8.2% 7.7%10.9%
6.0%3.3% 2.4%
4.4%1.5%

Investment Banking Merchant Banking
FY2010.3
#10 #9 #7 #8
#16#13 #15 #18
FY2010.3
Key performance indicators (KPI)
(billions of yen)Rank1
Business exposure Pretax income to business exposure ratioGlobal ECM ranking Global M&A ranking
382.1 368.6 372.3 370.0
-0.9%
0.3%
-0.2%
1.2%
19
Return on equity2 Cost efficiencies
1Q 2Q 3Q 4Q
FY2010.31Q 2Q 3Q 4Q
46%49%
46%
41%
FY2010.31Q 2Q 3Q 4Q
1Q 2Q 3Q 4Q
(billions of yen)
1. Source: Thomson Reuters2. Return on equity is calculated using annualized quarterly net income (loss). FY2010.3 fourth quarter accumulated return on equity was 3.7%.3. PE=Personnel expenses. NPE=Non-personnel expenses.
Compensation to net revenue ratio
3.0%
7.0%
2.2%3.5%
3854 50
41.5
51 50
16
9.5
Actual1-3Q
NPE PE Actual1-4Q
InitialTarget
Cost reduction (1-4Q)3
NPE
PE
Actual 4Q

Financial Supplement

304.3
175.8
-67.8
67.8
15.5%
8.3%
3.7%
-20%
-10%
0%
10%
20%
-400
-200
0
200
400Net income(loss)
ROE (%)
11.427.7
10.2 18.4
3.0% 5.0% 3.6% 3.7%
-30%
-20%
-10%
0%
10%
-150
-100
-50
0
50
Consolidated financial highlights
Full year Quarter(billions of yen) (billions of yen)
FY2009.3
4Q 1Q 2Q 3Q 4Q
Net revenue 1,145.7 1,091.1 787.3 312.6 1,150.8 99.2 298.4 300.0 274.5 277.9
Incom e (loss) before incom e taxes 452.0 318.5 -64.9 -780.3 105.2 -226.9 31.4 27.3 18.0 28.6
Net incom e (loss) attributable to Nom uraHoldings , Inc. ("NHI") shareholders
304.3 175.8 -67.8 -708.2 67.8 -215.8 11.4 27.7 10.2 18.4
Total Nom ura shareholders ' equity 2,063.3 2,185.9 1,988.1 1,539.4 2,126.9 1,539.4 1,544.5 1,615.9 2,109.8 2,126.9
ROE (%)1 15.5% 8.3% - - 3.7% - 3.0% 5.0% 3.6% 3.7%
Bas ic-Net incom e (loss) attributable to NHIshareholders per share(yen) 159.02 92.25 -35.55 -364.69 21.68 -107.00 4.37 10.22 2.91 5.02
Shareholders ' equity per share (yen) 1,083.19 1,146.23 1,042.60 590.99 579.70 590.99 589.32 580.96 575.16 579.70
FY2010.3FY2006.3 FY2008.3 FY2009.3 FY2010.3FY2007.3
-708.2-40%
-30%
-800
-600-215.8
-50%
-40%
-250
-200
1. FY2010.3 ROE calculated using accumulated FY2010.3 net income, annualized. Note: Certain reclassifications of previously reported amounts have been made to conform to the current year presentation.
21

(billions of yen)
Mar. 31, 2009
M ar. 31, 2010
Increase(Decrease)
Mar. 31, 2009
M ar. 31, 2010
Increase(Decrease)
Cash and cash deposits 1,423 1,352 (70) Short-term borrow ings 1,183 1,302 118
Assets Liabilities
Consolidated balance sheet
Consolidated balance sheet
Payables and deposits 1,242 1,528 286
Loans and receivables 1,643 2,072 429 Collateralized f inancing 10,158 11,216 1,059
Trading liabilities 4,752 8,357 3,605
Collateralized agreements 8,413 12,467 4,055 Other liabilities 468 495 27
Long-term borrow ings 5,483 7,199 1,716
11,673 14,700 3,028 Total liabilities 23,286 30,097 6,811
Other assets 1,687 1,639 (48) Equity
Total Nomura shareholders' equity 1,539 2,127 588
Noncontrolling interest 12 6 (6)
24,838 32,230 7,393 24,838 32,230 7,393Total assets
Trading assets andprivate equity investments1
Total liabilities and shareholders ' equity
1. Including securities pledged as collateral.
22Note: Non-controlling interest, which was previously included in Liabilities, is classified as equity in accordance with SFAS 160. Previously reported amounts have been made to conform to the current year presentation.

118.9
68.2
12.2
65.888.1
70.4
8.475.4
1,059.8 1,057.7
837.4
1,141.4
900
1,200
1,500
157.7
58.8 172.0
51.5
44.4 1.7
55.4
52.8
122.3
1.4
20.6
39.4
34.0
18.621.0
452.0
377.3
-14.4
95.8
200
400
600
-757 1
Full Year business segment highlights
Retail: p. 25 Global Markets: p. 26 Investment Banking: p. 27 Merchant Banking: p. 28 Asset Management: p. 30 Segment “Other”: p. 31 Adjustment of consolidated
Net revenue Income (loss) before income taxes Reference(billions of yen) (billions of yen)
1,059.8 1,057.7 837.4 335.8 1,141.4 452.0 377.3 -14.4 757.1 95.8
FY2007.3 FY2006.3 FY2010.3FY2009.3FY2008.3FY2008.3 FY2009.3 FY2010.3FY2006.3 FY2007.3
446.5 440.1 402.0
63.5
388.3
371.1290.0
95.6
-157.3
658.4
99.799.2
83.1
291.9
65.0
64.8
-69.9
88.7
59.8
103.2
147.7
-106.8
335.8
-300
0
300
600
900197.2 160.9
22.8 18.2113.4
-226.2
-574.6
53.3
-57.4
-85.3
7.4
-30.5
-20.6
-65.4
-211.3
-800
-600
-400
-200
0
-757.1 jresults and segment results: Income (loss) before income taxes: p. 46
Note1: The defined contribution pension plan business in Asset Management was integrated to Other business in the second quarter of the fiscal year ended March 31, 2009. Certain reclassifications of previously reported amounts have been made to conform to the current presentation.
Note2: Net income (loss) is net income (loss) before subtracting net income attributable to non-controlling interest. Certain reclassifications of previously reported amounts have been made to conform to the current yearpresentation.
Other
Asset Management
Merchant Banking
Investment Banking
Global Markets
Retail
23
Wholesale

62.3
1.333.1 24.0
-5 4
46.716.3 30.0
27.935.2
0.626.4 4.6
0.5
5.14.5
4.1
4.9
-223.0
21.729.1
21.8
23.2
0
50
100
150
95.420.9
44.5
27.8
3.91.8
7.6
18.716.5
17.2
18.0
288.6 301.9278.4
272.5
250
300
350
400
450
Fourth quarter business segment highlights
Net revenue Income (loss) before income taxes Reference(billions of yen) (billions of yen)
Retail: p. 25 Global Markets: p. 26 Investment Banking: p. 27 Merchant Banking: p. 28 Asset Management: p. 30 Segment “Other”: p. 31
FY2009.3 FY2009.3 4Q 1Q 2Q 3Q 4Q 4Q 1Q 2Q 3Q 4Q103.2 288.6 301.9 278.4 272.5 -223.0 21.7 29.1 21.8 23.2
FY2010.3 FY2010.3
-5.51.3
-130.8
-5.4
-41.3
-9.7
-23.0
-3.6 -0.9
-22.9
-64.6 -39.9 -65.9
-40.9
-250
-200
-150
-100
-50
0
9.4
187.1
93.2 104.3 95.56.6
25.7174.5 163.9
133.0
-18.4
61.9
-1.1
13.130.5
-37.1-7.1
-53.2
-9.4
103.2
-150
-100
-50
0
50
100
150
200
Note1: The defined contribution pension plan business in Asset Management was integrated to Other business in the second quarter of the fiscal year ended March 31, 2009. Certain reclassifications of previously reported amountshave been made to conform to the current presentation.
Note2: Net income (loss) is net income (loss) before subtracting net income attributable to non-controlling interest. Certain reclassifications of previously reported amounts have been made to conform to the current yearpresentation.
24
Other
Asset Management
Merchant Banking
Investment Banking
Global Markets
Retail
Wholesale
Adjustment of consolidated results and segment results: Income (loss) before income taxes: p. 46

-5.5
27.9 26.4 35.2 24.0
61.9
95.4 93.2 104.3
95.5
0
20
40
60
80
100
120
Business performance Fourth quarter net revenue was 95.5 billion yen (-8.5% QoQ, +54.1% YoY).
Income before income taxes was 24 billion yen (-31.8% QoQ). Robust distribution of investment trusts and public offerings.
Growing customer base Retail client assets of 73.5 trillion yen at end of March (+Y2.5trn QoQ). Number of accounts with a balance increased by approx. 132,000 from prior
quarter to 4.88 million. 126,000 new individual accounts opened by retail investors.
Investment trust sales Sales of equity investment trusts totalled 1.5426 trillion yen (-3.8% QoQ). Investment trust commissions of 42 8 billion yen (-4 3%QoQ)
RetailNet revenue and income (loss) before income taxes
Quarter (billions of yen)
FY2009.3 4Q 1Q 2Q 3Q 4Q
FY2010.3
-20
FY2008.3 FY2009.3FY2007.3 FY2010.3FY2006.3
197.2 160.9
122.3
18.2
113.4
446.5 440.1 402.0
291.9
388.3
0
100
200
300
400
500
Investment trust commissions of 42.8 billion yen (-4.3%QoQ). Newly launched investment trusts (as of March 31).
Nomura New Emerging Bond Fund 203.4 billion yenJPM Railway Related Equity Fund 140.5 billion yenNomura Brazil Infrastructure Stock Fund 95.2 billion yen Nomura Global Financial Stock 1003 83.6 billion yen
Quarter highlights Total monthly purchases of around 1 trillion yen balanced among stock,
bonds, and investment trusts. Client accounts increased due to our role as joint global coordinator on Dai-
ichi Life IPO.
Full year
Reference Net revenue and income (loss) before income taxes: p. 33 Retail stock brokerage commissions, commissions for distribution of investment
trusts: p. 34 Retail client assets: p. 35 Retail client assets: Net asset inflow: p. 36 Number of accounts: p. 37
(billions of yen)
Net revenue Income (loss) before income taxes
25

133.0
62.3 46.7 33.1 30.0
9.4
187.1 174.5 163.9
100
0
100
200
300
Global MarketsNet revenue and income (loss) before income taxes
Quarter (billions of yen)
Business performance Fourth quarter net revenue was 133 billion yen (-18.9% QoQ, +14x YoY).
Income before income taxes was 30 billion yen (-9.4% QoQ) Global Fixed Income
Steady revenues from client businesses. Flow product business driving revenues in rates and credit. Increased revenues from US operations.
Global Equities Increased market share on exchanges amid declines in market order
fl d l ili
FY2007.3FY2006.3 FY2010.3FY2009.3FY2008.3
157.7 58.8
-226.2
-574.6
172.0 371.1
290.0
95.6
-157.3
658.4
-600
-400
-200
0
200
400
600
800
FY2009.3 4Q 1Q 2Q 3Q 4Q
FY2010.3
-130.8 -200
-100
Reference Net revenue and income (loss) before income taxes: p. 38 Value at risk: p. 43
(billions of yen)
Full year
Net revenue Income (loss) before income taxes
26
flow and volatility. Booked revenues on IPO for Japanese corporate and in the derivative
solutions business.
Highlights Ranked number one dealer in JGB auctions for full fiscal year. Enhanced commodities business platform in Europe. Ranked number one in client-driven market share on London Stock
Exchange (Jun 2009 – Mar 2010). Number one monthly share on Tokyo Stock Exchange.

6.6
25.7 20.9
44.5
27.8
-5.4 -9.7
16.3
0.6
-30 -20 -10
0 10 20 30 40 50
Investment BankingNet revenue and income (loss) before income taxes
Quarter (billions of yen)
Business performance Fourth quarter net revenue was 27.8 billion yen (-37.4 QoQ, +4x YoY).
Income before income taxes was 600 million yen (-96.2% QoQ). Acted as joint global coordinator on Dai-ichi Life’s IPO, Japan’s largest
IPO for the fiscal year. Europe revenues driven by solutions business.
Major deals ECM: Dai-ichi Life IPO (joint global coordinator) Y1.08trn
Sumitomo Mitsui Financial Group PO Y919bn
FY2008.3 FY2010.3FY2007.3FY2006.3 FY2009.3
99.7 99.2 83.1
63.5
118.9
51.5 44.4 22.8
-57.4
1.7
-60
-30
0
30
60
90
120
FY2009.3 4Q 1Q 2Q 3Q 4Q
FY2010.3
-41.3 -50 -40
Reference Net revenue and income (loss) before income taxes: p. 39 League tables: p. 39
(billions of yen)
Full year
Net revenue Income (loss) before income taxes
Sumitomo Mitsui Financial Group PO Y919bn(joint bookrunner)Rusal IPO (joint bookrunner) US$2.2bn
DCM: Greece bond (joint bookrunner €5bnSamurai bond private placement forthe Philippines (Lead manager) Y100bnIndex linked UK gilt (joint bookrunner) £3.5bn
M&A: Sole M&A advisor to KKR on its acquisitionof Pets at HomeJoint financial advisor to NAB on its acquisitionof AXA Asia Pacific Holdings
27

-18.4 -1.1
3.9 1.8
7.6
23 0
-3.6
1.3
-0.9
4.6
-20
0
20
40
Merchant BankingNet revenue and income (loss) before income taxes
Quarter (billions of yen)
Business performance Fourth quarter net revenue was 7.6 billion yen (+4x QoQ). Income
before income taxes was 4.6 billion yen. Booked unrealized gains on investments in Japan and overseas. Focused on raising value of existing investments.
FY2006.3 FY2007.3 FY2010.3FY2008.3 FY2009.3
68.2 65.0 64.8
-69.9
12.2 55.4 52.8 53.3
-85.3
1.4
-100
-80-60
-40-20
0
2040
6080
FY2009.3 4Q 1Q 2Q 3Q 4Q
FY2010.3
-23.0 -40
Reference Net revenue and income (loss) before income taxes: p. 40 Business exposure: p. 40
Full year
Net revenue Income (loss) before income taxes
(billions of yen)
28

539.0 454.2
243.5
789.5
264.7 156.0 175.2
0
200
400
600
800
211.7 199.3 210.1 168.4
53.3 38.2 48.5 35.2 100
200
300
(Reference) Wholesale
Quarter Full year
Net revenue
Income (loss)
(billions of yen) (billions of yen)
FY2009.3 4Q 1Q 2Q 3Q 4Q
Global Fixed Incom e 173.8 123.1 -119.9 -217.2 308.0 5.4 105.4 76.6 70.5 55.6 -21.2% 925.6%Global Equities 168.5 147.9 206.0 98.9 352.8 22.8 92.8 93.4 90.1 76.5 -15.1% 235.3%Investm ent Banking 99.7 99.2 83.1 63.5 118.9 6.6 25.7 20.9 44.5 27.8 -37.4% 321.3%Merchant Banking 68.2 65.0 64.8 -69.9 12.2 -18.4 -1.1 3.9 1.8 7.6 328.4% -GM Other 28.8 19.1 9.5 -38.9 -2.4 -18.8 -11.1 4.6 3.2 0.9 -72.6% -Net revenue 539.0 454.2 243.5 -163.6 789.5 -2.4 211.7 199.3 210.1 168.4 -19.8% -Non-interes t expenses 274.3 298.2 393.6 553.7 614.3 192.7 158.5 161.1 161.6 133.2 -17.6% -30.9%Income before incom e taxes 264.7 156.0 -150.1 -717.3 175.2 -195.1 53.3 38.2 48.5 35.2 -27.4% -
FY2006.3 FY2007.3 FY2008.3 FY2009.3 FY2010.3FY2010.3
QoQ YoY
-163.6 -150.1
-717.3 -800
-600
-400
-200 -2.4
-195.1 -200
-100
0Income (loss) before income taxes
29

13.1 18.7 16.5 17.2 18.0
0.5
5.1 4.5 4.1 4.9
0
10
20
30
Asset ManagementNet revenue and income (loss) before income taxes
Quarter (billions of yen)
Business performance Fourth quarter net revenue was 18 billion yen (+4.4% QoQ, +37.2%
YoY). Income before income taxes was 4.9 billion yen (+20.3% QoQ, +9x YoY).
Assets under management increased by 400 billion yen from the end of December to 23.4 trillion yen as of the end of March.
Outstanding balance of Asset Management products sold via bank channels in Japan Banks, others1: Y1.1392trn (-Y25.8bn from end of December) Japan Post Bank: Y450 6bn (+Y2 7bn from end of December)
FY2009.3 4Q 1Q 2Q 3Q 4Q
FY2010.3
-10
FY2010.3FY2009.3FY2008.3FY2006.3 FY2007.3
64.1
88.1 88.7
59.8 70.4
23.8
39.4 34.0
7.4 18.6
0
20
40
60
80
100
Reference Net revenue and income (loss) before income taxes: p. 41 Assets under management: p. 41-42 Investment trust related data: p. 42
1. Excludes Japan Post Bank and Nomura Trust & Banking.Note: The defined contribution pension plan business in Asset Management was integrated to other business in the second quarter of the fiscal year ended March 31, 2009. Certain reclassifications of
previously reported amounts have been made to conform to the current presentation.
Full year
Net revenue Income (loss) before income taxes
(billions of yen)
Japan Post Bank: Y450.6bn (+Y2.7bn from end of December)
Quarter highlights Five funds including the US NASDAQ Open Course A fund won Best
Fund award at Lipper Fund Awards 2010 Japan. Winning many Japan equity and global bond investment advisory
mandates; Assets under management from Asian clients increased.
30

-27.3
21.4
-20.6
-65.4
-120
-80
-40
0
40
-22.9
-39.9 -40 9-40
-20
0
20
Segment “Other”
Business Performance Fourth quarter loss before
income taxes of 40.9 billion yen.
Booked credit valuation adjustment of 10 billion yen,
Income (loss) before income taxes
Quarter Full year
Includes ¥34.0bn related to Nomura Real Estate
Holdings IPO
(billions of yen) (billions of yen)Credit value adjustment
¥40bn
Fortress impairment of
83.3bn yen.
Credit value adjustment
¥18bn
FY2009.3
4Q 1Q 2Q 3Q 4QNet gain (loss) related to economic hedging transactions -64.1 -30.0 11.4 28.0 3.3 -7.0 5.4 8.6 -13.3 2.7
Realized gain on investments in equitysecurities held for operating purposes 8.4 18.1 1.5 -2.4 -3.4 0.2 0.1 -0.5 0.1 -3.0
Equity in earnings of af f iliates 27.8 53.2 4.7 -0.7 7.8 -6.4 3.7 0.6 1.9 1.6
Corporate items -7.4 -11.1 -13.4 -70.5 -83.3 -27.6 -24.9 -19.6 -10.7 -28.1
Others1 8.0 -8.8 -24.8 -19.8 -135.7 17.9 -48.8 -29.0 -43.8 -14.1
Income before income taxes -27.3 21.4 -20.9 -65.4 -211.3 -22.9 -64.6 -39.9 -65.9 -40.9
FY2008.3FY2007.3 FY2010.3FY2009.3FY2010.3
FY2006.3
-211.3 -240
-200
-160
-64.6 -65.9
-40.9
-80
-60
1. Businesses not included in the five business divisions (Nomura Trust & Banking, etc.) are included in others.Note:1 The defined contribution pension plan business in Asset Management was integrated to Other business in the second quarter of the fiscal year ended March 31, 2009. Certain reclassifications of previously reported
amounts have been made to conform to the current presentation.Note2: Net income (loss) is net income (loss) before subtracting net income attributable to non-controlling interest. Certain reclassifications of previously reported amounts have been made to conform to the current year
presentation.Note3:Net gain (loss) related to economic hedging transactions but not included in net gain (loss) on trading, which was previously classified as "Others", is included in "Net gain (loss) related to economic hedging transactions" as well as net gain (loss) on
trading related to economic hedging transactions. In addition, net gain (loss) on trading from the change in its own creditworthiness of certain structured notes issued, which was previously classified as "Net gain (loss) on trading related to economichedging transactions", is included in "Others". The reclassifications of previously reported amounts have been made to conform to the current year presentation.
JAFCOimpairment of
¥13.6bn
31

326.1
266.9 272.7 256.6 249.3
200
300
400
607.2687.9
852.2
1,092.9 1,045.6
600
800
1,000
1,200
Other
Business development expenses
Occupancy and related depreciation
Non-interest expenses
Business Performance Fourth quarter non-interest expenses of
249.3 billion yen (-2.8% QoQ) Despite increased expenses for US build
out, etc., cost cutting project is producing results and overall expenses were down.
Quarter Full year(billions of yen) (billions of yen)
FY2009.3 4Q 1Q 2Q 3Q 4Q
Compensation and benef its 311.3 331.0 366.8 491.6 526.2 161.7 138.1 146.6 126.2 115.3 -8.7%Variable-ty pe compensation and benef its 150.5 157.6 174.7 129.9 171.1 31.3 50.3 57.6 37.5 25.7 -31.4%
Commissions and f loor brokerage 31.4 49.8 90.2 73.7 86.1 17.1 20.0 21.7 22.9 21.5 -6.4%
Inf ormation processing and communications 89.1 109.5 135.0 155.0 175.6 46.2 40.2 43.9 43.9 47.6 8.3%
Occupancy and related depreciation 50.8 57.4 64.8 78.5 87.8 22.2 22.0 22.6 21.3 21.9 2.9%
Business development expenses 30.6 35.3 38.1 31.6 27.3 8.6 6.3 6.4 6.5 8.2 24.6%
Other 94.1 105.0 157.2 262.6 142.5 70.4 40.4 31.5 35.7 34.9 -2.0%
Total 607.2 687.9 852.2 1,092.9 1,045.6 326.1 266.9 272.7 256.6 249.3 -2.8%
FY2009.3 FY2010.3FY2007.3 FY2010.3 QoQFY2008.3FY2006.3
0
100
0
200
400
Information processing and communications
Commissions and floor brokerage
Compensation and benefits
Reference Number of employees: p. 44
32

FY2009.3 4Q 1Q 2Q 3Q 4Q
Com m iss ions 269.4 251.4 225.9 151.0 238.9 35.5 55.9 59.8 62.3 61.0 -2.1% 71.7%
Sales credit 109.0 96.8 94.2 71.4 63.8 12.3 20.0 15.5 13.3 15.0 12.8% 21.9%
Fees from investm ent banking 26.4 24.0 14.9 13.4 33.6 3.7 7.2 5.1 15.1 6.1 -59.5% 64.9%
Inves tm ent trus t adm inis tration fees and other 34.4 47.5 59.7 50.9 47.3 9.3 11.1 11.8 12.1 12.3 1.1% 31.9%
Net interes t revenue 7.4 20.4 7.3 5.2 4.7 1.1 1.2 0.9 1.5 1.1 -25.9% -1.8%
Net revenue 446.5 440.1 402.0 291.9 388.3 61.9 95.4 93.2 104.3 95.5 -8.5% 54.1%
Non-interes t expenses 249.3 279.3 279.7 273.6 274.9 67.5 67.5 66.8 69.1 71.5 3.4% 5.9%
FY2009.3FY2010.3
FY2010.3 YoYFY2006.3 FY2007.3 FY2008.3 QoQ
Retail related data (1)(billions of yen)
Incom e before incom e taxes 197.2 160.9 122.3 18.2 113.4 -5.5 27.9 26.4 35.2 24.0 -31.8% -
Dom es tic dis tribution volum e of investm ent trus ts 1 9,846.9 6,825.1 9,713.2 1,637.8 2,327.2 2,446.8 2,438.2 2,501.0 2.6% 52.7%
Bond inves tm ent trus ts 3,681.8 2,731.6 2,380.1 591.4 624.0 593.3 544.8 618.1 13.5% 4.5%
Stock inves tm ent trus ts 4,816.1 2,969.3 6,165.7 867.5 1,425.0 1,595.4 1,602.7 1,542.6 -3.8% 77.8%
Foreign inves tm ent trus ts 1,349.0 1,124.2 1,167.4 178.9 278.3 258.0 290.7 340.4 17.1% 90.2%
Accum ulated value of annuity insurance policies 683.3 990.4 1,205.3 1,413.3 1,609.2 1,413.3 1,462.5 1,507.0 1,542.5 1,609.2 4.3% 13.9%
Sales of JGBs for individual investors (transaction base) 747.8 615.2 292.3 109.6 22.2 7.8 8.1 7.0 4.7 2.5 -46.6% -67.9%
Retail foreign currency bond sales 1,119.2 677.1 954.0 867.4 1,080.3 156.7 288.4 252.6 215.3 323.9 50.4% 106.7%
Other
1. Nomura Securities.33

150
180
50
60
70
Retail related data (2)
Stock brokerage commissions and commissions for distribution of investment trusts1
Quarter Full year(billions of yen) (billions of yen)
FY2009.3
4Q 1Q 2Q 3Q 4Q
Stock brokerage com miss ions 153.6 98.3 75.1 50.8 55.3 10.3 15.8 14.7 12.3 12.5 1.7% 21.4%
Com m iss ions for dis tribution of inves tm ent trus ts1 95.9 124.7 124.5 79.8 168.8 19.7 39.8 41.5 44.7 42.8 -4.3% 117.1%
1. Nomura Securities
FY2010.3 FY2010.3 FY2008.3 YoYQoQFY2006.3 FY2007.3 FY2009.3
0
30
60
90
120
Stock brokerage commissions
Commissions for distribution of investment trusts
0
10
20
30
40
34

80.5 85.2
72.2
59.3 60
80
100 Other
Overseas mutual fundsBond investment trustsStock investment trustsD ti b d
67.2 68.9 71.0 73.5
Retail related data (3)
Retail client assets1
Quarter Full year
(trillions of yen)
Mar. 31, 2006 Mar. 31, 2007 Mar. 31, 2008 Mar. 31, 2009 Jun. 30, 2009 Sep. 30, 2009 Dec. 31, 2009 Mar. 31, 2010
Equities 49.3 48.5 37.2 28.6 34.6 35.7 37.3 39.2Foreign currency bonds 3.6 3.3 2.7 5.5 5.8 5.7 5.6 5.6Domestic bonds 13.1 16.4 16.5 13.0 13.3 13.6 13.5 13.4Stock investment trusts 5.3 7.4 7.3 5.0 5.9 6.4 6.8 7.3Bond investment trusts 4.5 4.7 4.4 4.0 3.9 3.9 4.0 4.0Overseas mutual funds 2.3 2.0 1.7 1.4 1.5 1.5 1.5 1.6Other 2.3 2.9 2.5 1.9 2.0 2.2 2.2 2.2
Total 80.5 85.2 72.2 59.3 67.2 68.9 71.0 73.5
0
20
40
Domestic bonds
Foreign currency bondsEquities
4
3
2
1. Domestic Client Assets name changed to Retail client assets.2. Euroyen bonds have been moved from domestic bonds to foreign currency bonds from the third quarter of the fiscal year ended March 31, 2009.3. Includes CBs and warrants.4. Includes annuity insurance. 35

5,975
8,000
5,000
6,000
Retail related data (4)
Retail client assets: Net asset inflow1
Full year Quarter
(billions of yen)
FY2009.3
4Q 1Q 2Q 3Q 4QFY2009.3
FY2010.3 FY2010.3FY2006.3 FY2007.3 FY2008.3
4,581
,
4,868 4,928 5,279
0
2,000
4,000
6,000
-213
1,8792,0031,610
1,013
-1,000
0
1,000
2,000
3,000
4,000
1. Retail client assets exclude portion from regional financial institutions.Note: Net asset inflow = asset inflow – asset outflow. 36

Retail related data (5)
Number of accounts / IT share1
Mar. 31, 2006 Mar. 31, 2007 Mar. 31, 2008 Mar. 31, 2009 Jun. 30, 2009 Sep. 30, 2009 Dec. 31, 2009 Mar. 31, 2010
(thousands)
Accounts with balance 3,780 3,953 4,165 4,467 4,494 4,517 4,751 4,883
Equity holding accounts 1,745 1,853 2,027 2,347 2,378 2,399 2,410 2,572
Nomura Home Trade (online trading accounts) 1,969 2,243 2,765 3,095 3,130 3,166 3,119 3,189
1. IT share is the percentage of trades via Nomura Home Trade and our Telephone Answer service comprising the total of cash stock transactions and kabushiki-mini-toshi (odd lot stock investment).
Quarter Full year
37
FY2009.34Q 1Q 2Q 3Q 4Q
New individual accounts (thousands) 343 417 580 608 336 81 65 71 74 126
IT share1
No. of orders 55% 55% 57% 59% 58% 60% 61% 60% 56% 55%
Transaction value 27% 27% 29% 29% 29% 29% 31% 29% 26% 28%
FY2010.3FY2006.3 FY2008.3 FY2010.3FY2009.3FY2007.3

FY2009.3 4Q 1Q 2Q 3Q 4Q
Global Fixed Income 173.8 123.1 -119.9 -217.2 308.0 5.4 105.4 76.6 70.5 55.6 -21.2% 925.6%Global Equities 168.5 147.9 206.0 98.9 352.8 22.8 92.8 93.4 90.1 76.5 -15.1% 235.3%Other 28.8 19.1 9.5 -38.9 -2.4 -18.8 -11.1 4.6 3.2 0.9 -72.6% -Net revenue 371.1 290.0 95.6 -157.3 658.4 9.4 187.1 174.5 163.9 133.0 -18.9% 1314.8%Non-interest expenses 213.4 231.2 321.8 417.4 486.4 140.2 124.9 127.8 130.8 103.0 -21.2% -26.6%Income before income taxes 157.7 58.8 -226.2 -574.6 172.0 -130.8 62.3 46.7 33.1 30.0 -9.4% -
QoQFY2006.3 FY2007.3 FY2010.3 YoYFY2010.3
FY2008.3 FY2009.3
Global Markets related data
(billions of yen)
Monoline insurer-related exposure
1. Based on S&P or Moody’s depending on which rating is lower.
Credit derivative transactions with monoline insurers (excluding provisions and hedged exposure)
38
Mar. 31, 2010 (millions of US$)
Monoline insurers by credit rating1
(No. of companies)Notional Gross exposure
Counterparty riskreserves and other
adjustmentsNet exposure
Non-investment grade(4) $5,837 $2,162 $1,812 $350Total $5,837 $2,162 $1,812 $350
Dec. 31, 2009 (millions of US$)
Monoline insurers by credit rating1
(No. of companies)Notional Gross exposure
Counterparty riskreserves and other
adjustmentsNet exposure
A(1) $210 $53 $7 $46Non-investment grade(4) $8,282 $3,621 $3,200 $421
Total $8,492 $3,674 $3,207 $467

Equity capital markets bookrunner league table Japan equity and equity-related (excl. self funding)
Investment Banking related data
League tablesM&A financial advisors league table
Japan announced deals
(billions of yen)
Proceeds (US$m) Mktshare
No. ofdeals
1 Nomura 29,508 35.1% 562 Goldman Sachs 8,219 9.8% 7
Rank BookrunnerApr. 1, 2009–Mar. 31, 2010
Rank Value (US$m)
Mktshare
No. ofdeals
1 Nomura 46,563 33.7% 1212 Mizuho Financial Group 38,190 27.6% 126
Rank AdvisorApr. 1, 2009–Mar. 31, 2010
FY2009.3
4Q 1Q 2Q 3Q 4QNet revenue 99.7 99.2 83.1 63.5 118.9 6.6 25.7 20.9 44.5 27.8 -37.4% 321.3%Non-interest expenses 48.1 54.8 60.3 120.9 117.2 47.9 31.1 30.7 28.2 27.2 -3.4% -43.2%Income before income taxes 51.5 44.4 22.8 -57.4 1.7 -41.3 -5.4 -9.7 16.3 0.6 -96.2% -
FY2006.3 FY2007.3 FY2010.3FY2008.3 FY2009.3 QoQ YoYFY2010.3
Global equity & equity –related bookrunner league table Domestic straight bonds (excluding self-funding)
Source: Thomson Reuters 39
,3 Daiwa Securities SMBC 6,384 7.6% 164 Mizuho Financial Group 4,930 5.9% 145 Morgan Stanley 3,829 4.6% 56 JP Morgan 3,381 4.0% 47 Barclays 2,848 3.4% 38 Bank of America Merrill Lynch 2,416 2.9% 69 Mitsubishi UFJ Financial Group 2,114 2.5% 13
10 Nikko Citi 1,087 1.3% 2
2 Mizuho Financial Group 38,190 27.6% 1263 Goldman Sachs & Co 32,843 23.8% 214 Daiwa Securities Group Inc 30,397 22.0% 765 JP Morgan 30,205 21.9% 186 UBS 27,545 19.9% 217 Citi 25,782 18.7% 328 Bank of America Merrill Lynch 21,805 15.8% 269 Mitsubishi UFJ Financial Group 21,176 15.3% 7010 Morgan Stanley 19,277 13.9% 20
Proceeds (US$m) Mktshare
No. ofissues
1 JP Morgan 110,034 11.4% 4402 Goldman Sachs & Co 94,564 9.8% 3063 Morgan Stanley 72,150 7.5% 3294 Credit Suisse 56,558 5.9% 2605 UBS 56,234 5.8% 2866 Bank of America Merrill Lynch 55,941 5.8% 3417 Deutsche Bank AG 39,766 4.1% 2198 Citi 39,763 4.1% 2659 Nomura 32,332 3.4% 83
10 Barclays 16,001 1.7% 116
Rank BookrunnerApr. 1, 2009–Mar. 31, 2010 Rank Bookrunner
Proceeds(¥m )
Mktshare
No. ofissues
1 Nomura 2,481,550 25.4% 1262 Mizuho Financial Group 2,240,820 22.9% 1073 Daiw a Securities Capital Markets 1,947,664 19.9% 1094 Mitsubishi UFJ Securities 1,807,662 18.5% 815 Nikko Cordial Securities 847,735 8.7% 286 Nikko Citi 247,317 2.5% 167 Goldman Sachs 49,327 0.5% 38 Bank of America Merrill Lynch 44,993 0.5% 49 Barclays Capital 40,500 0.4% 4
10 Toyota FInancial Services Sec. 30,000 0.3% 4
Apr. 1, 2009–M ar. 31, 2010

543.4 600
Merchant Banking related data
Business exposureFull year Quarter
(billions of yen)
(billions of yen) FY2009.3 4Q 1Q 2Q 3Q 4Q
Net revenue 68.2 65.0 64.8 -69.9 12.2 -18.4 -1.1 3.9 1.8 7.6 328.4% -Non-interes t expenses 12.8 12.2 11.5 15.4 10.7 4.6 2.5 2.6 2.6 3.0 13.7% -34.6%Income before incom e taxes 55.4 52.8 53.3 -85.3 1.4 -23.0 -3.6 1.3 -0.9 4.6 - -
FY2010.3FY2007.3 FY2009.3 QoQFY2008.3FY2006.3 YoYFY2010.3
Mar. 31, 2006 Mar. 31, 2007 Mar. 31, 2008 Mar. 31, 2009 Jun. 30, 2009 Sep. 30, 2009 Dec. 31, 2009 Mar. 31, 2010
Japan 59.9 195.5 169.5 191.7 190.2 187.2 186.8 186.9
Europe (excluding Terra Firm a) 38.8 35.7 41.4 60.0 66.6 65.9 65.9 60.4
As ia - - - 3.2 3.4 3.1 3.3 3.6
Sub Total 98.7 231.2 210.9 254.9 260.2 256.3 256.0 250.9
Terra Firm a 340.4 312.2 170.5 111.4 122.0 112.3 116.3 119.2
Total 439.1 543.4 381.4 366.3 382.1 368.6 372.3 370.0
439.1
381.4 366.3
98.7
231.2 210.9 254.9
0
100
200
300
400
500 Terra Firma
Asia
Europe (excluding Terra Firma)
Japan260.2 256.3 256.0 250.9
382.1 368.6 372.3 370.0
Note: Amount of exposure in Japan is total of Nomura Principal Finance (NPF), Nomura Financial Partners (NFP), Nomura Research & Advisory (NR&A) and others.Amount of exposure in Europe (excluding Terra Firma) is total of Private Equity Group (PEG), Nomura Phase4 Ventures (NPV) and others. 40

FY2009.3 4Q 1Q 2Q 3Q 4Q
Net revenue 64.1 88.1 88.7 59.8 70.4 13.1 18.7 16.5 17.2 18.0 4.4% 37.2%Non-interes t expenses 40.3 48.7 54.8 52.4 51.8 12.6 13.5 12.0 13.2 13.1 -0.6% 3.9%Incom e before incom e taxes 23.8 39.4 34.0 7.4 18.6 0.5 5.1 4.5 4.1 4.9 20.3% 837.2%
FY2010.3FY2010.3 YoYQoQFY2009.3FY2006.3 FY2007.3 FY2008.3
Asset Management related data (1)
Total assets under managementFull year Quarter
Note: In January 2006, certain functions of Other business were integrated into Asset Management. Certain reclassifications of previously reported amounts have been made to conform to the current presentation.The defined contribution pension plan business in Asset Management was integrated to other business in the second quarter of the fiscal year ended March 31, 2009. Certain reclassifications of previously reported amounts have been made to conform to the current presentation.
(billions of yen)
Mar. 31, 2006 Mar. 31, 2007 Mar. 31, 2008 Mar. 31, 2009 Jun. 30, 2009 Sep. 30, 2009 Dec. 31, 2009 Mar. 31, 2010
23.1
27.0 25.8
20.2
0
5
10
15
20
25
30
35
22.2 22.9 23.1 23.4
Note: Total assets under management of Nomura Asset Management, Nomura Corporate Research and Asset Management, Nomura Funds Research and Technologies, MAINTRUST KAG, and Nomura Funds Research and Technologies America, Private Equity Funds Research and Investments. Adjusted for asset overlap amongst group companies. Data until March 31, 2006, include Nomura BlackRock Asset Management. Nomura Funds Research and Technologies America data as of end of January 2010.
(trillions of yen)
41
21.0
25.9 24.3
19.0 20
25
30
Overseas investment advisory
Domestic investment
21.1 21.8
21.9 22.0
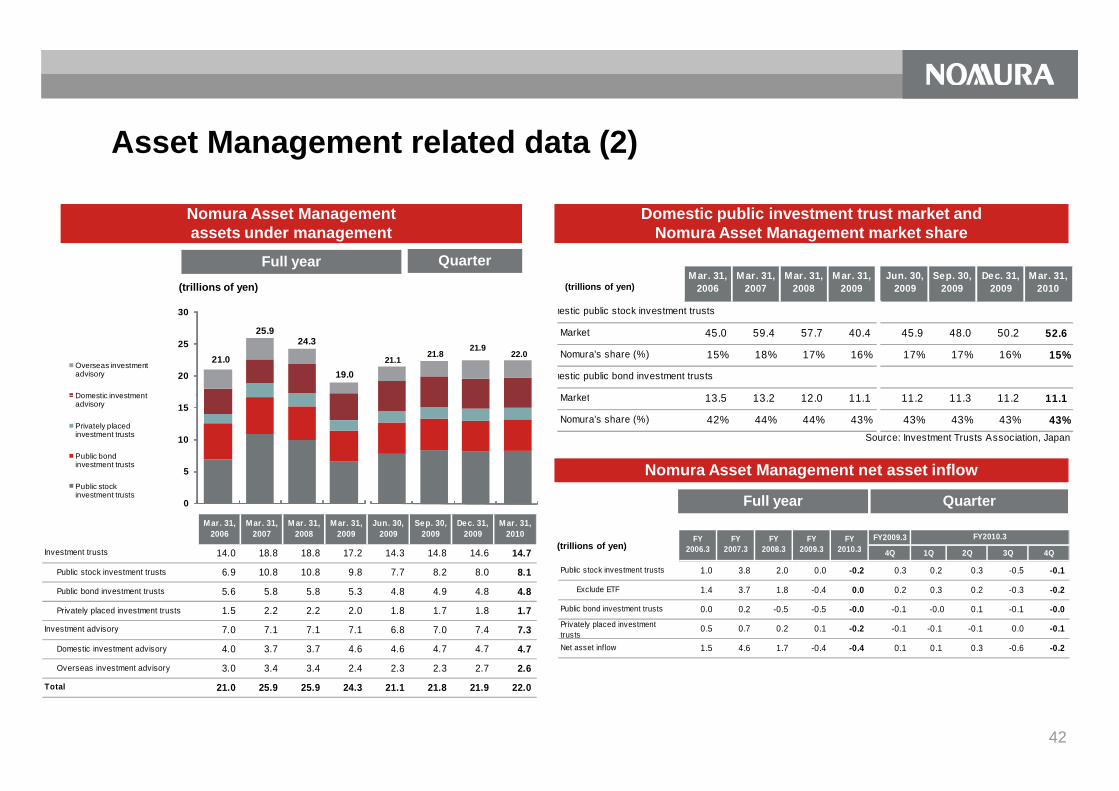
Asset Management related data (2)
Nomura Asset Management assets under management
Domestic public investment trust market and Nomura Asset Management market share
Full year Quarter (trillions of yen) (trillions of yen)
M ar. 31,2006
M ar. 31,2007
M ar. 31,2008
M ar. 31,2009
Jun. 30,2009
Sep. 30,2009
Dec. 31,2009
M ar. 31,2010
mestic public stock investment trusts
Market 45.0 59.4 57.7 40.4 45.9 48.0 50.2 52.6
Nomura's share (%) 15% 18% 17% 16% 17% 17% 16% 15%
mestic public bond investment trusts
Market 13 5 13 2 12 0 11 1 11 2 11 3 11 2 11 1
FY2009.3
4Q 1Q 2Q 3Q 4Q
1.0 3.8 2.0 0.0 -0.2 0.3 0.2 0.3 -0.5 -0.1
Exclude ETF 1.4 3.7 1.8 -0.4 0.0 0.2 0.3 0.2 -0.3 -0.2
0.0 0.2 -0.5 -0.5 -0.0 -0.1 -0.0 0.1 -0.1 -0.0
0.5 0.7 0.2 0.1 -0.2 -0.1 -0.1 -0.1 0.0 -0.1
1.5 4.6 1.7 -0.4 -0.4 0.1 0.1 0.3 -0.6 -0.2
Public stock investment trusts
FY2010.3
FY2010.3FY2007.3
FY2008.3
FY2009.3
FY2006.3
Privately placed investmenttrustsNet asset inf low
Public bond investment trusts
Mar. 31,2006
Mar. 31,2007
M ar. 31,2008
Mar. 31,2009
Jun. 30,2009
Sep. 30,2009
Dec. 31,2009
Mar. 31,2010
14.0 18.8 18.8 17.2 14.3 14.8 14.6 14.7
Public stock investment trusts 6.9 10.8 10.8 9.8 7.7 8.2 8.0 8.1
Public bond investment trusts 5.6 5.8 5.8 5.3 4.8 4.9 4.8 4.8
Privately placed investment trusts 1.5 2.2 2.2 2.0 1.8 1.7 1.8 1.7
7.0 7.1 7.1 7.1 6.8 7.0 7.4 7.3
Domestic investment advisory 4.0 3.7 3.7 4.6 4.6 4.7 4.7 4.7
Overseas investment advisory 3.0 3.4 3.4 2.4 2.3 2.3 2.7 2.6
21.0 25.9 25.9 24.3 21.1 21.8 21.9 22.0
Investment advisory
Total
Investment trusts
0
5
10
15Domestic investment advisory
Privately placed investment trusts
Public bond investment trusts
Public stock investment trusts
Nomura Asset Management net asset inflow
Full year Quarter
(trillions of yen)
42
Market 13.5 13.2 12.0 11.1 11.2 11.3 11.2 11.1
Nomura's share (%) 42% 44% 44% 43% 43% 43% 43% 43%Source: Investment Trusts Association, Japan
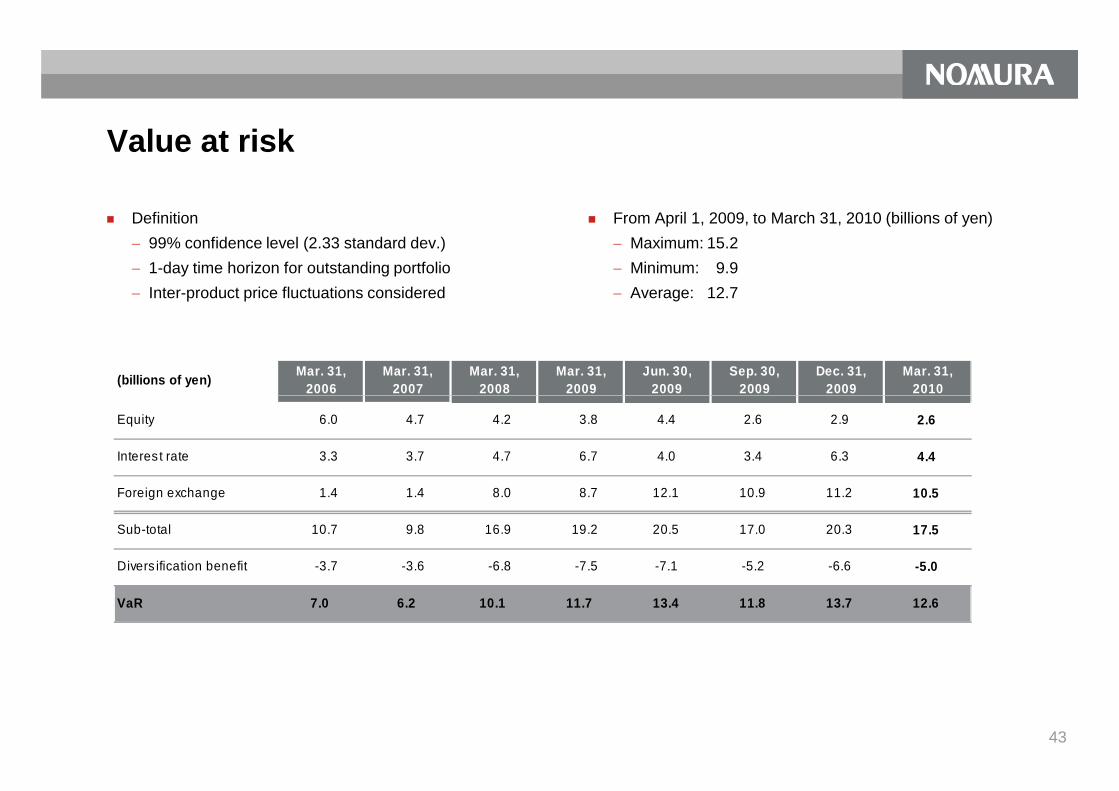
Value at risk
Definition 99% confidence level (2.33 standard dev.) 1-day time horizon for outstanding portfolio Inter-product price fluctuations considered
From April 1, 2009, to March 31, 2010 (billions of yen) Maximum: 15.2 Minimum: 9.9 Average: 12.7
Mar. 31,2010
Mar. 31,2007
Dec. 31,2009
Mar. 31,2009
Sep. 30,2009
Jun. 30,2009
Mar. 31,2008(billions of yen) Mar. 31,
2006
43
Equity 6.0 4.7 4.2 3.8 4.4 2.6 2.9 2.6
Interest rate 3.3 3.7 4.7 6.7 4.0 3.4 6.3 4.4
Foreign exchange 1.4 1.4 8.0 8.7 12.1 10.9 11.2 10.5
Sub-total 10.7 9.8 16.9 19.2 20.5 17.0 20.3 17.5
-3.7 -3.6 -6.8 -7.5 -7.1 -5.2 -6.6 -5.0
7.0 6.2 10.1 11.7 13.4 11.8 13.7 12.6
Divers ification benefit
VaR

Number of employees
Mar. 31, 2006 Mar. 31, 2007 Mar. 31, 2008 Mar. 31, 2009 Jun. 30, 2009 Sep. 30, 2009 Dec.31,2009 Mar.31,2010
Japan (excluding FA)1 9,618 10,667 11,561 12,929 13,316 13,111 12,977 12,857
Japan (FA)2 1,948 2,174 2,377 2,391 2,343 2,294 2,244 2,196
Europe 1,515 1,791 1,956 4,294 4,270 4,369 4,402 4,369
Americas 1,073 1,322 1,063 1,079 1,168 1,468 1,643 1,781
1. Excludes employees of private equity investee companies.2. Figures up to March 2008 include savings advisors.3. Includes Powai office in India.Note: Headcount figures have been reclassified to include certain contract employees since September 2007. Certain reclassifications of previously reported amounts have been made to conform to the
current presentation.44
Asia-Pacific3 778 900 1,070 4,933 4,633 4,675 4,877 5,171
Total 14,932 16,854 18,026 25,626 25,730 25,917 26,143 26,374

Consolidated incomeFY2009.3
4Q 1Q 2Q 3Q 4Q
Commissions 356.3 337.5 404.7 306.8 395.1 66.3 102.0 95.4 101.0 96.6
Fees f rom investment banking 108.8 99.3 85.1 55.0 121.3 11.8 29.7 15.6 44.5 31.4
Asset management and portfolio service fees 102.7 146.0 189.7 140.2 132.2 25.6 30.3 34.0 34.2 33.7
Net gain on trading 304.2 290.0 61.7 -128.3 417.4 16.7 121.1 148.5 66.5 81.3
Gain (loss) on private equity investments 12.3 47.6 76.5 -54.8 11.9 -15.5 -2.1 2.0 2.3 9.7
Interest and dividends 693.8 981.3 796.5 331.4 235.3 40.5 58.4 53.6 67.4 55.9
Gain (loss) on investments in equity securities 67.7 -20.1 -48.7 -25.5 6.0 -3.7 9.8 -2.3 -3.8 2.4
Private equity entities product sales 88.2 100.1 - - - - - - - -
Other 58.8 67.4 28.2 39.9 37.5 4.5 14.3 8.7 9.4 5.2
FY2010.3(billions of yen) FY2008.3 FY2010.3
Revenue
FY2007.3 FY2009.3FY2006.3
Note: Certain reclassifications of previously reported amounts have been made to conform to the current year presentation.
45
1,792.8 2,049.1 1,593.7 664.5 1,356.8 146.2 363.6 355.5 321.6 316.1
647.2 958.0 806.5 351.9 205.9 47.0 65.2 55.4 47.1 38.2
1,145.7 1,091.1 787.3 312.6 1,150.8 99.2 298.4 300.0 274.5 277.9
693.7 772.6 852.2 1,092.9 1,045.6 326.1 266.9 272.7 256.6 249.3
452.0 318.5 -64.9 -780.3 105.2 -226.9 31.4 27.3 18.0 28.6
99.4 - - - - - - - - -
Income (loss) before income taxes 551.4 318.5 -64.9 -780.3 105.2 -226.9 31.4 27.3 18.0 28.6
256.6 175.8 -67.8 -708.2 67.8 -215.8 11.4 27.7 10.2 18.4
47.7 - - - - - - - - -
Net income (loss) 304.3 175.8 -67.8 -708.2 67.8 -215.8 11.4 27.7 10.2 18.4
Net income (loss) attributable to Nomura Holdings, Inc.("NHI") shareholders f rom discontinued operations
Net revenue
Non-interest expensesIncome (loss) f rom continuing operationsbefore income taxesIncome f rom discontinued operationsbefore income taxes
Interest expense
Net income (loss) attributable to Nomura Holdings, Inc.("NHI") shareholders f rom continuing operations
Total revenue

Adjustment of consolidated results and segment results: Income (loss) before income taxes
(billions of yen) FY2009.3
4Q 1Q 2Q 3Q 4Q
Retail 197.2 160.9 122.3 18.2 113.4 -5.5 27.9 26.4 35.2 24.0
Global Markets 157.7 58.8 -226.2 -574.6 172.0 -130.8 62.3 46.7 33.1 30.0
Investm ent Banking 51.5 44.4 22.8 -57.4 1.7 -41.3 -5.4 -9.7 16.3 0.6
Merchant Banking 55.4 52.8 53.3 -85.3 1.4 -23.0 -3.6 1.3 -0.9 4.6
Wholesale 264.7 156.0 -150.1 -717.3 175.2 -195.1 53.3 38.2 48.5 35.2
FY2009.3FY2010.3
FY2007.3 FY2008.3FY2006.3 FY2010.3
Note:1. Gain (loss) on investments in equity securities, our share of equity in the earnings (losses) of affiliates, impairment losses on long-lived assets, corporate items and other financial
adjustments are included as “Other” operating results outside business segments in our segment information. 2. Certain reclassifications of previously reported amounts have been made to conform to the current year presentation. 3. In January 2006, certain functions of Other business were integrated into Asset Management. Certain reclassifications of previously reported amounts have been made to conform to the
current presentation.4. The defined contribution pension plan business in Asset Management was integrated to Other business in the second quarter of the fiscal year ended March 31, 2009. Certain
reclassifications of previously reported amounts have been made to conform to the current presentation.46
Asset Managem ent 23.8 39.4 34.0 7.4 18.6 0.5 5.1 4.5 4.1 4.9
485.7 356.3 6.2 -691.7 307.1 -200.1 86.3 69.0 87.8 64.1
Other -33.1 21.0 -20.9 -65.4 -211.3 -22.9 -64.6 -39.9 -65.9 -40.9
452.6 377.3 -14.7 -757.1 95.8 -223.0 21.7 29.1 21.8 23.2
59.3 -38.2 -50.2 -23.1 9.4 -4.0 9.7 -1.8 -3.9 5.4
-59.9 -21.5 - - - - - - - -
452.0 318.5 -64.9 -780.3 105.2 -226.9 31.4 27.3 18.0 28.6
99.4 - - - - - - - - -
551.4 318.5 -64.9 -780.3 105.2 -226.9 31.4 27.3 18.0 28.6
US GAAP
Unrealized gain (loss) on inves tm ents inequity securities he ld for operating
Unrealized gain (loss) on inves tm ents inequity securities he ld for operating
5 Business segm ent total
Segm ent total

FY2009.3 4Q 1Q 2Q 3Q 4Q
Stock brokerage comm iss ions (retail) 153.6 98.3 75.1 50.8 55.3 10.3 15.8 14.7 12.3 12.5Stock brokerage comm iss ions (other) 79.5 73.2 166.6 144.7 140.3 28.9 39.2 34.5 33.7 33.0Other brokerage comm iss ions 14.3 6.8 9.3 7.9 8.0 0.9 2.9 -0.0 2.6 2.6Commissions for distribution of investment trusts 85.1 120.5 121.2 75.9 165.9 19.1 39.5 41.3 43.6 41.5Other 23.8 38.6 32.4 27.5 25.5 7.3 4.7 5.0 8.8 7.0Total 356.3 337.5 404.7 306.8 395.1 66.3 102.0 95.4 101.1 96.6
Equity underwriting and dis tribution 57.3 56.6 32.1 13.2 74.9 1.5 17.1 7.7 30.4 19.6Bond underwriting and dis tribution 21.2 15.3 13.4 11.9 16.6 4.0 3.8 2.9 6.5 3.5
FY2010.3FY2008.3 FY2010.3FY2009.3(billions of yen) FY2006.3 FY2007.3
Main revenue items
Fees from
Commissions
M&A / financial advisory fees 30.3 26.7 37.8 26.7 29.2 5.8 8.6 4.9 7.6 8.2Other 0.1 0.7 1.8 3.1 0.5 0.5 0.3 0.1 0.1 0.1Total 108.8 99.3 85.1 55.0 121.3 11.8 29.7 15.6 44.5 31.4
Asset management fees 68.5 106.3 150.3 104.1 97.6 18.4 22.0 26.0 25.5 24.1Adminis tration fees 20.6 24.0 21.7 21.3 19.4 4.1 4.5 4.6 4.8 5.4Custodial fees 13.6 15.7 17.7 14.7 15.3 3.0 3.8 3.4 4.0 4.1Total 102.7 146.0 189.7 140.2 132.2 25.6 30.3 34.0 34.2 33.7
Bonds and other 150.9 154.9 -70.3 -87.0 215.1 77.9 56.0 93.8 24.0 41.3Equity 148.1 137.6 137.0 -38.7 196.3 -59.7 64.8 53.6 38.3 39.6Merchant banking 5.2 -2.5 -5.0 -2.7 6.0 -1.6 0.3 1.1 4.2 0.4Net interes t revenue 46.6 23.3 -9.9 -20.5 29.4 -6.5 -6.8 -1.9 20.4 17.7Total 350.8 313.4 51.8 -148.9 446.8 10.2 114.3 146.6 86.8 99.0
1. Includes net interest revenue.
Net gain on trading1
ees oInvestment
Banking
Asset Management and portfolio service fees
47

Nomura Holdings, Inc.g ,www.nomura.com
![Flash Report [Japanese GAAP] (Consolidated Basis) · 1 May 12, 2016 Flash Report [Japanese GAAP] (Consolidated Basis) Results for the fiscal year ended March 31, 2016 Company name:](https://static.fdocuments.in/doc/165x107/5acad21d7f8b9a5d718e6a72/flash-report-japanese-gaap-consolidated-basis-may-12-2016-flash-report-japanese.jpg)


![Consolidated Earnings Report for Fiscal 2013 [Japanese ... · Consolidated Earnings Report for Fiscal 2013 [Japanese GAAP] April 23, ... the THAI KOITO COMPANY LIMITED’s Prachinburi](https://static.fdocuments.in/doc/165x107/5ae7a3817f8b9a3d3b8ed5b3/consolidated-earnings-report-for-fiscal-2013-japanese-earnings-report-for-fiscal.jpg)
![FLASH REPORT [JAPANESE GAAP] (CONSOLIDATED BASIS… · 1 April 28, 2017 FLASH REPORT [JAPANESE GAAP] (CONSOLIDATED BASIS) Company name: West Japan Railway Company Stock listings:](https://static.fdocuments.in/doc/165x107/5acf72677f8b9a56098d16c9/flash-report-japanese-gaap-consolidated-basis-april-28-2017-flash-report.jpg)