Consolidated Financial Summary (Japanese GAAP) for … Net Income per Share (Fully Diluted) ......
42
Consolidated Financial Summary (Japanese GAAP) for the Six Months Ended September 30, 2017 November 13, 2017 Company name: Sony Financial Holdings Inc. (URL: http://www.sonyfh.co.jp/index_en.html) Stock exchange listing: Tokyo Stock Exchange (code number: 8729) Representative: Shigeru Ishii, President and Representative Director Inquiries: Yasuo Hasegawa, General Manager - Investor Relations Dept. (Fractional amounts of less than ¥1 million are discarded.) 1. Consolidated financial results for the six months ended September 30, 2017 (1) Operating results Ordinary Revenues Ordinary Profit Profit Attributable to Owners of the Parent Millions of yen % change Millions of yen % change Millions of yen % change For the six months ended September 30, 2017 708,324 12.1 32,669 (12.0) 21,596 (14.0) For the six months ended September 30, 2016 631,923 (4.6) 37,116 28.7 25,119 31.2 Note: Comprehensive Income: For the six months ended September 30, 2017: ¥ 24,737 million: 30.8% For the six months ended September 30, 2016: ¥ 18,910 million: 14.7% Net Income per Share Net Income per Share (Fully Diluted) Yen Yen For the six months ended September 30, 2017 49.65 49.65 For the six months ended September 30, 2016 57.75 57.75 (2) Financial conditions Total Assets Total Net Assets Net Asset Ratio Millions of yen Millions of yen % As of September 30, 2017 11,979,281 597,900 5.0 As of March 31, 2017 11,471,845 601,139 5.2 Notes: Net Assets Attributable to Shareholders: As of September 30, 2017: ¥ 596,297 million As of March 31, 2017: ¥ 599,630 million 2. Dividends Dividend per Share Record date 1st quarter 2nd quarter 3rd quarter Year-end Annual Total Yen Yen Yen Yen Yen For the year ended March 31, 2017 - 0.00 - 55.00 55.00 For the year ending March 31, 2018 - 0.00 For the year ending March 31, 2018 (forecast) - 55.00 55.00 Note: Changes in dividend forecast since the most recent public announcement: None
Transcript of Consolidated Financial Summary (Japanese GAAP) for … Net Income per Share (Fully Diluted) ......

Consolidated Financial Summary (Japanese GAAP) for the Six Months Ended September 30, 2017
November 13, 2017Company name: Sony Financial Holdings Inc. (URL: http://www.sonyfh.co.jp/index_en.html) Stock exchange listing: Tokyo Stock Exchange (code number: 8729) Representative: Shigeru Ishii, President and Representative Director Inquiries: Yasuo Hasegawa, General Manager - Investor Relations Dept. (Fractional amounts of less than ¥1 million are discarded.) 1. Consolidated financial results for the six months ended September 30, 2017
(1) Operating results
Ordinary Revenues Ordinary Profit Profit Attributable to Owners of the Parent
Millions of yen % change Millions of yen % change Millions of yen % change For the six months ended September 30, 2017 708,324 12.1 32,669 (12.0) 21,596 (14.0)
For the six months ended September 30, 2016 631,923 (4.6) 37,116 28.7 25,119 31.2
Note: Comprehensive Income: For the six months ended September 30, 2017: ¥ 24,737 million: 30.8%
For the six months ended September 30, 2016: ¥ 18,910 million: 14.7%
Net Income per
Share
Net Income per Share
(Fully Diluted) Yen Yen
For the six months ended September 30, 2017 49.65 49.65
For the six months ended September 30, 2016 57.75 57.75
(2) Financial conditions Total Assets Total Net Assets Net Asset Ratio
Millions of yen Millions of yen %
As of September 30, 2017 11,979,281 597,900 5.0 As of March 31, 2017 11,471,845 601,139 5.2
Notes: Net Assets Attributable to Shareholders: As of September 30, 2017: ¥ 596,297 million As of March 31, 2017: ¥ 599,630 million 2. Dividends Dividend per Share
Record date 1st quarter 2nd quarter 3rd quarter Year-end Annual Total Yen Yen Yen Yen Yen
For the year ended March 31, 2017 - 0.00 - 55.00 55.00
For the year ending March 31, 2018 - 0.00
For the year ending March 31, 2018 (forecast)
- 55.00 55.00
Note: Changes in dividend forecast since the most recent public announcement: None

3. Forecast of consolidated financial results for the year ending March 31, 2018 (Percentage figures represent changes from the results of the previous fiscal year.)
Ordinary Revenues Ordinary Profit Profit Attributable to Owners of the Parent
Net Income per Share
Millions of yen % change Millions of yen % change Millions of yen % change Yen
For the year ending March 31, 2018 1,430,000 3.5 67,000 1.0 42,000 0.9 96.56
Note: Changes in forecast of financial results since the most recent public announcement: None
4. Notes (1) Changes in significant subsidiaries during the period (changes in specified subsidiaries accompanying changes in scope of
consolidation): None
(2) Changes in accounting policies, accounting estimates and restatements of the Consolidated Financial Statements (a) Changes in accounting policies resulting from the revision of the accounting standards and other regulations: None (b) Changes in accounting policies due to other reasons: None (c) Changes in accounting estimates: None (d) Restatements of the Consolidated Financial Statements: None
(3) Number of shares outstanding (common stock)
(a) Number of shares outstanding (including treasury shares) As of September 30, 2017: 435,027,513 shares As of March 31, 2017: 435,000,000 shares
(b) Number of treasury shares As of September 30, 2017: 35,775 shares As of March 31, 2017: 52,975 shares
(c) Weighted-average number of shares
For the six months ended September 30, 2017: 434,967,663 shares
For the six months ended September 30, 2016: 434,999,925 shares
Note on interim audit procedures
This document is exempt from interim audit procedures.

Content of Supplemental Materials
Ⅰ. Consolidated Financial Statements
1. Consolidated Balance Sheets …………………………………………………………………………… 2 2. Consolidated Statements of Income and Consolidated Statements of Comprehensive Income
(Consolidated Statements of Income) …………………………………………………………………… 4 (Consolidated Statements of Comprehensive Income) ………………………………………………… 7
3. Consolidated Statements of Changes in Net Assets …………………………………………………… 8 4. Note on going concern…………………………………………………………………………………… 11 5. Material changes in stockholders’ equity……………………………………………………………… 11 6. Changes in significant subsidiaries during the period…….…………………………………………… 11 7. Changes in accounting policies………………………………………………………………………… 11 8. Segment Information …………………………………………………………………………………… 12 9. Subsequent Events ……………………………………………………………………………………… 14
Ⅱ. Attachment
Consolidated Financial Results for the Six Months Ended September 30, 2017 and Sony Life’s Market Consistent Embedded Value as of September 30, 2017 …………………………………………………
16
* The conference call for explaining the Sony Financial Group's financial results will be held at 15:00 (Tokyo), November 13, 2017. Please note that our conference call will be held only in Japanese. We will upload the presentation materials with speech text on November 13, 2017 after 14:00, the translation of the conference call (audio) on November 14 and the Q&A summary (text) at a later date on the Earnings Releases and Presentation Materials page on our website: http://www.sonyfh.co.jp/en/financial_info/results/index.html
* On November 13, 2017, Sony Financial Holdings Inc.’s (SFH’s) significant subsidiaries─Sony Life Insurance Co., Ltd. (Sony Life), Sony Assurance Inc. (Sony Assurance) and Sony Bank Inc. (Sony Bank)─will announce their financial results for the six months ended September 30, 2017. SFH has prepared an English-language summary of those Japanese announcements made by the above subsidiaries, solely for convenience of non-Japanese readers.
- 1 -

Ⅰ. Consolidated Financial Statements 1. Consolidated Balance Sheets
(Millions of yen)
As of March 31, 2017 As of September 30, 2017
Assets
Cash and due from banks ¥ 206,481 ¥ 274,693
Call loans and bills bought 61,900 76,900
Monetary claims purchased 573 7,506
Money held in trust 296,877 292,940
Securities 8,857,436 9,244,711
Loans 1,720,004 1,743,902
Tangible fixed assets 123,614 130,344
Intangible fixed assets 30,776 31,109
Due from agencies 0 -
Due from reinsurers 1,438 832
Foreign exchanges 7,268 10,446
Other assets 148,650 148,745
Net defined benefit asset 2,752 2,863
Deferred tax assets 15,313 15,500
Reserve for possible loan losses (1,243) (1,215)
Total Assets ¥ 11,471,845 ¥ 11,979,281
- 2 -

(Millions of yen)
As of March 31, 2017 As of September 30, 2017
Liabilities
Policy reserves and others ¥ 8,113,153 ¥ 8,438,180
Reserve for outstanding claims 71,306 73,457
Policy reserves 8,036,118 8,358,960
Reserve for policyholders’ dividends 5,729 5,762
Due to agencies 2,616 1,430
Due to reinsurers 3,737 4,364
Deposits 2,071,091 2,121,161
Call money and bills sold 70,000 117,000
Borrowed money 90,000 153,851
Foreign exchanges 108 336
Bonds payable 10,000 10,000
Other liabilities 427,866 451,651
Reserve for employees’ bonuses 3,694 3,430
Net defined benefit liability 31,399 32,326
Reserve for directors’ retirement benefits 366 -
Special reserves 46,182 47,101
Reserve for price fluctuations 46,182 47,101
Deferred tax liabilities - 58 Deferred tax liabilities on land revaluation 488 488
Total Liabilities 10,870,705 11,381,381
Net Assets
Common stock 19,900 19,927
Capital surplus 195,277 191,157
Retained earnings 255,062 252,638
Treasury stock (81) (55)
Total shareholders’ equity 470,157 463,668
Net unrealized gains (losses) on other securities, net of taxes 134,849 137,551
Net deferred gains (losses) on hedging instruments, net of taxes (1,154) (1,027)
Land revaluation, net of taxes (1,465) (1,465)
Remeasurements of defined benefit plans, net of taxes (2,756) (2,430)
Total accumulated other comprehensive income 129,472 132,628
Subscription rights to shares 49 61
Non-controlling interests 1,460 1,541
Total Net Assets 601,139 597,900
Total Liabilities and Net Assets ¥ 11,471,845 ¥ 11,979,281
- 3 -
2. Consolidated Statements of Income and Consolidated Statements of Comprehensive Income (Consolidated Statements of Income)
(Millions of yen)
For the six months ended
September 30, 2016 For the six months ended
September 30, 2017
Ordinary Revenues ¥ 631,923 ¥ 708,324
Ordinary Revenues from the Life Insurance Business 563,030 630,822
Income from insurance premiums 476,763 479,629
Insurance premiums 475,923 478,596
Ceded reinsurance commissions 840 1,033
Investment income 80,226 144,945
Interest income and dividends 72,040 77,991
Income from monetary trusts, net 2,248 2,246
Gains on trading securities, net 56 22
Gains on sale of securities 1,301 0
Gains on redemption of securities - 1
Gains on derivatives, net 4,577 -
Foreign exchange gains, net - 2,078
Other investment income 1 0
Gains on separate accounts, net - 62,604
Other ordinary income 6,039 6,247
Ordinary Revenues from the Non-life Insurance Business 50,270 54,798
Underwriting income 48,967 53,817
Net premiums written 48,933 53,786
Interest and dividends on deposits of premiums 33 30
Investment income 1,277 956
Interest income and dividends 661 667
Gains on sale of securities 649 320
Gains on redemption of securities 0 -
Transfer to interest and dividends on deposits of premiums (33) (30)
Other ordinary income 25 24
Ordinary Revenues from the Banking Business 18,516 19,714
Interest income 12,757 14,005
Interest income on loans 7,785 8,457
Interest income and dividends on securities 4,937 5,510
Interest income on deposits with banks 32 31
Interest income on interest rate swaps 0 -
Others interest income 0 5
Fees and commissions 3,404 3,033
Other operating income 2,225 2,104 Other ordinary income 130 570
Other 105 2,988 Other ordinary income 105 2,988
(Continued)
- 4 -

(Millions of yen)
For the six months ended
September 30, 2016 For the six months ended
September 30, 2017
Ordinary Expenses ¥ 594,807 ¥ 675,654
Ordinary Expenses from the Life Insurance Business 531,994 607,188
Insurance claims and other payments 163,350 187,384
Insurance claims 42,443 45,157
Annuity payments 5,617 5,618
Insurance benefits 27,837 40,400
Surrender payments 83,139 90,159
Other payments 1,607 1,673
Reinsurance premiums 2,705 4,375
Provision for policy reserves and others 244,117 317,735
Provision for reserve for outstanding claims - 1,104
Provision for policy reserves 244,117 316,630
Interest portion of reserve for policyholders’ dividends 0 0
Investment expenses 40,478 18,039
Interest expenses 15 35
Losses on sale of securities - 0
Losses on redemption of securities 23 2
Losses on derivatives, net - 14,739
Foreign exchange losses, net 5,023 -
Provision for reserve for possible loan losses 2 5
Depreciation of real estate for rent and others 896 876
Other investment expenses 2,381 2,380
Losses on separate accounts, net 32,134 -
Operating expenses 69,838 67,941
Other ordinary expenses 14,209 16,086
Ordinary Expenses from the Non-life Insurance Business 46,565 49,843
Underwriting expenses 34,424 36,538
Net losses paid 24,046 24,937
Loss adjustment expenses 3,683 3,672
Net commission and brokerage fees 572 669
Provision for reserve for outstanding losses 1,603 1,046
Provision for underwriting reserves 4,517 6,211
Investment expenses 2 1
Other investment expenses 2 1
Operating, general and administrative expenses 12,136 13,302
Other ordinary expenses 2 1
(Continued)
- 5 -

(Millions of yen)
For the six months ended
September 30, 2016 For the six months ended
September 30, 2017
Ordinary Expenses from the Banking Business ¥ 15,789 ¥ 15,002
Interest expenses 4,277 3,884
Interest expenses on deposits 2,518 2,582
Interest expenses on call money and bills sold - (35)
Interest expenses on borrowed money 16 0
Interest expenses on bonds 48 21
Interest expenses on interest rate swaps 1,693 1,310
Others interest expenses 0 5
Fees and commissions 1,687 2,199
Other operating expenses 78 49
General and administrative expenses 9,602 8,822
Other ordinary expenses 142 47
Other 457 3,620 Other ordinary expenses 457 3,620
Ordinary Profit 37,116 32,669
Extraordinary Losses 911 1,039
Losses on disposal of fixed assets 110 85
Impairment losses 0 0
Provision for special reserves 793 919
Provision for reserve for price fluctuations 793 919
Others 7 34
Provision for Reserve for Policyholders’ Dividends 682 297
Income Before Income Taxes 35,522 31,332
Income Taxes - Current 12,237 11,105
Income Taxes - Deferred (1,869) (1,353)
Total Income Taxes 10,368 9,752
Profit 25,153 21,579
Profit (Loss) Attributable to Non-controlling Interests 33 (16) Profit Attributable to Owners of the Parent ¥ 25,119 ¥ 21,596
- 6 -
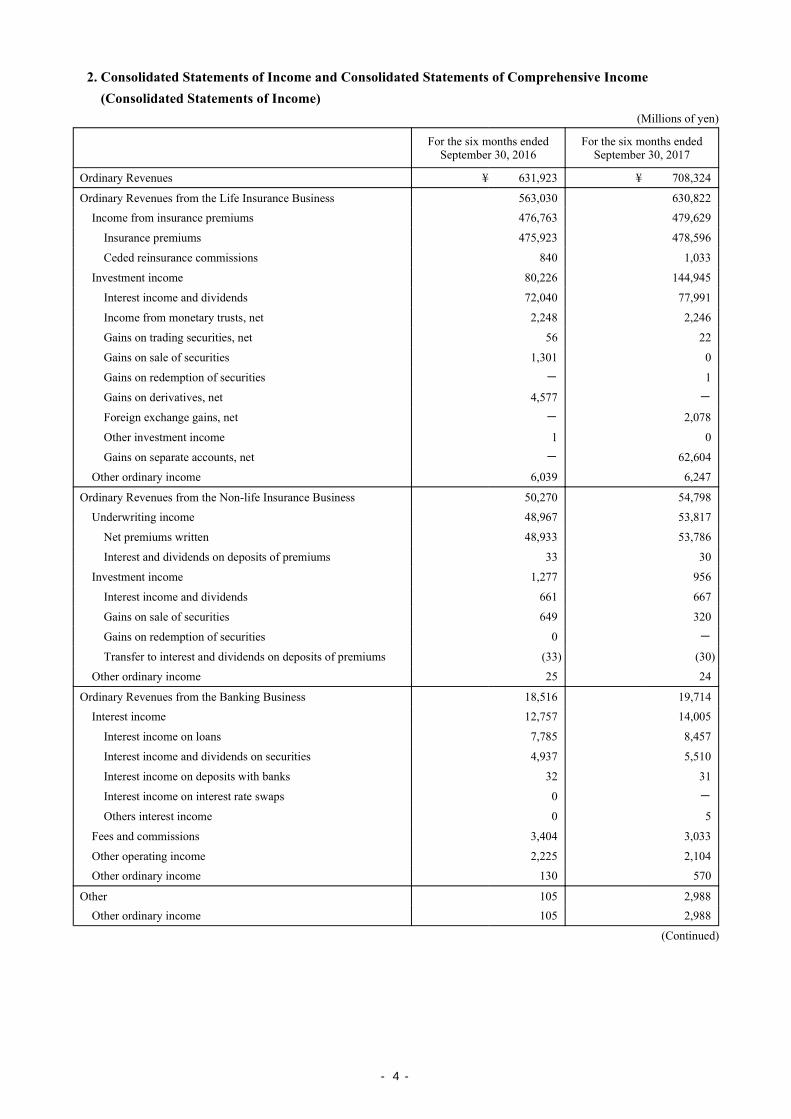
(Consolidated Statements of Comprehensive Income) (Millions of yen)
For the six months ended
September 30, 2016 For the six months ended
September 30, 2017
Profit ¥ 25,153 ¥ 21,579
Other comprehensive income
Net unrealized gains (losses) on other securities, net of taxes (6,658) 2,702
Net deferred gains (losses) on hedging instruments, net of taxes 33 127
Remeasurements of defined benefit plans, net of taxes 381 327
Total other comprehensive income (6,243) 3,157
Comprehensive income ¥ 18,910 ¥ 24,737
(Details)
Comprehensive income attributable to owners of the parent 18,874 24,752
Comprehensive income attributable to non-controlling interests 35 (15)
- 7 -

3. Consolidated Statements of Changes in Net Assets For the six months ended September 30, 2016
(Millions of yen) Shareholders’ Equity
Common stock Capital surplus Retained earnings Treasury stock Total shareholders’ equity
Balance at the beginning of the period ¥ 19,900 ¥ 195,277 ¥ 238,079 ¥ (0) ¥ 453,256
Cumulative effects of changes in accounting policies
- - 105 - 105
Restated balance at the beginning of the period 19,900 195,277 238,185 (0) 453,362
Changes during the period
Dividends from surplus - - (23,924) - (23,924)
Profit attributable to owners of the parent - - 25,119 - 25,119
Adjustments due to change of scope of consolidation
- - (818) - (818)
Net changes of items other than shareholders’ equity
- - - - -
Total changes during the period - - 376 - 376
Balance at the end of the period ¥ 19,900 ¥ 195,277 ¥ 238,561 ¥ (0) ¥ 453,738
Total accumulated other comprehensive income
Subscription rights to shares
Non-controlling interests Total net assets
Net unrealized gains (losses) on other securities,
net of taxes
Net deferred gains (losses) on
hedging instruments, net of taxes
Land revaluation, net of taxes
Remeasurements of defined benefit plans, net of taxes
Total accumulated other
comprehensive income
Balance at the beginning of the period ¥ 157,364 ¥ (2,347) ¥ (1,465) ¥ (3,760) ¥ 149,791 ¥ - ¥ 1,329 ¥ 604,377
Cumulative effects of changes in accounting policies
- - - - - - - 105
Restated balance at the beginning of the period 157,364 (2,347) (1,465) (3,760) 149,791 - 1,329 604,482
Changes during the period
Dividends from surplus - - - - - - - (23,924)
Profit attributable to owners of the parent - - - - - - - 25,119
Adjustments due to change of scope of consolidation
- - - - - - - (818)
Net changes of items other than shareholders’ equity
(6,658) 33 - 379 (6,245) 16 35 (6,193)
Total changes during the period (6,658) 33 - 379 (6,245) 16 35 (5,817)
Balance at the end of the period ¥ 150,706 ¥ (2,314) ¥ (1,465) ¥ (3,380) ¥ 143,546 ¥ 16 ¥ 1,364 ¥ 598,665
- 8 -

For the six months ended September 30, 2017 (Millions of yen)
Shareholders’ Equity
Common stock Capital surplus Retained earnings Treasury stock Total shareholders’ equity
Balance at the beginning of the period ¥ 19,900 ¥ 195,277 ¥ 255,062 ¥ (81) ¥ 470,157
Changes during the period
Issuance of new shares 27 27 - - 55
Dividends from surplus - - (23,922) - (23,922)
Profit attributable to owners of the parent - - 21,596 - 21,596
Disposal of treasury shares - (5) - 26 21
Transfer of loss on disposal of treasury shares
- 5 (5) - -
Adjustments due to change of scope of consolidation
- - (92) - (92)
Change in ownership interest of parent due to transactions with non-controlling interests
- (4,147) - - (4,147)
Net changes of items other than shareholders’ equity
- - - - -
Total changes during the period 27 (4,119) (2,423) 26 (6,488)
Balance at the end of the period ¥ 19,927 ¥ 191,157 ¥ 252,638 ¥ (55) ¥ 463,668
(Continued)
- 9 -

Total accumulated other comprehensive income
Subscription rights to shares
Non-controlling interests Total net assets
Net unrealized gains (losses) on other securities,
net of taxes
Net deferred gains (losses) on
hedging instruments, net of taxes
Land revaluation, net of taxes
Remeasurements of defined benefit plans, net of taxes
Total accumulated other
comprehensive income
Balance at the beginning of the period ¥ 134,849 ¥ (1,154) ¥ (1,465) ¥ (2,756) ¥ 129,472 ¥ 49 ¥ 1,460 ¥ 601,139
Changes during the period
Issuance of new shares - - - - - - - 55
Dividends from surplus - - - - - - - (23,922)
Profit attributable to owners of the parent - - - - - - - 21,596
Disposal of treasury shares - - - - - - - 21
Transfer of loss on disposal of treasury shares
- - - - - - - -
Adjustments due to change of scope of consolidation
- - - - - - - (92)
Change in ownership interest of parent due to transactions with non-controlling interests
- - - - - - - (4,147)
Net changes of items other than shareholders’ equity
2,702 127 - 325 3,156 12 80 3,249
Total changes during the period 2,702 127 - 325 3,156 12 80 (3,238)
Balance at the end of the period ¥ 137,551 ¥ (1,027) ¥ (1,465) ¥ (2,430) ¥ 132,628 ¥ 61 ¥ 1,541 ¥ 597,900
- 10 -

4. Note on going concern Not applicable.
5. Material changes in stockholders’ equity Not applicable.
6. Changes in significant subsidiaries during the period Not applicable. Although not a specified subsidiary, nursing-care provider Proud Life Inc., which was a non-consolidated subsidiary in the previous consolidated fiscal year, has been included in the scope of consolidation, due to a rise in its importance from the first half of the fiscal year ending March 31, 2018. The company’s results are included in the “other” category in the consolidated statements of income.
7. Changes in accounting policies Not applicable.
- 11 -

8. Segment Information (1) Outline of reporting segments
The Sony Financial Group consists of three reporting segments: the life insurance business, the non-life insurance business and the banking business.
●The life insurance business consists of Sony Life Insurance Co., Ltd., AEGON Sony Life Insurance Co., Ltd., and SA Reinsurance Ltd.
●The non-life insurance business consists of Sony Assurance Inc. ●The banking business consists of Sony Bank Inc., Sony Payment Services Inc. and SmartLink Network Hong Kong
Limited.
(2) Segment Information by reporting segment For the six months ended September 30, 2016
Millions of yen
Life insurance
business Non-life insurance business
Banking business Total other Total
Ordinary revenues
External customers ¥ 563,030 ¥ 50,270 ¥ 18,516 ¥ 631,817 ¥ 105 ¥ 631,923 Intersegment 1,508 0 97 1,606 - 1,606 Total 564,538 50,270 18,614 633,424 105 633,530
Segment profit 32,235 3,372 1,788 37,396 (366) 37,030 Segment assets 8,362,193 177,920 2,202,085 10,742,199 3,768 10,745,967 Others
Depreciation 3,617 1,539 1,292 6,449 20 6,469 Interest income and dividends 72,299 661 12,756 85,717 0 85,717 Interest expenses 15 - 4,345 4,361 18 4,380 Equity in earnings (losses) of affiliates
(1,099) - - (1,099) - (1,099)
Investments in affiliates 11,114 - - 11,114 - 11,114 Increase in tangible fixed assets and intangible fixed assets
¥ 5,351 ¥ 2,707 ¥ 1,383 ¥ 9,442 ¥ 10 ¥ 9,453
For the six months ended September 30, 2017 Millions of yen
Life insurance
business Non-life insurance business
Banking business Total other Total
Ordinary revenues
External customers ¥ 630,822 ¥ 54,798 ¥ 19,714 ¥ 705,335 ¥ 2,988 ¥ 708,324 Intersegment 1,609 0 104 1,715 - 1,715 Total 632,432 54,798 19,819 707,050 2,988 710,039
Segment profit 24,925 4,587 3,712 33,225 (631) 32,593 Segment assets 9,207,448 194,312 2,592,552 11,994,313 14,370 12,008,683 Others
Depreciation 3,567 2,033 1,236 6,838 307 7,146 Interest income and dividends 78,249 667 14,005 92,921 0 92,921 Interest expenses 35 - 3,923 3,958 275 4,233 Equity in earnings (losses) of affiliates
(1,221) - - (1,221) - (1,221)
Investments in affiliates 9,838 - - 9,838 - 9,838
Increase in tangible fixed assets and intangible fixed assets
¥ 2,737 ¥ 1,067 ¥ 1,843 ¥ 5,647 ¥ 77 ¥ 5,725
- 12 -

(3) Reconciliations of the totals of each segment item to corresponding enterprise amounts
Millions of yen
For the six months ended
September 30, 2016 For the six months ended
September 30, 2017
Totals of reporting segments ¥ 633,424 ¥ 707,050 Other 105 2,988 Adjustments for intersegment transactions (1,606) (1,715)
Ordinary revenues in statement of income ¥ 631,923 ¥ 708,324
Millions of yen
For the six months ended
September 30, 2016 For the six months ended
September 30, 2017
Totals of reporting segments ¥ 37,396 ¥ 33,225 Other (366) (631) Adjustments for intersegment transactions 4 1 Amount not allocated to reporting segments 81 74
Ordinary profit in statement of income ¥ 37,116 ¥ 32,669
Millions of yen
For the six months ended
September 30, 2016 For the six months ended
September 30, 2017
Totals of reporting segments ¥ 10,742,199 ¥ 11,994,313 Other 3,768 14,370 Adjustments for intersegment transactions (31,284) (56,437) Amount not allocated to reporting segments 29,982 27,035
Assets in balance sheets ¥ 10,744,665 ¥ 11,979,281
Millions of yen
For the six months ended
September 30, 2016 For the six months ended
September 30, 2017
Total Other Adjustments Consolidated
financial statements
Total Other Adjustments Consolidated
financial statements
Depreciation ¥ 6,449 ¥ 20 ¥ 9 ¥ 6,478 ¥ 6,838 ¥ 307 ¥ 18 ¥ 7,164 Interest income and dividends
85,717 0 (257) 85,459 92,921 0 (257) 92,663
Interest expenses 4,361 18 (68) 4,312 3,958 275 (38) 4,194 Equity in earnings (losses) of affiliates
(1,099) - - (1,099) (1,221) - - (1,221)
Investments in affiliates 11,114 - - 11,114 9,838 - - 9,838 Increase in tangible fixed assets and intangible fixed assets
¥ 9,442 ¥ 10 ¥ 267 ¥ 9,721 ¥ 5,647 ¥ 77 ¥ 1 ¥ 5,727
- 13 -
9. Subsequent Events Issuance of Straight Bonds October 31, 2017—The Board of Directors' passed a comprehensive resolution to issue straight bonds as follows.
Type Unsecured straight bonds
Total amount of issue 10 billion yen
Issuance period November 1, 2017 – March 31, 2018
Issue price 100 yen or more per each 100 yen of face value
Interest rate 0.5% or less per annum
Redemption date and method
No later than 5 years, lump-sum repayment at maturity
Use of funds Sony Financial Holdings will use the funds for the redemption of the No. 2 Straight Bonds
Others
Decisions on the specific timing of issuance, total amount of issue, interest rate and other matters provided for in the items of Article 676 of the Companies Act and all other matters required in connection with the said straight bond issuance shall be entrusted to the President, Representative Director of the Company within the scope of the resolution.
- 14 -

SFH’s consolidated results* are prepared in accordance with Japanese GAAP. As such, these figures differ in significant respects from the financial information reported by Sony Corporation, SFH’s parent company, which prepares its financial statements in accordance with U.S. GAAP.
* SFH’s scope of consolidation includes following companies Consolidated subsidiaries:
Sony Financial Holdings Inc. Sony Life Insurance Co. Ltd. Sony Assurance Inc. Sony Bank Inc. Sony Payment Services Inc. SmartLink Network Hong Kong Limited. Sony Lifecare Inc. Lifecare Design Inc. Proud Life Inc.**
Affiliated companies accounted for under the equity method: AEGON Sony Life Insurance Co., Ltd. SA Reinsurance Ltd.
** Proud Life Inc. is included in the scope of consolidation from the first half of the fiscal year ending March 31, 2018.
Statements made in this press release concerning the current plans, expectations, strategies and beliefs of the Sony Financial Group. Any statements contained herein that are not historical facts are forward-looking statements or pro forma information. Forward-looking statements may include-but are not limited to-words such as “believe,” “anticipate,” “plan,” “strategy,” “expect,” “assume,” “forecast,” “predict,” “propose,” “intend” and “possibility” that describe future operating activities, business performance, events or conditions. Forward-looking statements, whether spoken or written, may also be included in other materials released to the public. These forward-looking statements and pro forma information are based on assumptions, decisions and judgments made by the management of Sony Financial Group companies, and are based on information that is currently available to them. As such, they are subject to various risks and uncertainties, and actual business results may vary substantially from the forecasts expressed or implied in forward-looking statements. Consequently, investors are cautioned not to place undue reliance on forward-looking statements. Sony Financial Group companies are under no obligation to revise forward-looking statements or pro forma information in light of new information, future events or other findings. The information contained in this press release does not constitute or form part of any offer for sale or subscription of or solicitation or invitation of any offer to buy or subscribe to any securities, nor shall it or any part of it form the basis of or be relied on in connection with any contract or commitment whatsoever in Japan or abroad.
────────────────────────────────────────────────────────────────────────
For inquiries: Investor Relations Dept. Sony Financial Holdings Inc. Telephone: +81-3-5290-6500 E-mail: [email protected]
Website of Sony Financial Holdings Inc. http://www.sonyfh.co.jp/index_en.html
- 15 -
Ⅱ. Attachment
Content of Presentation Material
Consolidated Financial Results for the Six Months Ended September 30, 2017 andSony Life’s Market Consistent Embedded Value as of September 30, 2017
・ Consolidated Operating Results for the Six Months Ended September 30, 2017 ………………………… 3・ Consolidated Financial Forecast for the Year Ending March 31, 2018 …………………………………… 27・ Sony Life’s MCEV and ESR as of September 30, 2017…………………………………………………… 29・ Appendix …………………………………………………………………………………………………… 32
- 16 -

Sony Financial Holdings Inc. All Rights Reserved
Sony Financial Holdings Inc.November 13, 2017
Presentation Material
Consolidated Financial Results for the Six Months Ended September 30, 2017
and Sony Lifeʼs MCEV as of September 30, 2017
Sony Financial Holdings Inc. All Rights Reserved 2
Disclaimers:This presentation material contains statements concerning the current plans, expectations, strategies and beliefs of the SonyFinancial Group. Any statements contained herein that are not historical facts are forward-looking statements or pro forma information. Forward-looking statements may include̶but are not limited to̶words such as “believe,” “anticipate,” “plan,” “strategy,” “expect,” “assume,” “forecast,” “predict,” “propose,” “intend” and “possibility” that describe future operating activities, business performance, events or conditions. Forward-looking statements, whether spoken or written, may also be included in othermaterials released to the public. These forward-looking statements and pro forma information are based on assumptions, decisionsand judgments made by the management of Sony Financial Group companies, and are based on information that is currently available to them. As such, they are subject to various risks and uncertainties, and actual business results may vary substantially from the forecasts expressed or implied in forward-looking statements. Consequently, investors are cautioned not to place undue reliance on forward-looking statements. Sony Financial Group companies are under no obligation to revise forward-looking statements or pro forma information in light of new information, future events or other findings. The information contained in this presentation does not constitute or form part of any offer for sale or subscription of or solicitation or invitation of any offer to buy or subscribe to any securities, nor shall it or any part of it form the basis of or be relied on in connection with any contract orcommitment whatsoever in Japan or abroad.
*Unless otherwise indicated, in these materials figures less than the indicated unit have been truncated, while ratios and percentage changes have been rounded.Also, a “–” is used where percentage changes exceed 1,000% and in cases where one or both comparisons are negative.
* “Lifeplanner” is a registered trademark of Sony Life.
Content
Consolidated Operating Results for the Six Months Ended September 30, 2017 P.3
Forecast of Consolidated Financial Results for the Fiscal Year EndingMarch 31, 2018 (FY17)
P.27
Sony Lifeʼs MCEV and ESR as of September 30, 2017 P.29
Appendix P.32
Attachment
Sony Financial Holdings Inc. All Rights Reserved 3
Consolidated Operating Results for the Six Months Ended September 30, 2017
(FY17.1H)
Sony Financial Holdings Inc. All Rights Reserved
FY16.1H FY17.1H
4
(12.0%)
708.3
32.637.1
631.9+12.1%
Highlights of Consolidated Operating Performance (1)
Consolidated ordinary revenues
Consolidated ordinary profit
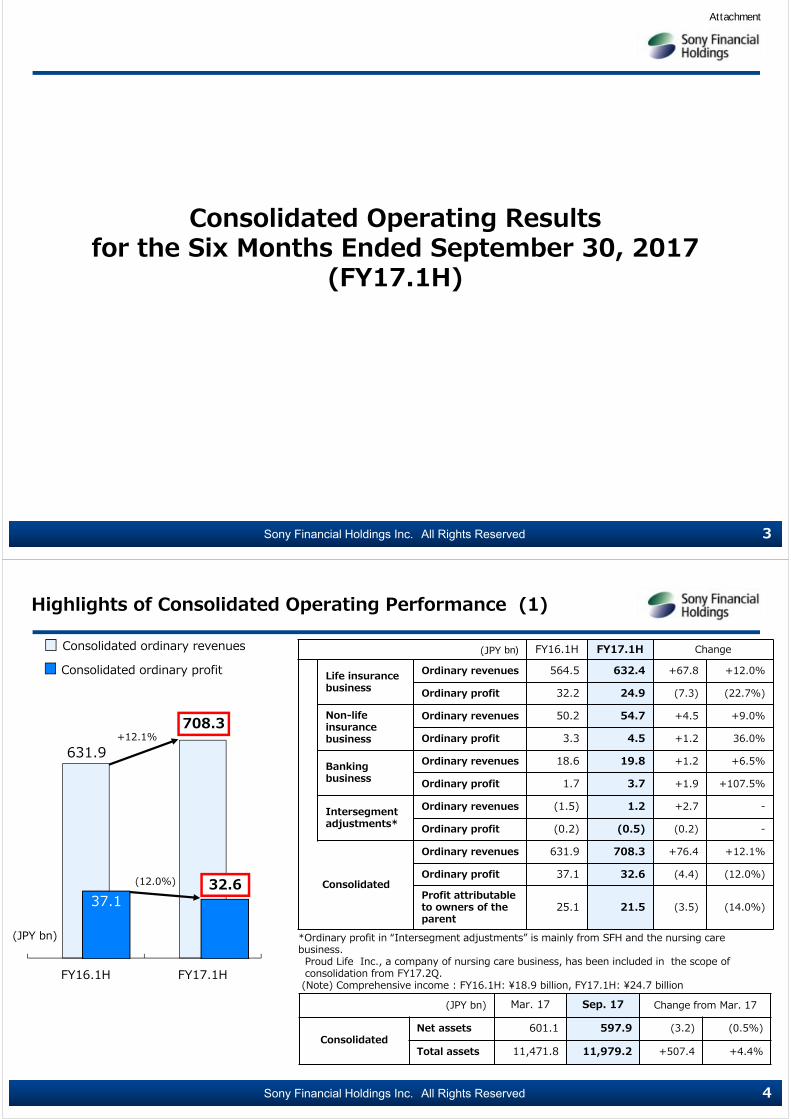
(JPY bn) *Ordinary profit in “Intersegment adjustments” is mainly from SFH and the nursing care business. Proud Life Inc., a company of nursing care business, has been included in the scope of consolidation from FY17.2Q.(Note) Comprehensive income : FY16.1H: ¥18.9 billion, FY17.1H: ¥24.7 billion
(JPY bn) FY16.1H FY17.1H Change
Life insurancebusiness
Ordinary revenues 564.5 632.4 +67.8 +12.0%
Ordinary profit 32.2 24.9 (7.3) (22.7%)
Non-lifeinsurance business
Ordinary revenues 50.2 54.7 +4.5 +9.0%
Ordinary profit 3.3 4.5 +1.2 36.0%
Banking business
Ordinary revenues 18.6 19.8 +1.2 +6.5%
Ordinary profit 1.7 3.7 +1.9 +107.5%
Intersegment adjustments*
Ordinary revenues (1.5) 1.2 +2.7 -
Ordinary profit (0.2) (0.5) (0.2) -
Consolidated
Ordinary revenues 631.9 708.3 +76.4 +12.1%
Ordinary profit 37.1 32.6 (4.4) (12.0%)
Profit attributableto owners of theparent
25.1 21.5 (3.5) (14.0%)
(JPY bn) Mar. 17 Sep. 17 Change from Mar. 17
ConsolidatedNet assets 601.1 597.9 (3.2) (0.5%)
Total assets 11,471.8 11,979.2 +507.4 +4.4%
Attachment
Sony Financial Holdings Inc. All Rights Reserved 5
Life Insurance Business︓Ordinary revenues increased year on year due to an improvement of investment performance in the separate account following a recovery in the financial market conditions. Investment gains were recorded in this first half compared with investment losses in the same period of the previous year. Ordinary profit decreased year on year due to a deterioration in net gains/losses on derivative transactions to hedge market risks for available-for-sale securities and lower gains on sale of securities in the general account.
Non-life Insurance Business: Ordinary revenues expanded year on year owing to an increase in net premiums written for mainstay automobile insurance. Ordinary profit increased year on year due to a decline in the loss ratio, driven primarily by a lower car accident ratio.
Banking Business︓Ordinary revenues increased year on year due to an increase in interest income on loans in line with a favorably growing balance of mortgage loans, and an increase in interest income on securities. Ordinary profit increased year on year, due to a decrease in operating expenses, especially in advertising expenses for the card loan business.
Consolidated ordinary revenues increased 12.1% year on year, to ¥708.3 billion, owing to increases in ordinary revenues from all the businesses: life insurance, non-life insurance, and banking businesses. Consolidated ordinary profit decreased 12.0%, to ¥32.6 billion. By business segment, ordinary profit from the life insurance business decreased whereas ordinary profit from the non-life insurance and the banking businesses increased. Profit attributable to owners of the parent was down 14.0% year on year, to ¥21.5 billion due to the decrease in consolidated ordinary profit.
Highlights of Consolidated Operating Performance (2)
Sony Financial Holdings Inc. All Rights Reserved 6
FY16.1H FY17.1H
+12.0%
(21.5%)
632.3
26.0
564.4
33.2
Highlights of Operating Performance: Sony Life (Non-consolidated)
(JPY bn) Mar. 17 Sep. 17 Change from Mar. 17
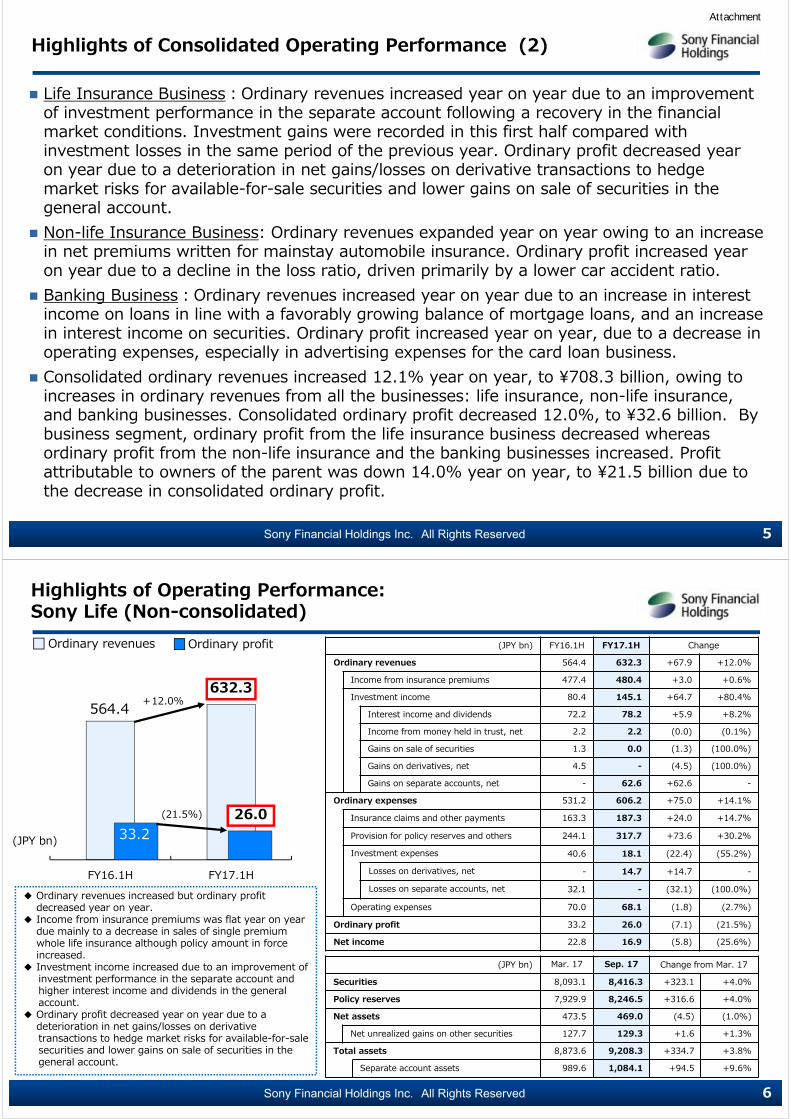
Securities 8,093.1 8,416.3 +323.1 +4.0%
Policy reserves 7,929.9 8,246.5 +316.6 +4.0%
Net assets 473.5 469.0 (4.5) (1.0%)
Net unrealized gains on other securities 127.7 129.3 +1.6 +1.3%
Total assets 8,873.6 9,208.3 +334.7 +3.8%
Separate account assets 989.6 1,084.1 +94.5 +9.6%
(JPY bn) FY16.1H FY17.1H Change
Ordinary revenues 564.4 632.3 +67.9 +12.0%
Income from insurance premiums 477.4 480.4 +3.0 +0.6%
Investment income 80.4 145.1 +64.7 +80.4%
Interest income and dividends 72.2 78.2 +5.9 +8.2%
Income from money held in trust, net 2.2 2.2 (0.0) (0.1%)
Gains on sale of securities 1.3 0.0 (1.3) (100.0%)
Gains on derivatives, net 4.5 - (4.5) (100.0%)
Gains on separate accounts, net - 62.6 +62.6 -
Ordinary expenses 531.2 606.2 +75.0 +14.1%
Insurance claims and other payments 163.3 187.3 +24.0 +14.7%
Provision for policy reserves and others 244.1 317.7 +73.6 +30.2%
Investment expenses 40.6 18.1 (22.4) (55.2%)
Losses on derivatives, net - 14.7 +14.7 -
Losses on separate accounts, net 32.1 - (32.1) (100.0%)
Operating expenses 70.0 68.1 (1.8) (2.7%)
Ordinary profit 33.2 26.0 (7.1) (21.5%)
Net income 22.8 16.9 (5.8) (25.6%)
Ordinary revenues Ordinary profit
◆ Ordinary revenues increased but ordinary profitdecreased year on year.
◆ Income from insurance premiums was flat year on yeardue mainly to a decrease in sales of single premiumwhole life insurance although policy amount in forceincreased.
◆ Investment income increased due to an improvement of investment performance in the separate account and higher interest income and dividends in the general account.
◆ Ordinary profit decreased year on year due to adeterioration in net gains/losses on derivative transactions to hedge market risks for available-for-sale securities and lower gains on sale of securities in the general account.
(JPY bn)
Attachment

Sony Financial Holdings Inc. All Rights Reserved 7
◆ Increased significantly duemainly to a decline in the provision of policy reserves for minimum guarantees for variable life insurance led by a recovery in the financial market conditions.
◆ Decreased due mainly to lower sales of term life insurance and family income insurance despite favorable sales of U.S. dollar-denominated insurance.
◆ Decreased due mainly to lower sales of term life insurance and living benefit insurance despite favorable sales of U.S. dollar-denominated insurance.
Mar. 17 Sep. 17Change
fromMar. 17
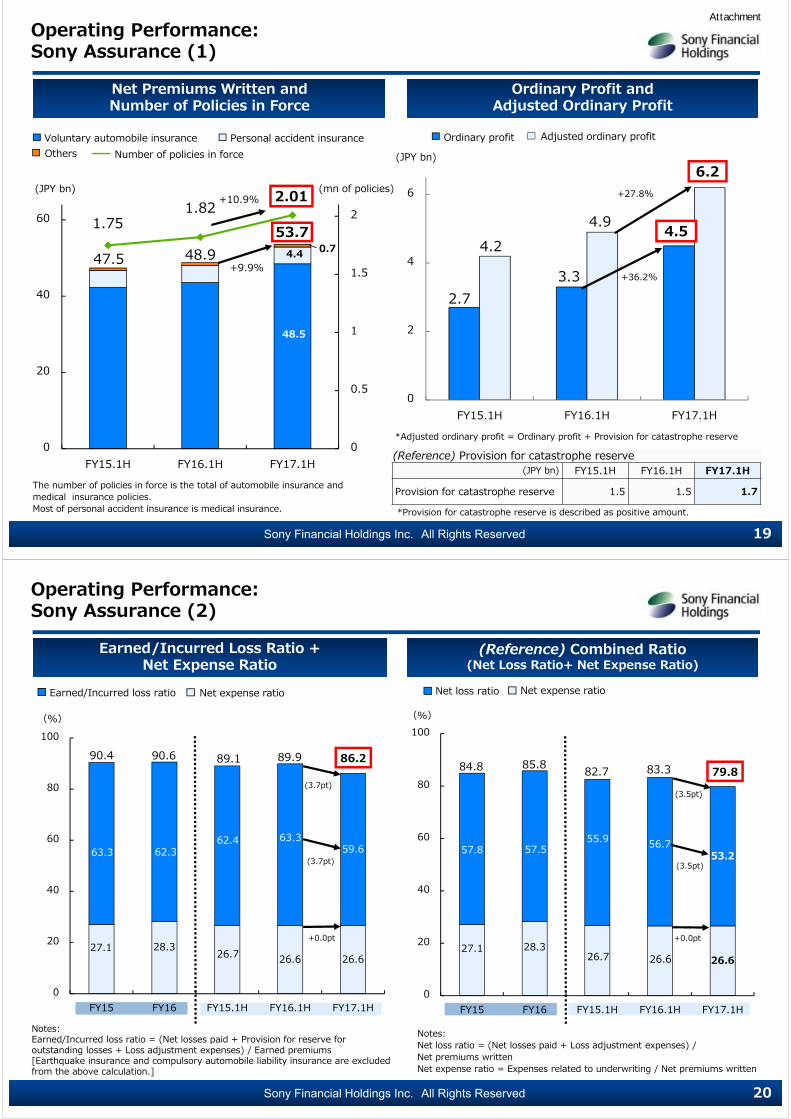
Non-consolidated solvency margin ratio 2,568.8% 2,631.8% +63.0pt
(JPY bn) FY16.1H FY17.1H Change
New policy amount 2,449.0 2,230.7 (8.9%)
Lapse and surrender amount 922.5 873.4 (5.3%)
Lapse and surrender rate 2.14% 1.93% (0.21pt)
Policy amount in force 44,114.4 46,219.1 +4.8%
Annualized premiums from new policies 38.7 32.3 (16.4%)
Of which, third-sector products 8.1 5.9 (26.0%)
Annualized premiums from insurance in force 799.6 833.5 +4.2%
Of which, third-sector products 184.0 189.6 +3.0%
(JPY bn) FY16.1H FY17.1H Change
Gains from investment, net (General account) 72.0 64.4 (10.5%)
Core profit 30.6 43.8 +43.1%
Positive spread 6.5 9.3 +43.1%
Notes:1. Figures for new policy amount, lapse and surrender amount, lapse and surrender rate, policy amount in force,
annualized premiums from new policies and annualized premiums from insurance in force are calculated as the total of individual life insurance and individual annuities.
2. The lapse and surrender rate shows the ratio derived by dividing the amount of lapses and surrenders, not adjusted for policy amount decreases, increases, and reinstatements, by the policy amount in force at the beginning of the fiscal year.
Overview of Operating Performance: Sony Life (Non-consolidated)
<Reasons for changes>
Sony Financial Holdings Inc. All Rights Reserved
0
100
200
300
0
1
2
3
FY15.1H FY16.1H FY17.1H0
10
20
30
40
FY15.1H FY16.1H FY17.1H
8
2.44
(14.4%)
2.23(8.9%)
2.61240
327
280
7.3
32.3(16.4%)
43.0
(26.0%)
8.1
38.7
5.9
Operating Performance :Sony Life (Non-consolidated) (1)
Number and Amount of New Policies(Individual Life Insurance + Individual Annuities)
New policy amount Number of new policies
Annualized Premiums from New Policies (Individual Life Insurance + Individual Annuities)
Annualized premiums from new policies
(Thousands of policies)(JPY tn) (JPY bn)
Of which, third-sector
Attachment

Sony Financial Holdings Inc. All Rights Reserved
0
200
400
600
800
Sep. 16 Mar. 17 Sep. 17
820.8
0
2
4
6
8
0
10
20
30
40
50
Sep. 16 Mar. 17 Sep. 17
9
833.5
+2.0%
7.42
46.2
+1.1%
+1.5%
+4.8%
+3.0% +4.2%
+3.0%
+1.5%7.20
799.6
184.0 189.6
45.344.1
187.4
7.30
Operating Performance :Sony Life (Non-consolidated) (2)
Number and Amount of Policies in Force(Individual Life Insurance + Individual Annuities)
Annualized Premiums from Insurance in Force(Individual Life Insurance + Individual Annuities)
Policy amount in force Number of policies in force Annualized premiums from insurance in force Of which, third-sector
(JPY tn)
(Millions of policies) (JPY bn)
Sony Financial Holdings Inc. All Rights Reserved
0
2
4
6
8
10
FY15 FY16 FY17
(0.21pt)
1.93
4.72
2.33
4.27
2.14
10
(%)
Lapse and surrender rate(Annual)
Lapse and surrender rate(1H)
Operating Performance :Sony Life (Non-consolidated) (3)
Lapse and Surrender Rate* (Individual Life Insurance + Individual Annuities)
*The lapse and surrender rate shows the ratio derived by dividing the amount of lapses and surrenders, not adjusted for policy amount decreases, increases, and reinstatements, by the policy amount in force at the beginning of the fiscal year.
Attachment

Sony Financial Holdings Inc. All Rights Reserved
0
100
200
300
400
500
FY15.1H FY16.1H FY17.1H
11
0
20
40
60
80
FY15.1H FY16.1H FY17.1H
78.2
+8.2%69.8 72.2
480.4
+0.6%
508.7477.4
Operating Performance :Sony Life (Non-consolidated) (4)
Income from Insurance Premiums Interest Income and Dividends
(JPY bn)(JPY bn)
Sony Financial Holdings Inc. All Rights Reserved
0
10
20
30
40
FY15.1H FY16.1H FY17.1H
43.8
14.4
30.6
+43.1%
12
0
10
20
30
40
FY15.1H FY16.1H FY17.1H
26.0(21.5%)
22.8
33.2
Operating Performance :Sony Life (Non-consolidated) (5)
Core Profit Ordinary Profit
(JPY bn)(JPY bn)
(Reference) Impact on core profit(JPY bn) FY15.1H FY16.1H FY17.1H
Positive spread 7.3 6.5 9.3Provision of policy reserves for minimum guarantees for variable life insurance (*) (22.1) (11.6) (4.0)
Others 29.2 35.7 38.6
(Reference) Main differences from core profit(JPY bn) FY15.1H FY16.1H FY17.1H
Capital gains (losses) excluding gains or losses on hedges (*) 10.3 5.0 (5.6)
Gains (losses) on hedges of variable life insurance 1.4 1.0 (8.5)Provision of contingency reserve (*) (3.1) (3.4) (3.6)
*“Provision of policy reserves for minimum guarantees for variable life insurance” and “Provision of contingency reserve” are described as negative amount. Capital gains (losses) exclude gains or losses on hedges of variable life insurance.
Attachment
Sony Financial Holdings Inc. All Rights Reserved
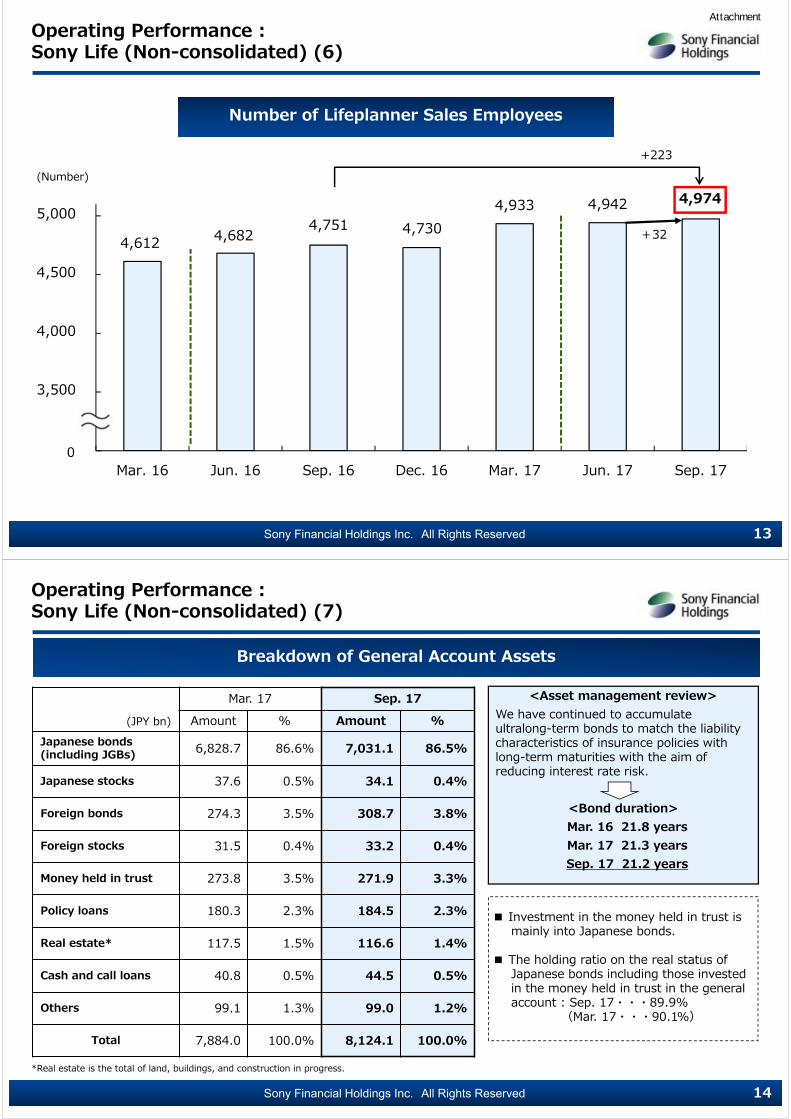
4,612 4,6824,751 4,730
4,933 4,942
3,000
3,500
4,000
4,500
5,000
Mar. 16 Jun. 16 Sep. 16 Dec. 16 Mar. 17 Jun. 17 Sep. 17
13
+32
+223
4,974
0
Operating Performance :Sony Life (Non-consolidated) (6)
(Number)
Number of Lifeplanner Sales Employees
Sony Financial Holdings Inc. All Rights Reserved 14
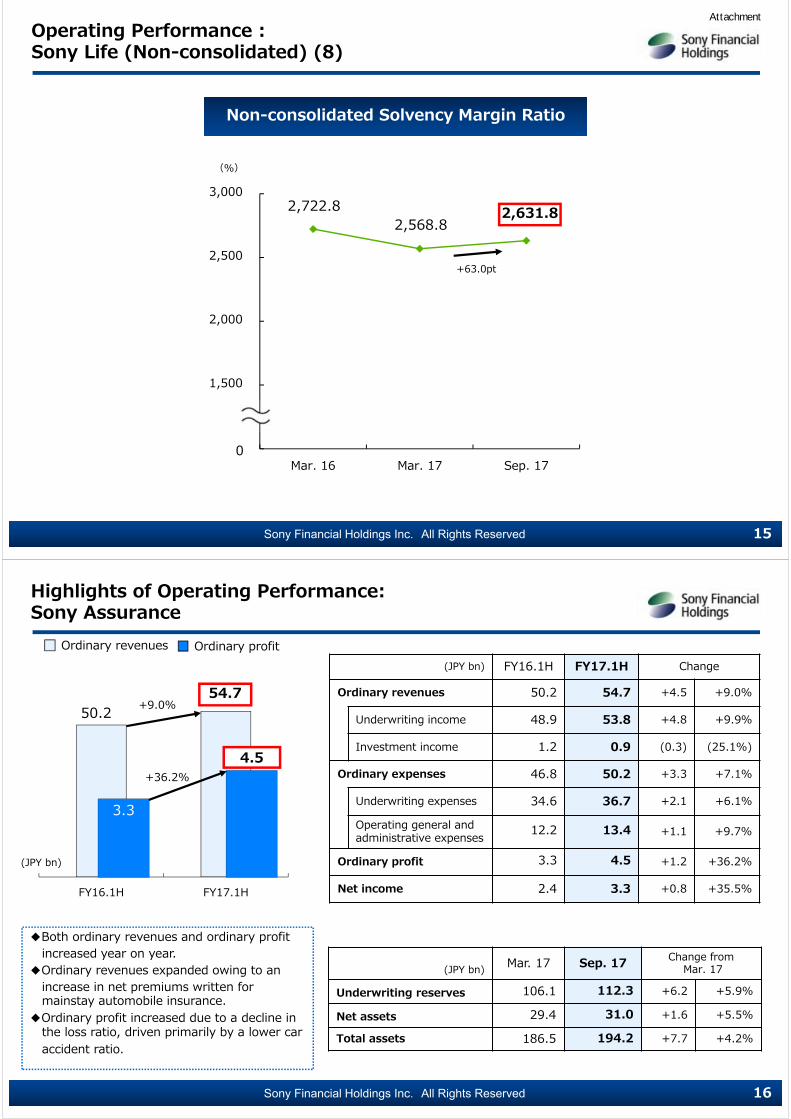
Operating Performance :Sony Life (Non-consolidated) (7)
(JPY bn)
Mar. 17 Sep. 17Amount % Amount %
Japanese bonds(including JGBs) 6,828.7 86.6% 7,031.1 86.5%
Japanese stocks 37.6 0.5% 34.1 0.4%
Foreign bonds 274.3 3.5% 308.7 3.8%
Foreign stocks 31.5 0.4% 33.2 0.4%
Money held in trust 273.8 3.5% 271.9 3.3%
Policy loans 180.3 2.3% 184.5 2.3%
Real estate* 117.5 1.5% 116.6 1.4%
Cash and call loans 40.8 0.5% 44.5 0.5%
Others 99.1 1.3% 99.0 1.2%
Total 7,884.0 100.0% 8,124.1 100.0%
Breakdown of General Account Assets
<Asset management review>We have continued to accumulate ultralong-term bonds to match the liability characteristics of insurance policies with long-term maturities with the aim of reducing interest rate risk.
<Bond duration>Mar. 16 21.8 yearsMar. 17 21.3 yearsSep. 17 21.2 years
■ Investment in the money held in trust ismainly into Japanese bonds.
■ The holding ratio on the real status ofJapanese bonds including those invested in the money held in trust in the general account : Sep. 17・・・89.9%
(Mar. 17・・・90.1%)
*Real estate is the total of land, buildings, and construction in progress.
Attachment
Sony Financial Holdings Inc. All Rights Reserved
1,000
1,500
2,000
2,500
3,000
Mar. 16 Mar. 17 Sep. 17
2,631.8
+63.0pt
(%)
2,568.8
15
2,722.8
0
Operating Performance :Sony Life (Non-consolidated) (8)
Non-consolidated Solvency Margin Ratio
Sony Financial Holdings Inc. All Rights Reserved
FY16.1H FY17.1H
16
+9.0%50.254.7
4.5+36.2%
3.3
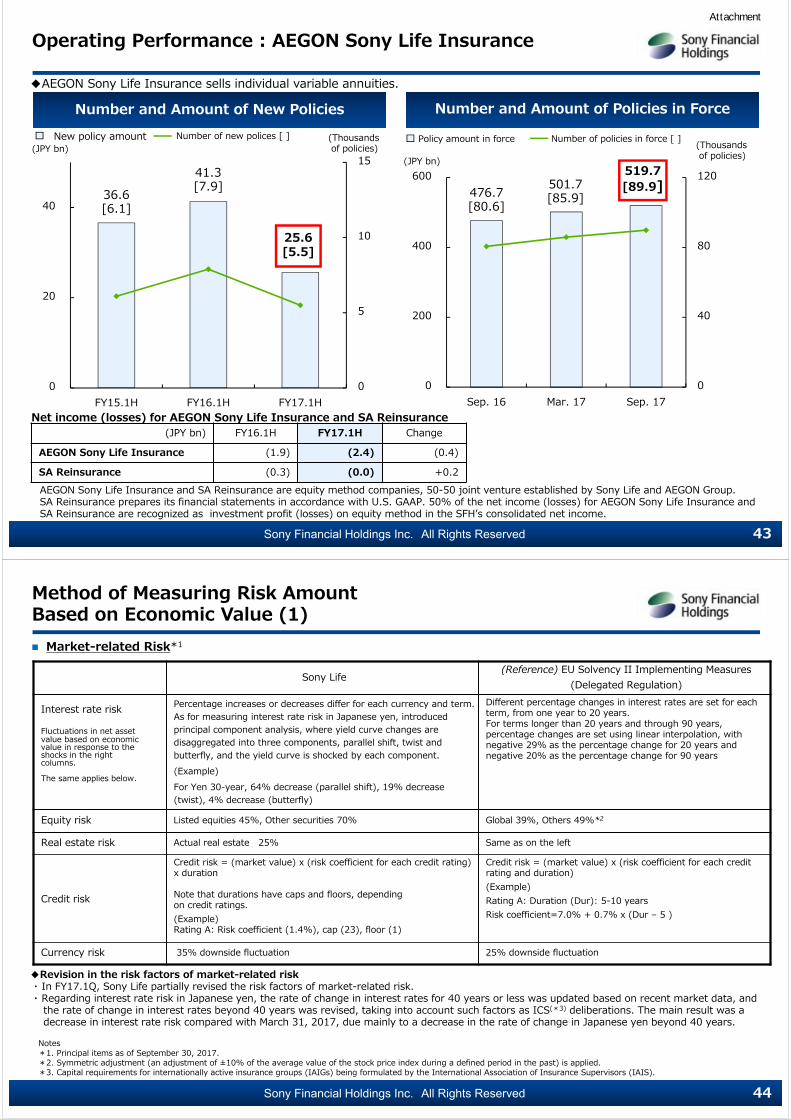
Highlights of Operating Performance: Sony Assurance
(JPY bn) FY16.1H FY17.1H Change
Ordinary revenues 50.2 54.7 +4.5 +9.0%
Underwriting income 48.9 53.8 +4.8 +9.9%
Investment income 1.2 0.9 (0.3) (25.1%)
Ordinary expenses 46.8 50.2 +3.3 +7.1%
Underwriting expenses 34.6 36.7 +2.1 +6.1%
Operating general and administrative expenses 12.2 13.4 +1.1 +9.7%
Ordinary profit 3.3 4.5 +1.2 +36.2%
Net income 2.4 3.3 +0.8 +35.5%
(JPY bn) Mar. 17 Sep. 17 Change fromMar. 17
Underwriting reserves 106.1 112.3 +6.2 +5.9%
Net assets 29.4 31.0 +1.6 +5.5%
Total assets 186.5 194.2 +7.7 +4.2%
(JPY bn)
Ordinary revenues Ordinary profit
◆Both ordinary revenues and ordinary profit increased year on year.
◆Ordinary revenues expanded owing to an increase in net premiums written for mainstay automobile insurance.
◆Ordinary profit increased due to a decline in the loss ratio, driven primarily by a lower car accident ratio.
Attachment

Sony Financial Holdings Inc. All Rights Reserved 17
(JPY bn) FY16.1H FY17.1H Change
Direct premiums written 48.3 53.1 +9.9%
Net premiums written 48.9 53.7 +9.9%
Net losses paid 24.0 24.9 +3.7%
Underwriting profit 2.0 3.6 +73.2%
Net loss ratio 56.7% 53.2% (3.5pt)
Net expense ratio 26.6% 26.6% +0.0pt
Combined ratio 83.3% 79.8% (3.5pt)
Mar. 17 Sep. 17 Change from Mar. 17
Number of policies in force 1.89 mn 2.01 mn +0.12 mn +6.6%
Non-consolidatedsolvency margin ratio 730.8% 784.1% +53.3pt
FY16.1H FY17.1H Change
E. I. loss ratio 63.3% 59.6% (3.7pt)
E. I. loss ratio + Net expense ratio 89.9% 86.2% (3.7pt)
Notes:E.I. loss ratio = (Net losses paid + Provision for reserve for outstanding losses + Loss adjustment expenses) / Earned premiums [Earthquake insurance and compulsory automobile liability insurance are excluded from the above calculation.]
<Reasons for changes>
Overview of Operating Performance: Sony Assurance
Notes:Net loss ratio = (Net losses paid + Loss adjustment expenses ) / Net premiums writtenNet expense ratio = Expenses related to underwriting / Net premiums written
◆ Remained flat due to an increase in net premiums written, in addition to a proper control on overall operating expenses.
◆ Increased in its mainstay automobile insurance.
◆ Declined due to a lower car accident ratio in automobile insurance.
Sony Financial Holdings Inc. All Rights Reserved 18
Sony Assuranceʼs Underwriting Performance by Type of Policy
(JPY mn) FY16.1H FY17.1H Change
Fire 117 102 (12.1%)
Marine - - -
Personal accident 4,388 4,348 (0.9%)
Voluntary automobile 43,814 48,664 +11.1%
Compulsory automobile liability - - -
Total 48,319 53,116 +9.9%
(JPY mn) FY16.1H FY17.1H Change
Fire 4 2 (45.3%)
Marine (11) 3 -
Personal accident 1,228 1,361 +10.8%
Voluntary automobile 22,175 22,915 +3.3%
Compulsory automobile liability 649 655 +0.9%
Total 24,046 24,937 +3.7%
(JPY mn) FY16.1H FY17.1H Change
Fire 12 8 (37.5%)
Marine (2) (0) -
Personal accident 4,527 4,452 (1.6%)
Voluntary automobile 43,686 48,545 +11.1%
Compulsory automobile liability 709 780 +10.0%
Total 48,934 53,786 +9.9%
Net losses paid
Direct Premiums Written Net Premiums Written
*Medical insurance is included in personal accident.
Attachment
Sony Financial Holdings Inc. All Rights Reserved
0
2
4
6
FY15.1H FY16.1H FY17.1H
0
0.5
1
1.5
2
0
20
40
60
FY15.1H FY16.1H FY17.1H
(JPY bn)
19
1.82
+9.9%
2.01
+36.2%
48.953.7
33
+10.9%
1.75
47.5
27
6.2
4.24.9
+27.8%
4.54.4
48.5
0.7
2.73.3
Operating Performance: Sony Assurance (1)
Net Premiums Written and Number of Policies in Force
Ordinary Profit and Adjusted Ordinary Profit
Voluntary automobile insuranceNumber of policies in force
Personal accident insuranceOthers
Ordinary profit Adjusted ordinary profit
(JPY bn)
(Reference) Provision for catastrophe reserve(JPY bn) FY15.1H FY16.1H FY17.1H
Provision for catastrophe reserve 1.5 1.5 1.7
*Adjusted ordinary profit = Ordinary profit + Provision for catastrophe reserve
*Provision for catastrophe reserve is described as positive amount.
The number of policies in force is the total of automobile insurance and medical insurance policies. Most of personal accident insurance is medical insurance.
(mn of policies)
Sony Financial Holdings Inc. All Rights Reserved
27.1 28.326.7 26.6 26.6
57.8 57.555.9 56.7
53.2
0
20
40
60
80
100
FY15 FY16 FY15.1H FY16.1H FY17.1H
(3.5pt)
20
<参考>
27.1 28.3 26.7 26.6 26.6
63.3 62.362.4 63.3
59.6
0
20
40
60
80
100
FY15 FY16 FY15.1H FY16.1H FY17.1H
86.2
+0.0pt
(%) (%)
89.183.384.8
90.4 89.982.7 79.8
(3.7pt)
(3.7pt)(3.5pt)
+0.0pt
90.685.8
Operating Performance: Sony Assurance (2)
Earned/Incurred Loss Ratio + Net Expense Ratio
(Reference) Combined Ratio (Net Loss Ratio+ Net Expense Ratio)
Net expense ratioEarned/Incurred loss ratio Net loss ratio
Notes:Earned/Incurred loss ratio = (Net losses paid + Provision for reserve for outstanding losses + Loss adjustment expenses) / Earned premiums[Earthquake insurance and compulsory automobile liability insurance are excluded from the above calculation.]
Notes:Net loss ratio = (Net losses paid + Loss adjustment expenses) /Net premiums writtenNet expense ratio = Expenses related to underwriting / Net premiums written
Net expense ratio
Attachment

Sony Financial Holdings Inc. All Rights Reserved
0
200
400
600
800
Mar. 16 Mar. 17 Sep. 17
21
(%)
+53.3pt
784.1%730.8%
693.5%
Operating Performance: Sony Assurance (3)
Non-consolidated Solvency Margin Ratio
Sony Financial Holdings Inc. All Rights Reserved
FY16.1H FY17.1H
22
19.8
3.7+108.0%
1.7
+6.5%18.6
<Consolidated>◆Ordinary revenues increased year on year due to an increase in
interest income on loans in line with a favorably growing balanceof mortgage loans, and an increase in interest income on securities. Ordinary profit increased year on year, due to a decrease in operating expenses, especially in advertising expenses for the card loan business.
<Non-consolidated>◆Both gross operating profit and net operating profit increased.・Net interest income increased due to an increase in interest
income on loans and interest income and dividends on securities.・Net fees and commissions decreased due mainly to lower fees
and commissions on mortgage loans, in addition to higher fees paid for loan guarantees reflecting the growing loan balance.
・Net other operating income decreased due mainly to a decrease in gains on foreign exchange transactions.
Highlights of Operating Performance:Sony Bank (Consolidated/Non-consolidated)
Consolidated ordinary profit
(JPY bn) FY16.1H FY17.1H Change
Ordinary revenues 16.9 18.0 +1.1 +6.6%
Gross operating profit 10.0 10.5 +0.5 +5.1%
Net interest income 8.4 10.1 +1.6 +19.7%
Net fees and commissions (0.5) (1.5) (1.0) -
Net other operating income 2.1 2.0 (0.0) (4.2%)
General and administrativeexpenses 8.4 7.6 (0.7) (8.8%)
Net operating profit 1.6 2.9 +1.2 +75.8%
Ordinary profit 1.6 3.4 +1.8 +110.9%
Net income 1.1 2.3 +1.1 +107.1%
(JPY bn) FY16.1H FY17.1H Change
Consolidated ordinary revenues 18.6 19.8 +1.2 +6.5%Consolidated ordinary profit 1.7 3.7 +1.9 +108.0%Profit attributable to owners of the parent 1.1 2.4 +1.2 +111.8%
(JPY bn)Mar. 17 Sep. 17 Change from
Mar. 17
Net assets 81.3 83.2 +1.9 +2.4%
Net unrealized gains on other securities, net of taxes 4.7 5.8 +1.0 +22.4%
Total assets 2,424.2 2,578.8 +154.5 +6.4%
<Consolidated>
<Non-consolidated>
(JPY bn)
Consolidated ordinary revenues
Attachment

Sony Financial Holdings Inc. All Rights Reserved 23
◆ Rose due to a steady increase in mortgage loans, despite a leveling off in demand for refinancing these loans.
◆ Increased in the U.S. dollar-denominated time deposit balance due to the promotional effect from the rise in U.S. interest rates, despite the conversion into yen led by a shift in the trend from yen appreciation to yen depreciation.
◆ Increased in yen ordinary deposit balance due mainly to an increase in newly accumulated funds via the increased number of accounts, as well as the conversion from foreign currencies backed by yen depreciation.
(JPY bn) Sep. 16 Mar. 17 Sep. 17 Change from Mar. 17
Customer assets 2,095.7 2,227.1 2,284.8 +57.7 +2.6%
Deposits 1,989.6 2,112.9 2,165.2 +52.2 +2.5%
Yen 1,649.7 1,764.9 1,800.5 +35.5 +2.0%
Foreign currencies 339.9 348.0 364.6 +16.6 +4.8%
Investment trusts 106.1 114.1 119.6 +5.5 +4.8%
Loans 1,460.6 1,539.6 1,559.3 +19.6 +1.3%
Mortgage loans 1,362.9 1,452.4 1,477.9 +25.4 +1.8%
Card loans 15.3 18.0 18.9 +0.8 +4.6%
Others 82.3 69.0 62.4 (6.5) (9.5%)
Number of accounts 1.19 mm 1.24 mm 1.29 mm +0.05mm +4.0%
Non-performing assets ratio (Based on Financial Reconstruction Law)
0.21% 0.19% 0.15% (0.04pt)
Non-consolidated Capital adequacy ratio (domestic criteria)
9.57% 9.75% 9.43% (0.32pt)
Overview of Operating Performance:Sony Bank (Non-consolidated) (1)
<Reasons for changes>
*1 Loans in others include corporate loans of ¥62.4 billion
*3 Please refer to the graph of the non-consolidated capital adequacy ratio (domestic criteria) on page 26.Capital adequacy ratios has been calculated by applying fundamental internal rating based approach (FIRB) from March 31, 2017.
*2 Non-performing loans (loans based on the Financial Reconstruction Act) /Total loan exposure
*2
*3
*1
Sony Financial Holdings Inc. All Rights Reserved
0.93
1.19 1.13
0.26 0.22
0
0.5
1
1.5
FY16.1H FY17.1H
0.91
24
(%)
(0.02pt)
Overview of Operating Performance:Sony Bank (Non-consolidated) (2)
<Reference> Interest Spread (Managerial Accounting Basis)
<Reference> On Managerial Accounting Basis
(JPY bn) FY16.1H FY17.1H Change
Gross operating profit 10.0 10.5 +0.5 +5.2%
Net interest income*1 ① 9.7 11.3 +1.5 +16.3%
Net fees and commissions*2 ② (0.2) (1.3) (1.0) ー
Net other operating income*3 0.5 0.5 +0.0 +0.8%
Gross operating profit (core profit)(A)=①+② 9.4 10.0 +0.5 +5.5%
Operating expenses and other expenses ③ 8.4 7.6 (0.7) (8.9%)
Net operating profit (core profit)=(A)-③ 1.0 2.3 +1.2 +119.7%
■Managerial accounting basis The following adjustments are made to the figures on a financial account for profits and losses more appropriately.*1: Net interest income: Includes profits and losses associated with fund investment
recorded in net other operating income, including gains or losses from currency swap transactions.
*2: Net fees and commissions: Includes profits and losses for customer dealings in foreign currency transactions recorded in net other operating income.
*3: Net other operating income: After the above adjustments (*1 and *2), mainly consists of profits and losses for bond and derivative dealing transactions.
■Core profitProfits and losses exclude net other operating income, which includes those on bond andderivative dealing transactions, and stands for Sony Bankʼs basic profits.
Note: Interest spread=(Yield on investment)-(Yield on financing)
Interest spreadYield on investment Yield on financing
Attachment

Sony Financial Holdings Inc. All Rights Reserved
0
500
1,000
1,500
Mar. 16 Mar. 17 Sep. 170
500
1,000
1,500
2,000
Mar. 16 Mar. 17 Sep. 17
25
1,559.32,165.22,112.91,344.11,923.5
1,539.6
348.0
1,764.9
335.5
1,587.9
87.1
107.0
1,452.41,237.1
364.6
1,800.51,477.9
81.3+52.2 +19.6
Operating Performance:Sony Bank (Non-consolidated) (1)
Deposits Loans
Yen Deposits Foreign currency deposits Mortgage loans Others
(JPY bn) (JPY bn)
*Corporate loans of ¥62.4 billion. Card loans of ¥18.9 billion.
Sony Financial Holdings Inc. All Rights Reserved
0
200
400
600
800
Mar. 16 Mar. 17 Sep. 17
26
(%)
9.43690.0
AAA AAABBB Others
631.2620.99.89
(0.32pt)
9.75
+58.8
Balance of Securities by Credit Rating Non-Consolidated Capital Adequacy Ratio (Domestic Criteria)
(JPY bn)
Notes:1. Calculated based on the standard FSA Notification No. 19 (2006), which
establishes standards based on Article 14-2 of the Banking Act of Japan for determining the capital adequacy of a bank in light of the assets held by the bank.
2. Capital adequacy ratios has been calculated by applying fundamental internal rating based approach (FIRB) from March 31, 2017.
0
5
10
15
Mar. 16 Mar. 17 Sep. 17
Operating Performance:Sony Bank (Non-consolidated) (2)
Attachment

Sony Financial Holdings Inc. All Rights Reserved 27
Forecast of Consolidated Financial Resultsfor the Fiscal Year Ending March 31, 2018
(FY17)
Sony Financial Holdings Inc. All Rights Reserved 28
<Segment information for ordinary revenues and ordinary profit>■Life Insurance Business
In FY17.1H, ordinary revenues exceeded our initial expectations, as an improved market environment promoted an increase in investment income in the separate account. Ordinary profit was in line with our forecasts at the beginning of the fiscal year. Negative factors included the fact that anticipated sales of securities did not occur, as well as worsening profits on derivative transactions related to minimum guarantees for variable life insurance. Among positive factors, a lower-than-expected level of new policies lowered initial-period costs, and operating expenses were shifted to a different period.We maintain our forecast for the full-year, taking into consideration the business environment from FY17.3Q onward.
■Non-life Insurance BusinessIn FY17.1H, ordinary revenues were essentially in line with our expectations. Ordinary profit for FY17.1H exceeded our expectations as the loss ratio was lower than our initial expectations.We have revised upward the full-year forecast after partially revising projections in the loss ratio and the expense ratio from FY17.3Q onward, and reflecting operating results in FY17.1H.
■Banking BusinessIn FY17.1H, ordinary revenues and ordinary profit were essentially in line with our expectations, so we maintain our full-year forecasts.
Forecast of Consolidated Financial Results for FY17
(JPY bn)FY16
(Actual)FY17
(Forecast) Changes
Consolidated ordinary revenues 1,381.6 1,430.0 +3.5%
Life insurance businessNon-life insurance businessBanking business
1,243.9102.338.5
1,276.1108.9⇒110.0
40.6
+2.6%+6.4%⇒+7.5%
+5.4%
Consolidated ordinary profit 66.3 67.0 +1.0%
Life insurance businessNon-life insurance businessBanking business
56.85.05.0
56.44.6⇒6.5
6.6
(0.7%)(8.0%)⇒+30.0%
+30.6%
Profit attributable to owners of the parent 41.6 42.0 +0.9%
Forecast of consolidated financial results for FY17 is unchanged from the forecast announced on April 28, 2017, while the full-year forecast of the non-life insurance business is revised upward.
FY17.1H(Actual) Progress rates
708.3 49.5%
632.454.719.8
49.6%50.3%⇒49.8%
48.8%
32.6 48.8%
24.94.53.7
44.2%99.7%⇒70.6%
56.2%
21.5 51.4%
Attachment

Sony Financial Holdings Inc. All Rights Reserved 29
Sony Lifeʼs MCEV and ESRas of September 30, 2017
A part of the calculations of MCEV adopted simplified method except that as of March 31, 2017.Please keep in mind that the validity of these calculations has not been verified by outside specialists.
*In this part, figures, ratios and percentages changes have been rounded.
Sony Financial Holdings Inc. All Rights Reserved
(JPY bn) Mar. 17 Jun. 17 Sep. 17Change
from Mar. 17
Change from
Jun. 17
MCEV 1,441.1 1,478.2 1,523.1 +82.0 +44.9
Adjusted net worth 1,657.7 1,624.2 1,611.8 (45.9) (12.5)
Value of existing business (216.7) (146.0) (88.7) +128.0 +57.3
(JPY bn) FY16.4Q(3M)
FY17.1Q(3M)
FY17.2Q(3M)
New business value 14.1 12.2 17.2
New business margin 3.8% 4.6% 6.4%
Reasons for changes in MCEV・MCEV as of September 30, 2017 increased ¥44.9 billion form June 30, 2017 due mainly to a rise in
interest rates in Japanese yen.New business value/ New business margin・New business margin for FY17.2Q (3M) was up 1.8 percentage points from FY17.1Q (3M), due mainly
to a change in product mix and a rise in interest rates.・New business value for FY17.2Q (3M) was ¥17.2 billion, up ¥4.9 billion from FY17.1Q (3M), due to a rise
in new business margin.
Sony Lifeʼs MCEV
*Please refer to the appendix page 46 for trend on JGB yields.
Notes:1. Calculated MCEV as of June 30, 2017 onward by using updated economic assumptions and lapse and surrender rate from March 31, 2017. 2. New business value is calculated accumulating new business value for each month based on economic assumptions at the end of each month.
FY17.1H(6M)
29.4
5.5%
30
Attachment

Sony Financial Holdings Inc. All Rights Reserved
(JPY bn) Mar. 17 Jun. 17 Sep. 17Insurance risk* 937.5 933.6 939.1Market-related risk 405.1 349.3 366.5
Of which, interest rate risk** 308.9 263.1 273.7Operational risk 28.1 28.1 28.1Counter party risk 1.9 2.5 1.9Variance effect (392.0) (372.2) (379.4)
The risk amount based on economic value 980.6 941.3 956.3
(JPY bn) Mar. 17 Jun. 17 Sep. 17MCEV + Frictional costs 1,476.6 1,505.1 1,547.2ESR 151% 160% 162%
The risk amount based on economic value as of September 30, 2017 amounted to ¥956.3 billion, up ¥14.9 billion from June 30, 2017, due mainly to a increase in interest rate risk reflecting a rise in interest rates in Japanese yen.
ESR as of September 30, 2017 was 162%, up 2pt from June 30, 2017.
Sony Lifeʼs ESR
Notes: 1. The risk amount based on economic value refers to the total amount of Sony Lifeʼs risks comprehensively examined by a market consistent approach,
including insurance risk and market-related risk. 2. The solvency risk capital on an economic value basis is calibrated at VaR (99.5) over one year and based on the internal model, which is a similar
but modified model based on the EU Solvency II standard method. 3. ESR=(MCEV + Frictional costs) / Risk amount based on economic value.
(* ) Risk amount excluding the variance effect within Life module and Health module.(**) Risk amount excluding the variance effect within market-related risk.
31
Sony Financial Holdings Inc. All Rights Reserved 32
Appendix
Attachment

Sony Financial Holdings Inc. All Rights Reserved
Recent Topics 1
33
Sony Bankʼs Mortgage Loans through Sony Life ■Sony Life accounts for 19% of the amount of new mortgage loans for FY17.1H (6M)
Sony Life accounts for 21% of the balance of mortgage loans as of September 30, 2017*Sony Life started handling banking agency business in January 2008.
Sony Assuranceʼs Auto Insurance Sold by Sony Life■Sony Life accounts for approx. 3% of new automobile policies for FY17.1H (6M)
*Sony Life started handling automobile insurance in May 2001.
AEGON Sony Life InsuranceLaunch of sales: December 1, 2009 Common stock: ¥30 billion (including capital reserves of ¥15 billion) Equity ownership: Sony Life insurance Co Ltd 50%, AEGON international B.V. 50% Marketing products: Individual Variable AnnuitiesSales Channels: Lifeplanner sales employees and partner Banks (32*) *As of November 13, 2017
SA Reinsurance LtdEstablished: October 29, 2009Common stock: ¥15.9 billion Equity ownership: Sony Life insurance Co., Ltd. 50%, AEGON international B.V. 50%Business: Reinsurance business *AEGON Sony Life Insurance and SA Reinsurance are equity method companies, 50-50 joint ventures established by Sony Life and AEGON Group.
Sony Financial Holdings Inc. All Rights Reserved 34
2017-07-02 Sony Life began providing Web policy guides and agreements
2017-07-10Sony Lifecare converted Yuuai Holdings Co., Ltd. (YHD) to a wholly owned subsidiary(YHD changed its corporate name to Proud Life Inc. on Aug. 1, 2017)
2017-08-08 Sony Bank began providing cloud funding platform “Sony Bank GATE”
2017-08-10 Sony Life established a joint venture, Sony Life Financial Advisors Pte. Ltd., with Starts Securities Co., Ltd. in Singapore
2017-09-01 Sony Bank opened “CONCULTING PLAZA” in Ginza, Tokyo
2017-09-06 Sony Lifecare announced to open its 3rd “SONARE” brand nursing care home in Nerima-Ku, Tokyo by Autumn 2018
2017-09-19 Sony Life launched a service to acquire medical certificates on behalf of policyholders
2017-10-02Sony Life commenced sale of new product: “U.S. Dollar-Denominated Single Premium Whole Life Insurance (Non-Notification Type)” and “U.S. Dollar-Denominated Living Benefit Whole Life Insurance (Living Standard Type)”
2017-10-05 Sony Assurance began offering a web-based insurance claims service, allowing policyholders to make medical insurance claims via its website
2017-10-09 Sony Bank Began issuing “Takashimaya Platinum Debit Card” through an alliance with Takashimaya Co., Ltd. and Takashimaya Credit Co., Ltd.
2017-11-01 Sony Assurance expanded its “Secom accident on-site rush service” for automobile insurance policyholders
<Highlights on and after FY17.2Q>
Recent Topics 2
Attachment

Sony Financial Holdings Inc. All Rights Reserved
FY17.1Q(3M)
FY17.2Q(3M)
円建終⾝14%
Protection-type(term life)
54%
Endowment/Annuities
27%
Yen wholelife 8%
U.S. dollar-denominated whole life 11%
円建終⾝19%
円建終⾝14%
円建終⾝14%
Protection-type(term life)
50%
Endowment/Annuities
31%
Yen wholelife 8%
U.S. dollar-denominated whole life 11%
¥16.2 billion
Sony Lifeʼs Product Portfolio
Annualized Premiums from New Policies by Product
FY16(12M)¥78.1 billion
Protection-type(term life)
56%
Single premiumWhole life 1%
Endowment/Annuities
21%
Yen wholelife 14%
U.S. dollar-denominated whole life 8%
¥16.1 billion
35
Sony Financial Holdings Inc. All Rights Reserved 36
国債85.3%
国債95.4%
・Expand investments in ultralong-term Japanese government and corporate bonds (including FILP agency bonds), based on the asset investment policy to match the liability characteristics of insurance policies.
・Increase investments in U.S. government bonds, responding to higher sales of U.S. dollardenominated insurance policies.
Sony Lifeʼs Asset Management
Diversify Asset Management under the Negative Interest Rate Environment (purchase securities in the general account)
Notes: 1. Japanese corporate bonds include FILP agency bonds and Government-guaranteed bonds. 2. The graphs above are asset allocation for the relevant period. Total invested amount for the relevant period as 100%.
(excluding, investment in subsidiaries and affiliates, and strategic investments)
FY15 (12M)
JGBs
Japanese corporate bonds
Foreign bonds
Japanese stocksJGBs
85.3%
Japanese corporate bonds11.9%
Japanese stocks0.5%
Foreign bonds 2.3%
FY16 (12M)JGBs
Japanese corporate bonds
Foreign bonds
Japanese stocks
Japanese local government bonds
Japanesecorporatebonds28.6%
Foreign bonds
28.3%
Japanese local government bonds 0.1%
JGBs42.5%
Japanese stocks 0.5%
FY17.1H (6M)
JGBs
Japanese corporate bonds
Foreign bonds
Japanese stocks
Japanese corporatebonds31.1%
Foreign bonds
12.0%
Japanese stocks0.4%
JGBs56.5%
Attachment

Sony Financial Holdings Inc. All Rights Reserved 37
Sony Life: Fair Value Information on Securities (General Account Assets)
Fair Value Information on SecuritiesFair value information on securities with market value (except trading-purpose securities)
Note: The above table includes money held in trust other than trading-purpose securities.
Valuation gains (losses) on trading-purpose securities
Note: The above chart includes trading-purpose securities included in “money held in trust”, etc
(JPY bn)
Sony Financial Holdings Inc. All Rights Reserved 38
(JPY mn) FY16.1H FY17.1H ChangeCash and deposits 0 0 +62.5%Japanese bonds(including JGBs) 59,830 61,875 +3.4%
Japanese stocks 260 282 +8.5%Foreign securities 3,512 7,027 +100.1%Other securities 31 124 +293.8%Loans 3,171 3,285 +3.6%Real estate 5,430 5,455 +0.5%Others 53 191 +254.6%Total 72,291 78,241 +8.2%
Sony Lifeʼs Interest Income and Dividends (Details)
Attachment

Sony Financial Holdings Inc. All Rights Reserved 39
FY16 FY17
(JPY mn) 1Q (3M) 2Q (6M) 3Q (9M) 4Q (12M) 1Q (3M) 2Q (6M)
Capital gains 14,501 11,796 25,628 16,114 124 2,098
Income from money held in trust, net - - - - - -
Income from trading securities, net 7 49 103 134 11 19
Gains on sale of securities 917 1,301 1,306 1,308 0 0
Gains on derivatives, net 8,821 4,577 - - - -
Gains on hedges of variable life insurance 4,955 1,042 - - - -
Gains on hedges of available-for-sale securities 3,021 1,386 - - - -
Foreign exchange gains, net - - 24,218 14,670 49 2,078
Gains (losses) on sale of foreign bonds - - 2,375 2,375 - -
Other capital gains 4,754 5,868 - - 63 -
Capital losses 3,407 5,688 39,882 32,276 7,441 16,257
Losses on money held in trust, net - - - - - -
Losses on trading securities, net - - - - - -
Losses on sale of securities - - - - - 0
Devaluation losses on securities - - - - - -
Losses on derivatives, net - - 34,275 30,050 7,015 14,739
Losses on hedges of variable life insurance - - 14,292 15,666 4,247 8,555
Losses on hedges of available-for-sale securities - - 2,265 2,460 1,713 2,767
Foreign exchange losses, net 3,139 5,023 - - - -
Losses on sale of foreign bonds* (1,681) (2,375) - - - -
Other capital losses 267 665 5,606 2,226 426 1,518
Net capital gains (losses) 11,094 6,108 (14,253) (16,162) (7,316) (14,159)
Sony Lifeʼs Capital Gains/Losses
Notes on Sony Lifeʼs Capital Gains/Losses are disclosed in page 40.
* (losses) represents positive figures.
Total of gains on sale ofsecurities and foreign exchangegains on sale of foreign bonds:FY17.2Q (6M): ¥0 millionFY16.2Q (6M): ¥3,676 million.
Sony Financial Holdings Inc. All Rights Reserved 40
Sony Lifeʼs Capital Gains/Losses (continued)
(Note1)・Foreign exchange gains, net for FY17.1Q (3M) include foreign exchange losses of ¥242 million relating to U.S. dollar-denominated insurance.
Losses on derivatives, net include foreign exchange losses relating to U.S. dollar-denominated insurance of ¥515 million. Moreover, other capital losses include the reversal of policy reserves for U.S. dollar-denominated insurance of ¥63 million relating to foreign exchange fluctuation.
・Foreign exchange gains, net for FY17.2Q (6M) include foreign exchange gains of ¥1,583 million relating to U.S. dollar-denominated insurance. Losses on derivatives, net include foreign exchange losses relating to U.S. dollar-denominated insurance of ¥2,489 million. Moreover, other capital losses include the provision of policy reserves for U.S. dollar-denominated insurance of ¥853 million relating to foreign exchange fluctuation.
(Note 2)・ Foreign exchange losses, net for FY16.1Q (3M) include foreign exchange losses of ¥4,280 million relating to U.S. dollar-denominated insurance.
Moreover, other capital gains include the reversal of policy reserves for U.S. dollar-denominated insurance of ¥4,754 million relating to foreign exchange fluctuation.
・Foreign exchange losses, net for FY16.2Q (6M) include foreign exchange losses of ¥6,720 million relating to U.S. dollar-denominated insurance. Gains on derivatives, net include foreign exchange gains relating to U.S. dollar-denominated insurance of ¥1,337 million. Moreover, other capital gains include the reversal of policy reserves for U.S. dollar-denominated insurance of ¥5,868 million relating to foreign exchange fluctuation.
・Foreign exchange gains, net for FY16.3Q (9M) include foreign exchange gains of ¥21,805 million relating to U.S. dollar-denominated insurance. Losses on derivatives, net include foreign exchange losses relating to U.S. dollar-denominated insurance of ¥17,445 million. Moreover, other capital losses include the provision of policy reserves for U.S. dollar-denominated insurance of ¥4,941 million relating to foreign exchange fluctuation.
・Foreign exchange gains, net for FY16.4Q (12M) include foreign exchange gains of ¥12,389 million relating to U.S. dollar-denominated insurance. Losses on derivatives, net include foreign exchange losses relating to U.S. dollar-denominated insurance of ¥12,010 million. Moreover, other capital losses include the provision of policy reserves for U.S. dollar-denominated insurance of ¥1,560 million relating to foreign exchange fluctuation.
(Note3)・ The figures of income (losses) from money held in trust, net, income (losses) from trading securities, net, gains (losses) on derivatives and
foreign exchange gains (losses), net were recorded after offsetting gains and losses of each item.
Attachment

Sony Financial Holdings Inc. All Rights Reserved 41
1,324.2 1,290.7
1,437.4
1,098.9
1,260.01,189.0
1,050.7
1,457.7
1,115.8 1,114.8
0
250
500
750
1,000
1,250
1,500
FY15.1Q FY15.2Q FY15.3Q FY15.4Q FY16.1Q FY16.2Q FY16.3Q FY16.4Q FY17.1Q FY17.2Q
Quarterly Trend on New Policy Amount
(JPY bn)
Sony Lifeʼs Quarterly Trend on New Policy Amount
Sony Financial Holdings Inc. All Rights Reserved 42
22.320.6
22.7
19.120.5
18.2
15.3
23.9
16.1 16.2
3.9 3.44.6
3.6 4.1 3.9 3.14.4
3.1 2.80
5
10
15
20
25
FY15.1Q FY15.2Q FY15.3Q FY15.4Q FY16.1Q FY16.2Q FY16.3Q FY16.4Q FY17.1Q FY17.2Q
Sony Lifeʼs Quarterly Trend on Annualized Premiums from New Policies
Quarterly Trend on Annualized Premiums from New Policies
Annualized premiums from new policies Of which, third-sector
(JPY bn)
Attachment
Sony Financial Holdings Inc. All Rights Reserved
476.7[80.6]
501.7[85.9]
0
40
80
120
0
200
400
600
Sep. 16 Mar. 17 Sep. 17
519.7[89.9]36.6
[6.1]
41.3[7.9]
0
5
10
15
0
20
40
FY15.1H FY16.1H FY17.1H
25.6[5.5]
Operating Performance : AEGON Sony Life Insurance
Number and Amount of Policies in Force
(JPY bn)
Number and Amount of New Policies
(JPY bn)
(JPY bn) FY16.1H FY17.1H Change
AEGON Sony Life Insurance (1.9) (2.4) (0.4)
SA Reinsurance (0.3) (0.0) +0.2
◆AEGON Sony Life Insurance sells individual variable annuities.
AEGON Sony Life Insurance and SA Reinsurance are equity method companies, 50-50 joint venture established by Sony Life and AEGON Group.SA Reinsurance prepares its financial statements in accordance with U.S. GAAP. 50% of the net income (losses) for AEGON Sony Life Insurance andSA Reinsurance are recognized as investment profit (losses) on equity method in the SFHʼs consolidated net income.
New policy amount Number of new polices [ ] (Thousandsof policies)
Policy amount in force Number of policies in force [ ] (Thousandsof policies)
Net income (losses) for AEGON Sony Life Insurance and SA Reinsurance
43
Sony Financial Holdings Inc. All Rights Reserved
Sony Life(Reference) EU Solvency II Implementing Measures
(Delegated Regulation)
Interest rate risk
Fluctuations in net asset value based on economic value in response to the shocks in the rightcolumns.
The same applies below.
Percentage increases or decreases differ for each currency and term.As for measuring interest rate risk in Japanese yen, introduced principal component analysis, where yield curve changes are disaggregated into three components, parallel shift, twist and butterfly, and the yield curve is shocked by each component.(Example)For Yen 30-year, 64% decrease (parallel shift), 19% decrease (twist), 4% decrease (butterfly)
Different percentage changes in interest rates are set for each term, from one year to 20 years. For terms longer than 20 years and through 90 years, percentage changes are set using linear interpolation, with negative 29% as the percentage change for 20 years and negative 20% as the percentage change for 90 years
Equity risk Listed equities 45%, Other securities 70% Global 39%, Others 49%*2
Real estate risk Actual real estate 25% Same as on the left
Credit risk
Credit risk = (market value) x (risk coefficient for each credit rating) x duration
Note that durations have caps and floors, dependingon credit ratings.(Example)Rating A: Risk coefficient (1.4%), cap (23), floor (1)
Credit risk = (market value) x (risk coefficient for each credit rating and duration) (Example)Rating A: Duration (Dur): 5-10 yearsRisk coefficient=7.0% + 0.7% x (Dur – 5 )
Currency risk 35% downside fluctuation 25% downside fluctuation
Method of Measuring Risk Amount Based on Economic Value (1) Market-related Risk*1
Notes *1. Principal items as of September 30, 2017. *2. Symmetric adjustment (an adjustment of ±10% of the average value of the stock price index during a defined period in the past) is applied.*3. Capital requirements for internationally active insurance groups (IAIGs) being formulated by the International Association of Insurance Supervisors (IAIS).
◆Revision in the risk factors of market-related risk・ In FY17.1Q, Sony Life partially revised the risk factors of market-related risk.・ Regarding interest rate risk in Japanese yen, the rate of change in interest rates for 40 years or less was updated based on recent market data, and
the rate of change in interest rates beyond 40 years was revised, taking into account such factors as ICS(*3) deliberations. The main result was a decrease in interest rate risk compared with March 31, 2017, due mainly to a decrease in the rate of change in Japanese yen beyond 40 years.
44
Attachment

Sony Financial Holdings Inc. All Rights Reserved
Method of Measuring Risk Amount Based on Economic Value (2) Insurance Risk*1
Sony Life (Reference) EU Solvency II Implementing Measures (Delegated Regulation)
Mortality risk Mortality rate increases by 15% for each year elapsed Same as on the left
Longevity risk Mortality rate decreases by 20% for each year elapsed Same as on the left
Lapse risk The largest amount of these;*2
• Lapse rate increases by 50% for each year elapsed
• Lapse rate decreases by 50% for each year elapsed
• 30% of policies on which surrender value is in excess of best estimate liability are immediately surrendered
The largest amount of these;
• Increases by 50% in the assumed rates of lapsation for Life module, 50% for Health module
• Decreases by 50% in the assumed rates of lapsation for Life module, 50% for Health module
• 40% of policies (70% for group annuities, etc.) on which surrender value is in excess of best estimate liability are immediately surrendered
Expense risk Operating expenses increase by 10% for each year elapsed Rate of inflation rises by 1%
Same as on the left
Disability risk Rate of occurrence increases by 35% in the first fiscal year, rising by 25% for each year thereafter
Rate of occurrence increases by 35% in the first fiscal year, rising by 25% for each year thereafter. Recovery rate decreases by 20%.
Notes *1. Principal items as of September 30, 2017. *2. At Sony Life, lapse risk is calculated by computing and adding together the largest amount of three options for each insurance policy.
45
Sony Financial Holdings Inc. All Rights Reserved
Trend on JGB Yields (Par rate)
As of the end of each month
46
Attachment

Sony Financial Holdings Inc. All Rights Reserved
Trend on Risk-free Rate (Japanese yen/ Par rate)
*For above risk-free rate, we employ the Smith-Wilson method for extrapolation so that the 60-year forward rate will coverage on the UFR (3.5%).
Convergence period: 20 year
Last liquid point: 40 year
47
Sony Financial Holdings Inc. All Rights Reserved 48
Contact︓Investor Relations Department
Sony Financial Holdings Inc.TEL︓+81-3-5290-6500
Attachment