CONSOLIDATED RESULTS AT 30 SEPTEMBER 2021
10
1 CONSOLIDATED RESULTS AT 30 SEPTEMBER 2021 Results driven by international business: » 3.3% growth in the Group’s customer base, which reaches nearly 73 million customers driven by the increase in the subsidiaries’ customer base (+4.2%); » Quasi-stability of consolidated revenues in the 2021 3 rd quarter (-0.5% at constant exchange rates*); » Continued development of international activities, with revenues growth (+2.3% at constant exchange rates*) driven by Mobile Data and a sustained increase of adjusted EBITDA (+4.4% at constant exchange rates*); » Strong growth in Fixed Data in Morocco (+7.8%); » High level of profitability maintained with an adjusted Group EBITDA margin of 51.6%; » Acceleration in the Group's investments (excluding frequencies and licences), which represented 13.3% of revenues at end-September 2021. In the third quarter of 2021, Maroc Telecom Group was able to maintain the performance of its activities despite a restrictive health environment. The performance of the subsidiaries enables to post resilient results, confirming its international development strategy. The Group capitalizes on the quality of its networks, which it keeps strengthening in order to support the development of its customers' Data usage and to provide exemplary quality of service. *Maintaining a constant exchange rate between the Moroccan dirham (MAD), the Mauritanian ouguiya (MRU) and the CFA franc. Rabat, 26 October 2021 PRESS RELEASE
Transcript of CONSOLIDATED RESULTS AT 30 SEPTEMBER 2021

1
CONSOLIDATED RESULTS AT 30 SEPTEMBER 2021
Results driven by international business:
» 3.3% growth in the Group’s customer base, which reaches nearly 73 million customers
driven by the increase in the subsidiaries’ customer base (+4.2%);
» Quasi-stability of consolidated revenues in the 2021 3rd quarter (-0.5% at constant
exchange rates*);
» Continued development of international activities, with revenues growth (+2.3% at
constant exchange rates*) driven by Mobile Data and a sustained increase of adjusted
EBITDA (+4.4% at constant exchange rates*);
» Strong growth in Fixed Data in Morocco (+7.8%);
» High level of profitability maintained with an adjusted Group EBITDA margin of 51.6%;
» Acceleration in the Group's investments (excluding frequencies and licences), which
represented 13.3% of revenues at end-September 2021.
In the third quarter of 2021, Maroc Telecom Group was able to maintain the performance of its
activities despite a restrictive health environment.
The performance of the subsidiaries enables to post resilient results, confirming its international
development strategy.
The Group capitalizes on the quality of its networks, which it keeps strengthening in order to support
the development of its customers' Data usage and to provide exemplary quality of service.
*Maintaining a constant exchange rate between the Moroccan dirham (MAD), the Mauritanian ouguiya (MRU) and the CFA franc.
Rabat, 26 October 2021
PRESS RELEASE
2
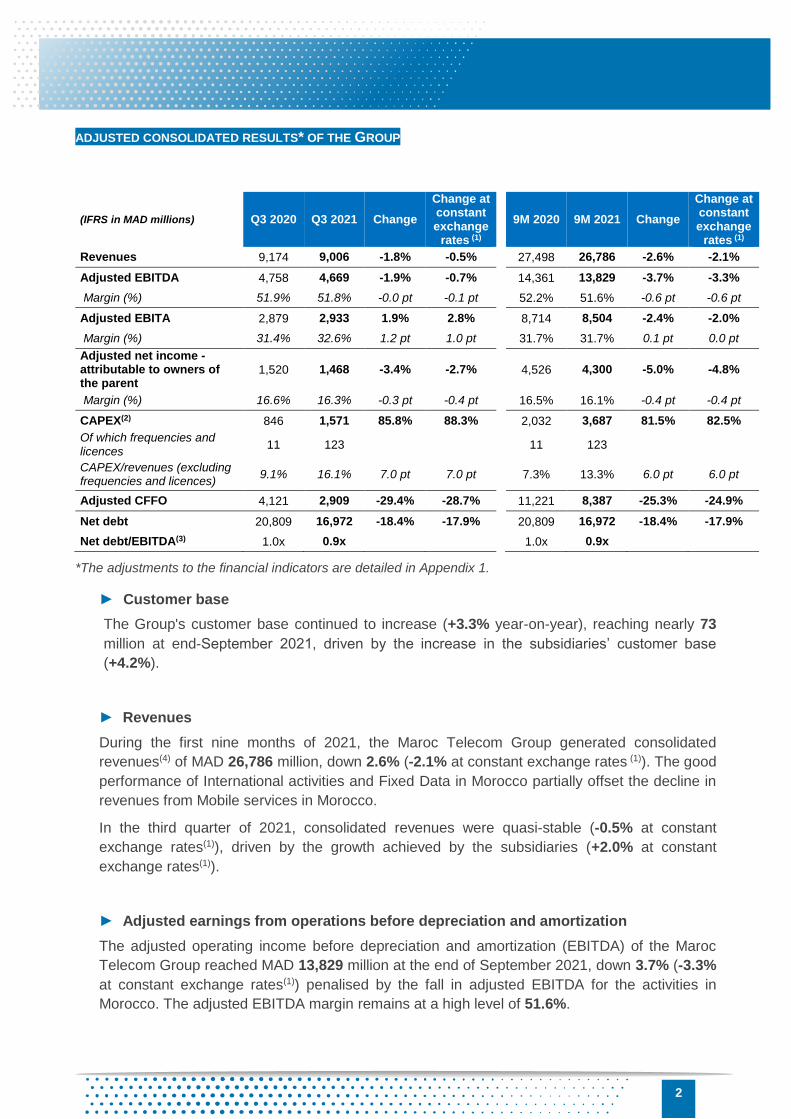
ADJUSTED CONSOLIDATED RESULTS* OF THE GROUP
(IFRS in MAD millions) Q3 2020 Q3 2021 Change
Change at constant exchange
rates (1)
9M 2020 9M 2021 Change
Change at constant exchange
rates (1)
Revenues 9,174 9,006 -1.8% -0.5% 27,498 26,786 -2.6% -2.1%
Adjusted EBITDA 4,758 4,669 -1.9% -0.7% 14,361 13,829 -3.7% -3.3%
Margin (%) 51.9% 51.8% -0.0 pt -0.1 pt 52.2% 51.6% -0.6 pt -0.6 pt
Adjusted EBITA 2,879 2,933 1.9% 2.8% 8,714 8,504 -2.4% -2.0%
Margin (%) 31.4% 32.6% 1.2 pt 1.0 pt 31.7% 31.7% 0.1 pt 0.0 pt
Adjusted net income - attributable to owners of the parent
1,520 1,468 -3.4% -2.7% 4,526 4,300 -5.0% -4.8%
Margin (%) 16.6% 16.3% -0.3 pt -0.4 pt 16.5% 16.1% -0.4 pt -0.4 pt
CAPEX(2) 846 1,571 85.8% 88.3% 2,032 3,687 81.5% 82.5%
Of which frequencies and licences
11 123 11 123
CAPEX/revenues (excluding frequencies and licences)
9.1% 16.1% 7.0 pt 7.0 pt 7.3% 13.3% 6.0 pt 6.0 pt
Adjusted CFFO 4,121 2,909 -29.4% -28.7% 11,221 8,387 -25.3% -24.9%
Net debt 20,809 16,972 -18.4% -17.9% 20,809 16,972 -18.4% -17.9%
Net debt/EBITDA(3) 1.0x 0.9x 1.0x 0.9x
*The adjustments to the financial indicators are detailed in Appendix 1.
► Customer base
The Group's customer base continued to increase (+3.3% year-on-year), reaching nearly 73
million at end-September 2021, driven by the increase in the subsidiaries’ customer base
(+4.2%).
► Revenues
During the first nine months of 2021, the Maroc Telecom Group generated consolidated
revenues(4) of MAD 26,786 million, down 2.6% (-2.1% at constant exchange rates (1)). The good
performance of International activities and Fixed Data in Morocco partially offset the decline in
revenues from Mobile services in Morocco.
In the third quarter of 2021, consolidated revenues were quasi-stable (-0.5% at constant
exchange rates(1)), driven by the growth achieved by the subsidiaries (+2.0% at constant
exchange rates(1)).
► Adjusted earnings from operations before depreciation and amortization
The adjusted operating income before depreciation and amortization (EBITDA) of the Maroc
Telecom Group reached MAD 13,829 million at the end of September 2021, down 3.7% (-3.3%
at constant exchange rates(1)) penalised by the fall in adjusted EBITDA for the activities in
Morocco. The adjusted EBITDA margin remains at a high level of 51.6%.
3
► Adjusted earnings from operations
For the first nine months of 2021, adjusted earnings from operations (EBITA)(5) of the Maroc
Telecom Group came to MAD 8,504 million, down by 2.4% (-2.0% at constant exchange rates(1)).
The operating margin stabilised at 31.7% of revenues.
► Adjusted Net Income - Group share
Adjusted Group share of net income was MAD 4,300 million, down 5.0% (-4.8 % at constant
exchange rates (1)).
► Investments
Investments (excluding frequencies and licences) accelerated and were up 76.4% at end-
September 2021 (+77.3% at constant exchange rates (1)). They represent 13.3% of Group
revenues and are still focused on strengthening Fixed and Mobile network infrastructures.
► Cash flow
Adjusted net cash flow from operations (CFFO)(6) amounted to MAD 8,387 million, down 25.3%
(-24.9% at constant exchange rates(1)) due to the increase in investments.
At the end of September 2021, the Group's consolidated Net Debt(7) represented 0.9 times its
annualised EBITDA(3).
► Highlights
On 17 August 2021, the Etisalat Group signed an agreement with the Abu Dhabi Development Fund to acquire its stake in Etisalat Investment North Africa LLC (EINA) of 8.7%, bringing the Etisalat Group’s stake to 100%. EINA owns the Société de Participation dans les Télécommunications (SPT) which holds a 53% stake in the Maroc Telecom Group.
When it becomes effective, this acquisition will increase the percentage interest of the Etisalat Group in the Maroc Telecom Group from 48.4% to 53.0% while maintaining the current control structure unchanged.

4
REVIEW OF THE GROUP'S ACTIVITIES
The adjustments to the "Morocco" and "International" financial indicators are detailed in Appendix
1.
Morocco
(IFRS in MAD millions) Q3 2020 Q3 2021 Change 9M 2020 9M 2021 Change
Revenues 5,205 5,104 -1.9% 15,729 14,878 -5.4%
Mobile 3,354 3,213 -4.2% 10,132 9,198 -9.2%
Services 3,288 3,083 -6.2% 9,925 8,850 -10.8%
Equipment 65 130 98.2% 207 348 68.0%
Fixed 2,367 2,355 -0.5% 7,093 7,057 -0.5%
Of which Fixed Data* 880 951 8.0% 2,587 2,789 7.8%
Elimination and other income -515 -464 - -1,496 -1,377
Adjusted EBITDA 2,991 2,873 -4.0% 8,971 8,262 -7.9%
Margin (%) 57.5% 56.3% -1.2 pt 57.0% 55.5% -1.5 pt
Adjusted EBITA 2,019 1,964 -2.7% 6,056 5,489 -9.4%
Margin (%) 38.8% 38.5% -0.3 pt 38.5% 36.9% -1.6 pt
CAPEX(2) 319 578 81.3% 882 1,877 112.7%
Of which frequencies and licences
0 0 0 0
CAPEX/revenues (excluding frequencies and licences)
6.1% 11.3% 5.2 pt 5.6% 12.6% 7.0 pt
Adjusted CFFO 2,797 1,863 -33.4% 7,054 4,601 -34.8%
Net debt 14,314 11,541 -19.4% 14,314 11,541 -19.4%
Net debt/EBITDA(3) 1.0x 1.0x 1.1x 1.0x
*Fixed Data includes the Internet, TV on ADSL and Data services to companies. A calculation method has been changed
for an element of the Fixed Data affecting the background.
Revenues from activities in Morocco totalled MAD 14,878 million over the first nine months of 2021,
down 5.4% penalised by the decline in Mobile services. The continued growth of Fixed Data (+7.8%)
reduces the effects of the underperformance of Mobile, which continues to suffer from the
repercussions of the competitive and regulatory environment.
Over the same period, adjusted operating income before depreciation and amortization (EBITDA)
contracted by 7.9% compared to last year to MAD 8,262 million, due to the fall in revenues. The
adjusted EBITDA margin amounted to 55.5%.
Adjusted operating income (EBITA)(5) reached MAD 5,489 million, down 9.4%. The adjusted EBITA
margin was 36.9%.
Adjusted net cash flow from operations (CFFO)(6) in Morocco was down 34.8% in line with the
increase in investments.

5
Mobile
Unit 9M 2020 9M 2021 Change
Customer base(8) (000) 19,711 20,033 1.6%
Prepaid (000) 17,393 17,694 1.7%
Postpaid (000) 2,318 2,339 0.9%
Of which Internet 3G/4G+(9) (000) 11,335 11,517 1.6%
ARPU(10) (MAD/month) 55.1 49.5 -10.2%
As at 30 September 2021, the Mobile customer base(8) recorded a year-on-year increase of 1.6% to
more than 20.0 million customers, driven both by the Prepaid and Postpaid customer base (+1.7%
and 0.9% respectively) thanks to renewed activity this quarter after the reopening of borders.
Revenues from the Mobile activities dropped 9.2% due to the fall in outgoing and incoming revenues.
Incoming revenues continue to suffer from the decline in national call terminations while outgoing
revenues undergo from the effects of the regulatory and competitive environment.
At the end of the first nine months of 2021, mixed ARPU(10) amounted to MAD 49.5, down 10.2%
over one year.

6
Fixed-line and Internet
Unit 9M 2020 9M 2021 Change
Fixed lines (000) 1,991 1,984 -0.4%
High Speed Access(11) (000) 1,709 1,739 1.8%
At the end of September 2021, the Fixed customer base was almost stable over one year (-0.4%),
at nearly 2 million lines. The Fixed Broadband customer base grew by 1.8% to 1.7 million
subscribers, driven by record installations of Fiber Optics lines (+53%).
Fixed and Internet activities in Morocco generated revenues of MAD 7,057 million, down slightly by
0.5% compared to the same period in 2020. The 7.8% growth in Fixed Data largely offset the decline
in voice.

7
International
Financial indicators
(IFRS in MAD millions) Q3 2020 Q3 2021 Change
Change at constant exchange
rates (1)
9M 2020 9M 2021 Change
Change at constant exchange
rates (1)
Revenues 4,199 4,160 -0.9% 2.0% 12,517 12,676 1.3% 2.3%
Of which mobile services 3,881 3,840 -1.1% 1.9% 11,476 11,698 1.9% 3.0%
Adjusted EBITDA 1,767 1,796 1.7% 4.7% 5,389 5,567 3.3% 4.4%
Margin (%) 42.1% 43.2% 1.1 pt 1.1 pt 43.1% 43.9% 0.9 pt 0.9 pt
Adjusted EBITA 860 968 12.5% 15.8% 2,658 3,016 13.4% 14.7%
Margin (%) 20.5% 23.3% 2.8 pt 2.8 pt 21.2% 23.8% 2.6 pt 2.6 pt
CAPEX(2) 527 994 88.5% 92.5% 1,149 1,810 57.5% 59.3%
Of which frequencies and licences
11 123 - - 11 123 - -
CAPEX/revenues (excluding frequencies and licences)
12.3% 20.9% 8.6 pt 8.5 pt 9.1% 13.3% 4.2 pt 4.2 pt
Adjusted CFFO 1,324 1,046 -21.0% -18.6% 4,167 3,787 -9.1% -8.3%
Net debt 7,948 6,413 -19.3% -18.0% 7,948 6,413 -19.3% -18.0%
Net debt/EBITDA(3) 1.1x 0.8x - - 1.0x 0.8x - -
The Group’s international activities continued to grow and generated revenues of MAD 12,676
million, up 1.3% at end-September 2021 (+2.3% at constant exchange rates(1)). Mobile Data
and Mobile Money services remain the main growth drivers and posted respective increases
of +17.4% and +24.1%.
Adjusted earnings from operations before depreciation and amortization (EBITDA) for the first
nine months of 2021 amounted to MAD 5,567 million, up 3.3% (+4.4% at constant exchange
rates(1)). The adjusted EBITDA margin rate increased by 0.9 pt. This performance is mainly
linked to the improvement in the gross margin rate and ongoing efforts to optimise operating
costs.
Adjusted operating income (EBITA)(5) improved by 13.4% (+14.7% at constant exchange
rates(1)) to MAD 3,016 million, resulting in a 2.6 pt improvement in the margin rate.
Adjusted net cash flow from operations (CFFO)(6) decreased by 9.1% (-8.3% at constant
currency(1) ) to MAD 3,787 million due to the increase in investments.

8
Operational indicators
Unit 9M 2020 9M 2021 Change
Mobile
Customer base(8) (000) 46,606 48,546
Mauritania 2,572 2,753 7.1%
Burkina Faso 9,087 10,259 12.9%
Gabon 1,562 1,605 2.8%
Mali 8,572 8,011 -6.5%
Côte d’Ivoire 9,703 9,877 1.8%
Benin 4,541 4,995 10.0%
Togo 3,190 2,847 -10.8%
Niger 2,888 3,059 5.9%
Central African Republic 185 221 19.2%
Chad 4,306 4,919 14.2%
Fixed-Line
Customer base (000) 335 347
Mauritania 58 58 -0.8%
Burkina Faso 74 76 1.5%
Gabon 25 30 18.6%
Mali 178 184 3.8%
Fixed Broadband
Customer base (11) (000) 129 140
Mauritania 18 20 13.0%
Burkina Faso 14 15 6.3%
Gabon 21 26 24.6%
Mali 76 79 3.6%

9
Notes:
(1) Maintaining a constant exchange rate among the Moroccan dirham (MAD), the Mauritanian ouguiya (MRU) and the CFA franc. (2) Capital expenditure corresponds to acquisitions of property, plant and equipment and intangible assets recognised during the period. (3) The net debt/EBITDA ratio excludes the impact of IFRS 16. (4) Maroc Telecom consolidates in its financial statements Casanet and the Moov Africa subsidiaries in Mauritania, Burkina Faso, Gabon, Mali, Côte d’Ivoire, Benin, Togo, Niger, Central African Republic and Chad. (5) EBITA corresponds to operating profit before amortisation of intangible assets related to business combinations, impairment of goodwill and other intangible assets related to business combinations and other income and expenses related to financial investment transactions and transactions with shareholders (except when they are recognised directly in equity). (6) CFFO comprises the net cash flows from operating activities before taxes as presented in the cash flow statement, as well as dividends received from associates and non-consolidated equity interests. It also includes net capital expenditure, which corresponds to net cash outflows on acquisitions and disposals of property, plant and equipment and intangible assets. (7) Borrowings and other current and non-current liabilities less cash (and cash equivalents) including cash blocked for bank loans. (8) The active customer base consists of prepaid customers who have made or received a voice call (excluding calls from the public telecommunication network operator concerned or its Customer Relations Centres) or sent an SMS/MMS or who have used the Data services (excluding exchanges of technical data with the public telecommunication network operator concerned) in the past three months, and non-terminated postpaid customers. (9) The active customer base of the 3G and 4G+ Mobile Internet includes holders of a postpaid subscription contract (whether or not coupled with a voice offer) and holders of a prepaid subscription to the Internet service who have carried out at least one recharge during the past three months or whose credit is valid and who have used the service during this period. (10) ARPU (average revenues per user) is defined as revenues generated by incoming and outgoing calls and data services net of promotions, excluding roaming and equipment sales, divided by the average number of users in the period. This is the mixed ARPU of the prepaid and postpaid segments. (11) The broadband customer base includes ADSL, FTTH and leased connections and includes CDMA in Burkina Faso and Mali. Important Warning: Forward-looking statements. This press release contains forward-looking statements and items of a forward-looking nature relating to the
financial position, results of operations, strategy and outlook of Maroc Telecom and the impacts of certain operations. Although Maroc
Telecom believes that these forward-looking statements are based on reasonable assumptions, they do not constitute guarantees as to
the future performance of the company. Actual results may be very different from forward-looking statements due to a number of known
or unknown risks and uncertainties, most of which are beyond our control, including the risks described in public documents filed by Maroc
Telecom with the Moroccan Capital Market Authority (www.ammc.ma) and the French Financial Markets Authority (www.amf-france.org),
also available in French on our website (www.iam.ma). This press release contains forward-looking information that can only be assessed
on the day it is distributed. Maroc Telecom makes no commitment to supplement, update or modify these forward-looking statements due
to new information, a future event or any other reason, subject to applicable regulations, in particular Articles 2.19 et seq. of the circular of
the Moroccan Capital Market Authority and 223-1 et seq. of the general regulation of the French Financial Markets Authority.
Maroc Telecom is a global telecommunications operator in Morocco, a leader in all its business segments, fixed, mobile and
internet. It has grown internationally and is now present in eleven countries in Africa. Maroc Telecom is listed simultaneously in
Casablanca and Paris and its reference shareholders are the Société de Participation dans les Télécommunications (SPT)* (53%)
and the Kingdom of Morocco (22%).
* SPT is a company under Moroccan law controlled by Etisalat.
Contacts
Investor relations
Press relations
10
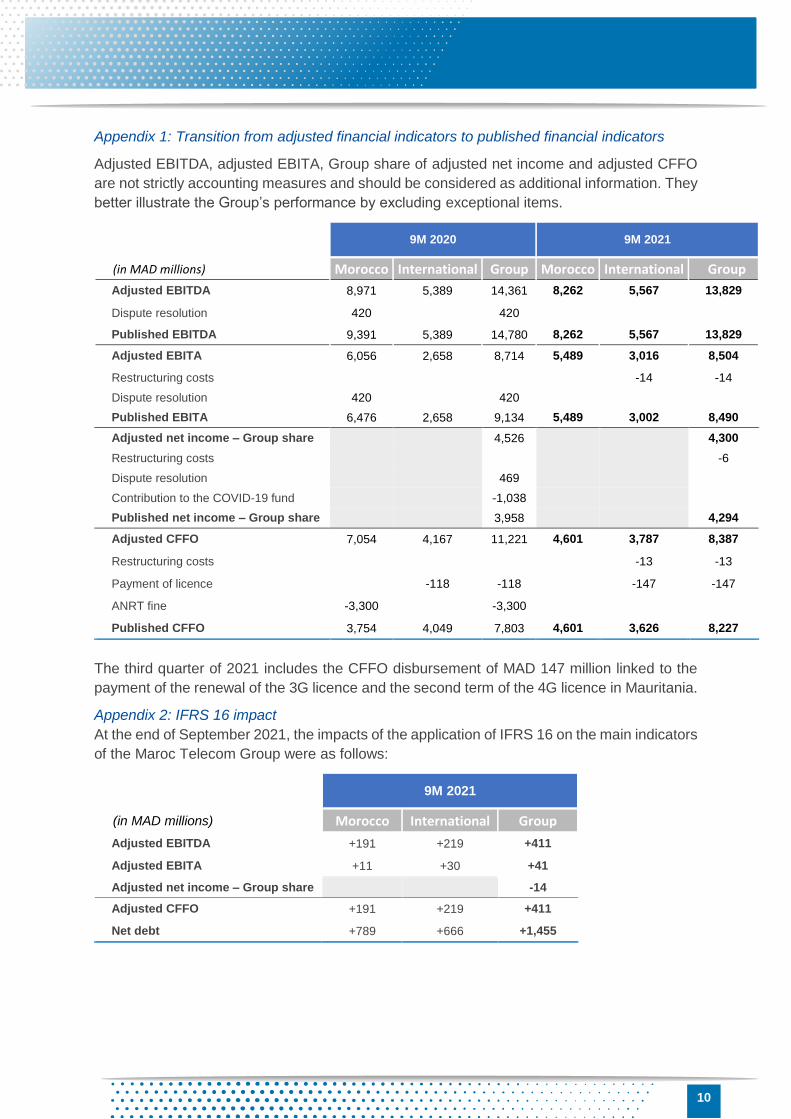
Appendix 1: Transition from adjusted financial indicators to published financial indicators
Adjusted EBITDA, adjusted EBITA, Group share of adjusted net income and adjusted CFFO
are not strictly accounting measures and should be considered as additional information. They
better illustrate the Group’s performance by excluding exceptional items.
9M 2020 9M 2021
(in MAD millions) Morocco International Group Morocco International Group
Adjusted EBITDA 8,971 5,389 14,361 8,262 5,567 13,829
Dispute resolution 420 420
Published EBITDA 9,391 5,389 14,780 8,262 5,567 13,829
Adjusted EBITA 6,056 2,658 8,714 5,489 3,016 8,504
Restructuring costs -14 -14
Dispute resolution 420 420
Published EBITA 6,476 2,658 9,134 5,489 3,002 8,490
Adjusted net income – Group share 4,526 4,300
Restructuring costs -6
Dispute resolution 469
Contribution to the COVID-19 fund -1,038
Published net income – Group share 3,958 4,294
Adjusted CFFO 7,054 4,167 11,221 4,601 3,787 8,387
Restructuring costs -13 -13
Payment of licence -118 -118 -147 -147
ANRT fine -3,300 -3,300
Published CFFO 3,754 4,049 7,803 4,601 3,626 8,227
The third quarter of 2021 includes the CFFO disbursement of MAD 147 million linked to the
payment of the renewal of the 3G licence and the second term of the 4G licence in Mauritania.
Appendix 2: IFRS 16 impact
At the end of September 2021, the impacts of the application of IFRS 16 on the main indicators
of the Maroc Telecom Group were as follows:
9M 2021
(in MAD millions) Morocco International Group
Adjusted EBITDA +191 +219 +411
Adjusted EBITA +11 +30 +41
Adjusted net income – Group share -14
Adjusted CFFO +191 +219 +411
Net debt +789 +666 +1,455