
CONSOLIDATED FINANCIAL STATEMENTS FOR THE...
76
CONSOLIDATED FINANCIAL STATEMENTS FOR THE YEAR ENDED 31 DECEMBER 2017
Transcript of CONSOLIDATED FINANCIAL STATEMENTS FOR THE...

CONSOLIDATED FINANCIAL STATEMENTS
FOR THE YEAR ENDED
31 DECEMBER 2017

DOHA BANK Q.P.S.C.
CONTENTS
CONSOLIDATED FINANCIAL STATEMENTS Page(s)
Independent auditor’s report 1-5
Consolidated statement of financial position 6
Consolidated income statement 7
Consolidated statement of comprehensive income 8
Consolidated statement of changes in equity 9-10
Consolidated statement of cash flows 11
Notes to the consolidated financial statements 12-72
Supplementary information 73-74


DOHA BANK Q.P.S.C. CONSOLIDATED INCOME STATEMENT For the year ended 31 December 2017 QAR ‘000s
The attached notes 1 to 36 form an integral part of these consolidated financial statements.
7
Notes 2017 2016
Interest income 21 3,630,853 3,168,995
Interest expense 22 (1,375,382) (1,108,349)
Net interest income 2,255,471 2,060,646
Fee and commission income 23 516,313 502,948
Fee and commission expense 24 (51,788) (43,169)
Net fee and commission income 464,525 459,779
Gross written premium 62,315 65,237
Premium ceded (17,195) (33,794)
Net claims paid (37,918) (23,419)
Net income from insurance activities 7,202 8,024
Net foreign exchange gain 25 106,544 102,246
Income from investment securities 26 49,822 55,584
Other operating income 27 62,276 54,879
218,642 212,709
Net operating income 2,945,840 2,741,158
Staff costs 28 (531,109) (516,304)
Depreciation 13 (98,820) (93,642)
Impairment loss on investment securities 11 (142,067) (139,499)
Net impairment loss on loans and advances to customers 10 (592,541) (480,224)
Other expenses 29 (472,664) (459,445)
(1,837,201) (1,689,114)
Profit before share of results of associate 1,108,639 1,052,044
Share of results of associate 12 158 (46)
Profit before tax 1,108,797 1,051,998
Income tax reversal 30 1,277 1,783
Profit 1,110,074 1,053,781
Earnings per share:
Basic and diluted earnings per share (QAR) 31 3.02 3.12

DOHA BANK Q.P.S.C. CONSOLIDATED STATEMENT OF COMPREHENSIVE INCOME For the year ended 31 December 2017 QAR ‘000s
The attached notes 1 to 36 form an integral part of these consolidated financial statements.
8
Note 2017 2016
Profit 1,110,074 1,053,781
Other comprehensive income:
Items that are or may be subsequently reclassified to income statement:
Foreign currency translation differences for foreign operations 11,540 (5,166)
Net movement in fair value of available-for-sale investment
securities 20 (d) 35,857 166,264
Other comprehensive income 47,397 161,098
Total comprehensive income 1,157,471 1,214,879

DOHA BANK Q.P.S.C. CONSOLIDATED STATEMENT OF CHANGES IN EQUITY For the year ended 31 December 2017 QAR ‘000s
The attached notes 1 to 36 form an integral part of these consolidated financial statements.
9
Equity attributable to shareholders of the Bank
Share
capital
Legal
reserve
Risk
reserve
Fair
value
reserve
Foreign
currency
translation
reserve
Retained
earnings
Total
Instruments
eligible as
additional
capital
Total
equity
Balance as at 1 January 2017 2,583,723 4,317,561 1,372,000 (103,412) (24,991) 1,235,654 9,380,535 4,000,000 13,380,535
Total comprehensive income:
Profit - - - - - 1,110,074 1,110,074 - 1,110,074
Other comprehensive income - - - 35,857 11,540 - 47,397 - 47,397
Total comprehensive income - - - 35,857 11,540 1,110,074 1,157,471 - 1,157,471
Transfer to legal reserve - 85 - - - (85) - - -
Transfer to risk reserve - - - - - - - - -
Distribution for Tier 1 capital notes - - - - - (220,000) (220,000) - (220,000)
Contribution to social and sports fund - - - - - (27,752) (27,752) - (27,752)
Increase in share capital (note 20 a) 516,744 775,116 - - - - 1,291,860 - 1,291,860
Dividends paid (note 20 f) - - - - - (775,117) (775,117) - (775,117)
Balance as at 31 December 2017 3,100,467 5,092,762 1,372,000 (67,555) (13,451) 1,322,774 10,806,997 4,000,000 14,806,997

DOHA BANK Q.P.S.C. CONSOLIDATED STATEMENT OF CHANGES IN EQUITY (CONTINUED) For the year ended 31 December 2017 QAR ‘000s
The attached notes 1 to 36 form an integral part of these consolidated financial statements.
10
Equity attributable to shareholders of the Bank
Share
capital
Legal
reserve
Risk
reserve
Fair
value
reserve
Foreign
currency
translation
reserve
Retained
earnings
Total
Instruments
eligible as
additional
capital
Total
equity
Balance as at 1 January 2016 2,583,723 4,316,950 1,292,000 (269,676) (19,825) 1,283,946 9,187,118 4,000,000 13,187,118
Total comprehensive income:
Profit - - - - - 1,053,781 1,053,781 - 1,053,781
Other comprehensive income - - - 166,264 (5,166) - 161,098 - 161,098
Total comprehensive income - - - 166,264 (5,166) 1,053,781 1,214,879 - 1,214,879
Transfer to legal reserve - 611 - - - (611) - - -
Transfer to risk reserve - - 80,000 - - (80,000) - - -
Distribution for Tier 1 capital notes - - - - - (220,000) (220,000) - (220,000)
Contribution to social and sports fund - - - - - (26,345) (26,345) - (26,345)
Dividends paid (Note 20 f) - - - - - (775,117) (775,117) - (775,117)
Balance as at 31 December 2016 2,583,723 4,317,561 1,372,000 (103,412) (24,991) 1,235,654 9,380,535 4,000,000 13,380,535

DOHA BANK Q.P.S.C. CONSOLIDATED STATEMENT OF CASH FLOWS For the year ended 31 December 2017 QAR ‘000s
The attached notes 1 to 36 form an integral part of these consolidated financial statements.
11
Notes 2017 2016
Cash flows from operating activities
Profit before tax 1,108,797 1,051,998
Adjustments for:
Net impairment loss on loans and advances to customers 10 592,541 480,224
Impairment loss on investment securities 11 142,067 139,499
Depreciation 13 98,820 93,642
Amortisation of financing cost 44,121 11,502
Net (gains) / loss on investment securities 26 (10,571) 5,095
Loss on sale of property, plant and equipment 83 446
Share of results of the associate 12 (158) 46
Profit before changes in operating assets and liabilities 1,975,700 1,782,452
Change in due from banks 1,663,729 541,188
Change in loans and advances to customers (1,294,604) (4,480,255)
Change in other assets (41,430) (173,003)
Change in due to banks (1,270,275) 3,499,206
Change in customer deposits 3,738,376 2,963,337
Change in other liabilities (40,483) 51,487
Social and sports fund contribution (26,345) (34,343)
Income tax paid 1,277 1,783
Net cash from operating activities 4,705,945 4,151,852
Cash flows from investing activities
Acquisition of investment securities (7,634,121) (8,066,482)
Proceeds from sale of investment securities 4,731,199 5,578,839
Acquisition of property, furniture and equipment 13 (36,684) (89,143)
Proceeds from the sale of property, furniture and equipment 46 9,997
Net cash used in investing activities (2,939,560) (2,566,789)
Cash flows from financing activities
Proceeds from other borrowings 18 438,462 1,541,940
Proceeds from right issues 1,291,860 -
Repayment of debt security (1,823,000) (773,273)
Proceeds from issue of debt securities 661,071 -
Distribution on Tier 1 capital notes (170,000) (220,000)
Dividends paid (775,117) (775,117)
Net cash used in from financing activities (376,724) (226,450)
Net increase in cash and cash equivalents 1,389,661 1,358,613
Cash and cash equivalents as at 1 January 8,916,014 7,557,401
Cash and cash equivalents at 31 December 33 10,305,675 8,916,014
Net cash flows from operating activities:
Interest received 3,606,557 3,200,642
Interest paid 1,292,252 1,041,332
Dividends received 39,251 48,215

DOHA BANK Q.P.S.C. NOTES TO THE CONSOLIDATED FINANCIAL STATEMENTS As at and for the year ended 31 December 2017 QAR ‘000s
12
1 REPORTING ENTITY
Doha Bank Q. P. S. C. (“Doha Bank” or the “Bank”) is an entity domiciled in the State of Qatar and was incorporated
on 15 March 1979 as a Joint Stock Company under Emiri Decree No. 51 of 1978. The commercial registration of
the Bank is 7115. The address of the Bank’s registered office is Doha Bank Tower, Corniche Street, West Bay, P.O.
Box 3818, Doha, Qatar.
Doha Bank is engaged in conventional banking activities and operates through its head office in Qatar (Doha) and
27 local branches, six overseas branches in the United Arab Emirates (Dubai & Abu Dhabi), State of Kuwait, the
Republic of India (two branches in Mumbai and one branch in Kochi) and representative offices in United Kingdom,
Singapore, Turkey, China, Japan, South Korea, Germany, Australia, Hong Kong, United Arab Emirates (Sharjah),
Canada, Bangladesh and South Africa. The consolidated financial statements for the year ended 31 December 2017
comprise the Bank and its subsidiaries (together referred to as “the Group”).
The principal subsidiaries of the Group are as follows:
Percentage of ownership
Company’s name Country of
incorporation
Company’s
capital
Company’s
activities 2017 2016
Doha Bank Assurance
Company L.L.C.
Qatar
100,000
General
Insurance
100%
100%
Doha Finance Limited Cayman Island 182 Debt Issuance 100% 100%
DB Securities Limited Cayman Island 182 Derivatives
Transactions 100% -
2 BASIS OF PREPARATION
a) Statement of compliance
The consolidated financial statements of the Group (“consolidated financial statements”) have been prepared in
accordance with International Financial Reporting Standards (“IFRS”) issued by the International Accounting
Standards Board (“IASB”) and the applicable provisions of the Qatar Central Bank (“QCB”) regulations.
b) Basis of measurement
The consolidated financial statements have been prepared on the historical cost basis except for the derivative
financial instruments, financial assets held for trading and available-for-sale financial assets that have been
measured at fair value. In addition, the carrying values of recognised assets that are hedged items in fair value
hedges, and otherwise carried at amortised cost, are adjusted to record changes in fair value attributable to the risk
that are being hedged.
c) Functional and presentation currency These consolidated financial statements are presented in Qatari Riyals (“QAR”), which is the Group’s functional
and presentation currency. Except as otherwise indicated, financial information presented in QAR has been rounded
to the nearest thousand.
d) Use of estimates and judgements The preparation of the consolidated financial statements in conformity with IFRS requires management to make
judgements, estimates and assumptions that affect the application of accounting policies and the reported amounts
of assets, liabilities, income and expenses, and the accompanying disclosures, and the disclosure of contingent
liabilities Actual results may differ from these estimates.
Estimates and underlying assumptions are reviewed on an ongoing basis. Revisions to accounting estimates are
recognised in the period in which the estimate is revised and in any future periods affected. Information about
significant areas of estimation uncertainty and critical judgements in applying accounting policies that have the
most significant effect on the amounts recognised in the consolidated financial statements are described in note 5.

DOHA BANK Q.P.S.C. NOTES TO THE CONSOLIDATED FINANCIAL STATEMENTS As at and for the year ended 31 December 2017 QAR ‘000s
13
3 SIGNIFICANT ACCOUNTING POLICIES
a) New and amended standards and interpretations adopted by the Group
The accounting policies adopted in the preparation of the consolidated financial statements are consistent with those
of the previous financial year, except for the following new and amended IFRS recently issued by the IASB and
International Financial Reporting Interpretations Committee (“IFRIC”) interpretations effective as of 1 January
2017.
The following standards, amendments and interpretations, which became effective as of 1 January 2017, are relevant
to the Group:
i) Disclosure Initiative (Amendments to IAS 7)
The amendments require disclosures that enable users of (consolidated) financial statements to evaluate changes
in liabilities arising from financing activities, including both changes arising from cash flow and non-cash
changes.
The adoption of this amendment had no significant impact on the consolidated financial statements.
ii) Recognition of Deferred Tax Assets for Unrealized Losses (Amendments to IAS 12)
The amendments clarify the accounting for deferred tax assets for unrealized losses on debt instruments measured
at fair value.
The amendments clarify that the existence of a deductible temporary difference depends solely on a comparison of
the carrying amount of an asset and its tax base at the end of the reporting period, and is not affected by possible
future changes in the carrying amount or expected manner of recovery of the asset. Therefore, assuming that the tax
base remains at the original cost of the debt instrument, there is a temporary difference.
The adoption of this standard had no significant impact on the consolidated financial statements.
iii) Annual Improvements to IFRSs 2012–2014 Cycle – various standards
The annual improvements to IFRSs to 2014-2016 cycles include certain amendments to various IFRSs.
Standards issued but not yet effective
A number of new standards and amendments to standards are effective for annual periods beginning after 1 January
2017 and earlier application is permitted; however; the Group has not early applied the following new or amended
standards in preparing these consolidated financial statements.
i) IFRS 9 Financial Instruments
The Bank will adopt IFRS 9 on 1 January 2018 and will not restate the comparative information in accordance with
applicable Qatar Central Bank (QCB) guidelines. IFRS 9 will replace IAS 39 Financial Instruments: Recognition
and Measurement and introduces new requirements for the classification and measurement of financial assets and
financial liabilities, a new model based on expected credit losses for recognizing loan loss provisions and provides
for simplified hedge accounting by aligning hedge accounting more closely with an entity’s risk management
methodology.

DOHA BANK Q.P.S.C. NOTES TO THE CONSOLIDATED FINANCIAL STATEMENTS As at and for the year ended 31 December 2017 QAR ‘000s
14
3 SIGNIFICANT ACCOUNTING POLICIES (CONTINUED)
Standards issued but not yet effective (continued)
i) IFRS 9 Financial Instruments (continued)
The Bank has assessed the estimated impact that the initial application of IFRS 9 will have on its consolidated
financial statements as below.
Retained
earnings
Fair value
reserve
Closing balance under IAS 39 (31 December 2017) 1,322,774 (67,555)
Estimated risk reserve transfer on 1 January 2018 1,372,000 -
Impact on reclassification and remeasurements (a) :
Investment securities (equity) from available-for-sale to those measured at fair
value through other comprehensive income (a.1) 157,401
(157,401)
Investment securities (debt) from held to maturity to those measured at fair value
through other comprehensive income (a.2) -
(1,216)
Investment securities (equity) from available-for-sale to those measured at fair
value through profit or loss (a.3) 7,546
(7,546)
Investment securities (mutual funds) from available-for-sale to those measured
at fair value through profit or loss (a.3) 7,441
(7,441)
Investment securities (debt) from available-for-sale to those measured at
amortized cost (a.4) -
(38)
172,388 (173,642)
Impact on recognition of Expected Credit Losses (b)
Expected credit losses for due from banks (17,179) -
Expected credit losses from debt securities at amortized cost (1,418)
Expected credit losses for debt securities at fair value through other
comprehensive income (10,319)
-
Expected credit losses for loan and advances (1,305,554) -
Expected credit losses for off balance sheet exposures subject to credit risk (344,261) -
(1,678,731) -
Estimated adjusted opening balance under IFRS 9 on date of initial
application of 1 January 2018 1,188,431
(241,197)
The above assessment is preliminary because not all transition work has been finalised. The actual impact of adopting
IFRS 9 on 1 January 2018 may change because:
• IFRS 9 will require the Bank to revise its accounting processes and internal controls and these changes are not
yet complete;
• although parallel runs were carried out in the second half of 2017, the new systems and associated controls in
place have not been operational for a more extended period;
• the Bank has not finalized the testing and assessment of controls over its new IT systems and changes to its
governance framework;
• the Bank is refining and finalizing its models for ECL calculations; and
• the new accounting policies, assumptions, judgements and estimation techniques employed are subject to re-
assessment and changes upon instructions of the regulatory authority.
(a) Classification and measurement
IFRS 9 contains a new classification and measurement approach for financial assets that reflects the business model
in which financial assets are managed and the underlying cash flow characteristics. IFRS 9 contains three principal
classification categories for financial assets: measured at Amortised Cost (AC), Fair Value through Other
Comprehensive Income (FVOCI) and Fair Value through Profit or Loss (FVPL). Under IFRS 9, derivatives embedded
in contracts where the host is a financial asset are never bifurcated. Instead, the hybrid financial instrument as a whole
is assessed for classification.
Based on the Bank’s assessment, the new IFRS 9 classification requirements is expected to have a material impact on
its accounting for loans, investments in debt securities and investments in equity securities as follows and will be
adjusted in the financial statements for the period starting 1 January 2018:

DOHA BANK Q.P.S.C. NOTES TO THE CONSOLIDATED FINANCIAL STATEMENTS As at and for the year ended 31 December 2017 QAR ‘000s
15
(a.1) At 31 December 2017, the Bank had equity investments classified as available-for-sale with a fair value of QAR
701.6 million that are held for long-term strategic purposes. Under IFRS 9, the Bank has designated these investments
as measured at FVOCI. Due to this reclassification, an increase of QAR 157.4 million is estimated in the retained
earnings along with a corresponding decrease in fair value reserve due to reclassification of impairment on equity
investments measured at fair value through other comprehensive income to the reserves.
(a.2) At 31 December 2017, the Bank had debt investments classified as held-to-maturity with a carrying value of
QAR 1,986 million. Under IFRS 9, the Bank has designated these investments as measured at FVOCI based on the
business model. Due to this reclassification, a decrease of QAR 1.2 million is estimated in the fair value reserve.
(a.3) At 31 December 2017, the Bank had investments in mutual funds and equity instruments classified as available-
for-sale with carrying values of QAR 58.5 million and QAR 122.4 million respectively. Under IFRS 9, the Bank has
designated these investments as measured at FVTPL based on the business model. Due to this reclassification, an
increase of QAR 15 million is estimated in the retained earnings and equivalent decrease is estimated in fair value
reserve.
(a.4) At 31 December 2017, the Bank had debt investments classified as available-for-sale with a carrying value of
QAR 670.1 million. Under IFRS 9, the Bank has designated these investments as measured at amortised cost based
on the business model. Due to this reclassification, a decrease of QAR 0.04 million is estimated in the fair value
reserve.
(b) Expected credit losses
IFRS 9 replaces the ‘incurred loss’ model in IAS 39 with a forward-looking ‘expected credit loss’ (ECL) model.
The new impairment model will apply to financial assets measured at amortised cost or FVOCI, except for
investments in equity instruments. A number of significant judgements are also required in applying the accounting
requirements for measuring ECL, such as:
Determining criteria for significant increase in credit risk (SICR);
Choosing appropriate models and assumptions for the measurement of ECL;
Establishing the number and relative weightings of forward-looking scenarios for each type of
product/market and the associated ECL; and
Establishing Banks of similar financial assets for the purposes of measuring ECL.
(c) Financial liabilities
Most of the requirements in IAS 39 for classification and measurement of financial liabilities were carried forward
unchanged to IFRS 9. The key change is that an entity will be required to present the effects of changes in own credit
risk of financial liabilities designated at fair value through profit or loss in other comprehensive income.
No significant changes are expected for financial liabilities, other than changes in the fair value of financial
liabilities designated at FVTPL that are attributable to changes in the instrument's credit risk, which will be
presented in other comprehensive income.
(d) Hedge accounting
IFRS 9’s hedge accounting requirements are designed to align the accounting more closely to the risk management
framework; permit a greater variety of hedging instruments; and remove or simplify some of the rule-based
requirements in IAS 39. The elements of hedge accounting: fair value, cash flow and net investment hedges are
retained.
When initially applying IFRS 9, the Bank has the option to continue to apply the hedge accounting requirements of
IAS 39 instead of the requirements in IFRS 9. However, the Bank determined that all existing hedge relationships that
are currently designated in effective hedging relationships would continue to qualify for hedge accounting under IFRS
9. The new hedge accounting requirements under IFRS 9 will not have a material impact on hedge accounting applied
by the Bank.
(e) Disclosure
IFRS 9 also introduces expanded disclosure requirements and changes in presentation. These are expected to change
the nature and extent of the Bank’s disclosures about its financial instruments particularly in the year of the adoption
of IFRS 9.
i) IFRS 15 Revenue from Contracts with Customers
IFRS 15 establishes a comprehensive framework for determining whether, how much and when revenue is
recognised. It replaces existing revenue recognition guidance, including IAS 18 Revenue, IAS 11 Construction
Contracts and IFRIC 13 Customer Loyalty Programmes.
IFRS 15 is effective for annual reporting periods beginning on or after 1 January 2018, with early adoption
permitted.

DOHA BANK Q.P.S.C. NOTES TO THE CONSOLIDATED FINANCIAL STATEMENTS As at and for the year ended 31 December 2017 QAR ‘000s
16
3 SIGNIFICANT ACCOUNTING POLICIES (CONTINUED)
Standards issued but not yet effective (continued)
ii) IFRS 15 Revenue from Contracts with Customers (continued)
The Group plans to adopt IFRS 15 using the cumulative effect method, with the effect of initially applying this
standard recognised at the date of initial application (i.e. 1 January 2018). As a result, the Group will not apply the
requirements of IFRS 15 to the comparative period presented.
The Group has assessed the impact of IFRS 15 and expects that the standard will have no material effect, when
applied, on the consolidated financial statements of the Group.
iii) IFRS 16 Leases
IFRS 16 introduces a single, on-balance lease sheet accounting model for lessees. A lessee recognises a right-of-
use asset representing its right to use the underlying asset and a lease liability representing its obligation to make
lease payments. There are optional exemptions for short-term leases and leases of low value items. Lessor
accounting remains similar to the current standard- i.e. lessors continue to classify leases as finance or operating
leases.
IFRS 16 replaces existing leases guidance including IAS 17 Leases, IFRIC 4 Determining whether an Arrangement
contains a Lease, SIC-15 Operating Leases-Incentives and SIC-27 Evaluating the Substance of Transactions
Involving the Legal Form of a Lease.
The standard is effective for annual periods beginning on or after 1 January 2019. Early adoption is permitted for
entities that apply IFRS 15 Revenue from Contracts with Customers at or before the date of initial application of
IFRS 16. The Group is currently performing an initial assessment of the potential impact of the adoption of IFRS
16 on its consolidated financial statements.
b) Basis of consolidation
The consolidated financial statements comprise the financial statements of the Bank and its subsidiaries (“the
Group”) as at 31 December 2017. Control is achieved when the Group is exposed, or has rights, to variable returns
from its involvement with the investee and has the ability to affect those returns through its power over the investee.
Specifically, the Group controls an investee if and only if the Group has:
Power over the investee
Exposure, or rights, to variable returns from its involvement with the investee, and
The ability to use its power over the investee to affect its returns
When the Group has less than a majority of the voting or similar rights of an investee, the Group considers all
relevant facts and circumstances in assessing whether it has power over an investee.

DOHA BANK Q.P.S.C. NOTES TO THE CONSOLIDATED FINANCIAL STATEMENTS As at and for the year ended 31 December 2017 QAR ‘000s
17
3 SIGNIFICANT ACCOUNTING POLICIES (CONTINUED)
b) Basis of consolidation (continued) The Group re-assesses whether or not it controls an investee if facts and circumstances indicate that there are
changes to one or more of the three elements of control. Consolidation of a subsidiary begins when the Group
obtains control over the subsidiary and ceases when the Group loses control of the subsidiary. Assets, liabilities,
income and expenses of a subsidiary acquired or disposed of during the year are included in the consolidated
statement of income and consolidated statement of other comprehensive income from the date the Group gains
control until the date the Group ceases to control the subsidiary.
Profit or loss and each component of Other Comprehensive Income (“OCI”) are attributed to the equity holders of
the parent of the Group and to the non-controlling interests, even if this results in the non-controlling interests
having a deficit balance. These consolidated financial statements are prepared using uniform accounting policies
for like transactions and other events in similar circumstances. When necessary, adjustments are made to the
financial statements of subsidiaries to bring their accounting policies into line with the Group’s accounting policies.
All intra-group assets and liabilities, equity, income, expenses and cash flows relating to transactions between
members of the Group are eliminated in full on consolidation.
A change in the ownership interest of a subsidiary, without a loss of control, is accounted for as an equity transaction.
c) Business combinations and goodwill
Business combinations are accounted for using the acquisition method. The cost of an acquisition is measured as
the aggregate of the consideration transferred, which is measured at acquisition date fair value, and the amount of
any non-controlling interests in the acquiree. For each business combination, the Group elects whether to measure
the non-controlling interests in the acquiree at fair value or at the proportionate share of the acquiree’s identifiable
net assets. Acquisition-related costs are expensed as incurred and included in administrative expenses.
When the Group acquires a business, it assesses the financial assets and liabilities assumed for appropriate
classification and designation in accordance with the contractual terms, economic circumstances and pertinent
conditions as at the acquisition date. This includes the separation of embedded derivatives in host contracts by the
acquiree.
Any contingent consideration to be transferred by the acquirer will be recognised at fair value at the acquisition
date. Contingent consideration classified as an asset or liability that is a financial instrument and within the scope
of IAS 39 Financial Instruments: Recognition and Measurement, is measured at fair value with the changes in fair
value recognised in the income statement.
Goodwill is initially measured at cost (being the excess of the aggregate of the consideration transferred and the
amount recognised for non-controlling interests) and any previous interest held over the net identifiable assets
acquired and liabilities assumed. If the fair value of the net assets acquired is in excess of the aggregate consideration
transferred, the Group re-assesses whether it has correctly identified all of the assets acquired and all of the liabilities
assumed and reviews the procedures used to measure the amounts to be recognised at the acquisition date. If the
reassessment still results in an excess of the fair value of net assets acquired over the aggregate consideration
transferred, then the gain is recognised in income statement.
After initial recognition, goodwill is measured at cost less any accumulated impairment losses. For the purpose of
impairment testing, goodwill acquired in a business combination is, from the acquisition date, allocated to each of
the Group’s cash-generating units that are expected to benefit from the combination, irrespective of whether other
assets or liabilities of the acquiree are assigned to those units.
Where goodwill has been allocated to a cash-generating unit (CGU) and part of the operation within that unit is
disposed of, the goodwill associated with the disposed operation is included in the carrying amount of the operation
when determining the gain or loss on disposal. Goodwill disposed in these circumstances is measured based on the
relative values of the disposed operation and the portion of the cash-generating unit retained.
d) Associates
Associates are entities over which the Group has significant influence. Significant influence is the power to
participate in the financial and operating policy decisions of the investee, but not control or joint control over those
policies.
Investments in associates are accounted for by the equity method of accounting and are initially recognised at cost
including transaction costs directly related to acquisition of investment in associate.

DOHA BANK Q.P.S.C. NOTES TO THE CONSOLIDATED FINANCIAL STATEMENTS As at and for the year ended 31 December 2017 QAR ‘000s
18
3 SIGNIFICANT ACCOUNTING POLICIES (CONTINUED)
d) Associates (continued) The Group’s share of its associate’s post-acquisition profits or losses is recognised in the consolidated income
statement; its share of post-acquisition movements in equity is recognised in reserves. The cumulative post-
acquisition movements are adjusted against the carrying amount of the investment. When the Group’s share of
losses in an associate equals or exceeds its interest in the associate, including any other unsecured receivables, the
Group does not recognise further losses, unless it has incurred obligations or made payments on behalf of the
associate.
Intergroup gains on transactions between the Group and its associates are eliminated to the extent of the Group’s
interest in the associates. Intergroup losses are also eliminated unless the transaction provides evidence of an
impairment of the asset transferred.
The Group’s share of the results of associates is based on financial statements and adjusted to conform to the
accounting policies of the Group. Intergroup gains on transactions are eliminated to the extent of the Group’s interest
in the investee. Intergroup losses are also eliminated unless the transaction provides evidence of impairment in the
asset transferred.
The consolidated financial statements of the Group include the associate stated below:
Company name
Country of
incorporation Ownership interest Principal
and operation % activity
2017 2016
Doha Brokerage and Financial Services
Limited
India
44.02%
44.02%
Brokerage and assets
management
e) Foreign currency
Foreign currency transactions and balances
Foreign currency transactions that are transactions denominated, or that require settlement in a foreign currency are
translated into the respective functional currencies of the operations at the spot exchange rates at the dates of the
transactions.
Monetary assets and liabilities denominated in foreign currencies at the reporting date are translated into the
functional currency at the spot exchange rate at that date. Non-monetary assets and liabilities denominated in foreign
currencies that are measured at fair value are retranslated into the functional currency at the spot exchange rate at
the date that the fair value was determined. Non-monetary assets and liabilities that are measured in terms of
historical cost in a foreign currency are translated using the exchange rate at the date of the transaction.
Foreign currency differences resulting from the settlement of foreign currency transactions and arising on translation
at period end exchange rates of monetary assets and liabilities denominated in foreign currencies are recognised in
profit or loss.
f) Foreign operations
The results and financial position of all the Group’s entities that have a functional currency different from the
presentation currency are translated into the presentation currency as follows:
assets and liabilities for each statement of financial position presented are translated at the closing rate
at the reporting date;
income and expenses for each income statement are translated at average exchange rates; and
all resulting exchange differences are recognised in other comprehensive income.
Exchange differences arising from the above process are reported in shareholders’ equity as ‘foreign currency
translation reserve’.
On consolidation, exchange differences arising from the translation of the net investment in foreign entities, and of
borrowings and other currency instruments designated as hedges of such investments, are taken to ‘Other
comprehensive income’. When a foreign operation is disposed of, or partially disposed of, such exchange
differences are recognised in the consolidated income statement as part of the gain or loss on sale.

DOHA BANK Q.P.S.C. NOTES TO THE CONSOLIDATED FINANCIAL STATEMENTS As at and for the year ended 31 December 2017 QAR ‘000s
19
3 SIGNIFICANT ACCOUNTING POLICIES (CONTINUED)
g) Financial assets and financial liabilities
i) Recognition and initial measurement
All financial assets and liabilities are initially recognised on the trade date, i.e., the date that the Group becomes a
party to the contractual provisions of the instrument. This includes “regular way trades”: purchases or sales of
financial assets that require delivery of assets within the time frame generally established by regulation or
convention in the market place.
A financial asset or financial liability is measured initially at fair value plus, for an item not at fair value through
profit or loss, transaction costs that are directly attributable to its acquisition or issue.
ii) Classification
The classification of financial instruments at initial recognition depends on their purpose and characteristics and the
management’s intention in acquiring them.
Financial assets
At inception, a financial asset is classified in one of the following categories:
loans and receivables;
held to maturity (HTM);
available-for-sale (AFS); or
fair value through profit of loss (FVTPL)
Financial liabilities
The Group has classified and measured its financial liabilities at amortised cost.
iii) Derecognition
The Group derecognises a financial asset when the contractual rights to the cash flows from the financial asset
expire, or when it transfers the financial asset in a transaction in which substantially all the risks and rewards of
ownership of the financial asset are transferred or in which the Group neither transfers nor retains substantially all
the risks and rewards of ownership and it does not retain control of the financial asset. Any interest in transferred
financial assets that qualify for derecognition that is created or retained by the Group is recognised as a separate
asset or liability in the statement of financial position. On derecognition of a financial asset, the difference between
the carrying amount of the asset and consideration received including any new asset obtained less any new liability
assumed is recognised in profit or loss.
The Group enters into transactions whereby it transfers assets recognised on its statement of financial position, but
retains either all or substantially all of the risks and rewards of the transferred assets or a portion of them. If all or
substantially all risks and rewards are retained, then the transferred assets are not derecognised. Transfers of assets
with retention of all or substantially all risks and rewards include, for example, securities lending and repurchase
transactions.
In transactions in which the Group neither retains nor transfers substantially all the risks and rewards of ownership
of a financial asset and it retains control over the asset, the Group continues to recognise the asset to the extent of
its continuing involvement, determined by the extent to which it is exposed to changes in the value of the transferred
asset. The transferred asset is derecognised if it meets the derecognition criteria. An asset or liability is recognised
for the servicing contract, depending on whether the servicing fee is more than adequate (asset) or is less than
adequate (liability) for performing the servicing.
The Group derecognises a financial liability when its contractual obligations are discharged or cancelled or expire.
iv) Offsetting
Financial assets and liabilities are offset and the net amount presented in the consolidated statement of financial
position when, and only when, the Group has a currently enforceable legal right to set off the recognised amounts
and it intends either to settle on a net basis or to realise the asset and settle the liability simultaneously.

DOHA BANK Q.P.S.C. NOTES TO THE CONSOLIDATED FINANCIAL STATEMENTS As at and for the year ended 31 December 2017 QAR ‘000s
20
3 SIGNIFICANT ACCOUNTING POLICIES (CONTINUED)
g) Financial assets and financial liabilities (continued)
v) Measurement principles
Amortised cost measurement
The amortised cost of a financial asset or liability is the amount at which the financial asset or liability is measured
at initial recognition, minus principal repayments, plus or minus the cumulative amortisation using the effective
interest method of any difference between the initial amount recognised and the maturity amount, minus any
reduction for impairment loss. Amortised cost is calculated by taking into account any discount or premium on
acquisition and fees that are integral part of the effective interest rate.
Fair value measurement
Fair value is the price that would be received to sell an asset or paid to transfer a liability in an orderly transaction
between market participants at the measurement date. The fair value measurement is based on the presumption that
the transaction to sell the asset or transfer the liability takes place either:
In the principal market for the asset or liability, or
In the absence of a principal market, in the most advantageous market for the asset or liability
The fair value for financial instruments traded in active markets at the reporting date is based on their quoted market
price or dealer price quotations (bid price for long positions and ask price for short positions), without any deduction
for transaction costs.
For the financial instruments that are not traded in an active market, the fair value is determined by using appropriate
valuation techniques. Valuation techniques include the discounted cash flow method, comparison with similar
instruments for which market observable prices exist, options pricing models, credit models and other relevant
valuation models.
The fair value of investments in mutual funds and portfolios whose units are unlisted are measured at the net asset
value provided by the fund manager.
The foreign currency forward contracts are measured based on observable spot exchange rates, the yield curves of
the respective currencies as well as the currency basis spreads between the respective currencies. All contracts are
fully cash collateralised, thereby eliminating both counterparty and the Group’s own credit risk.
The fair value of unquoted derivatives is determined by discounted cash flows. For the purpose of fair value
disclosures, the Group has determined classes of assets and liabilities on the basis of the nature, characteristics and
risks of the asset or liability and the level of the fair value hierarchy as explained in note 5.
Identification and measurement of impairment The Group assesses at each reporting date whether there is any objective evidence that a financial asset or a group
of financial assets is impaired. A financial asset or a group of financial assets is impaired when objective evidence
demonstrates that a loss event has occurred after the initial recognition of the assets, and that the loss event has an
impact on the future cash flows of the assets that can be estimated reliably.
Objective evidence that financial assets including equity securities are impaired can include significant financial
difficulty of the borrower or issuer, default or delinquency by a borrower, restructuring of a loan or advance by the
Group on terms that the Group would not otherwise consider, indications that a borrower or issuer will enter
bankruptcy, the disappearance of an active market for a security, or other observable data relating to a group of
assets such as adverse changes in the payment status of borrowers or issuers in the group, or economic conditions
that correlate with defaults in the group.
The Group considers evidence of impairment loss for loans and advances to customers and held-to-maturity
investment securities at both a specific asset and collective level. All individually significant loans and advances to
customers and held-to-maturity investment securities are assessed for specific impairment. All individually
significant loans and advances to customers and held-to-maturity investment securities found not to be specifically
impaired are then collectively assessed for any impairment that has been incurred but not yet identified. Loans and
advances to customers and held-to-maturity investment securities that are not individually significant are
collectively assessed for impairment by grouping together loans and advances to customers and held-to-maturity
investment securities with similar risk characteristics.

DOHA BANK Q.P.S.C. NOTES TO THE CONSOLIDATED FINANCIAL STATEMENTS As at and for the year ended 31 December 2017 QAR ‘000s
21
3 SIGNIFICANT ACCOUNTING POLICIES (CONTINUED)
g) Financial assets and financial liabilities (continued)
v) Measurement principles (continued)
Identification and measurement of impairment (continued) Impairment losses on assets carried at amortised cost are measured as the difference between the carrying amount
of the financial asset and the present value of estimated future cash flows discounted at the asset’s original effective
interest rate. Impairment losses are recognised in profit or loss and reflected in an allowance account against loans
and advances to customers.
In assessing collective impairment, the Group uses historical experience and credit rating in addition to the assessed
inherent losses which are reflected by the economic and credit conditions for each identified portfolio.
For listed equity investments, generally a significant decline in the market value from cost or for a prolonged period,
are considered to be indicators of impairment.
Impairment losses on available-for-sale investment securities are recognised by transferring the cumulative loss that
has been recognised in other comprehensive income to profit or loss as a reclassification adjustment. The cumulative
loss that is reclassified from other comprehensive income to profit or loss is the difference between the acquisition
cost, net of any principal repayment and amortisation, and the current fair value, less any impairment loss previously
recognised in profit or loss.
Impairment losses recognised in the consolidated income statement on equity instruments are not recycled through
the consolidated income statement. In case of debt instruments, if in a subsequent period, the fair value of a debt
instrument classified as available-for-sale increases and the increase can be objectively related to an event occurring
after the impairment loss was recognised in consolidated income statement, the impairment loss is reversed through
the consolidated income statement.
h) Cash and cash equivalents
Cash and cash equivalents include notes and coins on hand, unrestricted balances held with central banks and highly
liquid financial assets with maturities of three months or less from the acquisition date that are subject to an
insignificant risk of changes in their fair value, and are used by the Group in the management of its short-term
commitments.
Cash and cash equivalents are carried at amortised cost in the consolidated statement of financial position.
i) Due from banks and loans and advances to customers
Due from banks and loans and advances to customers are non-derivative financial assets with fixed or determinable
payments that are not quoted in an active market and that the Group does not intend to sell immediately or in the
near term.
Due from banks and loans and advances to customers are initially measured at the transaction price which is the fair
value plus incremental direct transaction costs, and subsequently measured at their amortised cost using the effective
interest method.
Write-off of loans and advances to customers
Loans and advances to customers (and the related impairment allowance accounts) are normally written off, either
partially or in full, when there is no realistic prospect of recovery. Where loans are secured, this is generally after
receipt of any proceeds from the realisation of security. In circumstances where the net realisable value of any
collateral has been determined and there is no reasonable expectation of further recovery, write-off may be earlier.
All write- offs of loans and advances to customers are recorded after obtaining approvals from QCB for such write-
offs.
j) Investment securities
Subsequent to initial recognition investment securities are accounted for depending on their classification as either
held-to-maturity, fair value through profit or loss or available-for-sale.
Held-to-maturity financial assets
Held-to-maturity investments are non-derivative assets with fixed or determinable payments and fixed maturity that
the Group has the positive intent and ability to hold to maturity, and which were not designated as at fair value
through profit or loss or as available-for-sale. Held-to-maturity investments are carried at amortised cost using the
effective interest method.

DOHA BANK Q.P.S.C. NOTES TO THE CONSOLIDATED FINANCIAL STATEMENTS As at and for the year ended 31 December 2017 QAR ‘000s
22
3 SIGNIFICANT ACCOUNTING POLICIES (CONTINUED)
j) Investment securities (continued)
Fair value through profit or loss
The Group has classified its investments as held for trading where such investments are managed for short-term
profit taking or designated certain investments as fair value through profit or loss. Fair value changes on these
investments are recognised immediately in profit or loss.
Available-for-sale financial assets
Available-for-sale investments are non-derivative investments that are designated as available-for-sale or are not
classified as another category of financial assets. Where the fair value is not reliably available, unquoted equity
securities are carried at cost less impairment, and all other available-for-sale investments are carried at fair value.
Interest income is recognised in profit or loss using the effective interest method. Dividend income is recognised in
profit or loss when the Group becomes entitled to the dividend. Foreign exchange gains or losses on available-for-
sale debt security investments are recognised in the consolidated income statement.
Other fair value changes are recognised in other comprehensive income until the investment is sold or impaired,
where upon the cumulative gains and losses previously recognised in consolidated statement of comprehensive
income are reclassified to consolidated income statement.
k) Derivatives
Derivatives held for risk management purposes and hedge accounting
Derivatives held for risk management purposes include all derivative assets and liabilities that are not classified as
trading assets or liabilities. Derivatives held for risk management purposes are measured at fair value on the
consolidated statement of financial position. The Group designates certain derivatives held for risk management as
well as certain non-derivative financial instruments as hedging instruments in qualifying hedging relationships. On
initial designation of the hedge, the Group formally documents the relationship between the hedging derivative
instruments and hedged items, including the risk management objective and strategy in undertaking the hedge,
together with the method that will be used to assess the effectiveness of the hedging relationship. The Group makes
an assessment, both at the inception of the hedge relationship as well as on an ongoing basis, as to whether the
hedging instruments are expected to be highly effective in offsetting the changes in the fair value or cash flows of
the respective hedged items during the period for which the hedge is designated, and whether the actual results of
each hedge are within a range of 80-125 percent. The Group makes an assessment for a cash flow hedge of a forecast
transaction, as to whether the forecast transaction is highly probable to occur and presents an exposure to variations
in cash flows that could ultimately affect profit or loss. These hedging relationships are discussed below.
Fair value hedges
When a derivative is designated as the hedging instrument in a hedge of the change in fair value of a recognised
asset or liability or a firm commitment that could affect profit or loss, changes in the fair value of the derivative are
recognised immediately in consolidated income statement together with changes in the fair value of the hedged item
that are attributable to the hedged risk. If the hedging derivative expires or is sold, terminated, or exercised, or the
hedge no longer meets the criteria for fair value hedge accounting, or the hedge designation is revoked, then hedge
accounting is discontinued prospectively. Any adjustment up to that point to a hedged item, for which the effective
interest method is used, is amortised to consolidated income statement as part of the recalculated effective interest
rate of the item over its remaining life.
Other non-trading derivatives
When a derivative is not held for trading, and is not designated in a qualifying hedge relationship, all changes in its
fair value are recognised immediately in consolidated income statement.
Derivatives held for trading purposes
The Group’s derivative trading instruments includes forward foreign exchange contracts. The Group sells these
derivatives to customers in order to enable them to transfer, modify or reduce current and future risks. These
derivative instruments are fair valued as at the end of reporting date and the corresponding fair value changes is
taken to the consolidated income statement.

DOHA BANK Q.P.S.C. NOTES TO THE CONSOLIDATED FINANCIAL STATEMENTS As at and for the year ended 31 December 2017 QAR ‘000s
23
3 SIGNIFICANT ACCOUNTING POLICIES (CONTINUED)
l) Property and equipment
Recognition and measurement
Items of property and equipment are measured at cost less accumulated depreciation and accumulated impairment
losses.
Cost includes expenditures that are directly attributable to the acquisition of the asset. The cost of self-constructed
assets includes the cost of materials and direct labour, any other costs directly attributable to bringing the assets to
a working condition for their intended use, the costs of dismantling and removing the items and restoring the site
on which they are located and capitalised borrowing costs.
Purchased software that is integral to the functionality of the related equipment is capitalised as part of that
equipment. When parts of an item of property or equipment have different useful lives, they are accounted for as
separate items of property and equipment.
The gain or loss on disposal of an item of property and equipment is determined by comparing the proceeds from
disposal with the carrying amount of the item of property and equipment, and is recognised in other income/other
expenses in profit or loss.
Subsequent costs
The cost of replacing a component of an item of property or equipment is recognised in the carrying amount of the
item if it is probable that the future economic benefits embodied within the part will flow to the Group and its cost
can be measured reliably. The carrying amount of the replaced part is derecognised. The costs of the day-to-day
servicing of property and equipment are recognised in profit or loss as incurred.
Depreciation
Depreciable amount is the cost of property and equipment, or other amount substituted for cost, less its residual
value.
Depreciation is recognised in profit or loss on a straight-line basis over the estimated useful lives of each part of an
item of property and equipment since this most closely reflects the expected pattern of consumption of the future
economic benefits embodied in the asset and is based on cost of the asset less its estimated residual value. Leased
assets under finance leases are depreciated over the shorter of the lease term and their useful lives. Land and capital
work-in-progress are not depreciated.
The estimated useful lives for the current and comparative years are as follows:
Buildings 20 years
Leasehold improvements, furniture and equipment 3-7 years
Vehicles 5 years
Depreciation methods, useful lives and residual values are re-assessed at each reporting date and adjusted
prospectively, if appropriate.
m) Impairment of non-financial assets
The carrying amounts of the Group’s non-financial assets, other than deferred tax assets are reviewed at each
reporting date to determine whether there is any indication of impairment. If any such indication exists, then the
asset’s recoverable amount is estimated.
An impairment loss is reversed only to the extent that the asset’s carrying amount does not exceed the carrying
amount that would have been determined, net of depreciation or amortisation, if no impairment loss had been
recognised.
n) Provisions
A provision is recognised if, as a result of a past event, the Group has a present legal or constructive obligation that
can be estimated reliably, and it is probable that an outflow of economic benefits will be required to settle the
obligation. Provisions are determined by discounting the expected future cash flows at a pre-tax rate that reflects
current market assessments of the time value of money and, where appropriate, the risks specific to the liability.

DOHA BANK Q.P.S.C. NOTES TO THE CONSOLIDATED FINANCIAL STATEMENTS As at and for the year ended 31 December 2017 QAR ‘000s
24
3 SIGNIFICANT ACCOUNTING POLICIES (CONTINUED)
o) Onerous contracts
A provision for onerous contracts is recognised when the expected benefits to be derived by the Group from a
contract are lower than the unavoidable cost of meeting its obligations under the contract. The provision is measured
at the present value of the lower of the expected cost of terminating the contract and the expected net cost of
continuing with the contract. Before a provision is established, the Group recognises any impairment loss on the
assets associated with that contract.
p) Financial guarantees
Financial guarantee contracts are contracts that require the issuer to make specified payments to reimburse the holder
for a loss it incurs because a specified debtor fails to make payments when due in accordance with the terms of a
debt instrument. Such financial guarantees are given to banks, financial institutions and other bodies on behalf of
customers to secure loans, overdrafts and other banking facilities.
Financial guarantees are initially recognised in the financial statements at fair value on the date that the guarantee
was given, being the premium received. Subsequent to initial recognition, the Group’s liabilities under such
guarantees are measured at the higher of the initial measurement, less amortisation calculated to recognise in the
statement of income any fee income earned over the period, and the best estimate of the expenditure required settling
any financial obligation arising as a result of the guarantees at the reporting date.
q) Employee benefits
The Group provides for end of service benefits in accordance with the employment policies of the Group. The
provision is calculated on the basis of the individual’s final salary and period of service at the reporting date. This
provision is included in other provisions within other liabilities.
With respect to Qatari and other GCC employees, the Group makes a contribution to the Qatari Pension Fund
calculated on a percentage of the employees’ salaries, in accordance with the Retirement and Pension Law No. 24
of 2002. The Group’s obligations are limited to these contributions.
r) Short-term employee benefits
Short-term employee benefit obligations are measured on an undiscounted basis and are expensed as the related
service is provided. A liability is recognised for the amount expected to be paid if the Group has a present legal or
constructive obligation to pay this amount as a result of past service provided by the employee and the obligation
can be estimated reliably.
s) Share capital and reserves
i) Share issue costs
Incremental costs directly attributable to the issue of an equity instrument are deducted from the initial measurement
of the equity instruments.
ii) Dividends on ordinary shares
Dividends on ordinary shares are recognised in equity in the period in which they are approved by the Group’s
shareholders. Dividends for the year that are declared after the date of the consolidated statement of financial
position are dealt with in the subsequent events note.
t) Revenue recognition
Revenue is recognised to the extent that it is probable that the economic benefits will flow to the Group and the
revenue can be reliably measured. The following specific recognition criteria must also be met before revenue is
recognised:
Interest income and expense
For all financial instruments measured at amortised cost and interest bearing financial assets classified as available
-for-sale and fair value through profit or loss, interest income or expense is recorded using the effective interest
rate, which is the rate that exactly discounts estimated future cash payments or receipts through the expected life of
the financial instrument or a short period, where appropriate, to the net carrying amount of the financial assets or
financial liabilities. Interest that is 90 days or more overdue is excluded from income. Interest on impaired loans
and advances and other financial assets is not recognised in consolidated statement of income.
Premium on insurance
Premium on insurance contracts are recognized as revenue (earned premiums) proportionately over the period of
coverage. The portion of premium received on in-force contracts that relates to unexpired risks at the reporting date
is reported as unearned premium liability on a 1/365 days basis.

DOHA BANK Q.P.S.C. NOTES TO THE CONSOLIDATED FINANCIAL STATEMENTS As at and for the year ended 31 December 2017 QAR ‘000s
25
3 SIGNIFICANT ACCOUNTING POLICIES (CONTINUED)
t) Revenue recognition (continued)
Fees and commission income and expense
Fees and commission income and expense that are integral to the effective interest rate of a financial asset or liability
are included in the measurement of the effective interest rate.
Other fees and commission income, including account servicing fees, sales commission and syndication fees, are
recognised as the related services are performed. When a loan commitment is not expected to result in the draw-
down of a loan, the related loan commitment fees are recognised on a straight-line basis over the commitment
period. Other fees and commission expense relate mainly to transaction and service fees, which are expensed as the
services are received.
Income from investment securities
Gains or losses on the sale of investment securities are recognised in profit or loss as the difference between fair
value of the consideration received and carrying amount of the investment securities.
Income from held to maturity investment securities is recognised based on the effective interest rate method.
Dividend income
Dividend income is recognised when the right to receive income is established.
u) Tax expense
Tax expense comprises current and deferred tax. Current tax and deferred tax are recognised in profit or loss except
to the extent that it relates to items recognised directly in equity or in other comprehensive income.
Current tax is the expected tax payable or receivable on the taxable income or loss for the year, using tax rates
enacted or substantively enacted at the reporting date, and any adjustment to tax payable in respect of previous
years.
Taxes are calculated based on applicable tax laws or regulations in the countries in which the Group operates. The
provision for deferred taxation is made based on the evaluation of the expected tax liability. Currently there is no
corporate tax applicable to the Bank in the State of Qatar. However, corporate tax is applicable on foreign branches
operating outside the State of Qatar and to one subsidiary in the Qatar Financial Center.
Deferred tax is recognised in respect of temporary differences between the carrying amounts of assets and liabilities
for financial reporting purposes and the amounts used for taxation purposes. Deferred tax is not recognised for:
temporary differences on the initial recognition of assets or liabilities in a transaction that is not a
business combination and that affects neither accounting nor taxable profit or loss;
temporary differences related to investments in subsidiaries to the extent that it is probable that they will not
reverse in the foreseeable future; and
temporary differences arising on the initial recognition of goodwill
Deferred tax is measured at the tax rates that are expected to be applied to the temporary differences when they
reverse, based on the laws that have been enacted or substantively enacted by the reporting date.
Deferred tax assets and liabilities are offset if there is a legally enforceable right to offset current tax liabilities
against current tax assets, and they relate to taxes levied by the same tax authority on the same taxable entity, or on
different tax entities, but they intend to settle current tax liabilities and assets on a net basis or their tax assets and
liabilities will be realised simultaneously.
A deferred tax asset is recognised for unused tax losses, tax credits and deductible temporary differences to the
extent that it is probable that future taxable profits will be available against which they can be utilised. Deferred tax
assets are reviewed at each reporting date and are reduced to the extent that it is no longer probable that the related
tax benefit will be realised.
v) Earnings per share
The Group presents basic and diluted earnings per share (“EPS”) data for its ordinary shares. Basic EPS is calculated
by dividing the profit or loss attributable to ordinary shareholders of the Group by the weighted average number of
ordinary shares outstanding during the year. Diluted EPS is determined by adjusting the profit or loss attributable
to ordinary shareholders and the weighted average number of ordinary shares outstanding for the effects of all
dilutive potential ordinary shares.

DOHA BANK Q.P.S.C. NOTES TO THE CONSOLIDATED FINANCIAL STATEMENTS As at and for the year ended 31 December 2017 QAR ‘000s
26
3 SIGNIFICANT ACCOUNTING POLICIES (CONTINUED)
w) Segment reporting
An operating segment is a component of the Group that engages in business activities from which it may earn
revenues and incur expenses, including revenues and expenses that relate to transactions with any of the Group’s
other components, whose operating results are reviewed regularly by the chief operating decision maker to make
decisions about resources allocated to each segment and assess its performance, and for which discrete financial
information is available.
x) Fiduciary activities
Assets held in a fiduciary capacity are not treated as assets of the Group and accordingly are not part of the
consolidated statement of financial position.
y) Repossessed collateral
Repossessed collaterals against settlement of customers’ debts are stated within the consolidated statement of
financial position under "Other assets" at their carrying value net of allowance for impairment, if any.
According to QCB instructions, the Group should dispose of any land and properties acquired against settlement of
debts within a period not exceeding three years from the date of acquisition although this period can be extended
after obtaining approval from QCB.
z) Comparatives
Except when a standard or an interpretation permits or requires otherwise, all amounts are reported or disclosed
with comparative information.
aa) Parent bank financial information
Statement of financial position and income statement of the Parent bank disclosed as Supplementary information,
are prepared following the same accounting policies as mentioned above except for investment in subsidiaries,
associates which are not consolidated and carried at cost.
4 FINANCIAL RISK MANAGEMENT
a) Introduction and overview
Risk is inherent in the Group’s activities but it is managed through a process of ongoing identification, measurement
and monitoring subject to risk limits and other controls. The key risks Group is exposed are to credit risk, liquidity
risk, operational risk and market risk, which includes trading and non-trading risks. The independent risk control
process does not include business risks such as changes in the environment, technology and industry. They are
monitored through the Group’s strategic planning process.
The Board of Directors is ultimately responsible for identifying and controlling risks; however, there are separate
independent bodies such as the risk management department, internal audit committee, the credit committee, assets
and liabilities committee responsible for managing and monitoring those risks.
Monitoring and controlling risks are primarily performed based on limits established by the Group. These limits
reflect the business strategy and market environment of the Group as well as the level of risk that the Group is willing
to accept.
As part of its overall risk management, the Group also uses derivatives and other instruments to manage exposures
resulting from changes in interest rates, foreign currencies, equity risks, credit risks, and exposures arising from
forecast transactions. The risk profile is assessed before entering into hedge transactions, which are authorized by
the appropriate level of authority within the Group.
The Group applies an internal methodology to estimate the market risk of positions held and the maximum losses
expected, based upon a number of assumptions for various changes in market conditions. The Group has a set of
limits of risks that may be accepted, which are monitored on a daily basis.
There has been no change to the Group’s exposure to market risks or the manner in which it manages and measures
the risk.
The risks arising from financial instruments to which the Group is exposed are financial risks, which include credit
risk, liquidity risk, market risks and operational risk.

DOHA BANK Q.P.S.C. NOTES TO THE CONSOLIDATED FINANCIAL STATEMENTS As at and for the year ended 31 December 2017 QAR ‘000s
27
4 FINANCIAL RISK MANAGEMENT (CONTINUED)
b) Credit risk
Credit risk is the risk that the Group will incur a loss because its customers or counterparties fail to discharge their
contractual obligations in accordance with the agreed terms. Credit risk makes up the largest part of the Group’s
risk exposure; therefore, the Group carefully manages its exposure to credit risk. Credit risk is attributed to financial
instruments such as balance with central banks, due from banks, loans and advances to customers, debt securities
and other bills, certain other assets and credit equivalent amounts related to off-balance sheet financial instruments.
Note 10 to the consolidated financial statements disclose the distribution of the loans and advances to customers by
economic sectors. Note 4 to the consolidated financial statements disclose the geographical distribution of the
Group’s credit exposure.
i) Credit risk measurement
All credit policies are reviewed and approved by the Risk Management Department and the Board of Directors. The
Risk Management team centrally approves all significant credit facilities and limits for all corporate, treasury and
capital markets, financial institutions and SME clients of the Group. Such approvals are carried out in pursuance to
a set of delegated Credit authority limits and in accordance with the Group’s approved credit policy.
Furthermore, all credit facilities are independently administered and monitored by the Credit Control Department.
The Group further limits risk through diversification of its assets by geography and industry sectors. Credit exposure
is controlled by counterparty limits that are reviewed and approved by the risk management committee annually.
The Group also follows the guidelines issued by Qatar Central Bank with regard to the granting of loans which limits
exposure to counterparties.
The amount and type of collateral required depend on an assessment of the credit risk of the counterparty. Guidelines
are implemented regarding the acceptability of types of collateral and valuation parameters.
Whenever possible, loans are secured by acceptable forms of collateral in order to mitigate credit risk. The amount
and type of collateral required depend on an assessment of the credit risk of the counterparty. Guidelines are
implemented regarding the acceptability of types of collateral and valuation parameters. The main types of collateral
obtained are cash, mortgages, local and international equities, financial guarantees and other tangible securities.
The collaterals are held mainly against commercial and consumer loans and are managed against relevant exposures
at their net realizable values.
The Group has a credit administration process that ensures compliance with terms of approval, documentation and
continuous review to ensure quality of credit and collaterals. While securities such as listed equities are valued
regularly, credit policy mandates securities obtained by way of legal mortgage over real estate to be valued at least
once in 3 years or more frequently if situation warrants.

DOHA BANK Q.P.S.C. NOTES TO THE CONSOLIDATED FINANCIAL STATEMENTS As at and for the year ended 31 December 2017 QAR ‘000s
28
4 FINANCIAL RISK MANAGEMENT (CONTINUED)
b) Credit risk (continued)
ii) Analysis of maximum exposure to credit risk before taking account of collateral held or other credit
enhancements The table below represents credit risk exposure to the Group, without taking account of any collateral held or other
credit enhancements attached. For assets recorded on the statement of financial position, the exposures set out below
are based on the net carrying amounts as reported in the consolidated statement of financial position.
2017 2016
Credit risk exposures relating to assets recorded on the statement
of financial position are as follows:
Balances with central banks 6,161,687 3,824,450
Due from banks 7,821,983 10,505,250
Loans and advances to customers 59,804,174 59,186,222
Investment securities – debt 16,509,641 13,625,492
Other assets 669,821 554,396
Total as at 31 December 90,967,306 87,695,810
Other credit risk exposures are as follows:
Guarantees 18,380,848 22,246,187
Letters of credit 5,958,391 7,196,260
Unutilised credit facilities 3,737,358 3,577,504
Total as at 31 December 28,076,597 33,019,951
119,043,903 120,715,761

DOHA BANK Q.P.S.C. NOTES TO THE CONSOLIDATED FINANCIAL STATEMENTS As at and for the year ended 31 December 2017 QAR ‘000s
29
4 FINANCIAL RISK MANAGEMENT (CONTINUED)
b) Credit risk (continued)
iii) Analysis of concentration of risks of financial assets with credit risk exposure
Geographical sectors The following table breaks down the Group’s credit exposure based on carrying amounts without taking into account
any collateral held or other credit support, as categorized by geographical region. The Group has allocated exposures
to regions based on the country of domicile of its counterparties.
Qatar Other
GCC
Other
Middle
East
Rest of the
World
2017
Total
Balances with central banks 4,279,678 1,866,134 - 15,875 6,161,687
Due from banks 4,326,023 445,895 1,403,904 1,646,161 7,821,983
Loans and advances to customers 46,421,475 7,234,902 1,169,942 4,977,855 59,804,174
Investment securities - debt 13,898,740 1,487,632 - 1,123,269 16,509,641
Other assets 635,667 8,472 - 25,682 669,821
69,561,583 11,043,035 2,573,846 7,788,842 90,967,306
Qatar Other
GCC
Other
Middle
East
Rest of the
World
2016
Total
Balances with central banks 2,319,749 1,385,028 - 119,673 3,824,450
Due
from banks
4,396,420 2,396,738 696,609 3,015,483 10,505,250
Loans and advances to customers 43,900,118 9,576,525 820,061 4,889,518 59,186,222
Investment securities - debt 11,436,573 1,714,345 1,812 472,762 13,625,492
Other assets 492,743 13,923 1,525 46,205 554,396
62,545,603 15,086,559 1,520,007 8,543,641 87,695,810
Qatar Other
GCC
Other
Middle
East
Rest of the
World
2017
Total
Guarantees 10,112,460 3,467,079 311,331 4,489,978 18,380,848
Letters of credit 5,009,036 129,235 358,342 461,778 5,958,391
Unutilised credit facilities 2,998,508 622,215 - 116,635 3,737,358
18,120,004 4,218,529 669,673 5,068,391 28,076,597
Qatar Other GCC Other
Middle
East
Rest of the
World
2016
Total
Guarantees 12,455,861 4,674,749 182,969 4,932,608 22,246,187
Letters of credit 5,459,057 276,249 130,304 1,330,650 7,196,260
Unutilised credit facilities 2,727,640 724,758 - 125,106 3,577,504
20,642,558 5,675,756 313,273 6,388,364 33,019,951

DOHA BANK Q.P.S.C. NOTES TO THE CONSOLIDATED FINANCIAL STATEMENTS As at and for the year ended 31 December 2017 QAR ‘000s
30
4 FINANCIAL RISK MANAGEMENT (CONTINUED)
b) Credit risk (continued)
iii) Analysis of concentration of risks of financial assets with credit risk exposure (continued)
Industry sectors The following table breaks down the Group’s credit exposure based on the carrying amounts, before taking into
account collateral held or other credit enhancements, as categorized by the industry sectors of the Group’s
counterparties.
Gross
exposure
2017
Gross
exposure
2016
Funded and unfunded
Government and related agencies 23,966,226 20,491,337
Industry 842,863 1,981,446
Commercial 11,091,291 9,300,278
Services 17,503,016 20,129,988
Contracting 10,455,938 10,287,927
Real estate 17,457,955 13,897,943
Personal 8,430,725 10,400,778
Others 1,219,292 1,206,113
Guarantees 18,380,848 22,246,187
Letters of credit 5,958,391 7,196,260
Unutilised credit facilities 3,737,358 3,577,504
119,043,903 120,715,761
iv) Credit risk exposure
The tables below presents an analysis of financial assets by rating agency designation based on ratings published
by external rating agencies:
2017 2016
Equivalent grades
Sovereign (State of Qatar) 23,063,033 20,201,854
AAA to AA- 4,562,335 3,581,667
A+ to A- 10,406,989 11,970,506
BBB+ to BBB- 3,096,070 3,562,554
BB+ to B- 1,934,023 1,495,400
Below B- 82,381 469,757
Unrated (equivalent internal grading) 75,899,072 79,434,023
119,043,903 120,715,761
Unrated exposure represents credit facilities granted to corporations and individuals who do not have external credit
ratings. Also, the equivalent internal ratings used by the Group are in line with the ratings and definitions published
by the international rating agencies.

DOHA BANK Q.P.S.C. NOTES TO THE CONSOLIDATED FINANCIAL STATEMENTS As at and for the year ended 31 December 2017 QAR ‘000s
31
4 FINANCIAL RISK MANAGEMENT (CONTINUED)
b) Credit risk (continued)
v) Credit quality for class of assets The table below shows the credit quality by class of asset for consolidated statement of financial position lines,
based on the Group’s credit rating system.
Loans and advances to
customers
Due from banks
Investment securities -
debt
2017 2016 2017 2016 2017 2016
Neither past due nor impaired
(low risk):
Standard monitoring 52,265,262 54,262,221 7,821,983 10,505,250 16,482,565 13,600,441
Special monitoring - 90,198 - - -
52,265,262 54,352,419 7,821,983 10,505,250 16,482,565 13,600,441
Past due but not impaired
Standard monitoring 5,925,997 2,347,074 - - -
Special monitoring 2,172,198 2,883,666 - - -
8,098,195 5,230,740 - - -
Impaired
Substandard 296,944 327,954 - - 42,857 39,245
Doubtful 350,832 288,082 - -
Loss 1,610,914 1,396,266 - -
2,258,690 2,012,302 - - 42,857 39,245
Less: Impairment allowance-
specific (2,706,410)
(2,282,717) - - (15,781) (14,194)
Less: Impairment allowance-
collective
(111,563) (126,522) - - -
(2,817,973) (2,409,239) - - (15,781) (14,194)
Carrying amount – net 59,804,174 59,186,222 7,821,983 10,505,250 16,509,641 13,625,492
Investment securities - debt
Held to maturity - - - - 5,708,651 6,405,787
Held for trading - - - - - 5,657
Available for sale - - - - 10,816,771 7,228,242
Less: Impairment allowance - - - - (15,781) (14,194)
Carrying amount – net - - - - 16,509,641 13,625,492
Total carrying amount
59,804,174
59,186,222 7,821,983 10,505,250 16,509,641 13,625,492

DOHA BANK Q.P.S.C. NOTES TO THE CONSOLIDATED FINANCIAL STATEMENTS As at and for the year ended 31 December 2017 QAR ‘000s
32
4 FINANCIAL RISK MANAGEMENT (CONTINUED)
b) Credit risk (continued)
v) Credit quality for class of assets (continued)
Impaired loans and advances to customers and investment in debt securities
Individually impaired loans and advances to customers and investment debt securities for which the Group
determines that there is objective evidence of impairment and it does not expect to collect all principal and interest
due according to the contractual terms of the loan/investment security agreements.
Loans and advances to customers past due but not impaired Past due but not impaired loans and advances to customers are those for which contractual interest or principal
payments are past due, but the Group believes that impairment is not appropriate on the basis of the level of
security/collateral available and/or the stage of collection of amounts owed to the Group.
2017 2016
Up to 30 days 1,492,349 766,042
31 to 60 days 1,716,215 871,716
61 to 90 days 4,889,631 3,592,982
Gross 8,098,195 5,230,740
Rescheduled loans and advances to customers Restructuring activities include extended payment arrangements, approved external management plans,
modification and deferral of payments. Restructuring policies and practices are based on indicators or criteria that,
in the judgement of local management, indicate that payment will most likely continue. These policies are kept
under continuous review. Restructuring is most commonly applied to term loans – in particular, customer finance
loans.
Collateral
The determination of eligible collateral and the value of collateral are based on QCB regulations and are assessed
by reference to market price or indexes of similar assets.
The Group has collateral in the form of blocked deposits, pledge of shares or legal mortgage against the past dues
loans and advances to customers.
The aggregate collateral in respect to the past due but not impaired loans are QAR 10,582 million as of 31 December
2017 (2016: QAR 6,943 million).
The aggregate collateral in respect to the loans and advances to customers are QAR 57,205 million as of 31
December 2017 (2016: QAR 46,913 million).
Repossessed collateral The group has acquired properties held as collateral in settlement of debt of carrying value of QAR 134 million as
at 31 December 2017 (2016: Nil).
Write-off policy The Group writes off a loan or an investment debt security balance, and any related allowances for impairment
losses, when Group Credit determines that the loan or security is uncollectible and after QCB approval.
This determination is made after considering information such as the occurrence of significant changes in the
borrower’s/issuer’s financial position such that the borrower/issuer can no longer pay the obligation, or that
proceeds from collateral will not be sufficient to pay back the entire exposure. For smaller balance standardized
loans, write-off decisions are generally based on a product-specific past due status. The amount written off during
the year was QAR 394 million (2016: QAR 315 million).

DOHA BANK Q.P.S.C. NOTES TO THE CONSOLIDATED FINANCIAL STATEMENTS As at and for the year ended 31 December 2017 QAR ‘000s
33
4 FINANCIAL RISK MANAGEMENT (CONTINUED)
c) Liquidity risk
Liquidity risk is the risk that an institution will be unable to meet its net funding requirements. Liquidity risk can
be caused by market disruptions or credit downgrades, which may cause certain sources of funding to cease
immediately. Ultimate responsibility for liquidity risk management rests with the board of directors, which has built
an appropriate liquidity risk management framework for the management of the Group’s short, medium and long-
term funding and liquidity management requirements. To mitigate this risk, the Group has diversified funding
sources and assets are managed with liquidity in mind, in order to maintain a healthy balance of cash, cash
equivalents and readily marketable securities.
i) Exposure to liquidity risk The key measure used by the Group for managing liquidity risk is the ratio of net liquid assets to deposits from
customers. For this purpose net liquid assets are considered as including cash and cash equivalents and investment
grade debt securities for which there is an active and liquid market less any deposits from banks, debt securities,
other borrowings and commitments maturing within the next month. A similar, but not identical, calculation is used
to measure the Group’s compliance with the liquidity limit established by the Group’s lead regulator, QCB.
Details of the reported Group ratio of net liquid assets to deposits from customers during the year were as follows:
2017 2016
Average for the year 102.50% 95.50%
Maximum for the year 122.67% 104.90%
Minimum for the year 86.12% 87.14%

DOHA BANK Q.P.S.C. NOTES TO THE CONSOLIDATED FINANCIAL STATEMENTS As at and for the year ended 31 December 2017 QAR ‘000s
34
4 FINANCIAL RISK MANAGEMENT (CONTINUED)
c) Liquidity risk (continued)
i) Exposure to liquidity risk (continued)
Maturity analysis of assets and liabilities
The table below summarizes the maturity profile of the Group’s assets and liabilities based on contractual maturity dates. The contractual maturities of assets and liabilities have
been determined on the basis of the remaining period at the reporting date to the contractual maturity date, and do not take account of the effective maturities as indicated by the
Group’s deposit retention history and the availability of liquid funds. The Group routinely monitors assets and liabilities maturity profiles to ensure adequate liquidity is
maintained.
Carrying
amount
Less than
1 month
1-3
months
3 months –
1 year
Subtotal
1 year
Above
1 year
Undated
31 December 2017
Cash and balances with central banks 6,669,609 4,380,783 - - 4,380,783 - 2,288,826
Due from banks 7,821,983 4,241,565 1,752,628 1,028,494 7,022,687 799,296 -
Loans and advances to customers 59,804,174 7,500,295 2,897,038 6,062,788 16,460,121 43,344,053 -
Investment securities 17,512,610 131,765 620,939 2,959,754 3,712,458 12,809,223 990,929
Investment in an associate 11,126 - - - - - 11,126
Property, furniture and equipment 708,580 - - - - - 708,580
Other assets 967,199 967,199 - - 967,199 - -
Total 93,495,281 17,221,607 5,270,605 10,051,036 32,543,248 56,952,572 3,999,461
Due to banks 11,005,061 5,575,610 2,330,768 2,162,168 10,068,546 936,515 -
Customer deposits 59,468,326 23,041,228 18,790,178 13,451,078 55,282,484 4,185,842 -
Debt securities 657,669 - - 96,947 96,947 560,722 -
Other borrowings 5,432,936 - 145,252 2,582,369 2,727,621 2,705,315 -
Other liabilities 2,124,292 2,124,292 - - 2,124,292 - -
Total equity 14,806,997 - - - - - 14,806,997
Total 93,495,281 30,741,130 21,266,198 18,292,562 70,299,890 8,388,394 14,806,997
Maturity gap - (13,519,523) (15,995,593) (8,241,526) (37,756,642) 48,564,178 (10,807,536)

DOHA BANK Q.P.S.C. NOTES TO THE CONSOLIDATED FINANCIAL STATEMENTS As at and for the year ended 31 December 2017 QAR ‘000s
35
4 FINANCIAL RISK MANAGEMENT (CONTINUED)
c) Liquidity risk (continued)
i) Exposure to liquidity risk (continued)
Maturity analysis of assets and liabilities (continued)
Carrying
amount
Less than
1 month
1-3
months
3 months –
1 year
Subtotal
1 year
Above
1 year
Undated
31 December 2016
Cash and balances with central banks 4,260,410 2,222,898 - - 2,222,898 - 2,037,512
Due from banks 10,505,250 5,943,514 749,601 956,616 7,649,731 2,855,519 -
Loans and advances to customers 59,186,222 10,533,174 2,965,159 7,539,618 21,037,951 38,148,271 -
Investment securities 14,706,110 1,909,720 511,456 525,009 2,946,185 10,679,307 1,080,618
Investment in an associate 10,343 - - - - - 10,343
Property, furniture and equipment 770,845 - - - - - 770,845
Other assets 925,769 925,769 - - 925,769 - -
Total 90,364,949 21,535,075 4,226,216 9,021,243 34,782,534 51,683,097 3,899,318
Due to banks 12,275,336 8,421,017 3,036,060 619,055 12,076,132 199,204 -
Customer deposits 55,729,950 22,226,469 14,754,528 17,337,454 54,318,451 1,411,499 -
Debt securities 1,819,598 - 1,819,598 - 1,819,598 - -
Other borrowings 4,994,474 - 364,150 2,928,876 3,293,026 1,701,448 -
Other liabilities 2,165,056 2,165,056 - - 2,165,056 - -
Total equity 13,380,535 - - - - - 13,380,535
Total 90,364,949 32,812,542 19,974,336 20,885,385 73,672,263 3,312,151 13,380,535
Maturity gap - (11,277,467) (15,748,120) (11,864,142) (38,889,729) 48,370,946 (9,481,217)

DOHA BANK Q.P.S.C. NOTES TO THE CONSOLIDATED FINANCIAL STATEMENTS As at and for the year ended 31 December 2017 QAR ‘000s
36
4 FINANCIAL RISK MANAGEMENT (CONTINUED)
c) Liquidity risk (continued)
i) Exposure to liquidity risk (continued)
Maturity analysis of assets and liabilities (continued)
The table below summarises contractual expiry dates of the Group’s contingent liabilities:
Carrying
amount
Up to 3
months
3 months –
1 year
1-5
years
Above
5 years
31 December 2017
Guarantees 18,380,848 5,374,261 6,397,523 6,438,060 171,004
Letters of credit 5,958,391 1,326,526 4,622,253 9,112 500
Unutilised credit facilities 3,737,358 429,823 1,677,178 1,463,364 166,993
Total 28,076,597 7,130,610 12,696,954 7,910,536 338,497
31 December 2016
Guarantees 22,246,187 6,097,173 8,136,881 7,847,552 164,581
Letters of credit 7,196,260 1,506,415 1,036,875 72,292 4,580,678
Unutilised credit facilities 3,577,504 705,170 2,073,448 495,662 303,224
Total 33,019,951 8,308,758 11,247,204 8,415,506 5,048,483

DOHA BANK Q.P.S.C. NOTES TO THE CONSOLIDATED FINANCIAL STATEMENTS As at and for the year ended 31 December 2017 QAR ‘000s
37
4 FINANCIAL RISK MANAGEMENT (CONTINUED)
c) Liquidity risk (continued)
i) Exposure to liquidity risk (continued)
Maturity analysis of assets and liabilities (continued)
The table below summarises the maturity profile of the Group's financial liabilities and derivatives at 31 December based on contractual undiscounted repayment obligations:
Carrying
amount
Gross
undiscounted
cash flows
Less than 1
month
1-3
months
3 months
- 1 year
1-5
years
More than
5 years
31 December 2017
Non-derivative financial liabilities
Due to banks 11,005,061 11,022,022 5,578,969 2,333,779 2,162,380 943,841 3,053
Customer deposits 59,468,326 59,751,373 23,057,949 18,848,642 13,590,750 4,254,032 -
Debt securities 657,669 678,341 - - 97,428 580,913 -
Other borrowings 5,432,936 5,585,480 - 150,615 2,634,227 2,800,638 -
Other liabilities 2,076,793 2,076,793 2,076,793 - - - -
Total liabilities 78,640,785 79,114,009 30,713,711 21,333,036 18,484,785 8,579,424 3,053
Derivative financial instruments:
Generally, forward foreign exchange contracts are settled on a gross basis and interest rate swaps are settled on a net basis.
Total
Up to 1
year
1 - 5
years
More than
5 years
Derivative financial instruments:
Outflow (7,111,781) (7,111,781) - -
Inflow 7,194,020 7,194,020 - -

DOHA BANK Q.P.S.C. NOTES TO THE CONSOLIDATED FINANCIAL STATEMENTS As at and for the year ended 31 December 2017 QAR ‘000s
38
4 FINANCIAL RISK MANAGEMENT (CONTINUED)
c) Liquidity risk (continued)
i) Exposure to liquidity risk (continued)
Maturity analysis of assets and liabilities (continued)
Carrying
amount
Gross
undiscounted
cash flows
Less than 1
month
1-3
months
3 months
- 1 year
1-5
years
More than
5 years
31 December 2016
Non-derivative financial liabilities
Due to banks 12,275,336 12,301,844 8,429,774 3,045,531 624,849 201,690 -
Customer deposits 55,729,950 56,007,999 22,240,996 14,795,865 17,503,288 1,467,850 -
Debt securities 1,819,598 1,832,520 - 1,832,520 - - -
Other borrowings 4,994,474 5,120,105 - 387,392 2,988,799 1,743,914 -
Other liabilities 2,136,080 2,136,080 2,136,080 - - - -
Total liabilities 76,955,438 77,398,548 32,806,850 20,061,308 21,116,936 3,413,454 -
Derivative financial instruments:
Generally, forward foreign exchange contracts are settled on a gross basis and interest rate swaps are settled on a net basis.
Total
Up to 1
year
1 - 5
years
More than
5 years
Derivative financial instruments:
Outflow (30,716,511) (30,716,511) - -
Inflow 30,748,829 30,748,829 - -

DOHA BANK Q.P.S.C. NOTES TO THE CONSOLIDATED FINANCIAL STATEMENTS As at and for the year ended 31 December 2017 QAR ‘000s
39
4 FINANCIAL RISK MANAGEMENT (CONTINUED)
d) Market risks
The Group takes on exposure to market risks, which is the risk that the fair value or future cash flows of a financial
instrument will fluctuate because of changes in market prices. Market risks arise from open positions in interest
rate, currency and equity products, all of which are exposed to general and specific market movements and changes
in the level of volatility of market rates or prices such as interest rates, credit spreads, foreign exchange rates and
equity prices. The Group separates exposures to market risk into either trading or non-trading portfolios.
The market risks arising from trading and non-trading activities are concentrated in Group Treasury and monitored
by Market Risk team. Regular reports are submitted to the Board of Directors and ALCO.
i) Management of market risks
Overall authority for market risk is vested in ALCO. Financial Risk Management department is responsible for the
development of detailed market risk management policies (subject to review and approval by ALCO) and for the
day-to-day review and monitoring.
The Group has adopted a detailed policy framework drafted in accordance with the Qatar Central Bank guidelines
for governing investments portfolio including proprietary book. The governance structure includes policies
including Treasury and Investment manual, Financial Risk policy and Hedging policy, etc. These policies define
the limit structure along with the risk appetite under which the investment activities are undertaken. The limits
structure focuses on total investment limits which in accordance with QCB guidelines are 70% of Group’s capital
and reserves along with various sub limits such as position and stop loss limits for trading activities. The policies
also define various structured sensitivity limits such as VaR and duration for different asset classes within the
investment portfolio. The performance of the portfolio against these limits is updated regularly to senior
management including ALCO and investment committee.
Investment Committee approve all the investment decision for the Group. Financial Risk Management department
is vested with the responsibility of measuring, monitoring risk and reporting risk in the portfolio.

DOHA BANK Q.P.S.C. NOTES TO THE CONSOLIDATED FINANCIAL STATEMENTS As at and for the year ended 31 December 2017 QAR ‘000s
40
4 FINANCIAL RISK MANAGEMENT (CONTINUED)
d) Market risks (continued)
ii) Exposure to interest rate risk
The principal risk to which the banking and trading portfolios are exposed is the risk of loss from fluctuations in the future cash flows or fair values of financial instruments
because of a change in market interest rates. Interest rate risk is managed principally through monitoring interest rate gaps and by having pre-approved limits for repricing bands.
ALCO is the monitoring body for compliance with these limits and is assisted by Group Treasury in its day-to-day monitoring activities.
A summary of the Group’s interest rate gap position on banking and trading portfolios is as follows:
Repricing in:
Carrying
amount
Less than
3 months
3-12
months
Above
1 year
Non-interest
sensitive
31 December 2017
Cash and cash equivalents 6,669,609 1,811,200 - - 4,858,409
Due from banks 7,821,983 6,859,593 331,611 - 630,779
Loans and advances to customers 59,804,174 57,018,060 224,905 78,643 2,482,566
Investment securities 17,512,610 752,759 2,960,240 12,808,682 990,929
Investment in an associate 11,126 - - - 11,126
Property, furniture and equipment 708,580 - - - 708,580
Other assets 967,199 - - - 967,199
Total 93,495,281 66,441,612 3,516,756 12,887,325 10,649,588
Due to banks 11,005,061 6,704,202 3,971,888 187,852 141,119
Customer deposits 59,468,326 44,630,023 13,249,203 1,589,100 -
Debt securities 657,669 - 96,947 560,722 -
Other borrowings 5,432,936 5,432,936 - - -
Other liabilities 2,124,292 - - - 2,124,292
Total equity 14,806,997 - - - 14,806,997
Total 93,495,281 56,767,161 17,318,038 2,337,674 17,072,408
Interest rate sensitivity gap - 9,674,451 (13,801,282) 10,549,651 (6,422,820)
Cumulative interest rate sensitivity gap - 9,674,451 (4,126,831) 6,422,820 -

DOHA BANK Q.P.S.C. NOTES TO THE CONSOLIDATED FINANCIAL STATEMENTS As at and for the year ended 31 December 2017 QAR ‘000s
41
4 FINANCIAL RISK MANAGEMENT (CONTINUED)
d) Market risks (continued)
ii) Exposure to interest rate risk (continued)
Repricing in:
Carrying
amount
Less than
3 months
3-12
months
Above
1 year
Non-interest
sensitive
31 December 2016
Cash and cash equivalents 4,260,410 449,916 70,969 - 3,739,525
Due from banks 10,505,250 8,626,205 1,588,272 - 290,773
Loans and advances to customers 59,186,222 56,365,664 335,657 164,612 2,320,289
Investment securities 14,706,110 904,644 454,039 12,266,809 1,080,618
Investment in an associate 10,343 - - - 10,343
Property, furniture and equipment 770,845 - - - 770,845
Other assets 925,769 - - - 925,769
Total 90,364,949 66,346,429 2,448,937 12,431,421 9,138,162
Due to banks 12,275,336 9,970,519 2,025,252 71,498 208,067
Customer deposits 55,729,950 38,173,092 16,153,845 1,403,013 -
Debt securities 1,819,598 1,819,598 - - -
Other borrowings 4,994,474 4,994,474 - - -
Other liabilities 2,165,056 - - - 2,165,056
Total equity 13,380,535 - - - 13,380,535
Total 90,364,949 54,957,683 18,179,097 1,474,511 15,753,658
Interest rate sensitivity gap - 11,388,746 (15,730,160) 10,956,910 (6,615,496)
Cumulative interest rate sensitivity gap - 11,388,746 (4,341,414) 6,615,496 -

DOHA BANK Q.P.S.C. NOTES TO THE CONSOLIDATED FINANCIAL STATEMENTS As at and for the year ended 31 December 2017 QAR ‘000s
42
4 FINANCIAL RISK MANAGEMENT (CONTINUED)
d) Market risk (continued)
ii) Exposure to interest rate risk (continued)
Sensitivity analysis The management of interest rate risk against interest rate gap limits is supplemented by monitoring the sensitivity
of the Group’s financial assets and liabilities to various standard and non-standard interest rate scenarios. Standard
scenarios that are considered on a monthly basis include a 100 basis points (bp) parallel fall or rise in all yield curves
worldwide and a 10 bp rise or fall in the greater than 12-month portion of all yield curves. An analysis of the Group’s
sensitivity to an increase or decrease in market interest rates, assuming no asymmetrical movement in yield curves
and a constant financial position, is as follows:
10 bp
parallel
increase
10 bp
parallel
decrease
Sensitivity of net interest income
2017
At 31 December (6,154) 6,154
2016
At 31 December (5,673) 5,673
10 bp
parallel
increase
10 bp
parallel
decrease
Sensitivity of reported equity to interest rate movements
2017
At 31 December (31,720) 31,720
2016
At 31 December (27,285) 27,285
Overall non-trading interest rate risk positions are managed by Group Treasury, which uses investment securities,
advances to banks, deposits from banks and derivative instruments to manage the overall position arising from the
Group’s non-trading activities.
iii) Exposure to other market risks
Currency risk
The Group is exposed to fluctuations in foreign currency exchange rates. The Board of Directors sets limits on the
level of exposure by currency, and in total for both overnight and intra-day positions, which are monitored daily.
The Group had the following significant net exposures:
2017 2016
Net foreign currency exposure:
Pound Sterling 156,510 16,193
Euro 49,022 1,133
Kuwaiti Dinar 3,073 39,415
Japanese Yen 1,257 230
Other currencies 3,551,605 820,807
Foreign currency sensitivity analysis
The following table details the Group’s sensitivity to a percentage increase or decrease in the Qatari Riyals against
the relevant foreign currencies except for US Dollars which is pegged to the Qatari Riyal. The sensitivity analysis
includes only outstanding foreign currency denominated items and the impact of a change in the exchange rates are
as follows:

DOHA BANK Q.P.S.C. NOTES TO THE CONSOLIDATED FINANCIAL STATEMENTS As at and for the year ended 31 December 2017 QAR ‘000s
43
4 FINANCIAL RISK MANAGEMENT (CONTINUED)
d) Market risk (continued)
iii) Exposure to other market risks (continued)
Increase / (decrease) in profit or
loss 2017 2016
5% increase / (decrease) in currency exchange rate
Pound Sterling 7,826 810
Euro 2,451 57
Kuwaiti Dinar 154 1,971
Japanese Yen 63 11
Other currencies 177,580 41,040
Equity price risk Equity price risk is the risk that the fair value of equities decreases as a result of changes in the equity indices and
individual stocks. The equity price risk exposure arises from equity securities classified as available-for-sale and
fair value through profit or loss.
The Group is also exposed to equity price risk and the sensitivity analysis thereof is as follows:
2017 2016
Effect on
OCI
Effect on
income
statement
Effect on
OCI
Effect on
income
statement
5% increase / (decrease) in Qatar Exchange ± 24,442 - ± 31,016 - 5% increase / (decrease) in Other than Qatar
Exchange ± 4,641 - ± 17,193 -
± 29,083 - ± 48,209 -
The above analysis has been prepared on the assumption that all other variables such as interest rate, foreign
exchange rate, etc. are held constant and is based on historical correlation of the equity securities to the relevant
index. Actual movement may be different from the one stated above.
e) Operational risks
Operational risk is the risk of loss arising from inadequate or failed internal processes, people and systems, or from
external events. The Group has detailed policies and procedures that are regularly updated to ensure a robust internal
control mechanism. The Group closely reviews the various recommendations issued by the Basel Committee on
‘Sound Practices for the Management and Supervision of Operational Risk’ for implementation. The Group
continues to invest in risk management and mitigation strategies, such as a robust control infrastructure, business
continuity management or through risk transfer mechanisms such as insurance and outsourcing.
The Group has a well-defined Operational Risk Management Framework and an independent operational risk
function. The Operational Risk Management Committee oversees the implementation of an effective risk
management framework that encompasses appropriate systems, practices, policies and procedures to ensure the
effectiveness of risk identification, measurement, assessment, reporting and monitoring within the group.
In addition, the Internal Audit department carries out an independent assessment and provides assurance of the
actual functioning of the overall Operational Risk Management Framework.
The Group manages operational risk based on a framework that enables the determination of operational risk profile
of business units and how it relates to risk measurement, risk mitigation and priorities.

DOHA BANK Q.P.S.C. NOTES TO THE CONSOLIDATED FINANCIAL STATEMENTS As at and for the year ended 31 December 2017 QAR ‘000s
44
4 FINANCIAL RISK MANAGEMENT (CONTINUED)
e) Operational risks (continued)
A number of techniques are applied to effectively manage the operational risk across the Group. These include:
Effective staff training, documented processes/procedures with appropriate controls to safeguard assets and
records, regular reconciliation of accounts and transactions, introduction process of new products, reviews of
outsourcing activities, information system security, segregation of duties, financial management and reporting
are some of the measures adopted by the Group to manage Group-wide operational risk;
Reporting of any operational risk event, which is used to help identify where process and control requirements
are needed to reduce the recurrence of risk events. Risk events are analyzed, reported, mitigated, recorded on a
central database and reported quarterly to the Board of Directors; and
Introduction of a bottom-up ‘Control Risk Self-Assessment’ across business and support units including
subsidiaries and overseas branches. This approach results in detailed understanding of inherent and residual
risks with evaluation of controls across the Group. Therefore, it enhances the determination of specific
operational risk profile for the business and support units while corrective action points are captured and the
changes of the operational risk profile are monitored on an ongoing basis.
f) Capital management
Regulatory capital
The Group maintains an actively managed capital base to cover the risks inherent in the business. The adequacy of
the Group’s capital is monitored using, among other measures, the rules and ratios established by the Basel
Committee on Banking Supervision and adopted by the Qatar Central Bank.
The primary objective of the Group’s capital management is to ensure that the Group complies with externally
imposed capital requirements and that the Group maintains strong credit ratings and healthy capital ratios in order
to support its business and to maximizes shareholders’ value.
The Group manages its capital structure and makes adjustment to it in light of changes in economic conditions and
the risk characteristics of its activities. In order to maintain or adjust the capital structure, the Group may adjust the
amount of dividend payment to shareholders or issue capital securities.
2017 2016
Common Equity Tier 1 Capital 9,700,840 8,247,923
Additional Tier 1 Capital 4,000,000 4,000,000
Additional Tier 2 Capital 111,564 126,522
Total Eligible Capital 13,812,404 12,374,445
Risk weighted assets
2017
Basel III
Risk
weighted
amount
2016
Basel III
Risk
weighted
amount
Total risk weighted assets for credit risk 72,260,750 72,201,446
Risk weighted assets for market risk 1,350,948 2,275,992
Risk weighted assets for operational risk 5,274,077 4,993,761
78,885,775 79,471,199

DOHA BANK Q.P.S.C. NOTES TO THE CONSOLIDATED FINANCIAL STATEMENTS As at and for the year ended 31 December 2017 QAR ‘000s
45
4 FINANCIAL RISK MANAGEMENT (CONTINUED)
f) Capital management (continued)
Risk weighted assets (continued)
2017 2016
Risk weighted assets 78,885,775 79,471,199
Total eligible capital 13,812,404 12,374,445
Risk weighted assets as a percentage of total eligible capital
Capital adequacy ratio 17.51% 15.57%
The Bank has followed QCB Basel III capital adequacy ratio (“CAR”) with effect from 1 January 2014 in
accordance with QCB regulations.
The minimum accepted CAR under QCB Basel III requirements are as follows:
- Minimum limit without Capital Conservation Buffer is 10%
- Minimum limit including Capital Conservation Buffer is 12.75%
The adoption of IFRS 9 on 1 January 2018 is not expected to have a material impact on the total eligible capital
based on guidance regulatory guidance to date.
5 USE OF ESTIMATES AND JUDGEMENTS
a) Key sources of estimation uncertainty
The Group makes estimates and assumptions that affect the reported amounts of assets and liabilities. Estimates and
judgements are continually evaluated and are based on historical experience and other factors, including
expectations of future events that are believed to be reasonable under the circumstances.
i) Impairment allowances for credit losses
Assets accounted for at amortised cost are evaluated for impairment on a basis described in accounting policy.
The specific counterparty component of the total allowances for impairment applies to financial assets evaluated
individually for impairment and is based upon management’s best estimate of the present value of the cash flows
that are expected to be received. In estimating these cash flows, management makes judgements about
counterparty’s financial situation and the net realisable value of any underlying collateral. Each impaired asset is
assessed on its merits, and the workout strategy and estimate of cash flows considered recoverable are independently
approved by the Credit Risk function. Minimum impairment on specific counter parties is determined based on the
QCB regulations.
The Bank reviews its loan portfolio to consolidate impairment at the end of each reporting period. In determining
whether an impairment loss should be recorded in the consolidated statement of income, the Bank makes
judgements as to whether there is any observable data indicating that there is a measurable decrease in the estimated
future cash flows from a portfolio of loans before the decrease can be identified with an individual loan in that
portfolio. This evidence may include observable data indicating that there has been an adverse change in the
payment status of borrowers in a group, or national or local economic conditions that correlate with defaults on
assets in the group. Management uses estimates based on historical loss experience for assets with credit risk
characteristics and objective evidence of impairment similar to those in the portfolio when scheduling its future
cash flows. The methodology and assumptions used for estimating both the amount and timing of future cash flows
are reviewed regularly to reduce any differences between loss estimates and actual loss experience.
Collectively assessed impairment allowances cover credit losses inherent in portfolios of loans and advances to
customers and investment securities measured at amortised cost with similar credit risk characteristics when there
is objective evidence to suggest that they contain impaired financial assets, but the individual impaired items cannot
yet be identified. In assessing the need for collective loss allowances, management considers factors such as credit
quality, portfolio size, concentrations and economic factors. In order to estimate the required allowance,
assumptions are made to define the way inherent losses are modelled and to determine the required input parameters,
based on historical experience and current economic conditions. The accuracy of the allowances depends on the
estimates of future cash flows for specific counterparty allowances and the model assumptions and parameters used
in determining collective allowances.

DOHA BANK Q.P.S.C. NOTES TO THE CONSOLIDATED FINANCIAL STATEMENTS As at and for the year ended 31 December 2017 QAR ‘000s
46
5 USE OF ESTIMATES AND JUDGEMENTS (CONTINUED)
a) Key sources of estimation uncertainty (continued)
ii) Determining fair values
The determination of fair value for financial assets and liabilities for which there is no observable market price
requires the use of valuation techniques as described in accounting policy. For financial instruments that trade
infrequently and have little price transparency, fair value is less objective, and requires varying degrees of
judgement depending on liquidity, concentration, uncertainty of market factors, pricing assumptions and other risks
affecting the specific instrument.
Where the fair values of financial assets and financial liabilities cannot be derived from active markets, they are
determined using a variety of valuation techniques that include the use of mathematical models. The inputs to these
models are taken from observable markets where possible, but where this is not feasible, a degree of judgment is
required in establishing fair values. The judgments include considerations of liquidity and model inputs such as
correlation and volatility for longer dated derivatives.
b) Critical accounting judgements in applying the Group’s accounting policies
i) Valuation of financial instruments
The Group’s accounting policy on fair value measurements is discussed in the significant accounting policies
section.
The Group measures fair values using the following fair value hierarchy that reflects the significance of the inputs
used in making the measurements.
Level 1: Quoted market price unadjusted in an active market for an identical instrument.
Level 2: Valuation techniques based on observable inputs, either directly (i.e. as prices) or indirectly (i.e.
derived from prices). This category includes instruments valued using: quoted market prices in active markets
for similar instruments; quoted prices for identical or similar instruments in markets that are considered less
than active; or other valuation techniques where all significant inputs are directly or indirectly observable
from market data.
Level 3: Valuation techniques using significant unobservable inputs. This category includes all
instruments where the valuation technique includes inputs not based on observable data and the
unobservable inputs have a significant effect on the instrument’s valuation. This category includes
instruments that are valued based on quoted prices for similar instruments where significant
unobservable adjustments or assumptions are required to reflect differences between the instruments.
Fair values of financial assets and financial liabilities that are traded in active markets are based on quoted market
prices or dealer price quotations. For all other financial instruments the Group determines fair values using valuation
techniques.
Valuation techniques include net present value and discounted cash flow models, comparison to similar instruments
for which market observable prices exist. Assumptions and inputs used in valuation techniques include risk-free
and benchmark interest rates, credit spreads and other premium used in estimating discount rates, bond and equity
prices, foreign currency exchange rates, equity and equity index prices and expected price volatilities and
correlations. The objective of valuation techniques is to arrive at a fair value determination that reflects the price of
the financial instrument at the reporting date that would have been determined by market participants acting at arm’s
length.

DOHA BANK Q.P.S.C. NOTES TO THE CONSOLIDATED FINANCIAL STATEMENTS As at and for the year ended 31 December 2017 QAR ‘000s
47
5 USE OF ESTIMATES AND JUDGEMENTS (CONTINUED)
b) Critical accounting judgements in applying the Group’s accounting policies (continued)
ii) Fair value measurement The following table provides the fair value measurement hierarchy of the Group’s assets and liabilities.
Quantitative disclosures fair value measurement hierarchy for assets and liabilities as at 31 December 2017:
Date of
valuation
Level 1
Level 2
Level 3
Total
Assets measured at fair value:
Available-for-sale investment securities 31 Dec 2017 11,216,316 549,509 - 11,765,825
Derivative instruments:
Interest rate swaps 31 Dec 2017 - 59,610 - 59,610
Forward foreign exchange contracts 31 Dec 2017 - 102,253 - 102,253
11,216,316 711,372 - 11,927,688
Assets for which fair values are
disclosed (note 7)
Cash and balances with central banks 31 Dec 2017 - - 6,669,609 6,669,609
Due from banks 31 Dec 2017 - - 7,821,983 7,821,983
Loans and advances to customers 31 Dec 2017 - - 59,804,174 59,804,174
Held to maturity investment securities 31 Dec 2017 3,232,502 2,475,331 - 5,707,833
Other Assets 31 Dec 2017 - - 669,821 669,821
Liabilities measured at fair value:
Derivative instruments:
Interest rate swaps 31 Dec 2017 - 27,485 - 27,485
Forward foreign exchange contracts 31 Dec 2017 - 20,014 - 20,014
- 47,499 - 47,499
Liabilities for which fair values are
disclosed (note 7)
Due to banks 31 Dec 2017 - 11,005,061 - 11,005,061
Customer deposits 31 Dec 2017 - 59,468,326 - 59,468,326
Debt securities 31 Dec 2017 657,669 - - 657,669
Other borrowings 31 Dec 2017 - 5,432,936 - 5,432,936
Other liabilities 31 Dec 2017 - 1,364,771 - 1,364,771
There have been no transfers between Level 1, level 2 and Level 3 fair value measurement during the year.

DOHA BANK Q.P.S.C. NOTES TO THE CONSOLIDATED FINANCIAL STATEMENTS As at and for the year ended 31 December 2017 QAR ‘000s
48
5 USE OF ESTIMATES AND JUDGEMENTS (CONTINUED)
b) Critical accounting judgements in applying the Group’s accounting policies (continued)
ii) Fair value measurement (continued)
Fair value hierarchy for financial instruments measured at fair value as at 31 December 2016:
Date of
valuation
Level 1
Level 2
Level 3
Total
Assets measured at fair value:
Available-for-sale investment securities 31 Dec 2016 6,597,526 1,652,081 - 8,249,607
Investment securities classified as held
for trading
31 Dec 2016
5,657 - - 5,657
Derivative instruments:
Interest rate swaps 31 Dec 2016 - 55,601 - 55,601
Forward foreign exchange contracts 31 Dec 2016 - 52,145 - 52,145
6,603,183 1,759,827 - 8,363,010
Assets for which fair values are disclosed
(note 7)
Cash and balances with central banks 31 Dec 2016 - - 4,260,410 4,260,410
Due from banks 31 Dec 2016 - - 10,505,250 10,505,250
Loans and advances to customers 31 Dec 2016 - - 59,186,222 59,186,222
Held to maturity investment securities 31 Dec 2016 3,819,815 2,672,725 - 6,492,540
Other Assets 31 Dec 2016 - - 554,396 554,396
Liabilities measured at fair value:
Derivative instruments:
Interest rate swaps 31 Dec 2016 - 9,149 - 9,149
Forward foreign exchange contracts 31 Dec 2016 - 19,827 - 19,827
- 28,976 - 28,976
Liabilities for which fair values are
disclosed (note 7)
Due to banks 31 Dec 2016 - 12,275,336 - 12,275,336
Customer deposits 31 Dec 2016 - 55,729,950 - 55,729,950
Debt securities 31 Dec 2016 1,819,598 - - 1,819,598
Other borrowings 31 Dec 2016 - 4,994,474 - 4,994,474
Other liabilities 31 Dec 2016 - 1,458,503 - 1,458,503
During the reporting period 31 December 2016, there were no transfers between Level 1 and Level 3 fair value
measurements.
Available for sale equity investments amounting to QAR 52.3 million (2016: QAR 59.3 million) are recorded at
cost since the fair value cannot be reliably measured.
iii) Financial asset and liability classification The Group’s accounting policies provide scope for assets and liabilities to be designated at inception into different
accounting categories in certain circumstances:
in classifying financial assets or liabilities as trading, the Group has determined that it meets the description
of trading assets and liabilities set out in accounting policies.
in designating financial assets at fair value through profit or loss, the Group has determined that it has met
one of the criteria for this designation set out in accounting policies.
in classifying financial assets as held-to-maturity, the Group has determined that it has both the positive
intention and ability to hold the assets until their maturity date as required by accounting policies.
Details of the Group’s classification of financial assets and liabilities are given in Note 7.

DOHA BANK Q.P.S.C. NOTES TO THE CONSOLIDATED FINANCIAL STATEMENTS As at and for the year ended 31 December 2017 QAR ‘000s
49
5 USE OF ESTIMATES AND JUDGEMENTS (CONTINUED)
iv) Qualifying hedge relationships
In designating financial instruments in qualifying hedge relationships, the Group has determined that it expects the
hedges to be highly effective over the period of the hedging relationship.
In accounting for derivatives as fair value hedges, the Group has determined that the hedged interest rate exposure
relates to highly probable future cash flows.
v) Impairment of investments in equity and debt securities
Investments in equity and debt securities are evaluated for impairment on the basis described in the significant
accounting policies section.
vi) Going concern
The Group’s management has made an assessment of its ability to continue as a going concern and is satisfied that
it has the resources to continue in business for the foreseeable future. Furthermore, management is not aware of any
material uncertainties that may cast significant doubt upon the Group’s ability to continue as a going concern.
Therefore, the financial statements continue to be prepared on the going concern basis.
vii) Useful lives of property and equipment
The Group’s management determines the estimated useful life of property and equipment for calculating
depreciation. This estimate is determined after considering the expected usage of the asset, physical wear and tear,
technical or commercial obsolescence.
6 OPERATING SEGMENTS
The Group organizes and manages its operations by two business segments, which comprise conventional banking
and insurance activities.
Conventional Banking
Corporate Banking provides a range of product and service offerings to business and corporate customers
including funded and non-funded credit facilitates deposits to corporate customers. It also undertakes
funding and centralised risk management activities through borrowings, issue of debt securities, use of
derivatives for risk management purposes and investing in liquid assets such as short-term placements and
corporate and government debt securities.
Retail Banking provides a diversified range of products and services to individuals. The range includes
loans, credit cards, deposits and other transactions with retail customers.
Insurance Activities
Insurance activities to customers include effecting contracts of insurance, carrying out contracts of insurance,
arranging deals in investments and advising on investments.

DOHA BANK Q.P.S.C. NOTES TO THE CONSOLIDATED FINANCIAL STATEMENTS As at and for the year ended 31 December 2017 QAR ‘000s
50
6 OPERATING SEGMENTS (CONTINUED)
a) By operating segment
Details of each segment as of and for the year ended 31 December 2017 are stated below:
2017
Corporate
Banking
Retail
Banking Unallocated Total Insurance Total
Interest income 3,250,115 380,738 - 3,630,853 - 3,630,853
Net income from insurance activities - - - - 7,202 7,202
Other income 382,774 228,807 64,474 676,055 7,112 683,167
Segmental revenue 3,632,889 609,545 64,474 4,306,908 14,314 4,321,222
Net impairment loss on loans and advances to customers (490,296) (102,245) - (592,541) - (592,541)
Impairment loss on investment securities (142,067) - - (142,067) - (142,067)
Segmental profit 1,109,493 423 1,109,916
Share of results of the associate 158
Net profit for the year 1,110,074
Other information
Assets 78,699,654 6,452,639 8,082,441 93,234,734 249,421 93,484,155
Investments in an associate 11,126
Total 93,495,281
Liabilities 68,614,334 9,065,643 913,438 78,593,415 94,869 78,688,284
Contingent items 28,028,028 48,569 - 28,076,597 - 28,076,597

DOHA BANK Q.P.S.C. NOTES TO THE CONSOLIDATED FINANCIAL STATEMENTS As at and for the year ended 31 December 2017 QAR ‘000s
51
6 OPERATING SEGMENTS (CONTINUED)
a) By operating segment
2016
Corporate
Banking
Retail
Banking Unallocated Total Insurance Total
Interest/similar income 2,776,038 392,957 - 3,168,995 - 3,168,995
Net income from insurance activities - - - - 8,024 8,024
Other income 452,121 158,228 54,874 665,223 7,265 672,488
Segmental revenue 3,228,159 551,185 54,874 3,834,218 15,289 3,849,507
Net impairment loss on loans and advances to customers (407,216) (73,008) - (480,224) - (480,224)
Impairment loss on investment securities (138,771) - - (138,771) (728) (139,499)
Segmental profit 1,050,765 3,062 1,053,827
Share of results of the associate (46)
Net profit for the year 1,053,781
Other information
Assets 78,461,105 6,970,182 4,657,665 90,088,952 265,654 90,354,606
Investments in an associate - - - - - 10,343
Total 90,364,949
Liabilities 65,790,217 10,404,519 679,716 76,874,452 109,962 76,984,414
Contingent items 32,881,346 138,605 - 33,019,951 - 33,019,951

DOHA BANK Q.P.S.C. NOTES TO THE CONSOLIDATED FINANCIAL STATEMENTS As at and for the year ended 31 December 2017 QAR ‘000s
52
6 OPERATING SEGMENTS (CONTINUED)
b) Geographical areas
The following table shows the geographic distribution of the Group’s operating income based on the geographical location of where the business is booked by the Group.
Qatar Other
GCC
India Total
2017
Net operating income 2,633,167 295,275 17,398 2,945,840
Net profit 1,134,303 (15,286) (8,943) 1,110,074
Total assets 84,640,595 8,329,454 525,232 93,495,281
Total liabilities 71,203,556 7,129,544 355,184 78,688,284
2016
Net operating income 2,424,359 290,870 25,929 2,741,158
Net profit 1,081,566 (33,909) 6,124 1,053,781
Total assets 80,021,671 9,721,550 621,728 90,364,949
Total liabilities 68,015,770 8,516,098 452,546 76,984,414

DOHA BANK Q.P.S.C. NOTES TO THE CONSOLIDATED FINANCIAL STATEMENTS As at and for the year ended 31 December 2017 QAR ‘000s
53
7 FINANCIAL ASSETS AND LIABILITIES
a) Accounting classifications and fair values
The table below sets out the carrying amounts and fair values of the Group’s financial assets and financial liabilities:
Fair value
through
profit or loss
Held to
maturity
Loans and
receivables
Available-
for-sale
Other
amortised
cost
Total
carrying
amount
Fair value
31 December 2017
Cash and balances with central banks - - 6,669,609 - - 6,669,609 6,669,609
Due from banks - - 7,821,983 - - 7,821,983 7,821,983
Positive fair value of derivatives 161,863 161,863 161,863
Loans and advances to customers - - 59,804,174 - - 59,804,174 59,804,174
Investment securities:
Measured at fair value - - - 11,818,154 - 11,818,154 11,818,154
Measured at amortised cost - 5,694,456 - - - 5,694,456 5,707,833
Other assets - - - - 507,958 507,958 507,958
161,863 5,694,456 74,295,766 11,818,154 507,958 92,478,197 92,491,574
Negative fair value of derivatives 47,499 47,499 47,499
Due to banks - - - - 11,005,061 11,005,061 11,005,061
Customer deposits - - - - 59,468,326 59,468,326 59,468,326
Debt securities - - - - 657,669 657,669 657,669
Other borrowings - - - - 5,432,936 5,432,936 5,432,936
Other liabilities - - - - 1,364,771 1,364,771 1,364,771
47,499 - - - 77,928,763 77,976,262 77,976,262

DOHA BANK Q.P.S.C. NOTES TO THE CONSOLIDATED FINANCIAL STATEMENTS As at and for the year ended 31 December 2017 QAR ‘000s
54
7 FINANCIAL ASSETS AND LIABILITIES (CONTINUED)
a) Accounting classifications and fair values (continued)
The table below sets out the carrying amounts and fair values of the Group’s financial assets and financial liabilities:
Fair value
through
profit or loss
Held to
maturity
Loans and
receivables
Available-
for-sale
Other
amortised
cost
Total
carrying
amount
Fair value
31 December 2016
Cash and balances with central banks - - 4,260,410 - - 4,260,410 4,260,410
Due from banks - - 10,505,250 - - 10,505,250 10,505,250
Positive fair value of derivatives 107,746 107,746 107,746
Loans and advances to customers - - 59,186,222 - - 59,186,222 59,186,222
Investment securities:
Measured at fair value 5,657 - - 8,308,860 - 8,314,517 8,314,517
Measured at amortised cost - 6,391,593 - - - 6,391,593 6,492,540
Other assets - - - - 554,396 554,396 554,396
113,403 6,391,593 73,951,882 8,308,860 554,396 89,320,134 89,421,081
Negative fair value of derivatives 28,976 - - - - 28,976 28,976
Due to banks - - - - 12,275,336 12,275,336 12,275,336
Customer deposits - - - - 55,729,950 55,729,950 55,729,950
Debt securities - - - - 1,819,598 1,819,598 1,819,598
Other borrowings - - - - 4,994,474 4,994,474 4,994,474
Other liabilities - - - - 1,458,503 1,458,503 1,458,503
28,976 - - - 76,277,861 76,306,837 76,306,837
Investment securities – unquoted equity securities at cost
The above table includes to QAR 52.3 million (2016: QAR 59.3 million) at 31 December 2017 of unquoted equity investments in both the carrying amount and fair value
columns that were measured at cost and for which disclosure of fair value was not provided because their fair value was not considered to be reliably measureable.

DOHA BANK Q.P.S.C. NOTES TO THE CONSOLIDATED FINANCIAL STATEMENTS As at and for the year ended 31 December 2017 QAR ‘000s
55
8 CASH AND BALANCES WITH CENTRAL BANKS
2017 2016
Cash 507,922 435,960
Cash reserve with QCB* 2,227,944 1,926,658
Cash reserve with other central banks* 60,882 110,854
Other balances with central banks 3,872,861 1,786,938
6,669,609 4,260,410
*Cash reserve with QCB and other central banks are mandatory reserves that are not available for use in the Group’s
day to day operations.
9 DUE FROM BANKS
2017 2016
Current accounts 610,761 1,331,053
Placements 3,941,114 5,124,797
Loans to banks 3,270,108 4,049,400
7,821,983 10,505,250
10 LOANS AND ADVANCES TO CUSTOMERS
a) By type
2017 2016
Loans 56,027,009 54,456,707
Overdrafts 5,588,715 5,903,930
Bills discounted 443,389 520,874
Other loans* 584,501 715,293
(Note-i) 62,643,614 61,596,804
Less :
Deferred profit (21,467) (1,343)
Specific impairment of loans and advances to customers (2,706,410) (2,282,717)
Collective impairment allowance (111,563) (126,522)
Net loans and advances to customers 59,804,174 59,186,222

DOHA BANK Q.P.S.C. NOTES TO THE CONSOLIDATED FINANCIAL STATEMENTS As at and for the year ended 31 December 2017 QAR ‘000s
56
10 LOANS AND ADVANCES TO CUSTOMERS (CONTINUED)
a) By type
The aggregate amount of non-performing loans and advances to customers amounted QAR 2,258.7 million, which
represents 3.61 % of total loans and advances to customers (2016: QAR 2,012.3 million, 3.27% of total loans and
advances to customers).
During the year, the Group has written-off fully provided non-performing loans amounting to QAR 194 million
(2016: QAR 290.7) as per Qatar Central Bank circular no. 68/2011.
Specific impairment of loans and advances to customers includes QAR 451 million of interest in suspense (2016:
QAR 457 million).
*This includes acceptances pertaining to trade finance amounting to QAR 224 million (2016: QAR 308 million).
Note-i:
2017 2016
Government and related agencies 3,535,924 4,906,445
Corporate 50,232,365 45,826,545
Retail 8,875,325 10,863,814
62,643,614 61,596,804
b) By industry
At 31 December 2017
Loans Overdrafts Bills
discounted
Other
loans
Total
Government and related agencies 1,357,833 2,178,091 - - 3,535,924
Non-banking financial institutions 1,589,511 - - 5,123 1,594,634
Industry 603,026 20,990 31,141 93,217 748,374
Commercial 10,480,480 906,795 147,383 111,885 11,646,543
Services 5,885,439 313,004 170,074 - 6,368,517
Contracting 9,527,115 1,095,701 31,992 324,575 10,979,383
Real estate 17,871,715 416,432 17,851 11,938 18,317,936
Personal 8,361,916 504,333 9,076 - 8,875,325
Others 349,974 153,369 35,872 37,763 576,978
56,027,009 5,588,715 443,389 584,501 62,643,614
Less: Deferred profit (21,467)
Specific impairment of loans and
advances to customers (2,706,410)
Collective impairment allowance (111,563)
59,804,174

DOHA BANK Q.P.S.C. NOTES TO THE CONSOLIDATED FINANCIAL STATEMENTS As at and for the year ended 31 December 2017 QAR ‘000s
57
10 LOANS AND ADVANCES TO CUSTOMERS (CONTINUED)
b) By industry (continued)
At 31 December 2016
Loans Overdrafts Bills
discounted
Other
loans
Total
Government and related agencies 2,359,726 2,546,719 - - 4,906,445
Non-banking financial institutions 1,750,013 - - - 1,750,013
Industry 1,551,236 53,450 67,707 17,278 1,689,671
Commercial 8,290,573 961,795 145,951 273,710 9,672,029
Services 6,352,930 249,268 161,080 11,564 6,774,842
Contracting 9,090,955 1,248,194 95,194 310,208 10,744,551
Real estate 14,147,652 315,635 40,013 11,496 14,514,796
Personal 10,320,926 462,389 7,823 72,676 10,863,814
Others 592,696 66,480 3,106 18,361 680,643
54,456,707 5,903,930 520,874 715,293 61,596,804
Less: Deferred profit (1,343)
Specific impairment of loans and
advances to customers (2,282,717)
Collective impairment allowance (126,522)
59,186,222
c) Movement in impairment loss on loans and advances to customers
2017 2016
Balance at 1 January 2,409,239 2,070,296
Foreign currency translation 3,680 (895)
Provisions made during the year 903,964 753,184
Recoveries during the year (104,578) (98,360)
Net allowance for impairment during the year* 799,386 654,824
Written off/transfers during the year (394,332) (314,986)
Balance at 31 December 2,817,973 2,409,239
*The movement includes the effect of interest suspended on loans and advances to customers as per QCB regulations
amounting to QAR 206.9 million during the year (2016: QAR 174.6 million).

DOHA BANK Q.P.S.C. NOTES TO THE CONSOLIDATED FINANCIAL STATEMENTS As at and for the year ended 31 December 2017 QAR ‘000s
58
10 LOANS AND ADVANCES TO CUSTOMERS (CONTINUED)
c) Movement in impairment loss on loans and advances to customers (continued)
Reconciliations of the allowance for impairment losses for loans and advances to customers, by class, is as follows:
Corporate
lending
SME
lending
Retail
Lending
Real estate
mortgage
lending
Total
Balance at 1 January 1,960,662 60,389 341,283 46,905 2,409,239
Foreign currency translation 2,527 4 (72) 1,221 3,680
Provisions made during the year 726,420 31,023 146,457 64 903,964
Recoveries during the year (55,884) (2,035) (44,212) (2,447) (104,578)
Written off during the year (328,308) (1,191) (64,721) (112) (394,332)
Balance at 31 December 2017 2,305,417 88,190 378,735 45,631 2,817,973
Corporate
lending
SME
lending
Retail
lending
Real estate
mortgage
lending
Total
Balance at 1 January 1,553,606 68,745 362,421 85,524 2,070,296
Foreign currency translation (681) - (214) - (895)
Provisions made during the year 618,295 18,529 109,429 6,931 753,184
Recoveries during the year (31,279) (4,907) (32,971) (29,203) (98,360)
Written off during the year (179,279) (21,978) (97,382) (16,347) (314,986)
Balance at 31 December 2016 1,960,662 60,389 341,283 46,905 2,409,239
11 INVESTMENT SECURITIES
The analysis of investment securities is detailed below:
2017 2016
Available-for-sale 12,065,115 8,524,454
Investment securities classified as held for trading - 5,657
Held-to-maturity* 5,708,651 6,405,787
17,773,766 14,935,898
Impairment losses (261,156) (229,788)
Total 17,512,610 14,706,110
*The Group has pledged State of Qatar Bonds amounting to QAR 4,606 million (2016: QAR 2,545 million) against
repurchase agreements.
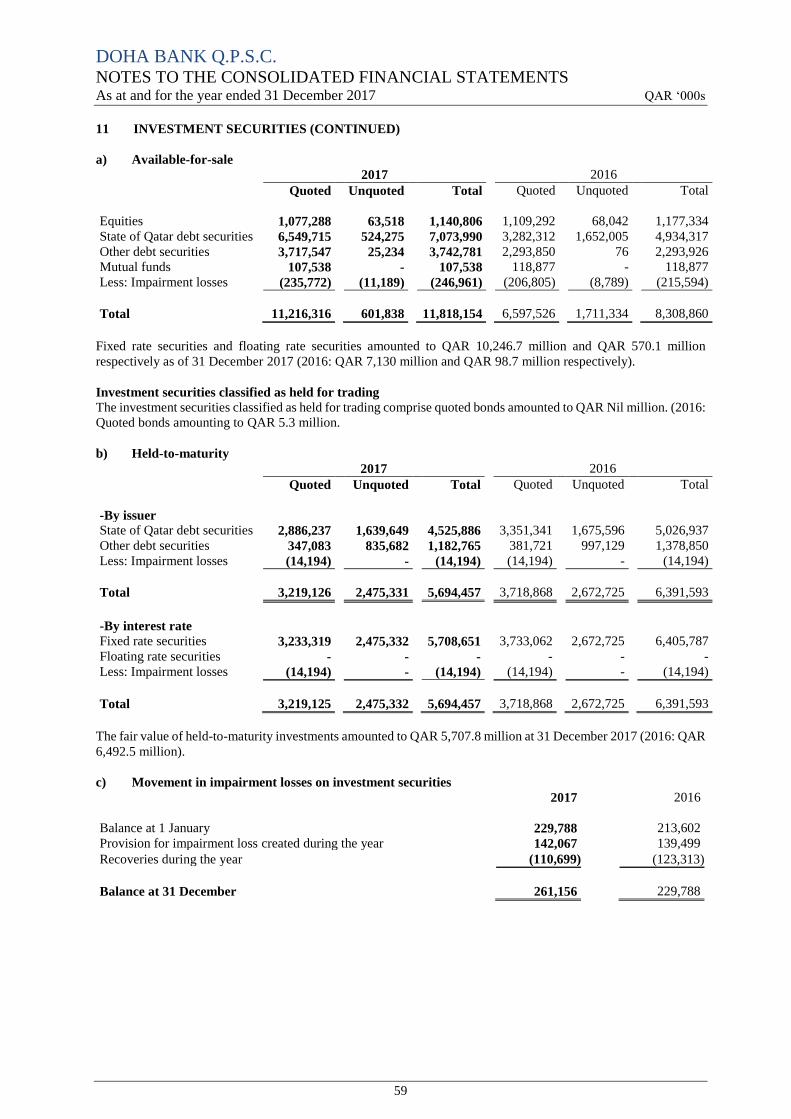
DOHA BANK Q.P.S.C. NOTES TO THE CONSOLIDATED FINANCIAL STATEMENTS As at and for the year ended 31 December 2017 QAR ‘000s
59
11 INVESTMENT SECURITIES (CONTINUED)
a) Available-for-sale
2017 2016
Quoted Unquoted Total Quoted Unquoted Total
Equities 1,077,288 63,518 1,140,806 1,109,292 68,042 1,177,334
State of Qatar debt securities 6,549,715 524,275 7,073,990 3,282,312 1,652,005 4,934,317
Other debt securities 3,717,547 25,234 3,742,781 2,293,850 76 2,293,926
Mutual funds 107,538 - 107,538 118,877 - 118,877
Less: Impairment losses (235,772) (11,189) (246,961) (206,805) (8,789) (215,594)
Total 11,216,316 601,838 11,818,154 6,597,526 1,711,334 8,308,860
Fixed rate securities and floating rate securities amounted to QAR 10,246.7 million and QAR 570.1 million
respectively as of 31 December 2017 (2016: QAR 7,130 million and QAR 98.7 million respectively).
Investment securities classified as held for trading
The investment securities classified as held for trading comprise quoted bonds amounted to QAR Nil million. (2016:
Quoted bonds amounting to QAR 5.3 million.
b) Held-to-maturity
2017 2016
Quoted Unquoted Total Quoted Unquoted Total
-By issuer
State of Qatar debt securities 2,886,237 1,639,649 4,525,886 3,351,341 1,675,596 5,026,937
Other debt securities 347,083 835,682 1,182,765 381,721 997,129 1,378,850
Less: Impairment losses (14,194) - (14,194) (14,194) - (14,194)
Total 3,219,126 2,475,331 5,694,457 3,718,868 2,672,725 6,391,593
-By interest rate
Fixed rate securities 3,233,319 2,475,332 5,708,651 3,733,062 2,672,725 6,405,787
Floating rate securities - - - - - -
Less: Impairment losses (14,194) - (14,194) (14,194) - (14,194)
Total 3,219,125 2,475,332 5,694,457 3,718,868 2,672,725 6,391,593
The fair value of held-to-maturity investments amounted to QAR 5,707.8 million at 31 December 2017 (2016: QAR
6,492.5 million).
c) Movement in impairment losses on investment securities
2017 2016
Balance at 1 January 229,788 213,602
Provision for impairment loss created during the year 142,067 139,499
Recoveries during the year (110,699) (123,313)
Balance at 31 December 261,156 229,788

DOHA BANK Q.P.S.C. NOTES TO THE CONSOLIDATED FINANCIAL STATEMENTS As at and for the year ended 31 December 2017 QAR ‘000s
60
12 INVESTMENT IN AN ASSOCIATE
2017 2016
Balance at 1 January 10,343 8,908
Foreign currency translation 693 (257)
Acquisition during the year - 1,738
Share of results 158 (46)
Cash dividend (68) -
Balance at 31 December 11,126 10,343
The financial position and results of the associates based on audited financial statements, as at and for the year
ended 31 December is as follows:
31 December 2017 2016
Total assets 45,955 30,140
Total liabilities 30,861 16,295
Total revenue 11,226 8,300
Profit / (loss) 359 (104)
Share of profit / (loss) 158 (46)

DOHA BANK Q.P.S.C. NOTES TO THE CONSOLIDATED FINANCIAL STATEMENTS As at and for the year ended 31 December 2017 QAR ‘000s
61
13 PROPERTY, FURNITURE AND EQUIPMENT
Land
and
buildings
Leasehold
improvements
Furniture
and
equipment
Vehicles Total
At 31 December 2017
Cost:
Balance at 1 January 811,510 179,691 493,211 9,734 1,494,146
Additions/ transfers 69 19,270 16,777 568 36,684
Disposals/Write-off - (3,310) (269) (2,224) (5,803)
811,579 195,651 509,719 8,078 1,525,027
Depreciation:
Balance at 1 January 219,911 131,863 363,223 8,304 723,301
Depreciation 32,611 15,349 50,232 628 98,820
Disposals/Write-off - (3,244) (206) (2,224) (5,674)
252,522 143,968 413,249 6,708 816,447
Net Book Value 559,057 51,683 96,470 1,370 708,580
Land
and
buildings
Leasehold
improvements
Furniture
and
equipment
Vehicles Total
At 31 December 2016
Cost:
Balance at 1 January 821,100 156,429 449,557 11,931 1,439,017
Additions/ transfers 91 26,169 62,196 687 89,143
Disposals (9,681) (2,907) (18,542) (2,884) (34,014)
811,510 179,691 493,211 9,734 1,494,146
Depreciation:
Balance at 1 January 187,558 121,561 333,556 10,555 653,230
Depreciation 32,673 13,210 47,127 632 93,642
Disposals (320) (2,908) (17,460) (2,883) (23,571)
219,911 131,863 363,223 8,304 723,301
Net Book Value 591,599 47,828 129,988 1,430 770,845

DOHA BANK Q.P.S.C. NOTES TO THE CONSOLIDATED FINANCIAL STATEMENTS As at and for the year ended 31 December 2017 QAR ‘000s
62
14 OTHER ASSETS
2017 2016
Interest receivable 190,238 165,942
Prepaid expenses 39,538 53,573
Repossessed collaterals* 134,000 -
Positive fair value of derivatives (Note 34) 161,863 107,746
Deferred tax asset 132,205 89,177
Sundry debtors 12,130 2,122
Others 297,225 507,209
967,199 925,769
*This represents the value of the properties acquired in settlement of debts which are stated at their carrying value.
The estimated market values of these properties as at 31 December 2017 are not materially different from the
carrying values
15 DUE TO BANKS
2017 2016
Balances due to central banks 1,638,675 728,300
Current accounts 148,216 208,068
Certificate of deposits - 700,000
Short-term loan from banks 3,270,792 8,272,925
Repo borrowings 5,947,378 2,366,043
11,005,061 12,275,336
16 CUSTOMER DEPOSITS
a) By type
2017 2016
Current and call deposits 7,972,033 10,022,348
Saving deposits 2,056,231 2,312,654
Time deposits 49,440,062 43,394,948
59,468,326 55,729,950
b) By sector
2017 2016
Government and semi government agencies 29,911,274 21,543,253
Individuals 8,981,229 10,218,732
Corporates 17,318,389 22,291,246
Non-banking financial institutions 3,257,434 1,676,719
59,468,326 55,729,950

DOHA BANK Q.P.S.C. NOTES TO THE CONSOLIDATED FINANCIAL STATEMENTS As at and for the year ended 31 December 2017 QAR ‘000s
63
17 DEBT SECURITIES
The Group has issued subordinated debt notes and senior guaranteed notes as follows:
2017 2016
Senior guaranteed notes 657,669 1,819,598
657,669 1,819,598
Note
During current year, the Group issued USD 75 million and JPY 11.9 billion senior unsecured debt under its
updated EMTN programme.
On 14 March 2012, the Group issued US$ 500 million senior guaranteed notes at 98.964% of the nominal value.
The notes have a minimum nominal denomination of US$ 200,000. The notes mature in 2017 and carry interest at
fixed rate of 3.50% payable semi-annually.
18 OTHER BORROWINGS
2017 2016
Term loan facilities 5,432,936 4,994,474
The table below shows the maturity profile of other borrowings.
2017 2016
Up to 1 year 2,727,621 3,293,026
Between 1 and 3 years 2,705,315 1,701,448
5,432,936 4,994,474
19 OTHER LIABILITIES
2017 2016
Interest payable 297,763 281,650
Accrued expense payable 72,124 58,030
Provision for end of service benefits (note-i) 131,020 125,207
Staff provident fund* 50,904 58,231
Tax payable 34,678 31,308
Negative fair value of derivatives ( note 34) 47,499 28,976
Unearned income 98,108 83,387
Cash margins 437,537 315,179
Dividend payable 54,092 48,178
Unclaimed balances 11,831 8,240
Proposed transfer to social and sport fund 27,752 26,345
Others** 860,984 1,100,325
Total 2,124,292 2,165,056
* Staff provident fund contribution was ceased effective July 2016 except for the Qatari and other GCC nationals.
**This includes acceptances pertaining to trade finance amounting to QAR 224 million (2016: QAR 308 million).

DOHA BANK Q.P.S.C. NOTES TO THE CONSOLIDATED FINANCIAL STATEMENTS As at and for the year ended 31 December 2017 QAR ‘000s
64
19 OTHER LIABILITIES (CONTINUED)
Note-i
Provision for end of service benefits
2017 2016
Balance at 1 January 125,207 216,122
Provision for the year 19,222 35,245
Provisions used during the year* (13,409) (126,160)
Balance at 31 December 131,020 125,207
* 50% of the end of service benefits had been paid to all staff during the year
20 EQUITY
a. Share capital
Ordinary shares
2017 2016
In thousands of shares
On issue at the beginning of the reporting period 310,047 258,372
On issue at 31 December 310,047 258,372
At 31 December 2017, the authorised share capital comprised 310,047 thousands ordinary shares (2016: 258,372
thousands). These instruments have a par value of QAR 10. All issued shares are fully paid.
On 9 May 2017, the Bank closed its right issue subscription and received QAR 1,292 million from its shareholders
towards the Bank’s offer to increase its share capital through the issuance of 51,674,450 new shares at a premium
of QAR 15, in addition to a nominal value of QAR 10 per share, as resolved by the bank’s Extraordinary General
Assembly held on 6 March 2017.
Shares were listed on Qatar Exchange as on 12 July 2017 and the paid up capital of the Bank has been increased to
QAR 3,100,467,020.
The holders of ordinary shares are entitled to receive dividends as declared from time to time and are entitled to
one vote per share at meetings of the Group.
b. Legal reserve
In accordance with Qatar Central Bank’s Law No. 13 of 2012, 10% of the net profit for the year is required to be
transferred to legal reserve until the legal reserve equals 100% of the paid up capital. This reserve is not available
for distribution except in circumstances specified in the Qatar Commercial Companies’ Law No. 11 of 2015 and is
subject to the approval of QCB. No transfer was made during the year as the legal reserve is in excess of 100% of
the paid up capital.
The legal reserve includes share premium received on issuance of new shares in accordance with Qatar Commercial
Companies Law 11 of 2015.
c. Risk reserve
In accordance with the Qatar Central Bank regulations, a minimum requirement of 2.5% of the net loans and
advances to customers except for facilities granted to Government, is required as risk reserve to cover any
contingencies.
The Group has an outstanding balance of QAR 1.37 billion under its risk reserve as at year ended 2017 which is in
line with the minimum requirement (2016: QAR 80 million transferred to risk reserve).

DOHA BANK Q.P.S.C. NOTES TO THE CONSOLIDATED FINANCIAL STATEMENTS As at and for the year ended 31 December 2017 QAR ‘000s
65
20 EQUITY (CONTINUED)
d. Fair value reserve
This reserve comprises the fair value changes recognised on available-for-sale financial assets.
2017 2016
Balance at 1 January (103,412) (269,676)
Net unrealized (loss) on available-for-sale investment securities (100,156) (34,035)
Reclassified to consolidated statement of Income 136,013 200,299
Net change in fair value of available – for – sale investment securities 35,857 166,264
Balance at 31 December (67,555) (103,412)
e. Foreign currency translation reserve
The translation reserve comprises all foreign exchange differences arising from the translation of the financial
statements of foreign operations.
f. Proposed dividend
The Board of Directors of the Group has proposed a cash dividend of 30% of paid up share capital amounting to
QAR 930.1 million - QAR 3.00 per share (2016: 30% of paid up share capital amounting to QAR 775.1 million -
QAR 3.00 per share) which is subject to approval at the Annual General Meeting of the shareholders.
g. Instrument eligible as additional capital
2017 2016
Issued on 31 December 2013 2,000,000 2,000,000
Issued on 30 June 2016 2,000,000 2,000,000
4,000,000 4,000,000
The Group has issued regulatory Tier I capital notes totaling to QAR 4 billion. These notes are perpetual,
subordinated, unsecured and each has been priced at a fixed rate for the first six years and shall be re-priced
thereafter. The coupon is discretionary and the event on non-payment is not considered as an event of default. The
notes carry no maturity date and have been classified under Tier 1 capital.
21 INTEREST INCOME
2017 2016
Balance with central banks 3,429 1,774
Due from banks and non-banking financial institutions 98,624 100,393
Debt securities 566,699 446,879
Loans and advances to customers 2,962,101 2,619,949
3,630,853 3,168,995

DOHA BANK Q.P.S.C. NOTES TO THE CONSOLIDATED FINANCIAL STATEMENTS As at and for the year ended 31 December 2017 QAR ‘000s
66
22 INTEREST EXPENSE
2017 2016
Due to banks 361,654 231,118
Customer deposits 996,384 798,725
Debt securities 17,344 78,506
1,375,382 1,108,349
23 FEE AND COMMISSION INCOME
2017 2016
Credit related fees 88,002 108,741
Brokerage fees 667 645
Bank services fee 258,167 232,601
Commission on unfunded facilities 136,667 134,113
Others 32,810 26,848
516,313 502,948
24 FEE AND COMMISSION EXPENSE
2017 2016
Bank fees 1,051 1,185
Others 50,737 41,984
51,788 43,169
25 FOREIGN EXCHANGE GAIN
2017 2016
Dealing in foreign currencies 25,643 47,169
Revaluation of assets and liabilities 80,901 55,077
106,544 102,246
26 INCOME FROM INVESTMENT SECURITIES
2017 2016
Net gains/(loss) on investment securities 10,571 (5,095)
Dividend income 39,251 60,679
49,822 55,584

DOHA BANK Q.P.S.C. NOTES TO THE CONSOLIDATED FINANCIAL STATEMENTS As at and for the year ended 31 December 2017 QAR ‘000s
67
27 OTHER OPERATING INCOME
2017 2016
Recoveries from loans and advances to customers previously written-off 31,199 28,875
Rental income 12,797 12,509
Others 18,280 13,495
62,276 54,879
28 STAFF COSTS
2017 2016
Staff cost 505,151 469,159
Staff pension fund costs 5,168 9,845
End of service benefits 19,222 35,245
Training 1,568 2,055
531,109 516,304
29 OTHER EXPENSES
2017 2016
Advertising 33,329 33,424
Professional fees 27,534 42,529
Communication and insurance 44,727 51,841
Board of Directors’ remuneration 19,736 15,221
Occupancy and maintenance 123,441 100,686
Computer and IT costs 37,468 38,159
Printing and stationery 10,494 11,734
Travel and entertainment costs 6,909 7,189
Others 169,026 158,662
472,664 459,445
30 TAX EXPENSE
2017 2016
Current tax expense
Current year 35,508 32,207
Adjustments for prior years 158 29
35,666 32,236
Deferred tax expense
Temporary differences (36,943) (34,019)
Income tax (reversal) (1,277) (1,783)

DOHA BANK Q.P.S.C. NOTES TO THE CONSOLIDATED FINANCIAL STATEMENTS As at and for the year ended 31 December 2017 QAR ‘000s
68
31 BASIC AND DILUTED EARNINGS PER SHARE
Earnings per share of the Group is calculated by dividing profit for the year attributable to the equity holders (further
adjusted for interest expense on tier 1capital notes) of the Bank by the weighted average number of ordinary shares
in outstanding during the year:
2017 2016
Profit for the year attributable to the equity holders of the Group 1,110,074 1,053,781
Deduct : Interest on Tier 1 capital notes (220,000) (220,000)
Net profit attributable to equity holders of the Group 890,074 833,781
Weighted average number of outstanding shares (in thousands) 295,152 267,575
Earnings per share (QAR) 3.02 3.12
The weighted average number of shares are as follows:
2017 2016
In thousands of shares
Weighted average number of shares at 31 December 295,152 267,575
32 CONTINGENT LIABILITIES AND OTHER COMMITMENTS
2017 2016
Contingent liabilities
Unused facilities 3,737,358 3,577,504
Guarantees 18,380,848 22,246,187
Letters of credit 5,958,391 7,196,260
Others 207,200 161,142
Total 28,283,797 33,181,093
Other commitments
Forward foreign exchange contracts 7,091,767 30,696,684
Interest rate swaps 3,256,877 1,822,890
Total 10,348,644 32,519,574
Unused facilities Commitments to extend credit represent contractual commitments to make loans and revolving credits. The majority
of these expire within a year. Since commitments may expire without being drawn upon, the total contractual
amounts do not necessarily represent future cash requirements.
Guarantees and Letters of credit Guarantees and letters of credit commit the Group to make payments on behalf of customers in the event of a
specific event. Guarantees and standby letters of credit carry the same credit risk as loans.
Lease commitments The Group has entered into commercial leases on certain buildings. These leases have an average duration between
three and five years. There are no restrictions placed upon the Group by entering into these leases.

DOHA BANK Q.P.S.C. NOTES TO THE CONSOLIDATED FINANCIAL STATEMENTS As at and for the year ended 31 December 2017 QAR ‘000s
69
32 CONTINGENT LIABILITIES AND OTHER COMMITMENTS (CONTINUED)
Future minimum lease payments under non-cancellable leases as at December 31 are as follow:
2017 2016
Less than one year 12,304 14,375
Between one and five years 20,957 21,830
More than five years 3,918 2,584
37,179 38,789
33 CASH AND CASH EQUIVALENTS
2017 2016
Cash and balances with central banks* 4,380,783 2,222,899
Due from banks and other financial institutions maturing within 3 months 5,924,892 6,693,115
10,305,675 8,916,014
*Cash and balances with central banks do not include the mandatory cash reserve.

DOHA BANK Q.P.S.C. NOTES TO THE CONSOLIDATED FINANCIAL STATEMENTS As at and for the year 31 December 2017 QAR ‘000s
70
34 DERIVATIVES
Notional / expected amount by term to maturity
Positive Negative Notional within 3 - 12 1-5 More than
fair value fair value Amount 3 months months years 5 years
At 31 December 2017:
Derivatives held for trading:
Forward foreign exchange contracts 102,253 20,014 7,091,767 4,555,558 2,536,209 - -
Derivatives held for fair value hedges:
Interest rate swaps 59,610 27,485 3,256,877 7,283 20,028 993,765 2,235,801
Notional / expected amount by term to maturity
Positive Negative Notional within 3 - 12 1-5 More than
fair value fair value Amount 3 months months years 5 years
At 31 December 2016:
Derivatives held for trading:
Forward foreign exchange contracts 52,145 19,827 30,696,684 26,292,656 4,404,028 - -
Derivatives held for fair value hedges:
Interest rate swaps 55,601 9,149 1,822,890 - 25,491 733,398 1,064,001

DOHA BANK Q.P.S.C. NOTES TO THE CONSOLIDATED FINANCIAL STATEMENTS As at and for the year ended 31 December 2017 QAR ‘000s
71
35 RELATED PARTIES
Parties are considered to be related if one party has the ability to control the other party or exercise significant
influence over the other party in making financial and operating decisions, Related parties include entities over
which the Group exercises significant influence, major shareholders, directors and key management personnel of
the Group. The Group enters into transactions, arrangements and agreements involving directors, senior
management and their related concerns in the ordinary course of business at commercial interest and commission
rates.
The related party transactions and balances included in these consolidated financial statements are as follows:
2017 2016
Board of
directors
Others
Board of
directors
Others
Assets:
Loans and advances to customers 2,599,973 - 1,350,895 -
Liabilities:
Customer deposits 371,327 13,055 394,631 19,506
Unfunded items:
Contingent liabilities and other commitments 998,210 - 754,262 -
Other assets 8,305 - 8,305 -
Income statement items:
Interest, commission and other income 49,751 1,131 40,669 -
Interest, commission and other expense 10,035 430 7,825 515
No impairment losses have been recorded against balances outstanding during the period with key management
personnel.
Key management personnel (including Board of Directors) compensation for the year comprised:
2017 2016
Salaries and other benefits 63,763 57,282
End of service indemnity benefits and provident fund 3,167 6,352
66,930 63,634

DOHA BANK Q.P.S.C. NOTES TO THE CONSOLIDATED FINANCIAL STATEMENTS As at and for the year ended 31 December 2017 QAR ‘000s
72
36 COMPARATIVES
The comparative figures have been reclassified where necessary to preserve consistency with the current year.
However, such reclassification did not have any effect on the consolidated net profit or equity for the comparative
year.

DOHA BANK Q.P.S.C. QAR ‘000s
SUPPLEMENTARY INFORMATION As at 31 December 2017
73
FINANCIAL STATEMENTS OF THE PARENT
SUPPLEMENTARY INFORMATION TO THE FINANCIAL STATEMENTS
Statement of Financial Position – Parent Bank
As at 31 December 2017 2016
ASSETS
Cash and balances with central banks 6,669,495 4,260,410
Due from banks 7,756,325 10,434,909
Loans and advances to customers 59,804,174 59,186,222
Investment securities 17,511,786 14,707,791
Investment in an associate 11,126 10,343
Property, furniture and equipment 707,951 770,292
Other assets 903,385 848,286
TOTAL ASSETS 93,364,242 90,218,253
LIABILITIES
Due to banks 11,005,061 12,275,336
Customer deposits 59,483,483 55,745,593
Debt securities 657,669 1,819,598
Other borrowings 5,432,936 4,994,474
Other liabilities 2,032,648 2,058,409
TOTAL LIABILITIES 78,611,797 76,893,410
EQUITY
Share capital 3,100,467 2,583,723
Legal reserve 5,080,853 4,305,737
Risk reserve 1,372,000 1,372,000
Fair value reserves (62,581) (100,001)
Foreign currency translation reserve (13,451) (24,991)
Proposed dividend 930,140 775,117
Retained earnings 345,017 413,258
TOTAL EQUITY ATTRIBUTABLE TO SHAREHOLDERS OF
THE BANK
10,752,445
9,324,843
Instrument eligible as additional capital 4,000,000 4,000,000
TOTAL EQUITY 14,752,445 13,324,843
TOTAL LIABILITIES AND EQUITY 93,364,242 90,218,253

DOHA BANK Q.P.S.C. QAR ‘000s
SUPPLEMENTARY INFORMATION For the year ended 31 December 2017
74
FINANCIAL STATEMENTS OF THE PARENT BANK (CONTINUED)
SUPPLEMENTARY INFORMATION TO THE FINANCIAL STATEMENTS (CONTINUED)
Income Statement – Parent Bank
2017 2016
Interest income 3,630,853 3,168,995
Interest expense (1,375,497) (1,109,061)
Net interest income 2,255,356 2,059,934
Fee and commission income 516,313 502,948
Fee and commission expense (51,788) (43,169)
Net fee and commission income 464,525 459,779
Foreign exchange gain 106,544 102,246
Income from investment securities 49,524 54,020
Other operating income 59,405 54,541
215,473 210,807
Net operating income 2,935,354 2,730,520
Staff costs (521,984) (505,068)
Depreciation and amortisation (98,563) (93,388)
Impairment loss on investment securities and due from banks (142,067) (138,771)
Net impairment loss on loans and advances to customers (592,541) (480,224)
Other expenses (471,997) (464,462)
(1,827,152) (1,681,913)
Profit for the year before tax 1,108,202 1,048,607
Tax reversal 1,291 2,158
Profit for the year 1,109,493 1,050,765