Consolidated Financial Statements - FEMSA · Financial Summary 38 Management’s Discussion and...
78
37 creating stories Contents Financial Summary 38 Management’s Discussion and Analysis 40 Audit Committee Annual Report 44 Independent Auditors’ Report 46 Consolidated Statements of Financial Position 47 Consolidated Income Statements 48 Consolidated Statements of Comprehensive Income 49 Consolidated Statements of Changes in Equity 50 Consolidated Statements of Cash Flows 52 Notes to the Consolidated Financial Statements 53 Headquarters 114 Consolidated Financial Statements
Transcript of Consolidated Financial Statements - FEMSA · Financial Summary 38 Management’s Discussion and...
FEMSA Annual Report 2015 37PB creating stories
Contents
Financial Summary 38
Management’s Discussion and Analysis 40
Audit Committee Annual Report 44
Independent Auditors’ Report 46
Consolidated Statements of Financial Position 47
Consolidated Income Statements 48
Consolidated Statements of Comprehensive Income 49
Consolidated Statements of Changes in Equity 50
Consolidated Statements of Cash Flows 52
Notes to the Consolidated Financial Statements 53
Headquarters 114
ConsolidatedFinancialStatements

FEMSA Annual Report 2015 3938 creating stories
FOMENTO ECONÓMICO MEXICANO, S.A.B. DE C.V. AND SUBSIDIARIESMONTERREY, N.L., MEXICO
Amounts expressed in millions of Mexican pesos (Ps.)as of December 31:
2015 2014 2013 2012 2011 (1)
Income StatementNet sales Ps. 310,849 Ps. 262,779 Ps. 256,804 Ps. 236,922 200,426Total revenues 311,589 263,449 258,097 238,309 201,540Cost of goods sold 188,410 153,278 148,443 137,009 117,244Gross profit 123,179 110,171 109,654 101,300 84,296Operating expenses 89,444 80,188 79,797 72,073 59,812Income from operations (2) 33,735 29,983 29,857 29,227 24,484Other non-operating expenses (income), net 954 (508) 326 (345) 625 Financing expenses, net 7,618 6,988 4,249 1,904 196 Income before income taxes and share of the profit of associates and joint venturesaccounted for using the equity method 25,163 23,503 25,282 27,668 23,663 Income taxes 7,932 6,253 7,756 7,949 7,618 Share of the profit of associates and joint ventures accounted for using the equity method, net of taxes 6,045 5,380 4,629 8,332 4,856 Consolidated net income 23,276 22,630 22,155 28,051 20,901 Controlling Interest 17,683 16,701 15,922 20,707 15,332 Non-Controlling Interest 5,593 5,929 6,233 7,344 5,569 Ratios to total revenues (%) Gross margin 39.5% 41.8% 42.5% 42.5% 41.8% Operating margin 10.8% 11.4% 11.6% 12.3% 12.1% Consolidated net income 7.5% 8.6% 8.6% 11.8% 10.4%Other information Depreciation 9,761 9,029 8,805 7,175 5,694 Amortization and other non cash charges to income from operations 3,130 1,933 1,208 1,278 1,320 Operative Cash Flow (EBITDA) 46,626 40,945 39,870 37,680 31,498 Capital expenditures (3) 18,885 18,163 17,882 15,560 12,609
Financial Summary
FEMSA Annual Report 2015 3938 creating stories
2015 2014 2013 2012 2011 (1)
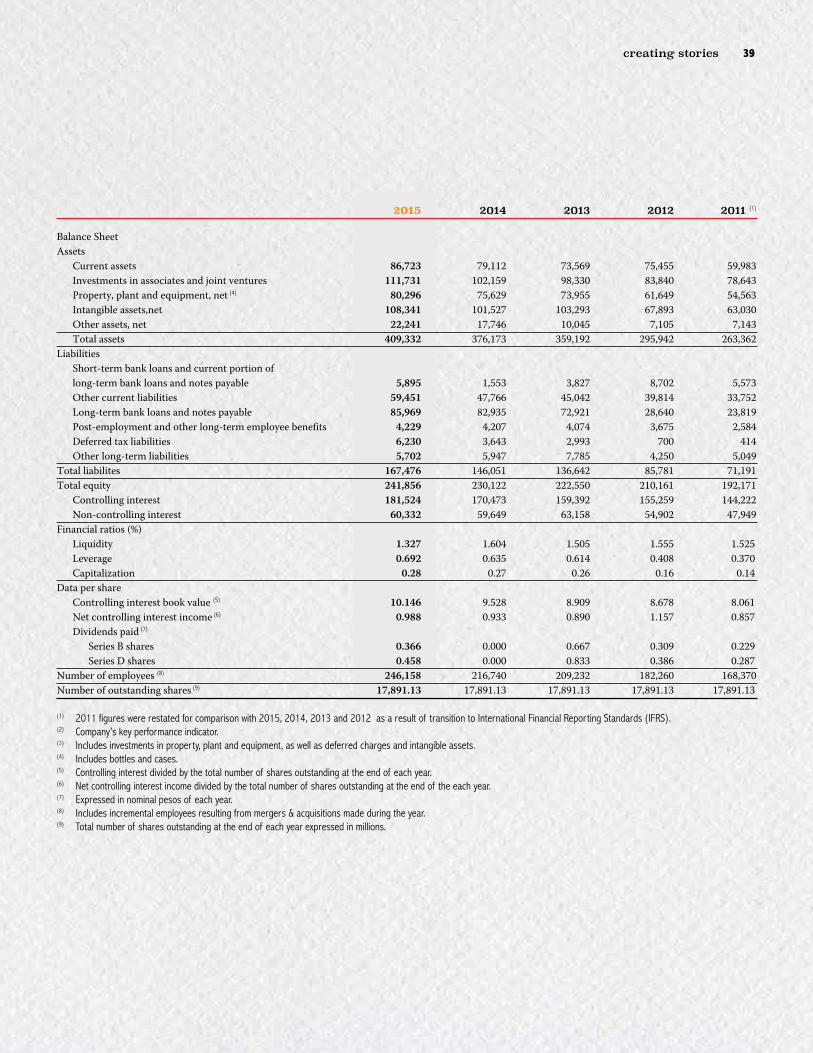
Balance SheetAssets Current assets 86,723 79,112 73,569 75,455 59,983 Investments in associates and joint ventures 111,731 102,159 98,330 83,840 78,643 Property, plant and equipment, net (4) 80,296 75,629 73,955 61,649 54,563 Intangible assets,net 108,341 101,527 103,293 67,893 63,030 Other assets, net 22,241 17,746 10,045 7,105 7,143 Total assets 409,332 376,173 359,192 295,942 263,362Liabilities Short-term bank loans and current portion of long-term bank loans and notes payable 5,895 1,553 3,827 8,702 5,573 Other current liabilities 59,451 47,766 45,042 39,814 33,752 Long-term bank loans and notes payable 85,969 82,935 72,921 28,640 23,819 Post-employment and other long-term employee benefits 4,229 4,207 4,074 3,675 2,584 Deferred tax liabilities 6,230 3,643 2,993 700 414 Other long-term liabilities 5,702 5,947 7,785 4,250 5,049Total liabilites 167,476 146,051 136,642 85,781 71,191Total equity 241,856 230,122 222,550 210,161 192,171 Controlling interest 181,524 170,473 159,392 155,259 144,222 Non-controlling interest 60,332 59,649 63,158 54,902 47,949Financial ratios (%) Liquidity 1.327 1.604 1.505 1.555 1.525 Leverage 0.692 0.635 0.614 0.408 0.370 Capitalization 0.28 0.27 0.26 0.16 0.14 Data per share Controlling interest book value (5) 10.146 9.528 8.909 8.678 8.061 Net controlling interest income (6) 0.988 0.933 0.890 1.157 0.857 Dividends paid (7)
Series B shares 0.366 0.000 0.667 0.309 0.229 Series D shares 0.458 0.000 0.833 0.386 0.287Number of employees (8) 246,158 216,740 209,232 182,260 168,370Number of outstanding shares (9) 17,891.13 17,891.13 17,891.13 17,891.13 17,891.13
(1) 2011 figures were restated for comparison with 2015, 2014, 2013 and 2012 as a result of transition to International Financial Reporting Standards (IFRS). (2) Company’s key performance indicator.(3) Includes investments in property, plant and equipment, as well as deferred charges and intangible assets.(4) Includes bottles and cases.(5) Controlling interest divided by the total number of shares outstanding at the end of each year.(6) Net controlling interest income divided by the total number of shares outstanding at the end of the each year.(7) Expressed in nominal pesos of each year.(8) Includes incremental employees resulting from mergers & acquisitions made during the year.(9) Total number of shares outstanding at the end of each year expressed in millions.
FEMSA Annual Report 2015 4140 creating stories
Fomento Económico Mexicano, S.A.B. de C.V. (“FEMSA”) is a Mexican holding company. Set forth below is certain audited financial information for FEMSA and its subsidiaries (the “Company” or “FEMSA Consolidated”) (NYSE: FMX; BMV: FEMSA UBD). The principal activities of the Company are grouped mainly under the following subholding companies (the “Subholding Companies”): Coca-Cola FEMSA, S.A.B de C.V. (“Coca-Cola FEMSA” or “KOF”), (NYSE: KOF, BMV: KOFL) which engages in the production, distribution and marketing of beverages, and FEMSA Comercio, S.A. de C.V. (“FEMSA Comercio”), including its Retail Division which operates small-format chain stores and its Fuel Division which operates retail service stations for fuels, motor oils and others, the latter of which, as of December 31, 2015 , is treated as a separate business segment called Fuel Division.
The consolidated financial information included in this annual report was prepared in accordance with International Financial Reporting Standards (“IFRS”) as issued by the International Accounting Standards Board (“IASB”).
The 2015 and 2014 results are stated in nominal Mexican pesos (“pesos” or “Ps.”). Translations of pesos into US dollars (“US$”) are included solely for the convenience of the reader and are determined using the noon buying rate for pesos as published by the U.S. Federal Reserve Board in its H.10 Weekly Release of Foreign Exchange Rates as of December 31, 2015, which was 17.1950 pesos per US dollar.
This report may contain certain forward-looking statements concerning Company’s future performance that should be considered good faith estimates made by the Company. These forward-looking statements reflect management expectations and are based upon currently available data. Actual results are subject to future events and uncertainties, which could materially impact the Company’s actual performance.
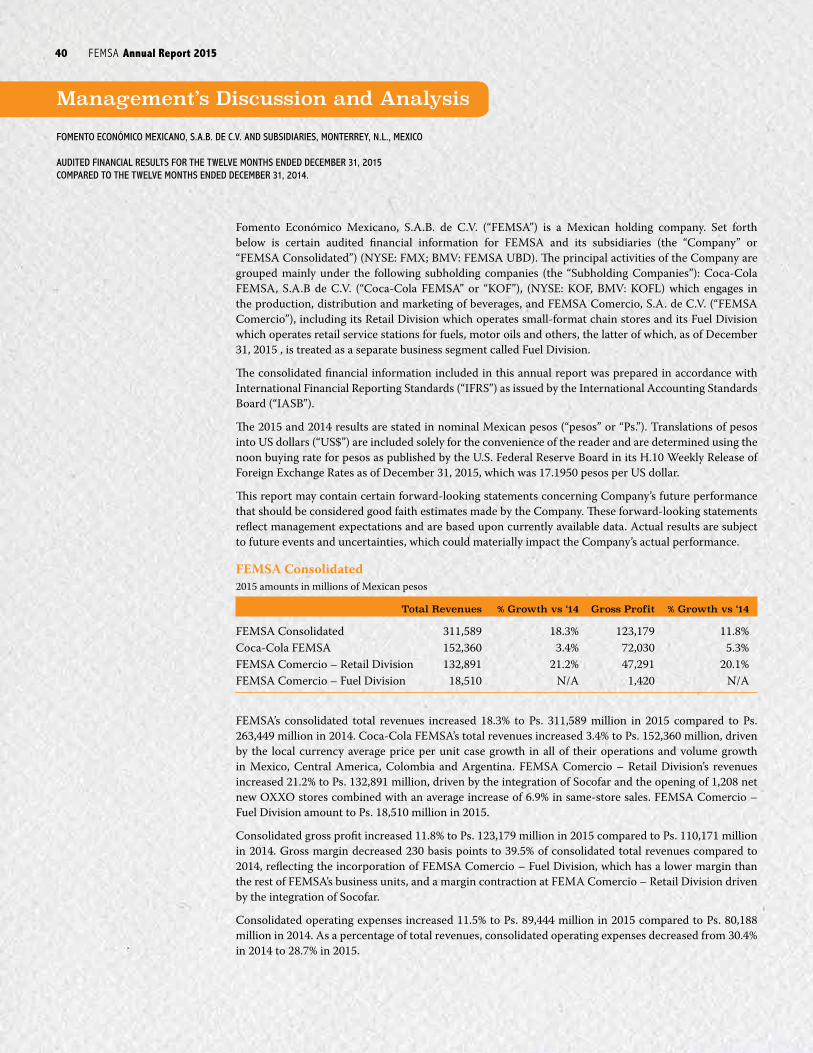
FEMSA Consolidated2015 amounts in millions of Mexican pesos
Total Revenues % Growth vs ‘14 Gross Profit % Growth vs ‘14
FEMSA Consolidated 311,589 18.3% 123,179 11.8%Coca-Cola FEMSA 152,360 3.4% 72,030 5.3%FEMSA Comercio – Retail Division 132,891 21.2% 47,291 20.1%FEMSA Comercio – Fuel Division 18,510 N/A 1,420 N/A
FEMSA’s consolidated total revenues increased 18.3% to Ps. 311,589 million in 2015 compared to Ps. 263,449 million in 2014. Coca-Cola FEMSA’s total revenues increased 3.4% to Ps. 152,360 million, driven by the local currency average price per unit case growth in all of their operations and volume growth in Mexico, Central America, Colombia and Argentina. FEMSA Comercio – Retail Division’s revenues increased 21.2% to Ps. 132,891 million, driven by the integration of Socofar and the opening of 1,208 net new OXXO stores combined with an average increase of 6.9% in same-store sales. FEMSA Comercio – Fuel Division amount to Ps. 18,510 million in 2015.
Consolidated gross profit increased 11.8% to Ps. 123,179 million in 2015 compared to Ps. 110,171 million in 2014. Gross margin decreased 230 basis points to 39.5% of consolidated total revenues compared to 2014, reflecting the incorporation of FEMSA Comercio – Fuel Division, which has a lower margin than the rest of FEMSA’s business units, and a margin contraction at FEMA Comercio – Retail Division driven by the integration of Socofar.
Consolidated operating expenses increased 11.5% to Ps. 89,444 million in 2015 compared to Ps. 80,188 million in 2014. As a percentage of total revenues, consolidated operating expenses decreased from 30.4% in 2014 to 28.7% in 2015.
FOMENTO ECONÓMICO MEXICANO, S.A.B. DE C.V. AND SUBSIDIARIES, MONTERREY, N.L., MEXICO
AUDITED FINANCIAL RESULTS FOR THE TWELVE MONTHS ENDED DECEMBER 31, 2015COMPARED TO THE TWELVE MONTHS ENDED DECEMBER 31, 2014.
Management’s Discussion and Analysis
FEMSA Annual Report 2015 4140 creating stories
Consolidated administrative expenses increased 14.3% to Ps. 11,705 million in 2015 compared to Ps. 10,244 million in 2014. As a percentage of total revenues, consolidated administrative expenses decreased 10 basis points, from 3.9% in 2014, compared to 3.8% in 2015.
Consolidated selling expenses increased 10.7% to Ps. 76,375 million in 2015 as compared to Ps. 69,016 million in 2014. As a percentage of total revenues, selling expenses decreased 160 basis points, from 26.1% in 2014 to 24.5% in 2015.
Consolidated income from operations increased 12.5% to Ps. 33,735 million in 2015 as compared to Ps. 29,983 million in 2014. As a percentage of total revenues, operating margin decreased 60 basis points, from 11.4% in 2014 to 10.8% in 2015.
Some of our subsidiaries pay management fees to us in consideration for corporate services we provide to them. These fees are recorded as administrative expenses in the respective business segments. Our subsidiaries’ payments of management fees are eliminated in consolidation and, therefore, have no effect on our consolidated operating expenses.
Net financing expenses increased to Ps. 7,618 million from Ps. 6,988 million in 2014, driven by an interest expense of Ps. 7,777 million in 2015 compared to Ps. 6,701 million in 2014 resulting from higher interest expenses at Coca-Cola FEMSA Brazil, following the reset of terms of certain cross-currency swaps related to the acquisition of Spaipa and Fluminense in 2013.
Income before income taxes and share of the profit in Heineken results increased 7.1% to Ps. 25,163 million in 2015 compared with Ps. 23,503 million in 2014, mainly as a result of growth in FEMSA’s income from operations, which more than compensated higher financing expenses.
Our accounting provision for income taxes in 2015 was Ps. 7,932 million, as compared to Ps. 6,253 million in 2014, resulting in an effective tax rate of 31.5% in 2015, as compared to 26.6% in 2014, in line with our expected medium term range of low 30’s. The lower effective tax rate registered during 2014 is mainly related to a one-time benefit resulting from the settlement of certain contingent tax liabilities under the tax amnesty program offered by the Brazilian tax authorities, which was registered during 2014.
Consolidated net income was Ps. 23,276 million in 2015 compared to Ps. 22,630 million in 2014, resulting from growth in FEMSA’s income from operations and an increase in FEMSA’s 20% participation in Heineken’s results, which more than compensated for higher interest expenses. Controlling interest amounted to Ps. 17,683 million in 2015 compared to Ps. 16,701 million in 2014. Controlling interest in 2015 per FEMSA Unit was Ps. 4.94 (US$ 2.87 per ADS).
Coca-Cola FEMSACoca-Cola FEMSA total revenues increased 3.4% to Ps. 152,360 million in 2015, as compared to 2014, despite the negative translation effect resulting from using the SIMADI exchange rate to translate the results of their Venezuelan operation and the depreciation of the Brazilian real, Colombian peso, the Mexican peso and the Argentine peso. On a currency neutral basis and excluding Venezuela, total revenues grew 8.6%, driven by the growth of the average price per unit case in all the operations and volume growth in Mexico, Central America, Colombia and Argentina.
Coca-Cola FEMSA gross profit increased 5.3% to Ps. 72,030 million in 2015, as compared to 2014, with a gross margin expansion of 90 basis points. In local currency, the benefit of lower sweetener and PET prices, in combination with their currency hedging strategy, was partially offset by the depreciation of the average exchange rate of the Brazilian real, the Colombian peso, the Mexican peso and the Argentine peso as applied to our U.S. dollar-denominated raw material costs. Gross margin reached 47.3% in 2015.
The components of cost of goods sold include raw materials (principally concentrate, sweeteners and packaging materials), depreciation costs attributable to our production facilities, wages and other employment costs associated with labor force employed at our production facilities and certain overhead costs. Concentrate prices are determined as a percentage of the retail price of our products in the local currency, net of applicable taxes. Packaging materials, mainly PET and aluminum, and HFCS, used as a sweetener in some countries, are denominated in U.S. dollars.
Operating expenses increased 3.7% to Ps. 49,386 million in 2015 compared with Ps. 47,639 million in 2014.
Administrative expenses increased 0.3% to Ps. 6,405 million in 2015, compared with Ps. 6,385 million in 2014. Selling expenses increased 3.5% to Ps. 41,879 million in 2015 compared with Ps. 40,465 million in 2014.
Income from operations increased 9.2% to Ps. 22,645 million in 2015 compared with Ps. 20,743 million in 2014.
FEMSA Comercio – Retail DivisionFEMSA Comercio – Retail Division total revenues increased 21.2% to Ps. 132,891 million in 2015 compared to Ps. 109,624 million in 2014, primarily as a result of the opening of 1,208 net new OXXO stores during 2015, together with an average increase in same-store sales of 6.9%, as well as the incremental revenues from the acquisitions of Socofar and Farmacon drugstores in Chile and Mexico, respectively. As of December 31, 2015, there were a total of 14,061 OXXO stores. As referenced above, OXXO same-store sales increased an average of

FEMSA Annual Report 2015 4342 creating stories
6.9% compared to 2014, driven by a 5.1% increase in average customer ticket while store traffic increased 1.7%.
Cost of goods sold increased 21.9% to Ps. 85,600 million in 2015, compared with Ps. 70,238 million in 2014. Gross margin contracted 30 basis points to reach 35.6% of total revenues. This decrease was mainly driven by the integration of Socofar and Farmacon drugstores, both of which have a lower gross margins than the OXXO operations. As a result gross profit increase 20.1% to Ps. 47,291 million in 2015 compared with 2014.
Operating expenses increased 18.5% to Ps. 36,393 million in 2015 compared with Ps. 30,706 million in 2014. The increase in operating expenses was driven by (i) expenses related to the incorporation of the new drugstore operations, Socofar and Farmacon, (ii) the strong organic growth in new stores across formats and (iii) the strengthening of FEMSA Comercio’s business and organizational structure in preparation for the growth of new operations, particularly drugstores.
Administrative expenses increased 40.5% to Ps. 2,868 million in 2015, compared with Ps. 2,042 million in 2014; as a percentage of sales, they reach 2.2%. Selling expenses increased 16.9% to Ps. 33,305 million in 2015 compared with Ps. 28,492 million in 2014.
Income from operations increased 25.6% to Ps. 10,898 million in 2015 compared with Ps. 8,680 million in 2014, resulting in an operating margin expansion of 30 basis points to 8.2% as a percentage of total revenues for the year, compared with 7.9% in 2014.
FEMSA Comercio – Fuel DivisionThe operations that comprise the FEMSA Comercio – Fuel Division were integrated in 2015. As such, no results of operation are available for this segment for periods prior to 2015.
FEMSA Comercio – Fuel Division total revenues amounted to Ps. 18,510 million in 2015.
Cost of goods sold reached Ps. 17,090 million in 2015.
Administrative expenses amounted to Ps. 88 million in 2015. Selling expenses reached 1,124 million in 2015.
Key Events During 2015The following texts reproduced our press releases exactly as the time they were published.
Coca-Cola FEMSA granted RobecoSAM’s Industry Mover Sustainability Award 2015
On January 22, 2015 Coca-Cola FEMSA announced that it had been granted the Industry Mover award as part of RobecoSAM’s 2015 “The Sustainability Yearbook”.
In September of 2014, Coca-Cola FEMSA was included for the second consecutive year as a member of the Dow Jones Sustainability Index for Emerging Markets. As one of the topscoring companies in the beverage industry, it has gained a membership in RobecoSAM’s 2015 “The Sustainability Yearbook”, the world’s most comprehensive publication on corporate sustainability. Every year since 2004, The Sustainability Yearbook has listed the world’s most sustainable companies in each industry as determined by their score in RobecoSAM’s annual Corporate Sustainability Assessment (CSA). Coca-Cola FEMSA has been granted the 2015 Industry Mover award for its excellent performance in sustainability. This recognition stands out as it is the first time that a Mexican company participates as a member of The Sustainability Yearbook and also the first time that a Mexican corporate receives RobecoSAM’s Industry Mover Sustainability Award.
Entry into Gas Station Market
On March 1, 2015, FEMSA Comercio announced that since 1995, FEMSA Comercio had provided services and assets for the operation of gasoline service stations through agreements with third parties that owned Mexican Petroleum (Petróleos Mexicanos, or PEMEX) franchises, using the commercial brand OXXO GAS.
Mexican legislation had historically precluded FEMSA Comercio from participating in the retail sale of gasoline and therefore precluded ownership of PEMEX franchises, given FEMSA’s foreign institutional investor base. In response to recent changes in this legislation, FEMSA Comercio, acting through its subsidiary OXXO GAS, agreed on March 1, 2015 to acquire the related PEMEX franchises from the aforementioned third parties and plans to lease, acquire or open more gasoline service stations in the future.
Standard & Poor’s Upgrades FEMSA’s International Credit and Debt Ratings to ‘A-’ from ‘BBB+’ on Strong Credit Metrics, Outlook Stable
On June 11, 2015 - Standard & Poor’s has upgraded FEMSA global scale corporate credit and debt ratings ‘A-’ from ‘BBB+’. At the same time, Standard & Poor’s affirmed the ‘mxAAA’ long-term national scale corporate credit and debt ratings and the ‘mxA-1+’ short-term national scale rating on FEMSA, with a stable outlook.
Coca-Cola FEMSA inaugurates state-of-the art facilities in Brazil and Colombia
On June 12, 2015 Coca-Cola FEMSA announced the inauguration of its new, state-of-the-art bottling facilities in Brazil and Colombia with a combined investment of more than US$500 million.
Built to LEED certification standards, these plants set a benchmark in sustainability in the Coca-Cola System globally, implementing the
FEMSA Annual Report 2015 4342 creating stories
latest technology to deliver a more efficient use of energy and water, as well as using energy co-generation systems.
With an investment of US$258 million, the plant of Itabirito, Minas Gerais, Brazil began construction in 2012 and started operations in November 2014. With an annual production capacity of approximately 370 million unit cases, this plant is expected to generate more than 600 direct and indirect jobs.
Coca-Cola FEMSA’s plant in Tocancipá, Colombia, began construction in 2013 and was completed to begin operations in February 2015. Through an investment of more than US$219 million, this plant is expected to generate approximately 450 direct and indirect jobs and have an annual production capacity of approximately 130 million unit cases.
FEMSA Comercio closes the acquisition of Farmacias Farmacon
On June 18, 2015 FEMSA Comercio announced that its subsidiary Cadena Comercial de Farmacias, S.A.P.I. de C.V. had closed the acquisition of 100% of Farmacias Farmacon after obtaining all required regulatory approvals. Farmacias Farmacon is based in the city of Culiacán, Sinaloa and operated over 200 stores in the Mexican states of Sinaloa, Sonora, Baja California and Baja California Sur. This transaction represents an important step as FEMSA Comercio advances in its strategy in this attractive small-box retail segment.
Coca-Cola FEMSA selected for the third time as a member of the Dow Jones Sustainability Emerging Markets Index
On September 17, 2015 Coca-Cola FEMSA announced that it had been selected for the third consecutive time as a member of the Dow Jones Sustainability Emerging Markets Index.
In September of 2013, Coca-Cola FEMSA was included for the first time as a member of the Dow Jones Sustainability Index for Emerging Markets. As one of the top-scoring companies in the beverage industry, it gained a membership in RobecoSAM’s 2015 “The Sustainability Yearbook”, the world’s most comprehensive publication on corporate sustainability. In January 2015, the Company was granted the Industry Mover award for its excellent performance in sustainability.
FEMSA Comercio closes the acquisition of majority equity stake in Grupo Socofar
On September 23, 2015 FEMSA Comercio announced that it had successfully closed the acquisition of a majority equity stake in Grupo Socofar, (“Socofar”), a leading South American drugstore operator, after obtaining all required regulatory approvals. Socofar is based in Santiago, Chile and operated over 640 drugstores and 150 beauty
stores throughout Chile as well as over 150 drugstores in Colombia.
This transaction represents an important step as FEMSA Comercio advances in its strategy in this attractive small-box retail segment, leveraging its growing expertise in the drugstore business by acquiring control of a best-in-class operator with leading banners and attractive growth prospects in South America, and establishing a solid base from which to expand across the region. It also provides important capabilities to FEMSA Comercio in the operation of standalone beauty store retail banners, pharmaceutical distribution to third-party clients, and the production of generic and bioequivalent pharmaceuticals.
Femsa announces changes to Senior Finance Team
On November 23, 2015 FEMSA announced changes to senior management team that became effective January 18, 2016. Eduardo Padilla Silva, former Chief Executive Officer of FEMSA Comercio, became FEMSA’s Chief Financial and Corporate Officer. For his part Daniel Rodríguez Cofré, former FEMSA’s Chief Financial and Corporate Officer, became Chief Executive Officer of FEMSA Comercio following the successful and proven strategy of rotating top talent among the different areas of business.
Eduardo Padilla, who joined FEMSA in 1997, returns to FEMSA’s corporate office after 16 years heading FEMSA Comercio, a remarkable period during which OXXO has become the leading proximity retail format in Mexico, with more than 13,000 stores across the country as well as promising new formats such as drugstores and gasoline stations. Eduardo and his team have been instrumental in building the culture and putting in place the processes that have enabled this significant growth, while positioning FEMSA Comercio to pursue incremental opportunities in Mexico and beyond. In his new role, Eduardo will be able to apply his talent and energy to the whole of FEMSA’s business portfolio.
After one year heading the financial and staff functions of the Company, Daniel Rodríguez is once again in charge of a large retail enterprise with various formats and operations in several Latin American markets. Daniel joined FEMSA in January of 2015 after being CEO of Chile-based retailer Cencosud for six years, and prior to that he spent more than a decade in senior finance positions at Royal Dutch Shell in the Americas as well as Europe. His expertise in retail and his knowledge of the fuel and lubricant industries will serve Daniel well as he leads FEMSA Comercio through the next stages of its growth.
These appointments represent one more step in the evolution and strengthening of FEMSA’s management team in preparation for sustained growth ahead.

FEMSA Annual Report 2015 4544 creating stories
To the Board of Directors Fomento Económico Mexicano, S.A.B. de C.V. (the “Company”):
We were in permanent and direct communication with them to be timely informed of their progress and their observations, and also to consider any comments that resulted from their review of the quarterly financial statements. We were timely informed of their conclusions and reports, regarding the annual financial statements and followed up on the actions implemented resulting from the findings and recommendations provided during the year.
We authorized the fees of the external auditors for their annual audit and other permitted services, and verified that such services would not compromise their Independence.
With the appropriate input from Management, we carried out an evaluation of their services for the previous year and initiated the evaluation process for fiscal year 2015.
Internal AuditingIn order to maintain its independence and objectivity, the Internal Audit area reports to the Audit Committee therefore:
We reviewed and approved the annual work program and budget, in order to comply with the requirements of Sarbanes-Oxley Act. For its preparation, the Internal Audit area participated in the risk assessment process and the validation of the internal control system.
We received periodic reports regarding the progress of the approved work program, any deviations and the causes thereof.
We followed up the implementation of the observations developed by Internal Audit.
We confirmed the existence and validated the implementation of an Annual Training program.
We reviewed and discuss with the responsible of the IA function the evaluations of the Internal Audit service performed by the responsible of each business unit and the Audit Committee.
Financial Information, Accounting Policies and Reports to the Third PartiesWe reviewed the quarterly and annual financial statements of the Company with the individuals responsible for its preparation and recommended to the Board of Directors, its approval and authorize its publication. As part of this process, we analyzed the comments of the external auditors and confirm that the criteria, accounting policies and information used by Management to prepare financial information were adequate, sufficient, and consistently applied with the prior year. As a consequence, the information submitted by Management reasonably reflects the financial position of the Company, its operating results and cash flows for the fiscal year ending on December 31, 2015.
Pursuant to Articles 42 and 43 of the Mexican Securities Law (Ley del Mercado de Valores) and the Charter of the Audit Committee, we submit to the Board of Directors our report on the activities performed during, 2015. We considered the recommendations established in the Code of Corporate Best Practices and, since the Company is a publicly-listed company in the New York Stock Exchange (¨NYSE¨), we also complied with the applicable provisions set forth in Sarbanes-Oxley Act. We met at least on a quarterly basis and, based on a work program, we carried out the activities described below:
Risk AssessmentWe periodically evaluated the effectiveness of the Enterprise Risk Management Process, which is established to identify, measure, record, assess, and manage the Company´s risks, as well as for the implementation of follow-up measures to ensure its effective operation.
We reviewed with Management and both External and Internal Auditors of the Company, the key risk factors that could adversely affect the Company´s operations and assets, and we determined that they have been appropriately identified, managed, and considered in both audit programs.
Internal ControlWe verified the compliance by Management of its responsibilities regarding internal control, and the establishment of general guidelines and the procedures necessary for their application and compliance. This process included presentations to the Audit Committee by the area responsible of the most important subsidiaries. Additionally, we followed the comments and remarks made in this regard by External Auditors as a result of their findings.
We verified the actions taken by the Company in order to comply with section 404 of Sarbanes-Oxley Act regarding the self-assessment of internal controls. During this process, we made sure that a follow up on main preventive and corrective actions implemented concerning internal control issues that required improvement, were taken, and the submission to the authorities of requested information.
External AuditWe recommended to the Board of Directors the appointment of the external auditors (who have been the same for the past seven years) for the Company and its subsidiaries for fiscal year 2015. For this purpose, we verified their independence and their compliance with the requirements established by applicable laws and regulations. We analyzed their approach, work program as well as their coordination with Internal Audit.
Annual Report of the Audit Committee
FOMENTO ECONÓMICO MEXICANO, S.A.B. DE C.V. AND SUBSIDIARIESMONTERREY, N.L., MEXICO

FEMSA Annual Report 2015 4544 creating stories
We also reviewed the quarterly reports prepared by Management and submitted to shareholders and the financial community, verifying that such information was prepared under International Financial Reporting Standards (IFRS) and the same accounting criteria for preparing the annual information. We also reviewed the existence of an integral process that provides a reasonable assurance of fairness in the information content. To conclude, we recommended to the Board of Directors to authorize the release of such information.
Our reviews also included reports and any other financial information required by Mexican and United States regulatory authorities.
We reviewed and approved the changes to the accounting standards used by the Company that became effective in 2015, recommending their approval to the Board of Directors.
Compliance with Applicable Laws and Regulations, Legal Issues and ContingenciesWe verified the existence and reliability of the Company-established controls to ensure compliance with the various legal provisions applicable to the Company. When required, we verified its appropriate disclosure in the financial reports.
We made periodic reviews of the various tax, legal and labor contingencies of the Company. We supervised the efficiency of the procedures established for their identification and follow-up, as well as their adequate disclosure and recording.
Code of ConductWe reviewed the new version of the Business Code of Ethics of the Company which incorporates among other changes an update of its values, validating that it includes a compliance provision with the Anti-Money Laundering laws in the countries where we operate, as well as compliance with anti-corruption laws (FCPA), and recommended its approval to the Board of Directors.
With the support of Internal Audit, we verified the compliance of the Business Code of Ethics, the existence of adequate processes to update it and its communication to employees, as well as the application of sanctions in those cases where violations were detected.
We reviewed the complaints received in the Company´s Whistle-Blowing System and followed up on their correct and timely handling.
Administrative ActivitiesWe held regular meetings with Management to be informed of any relevant or unusual activities and events. We also met individually with external and internal auditors to review their work, and observations.
In those cases where we deemed advisable, we requested the support and opinion from independent experts. We are not aware of any significant non-compliance with the operating policies, the internal control system or the accounting records of the Company.
We held executive meetings and when applicable reviewed with Management our resolutions.
We submitted quarterly reports to the Board of Directors, on the activities performed by the Committee.
We reviewed the Audit Committee Charter and made the amendments that we deemed appropriate, submitting such changes for its approval by the Board of Directors.
We verified that the financial expert of the Committee meets the technical background and experience requirements to be considered as such, and that each Committee Member meets the independence requirements set forth in by the applicable laws and regulations.
Our activities were duly documented in the minutes prepared for each meeting. Such minutes were properly reviewed and approved by Committee members.
We made our annual performance self-assessment, and submitted the results to the Chairman of the Board of Directors.
Sincerely
February 22, 2016José Manuel Canal Hernando

FEMSA Annual Report 2015 4746 creating stories
Independent Auditor’s Report
The Board of Directors and Shareholders ofFomento Económico Mexicano, S.A.B. de C.V.
Report on the Consolidated Financial StatementsWe have audited the accompanying consolidated financial statements of Fomento Económico Mexicano, S.A.B. de C.V. and its subsidiaries, which comprise the consolidated statements of financial position as at December 31, 2015 and 2014, and the consolidated income statements, consolidated statements of comprehensive income, consolidated statements of changes in equity and consolidated statements of cash flows for each of the three years in the period ended December 31, 2015, and a summary of significant accounting policies and other explanatory information.
Management’s Responsibility for the Consolidated Financial StatementsManagement is responsible for the preparation and fair presentation of these consolidated financial statements in accordance with International Financial Reporting Standards, and for such internal control as management determines is necessary to enable the preparation of consolidated financial statements that are free from material misstatement, whether due to fraud or error.
Auditor’s ResponsibilityOur responsibility is to express an opinion on these consolidated financial statements based on our audits. We conducted our audits in accordance with International Standards on Auditing. Those standards require that we comply with ethical requirements and plan and perform the audit to obtain reasonable assurance about whether the consolidated financial statements are free from material misstatement.
An audit involves performing procedures to obtain audit evidence about the amounts and disclosures in the consolidated financial statements. The procedures selected depend on the auditor’s judgment, including the assessment of the risks of material misstatement of the consolidated financial statements, whether due to fraud or error. In making those risk assessments, the auditor considers internal control relevant to the entity’s preparation and fair presentation of the consolidated financial statements in order to design audit procedures that are appropriate in the circumstances, but not for the purpose of expressing an opinion on the effectiveness of the entity’s internal control. An audit also includes evaluating the appropriateness of accounting policies used and the reasonableness of accounting estimates made by management, as well as evaluating the overall presentation of the consolidated financial statements.
We believe that the audit evidence we have obtained is sufficient and appropriate to provide a basis for our audit opinion.
OpinionIn our opinion, the consolidated financial statements present fairly, in all material respects, the financial position of Fomento Económico Mexicano, S.A.B. de C.V. and its subsidiaries as at December 31, 2015 and 2014, and their financial performance and cash flows for each of the three years in the period ended December 31, 2015, in accordance with International Financial Reporting Standards, as issued by the International Accounting Standards Board.
Mancera, S.C. A member practice of Ernst & Young Global Limited
Agustín Aguilar LaurentsFebruary 29, 2016 Monterrey, N.L. MEXICO

FEMSA Annual Report 2015 4746 creating stories
December December December Note 2015 (*) 2015 2014
ASSETSCurrent Assets: Cash and cash equivalents 5 $ 1,710 Ps. 29,396 Ps. 35,497 Investments 6 1 19 144 Accounts receivable, net 7 1,047 18,012 13,842 Inventories 8 1,435 24,680 17,214 Recoverable taxes 497 8,544 8,030 Other current financial assets 9 141 2,418 2,597 Other current assets 9 213 3,654 1,788 Total current assets 5,044 86,723 79,112 Investments in associates and joint ventures 10 6,498 111,731 102,159 Property, plant and equipment, net 11 4,670 80,296 75,629 Intangible assets, net 12 6,301 108,341 101,527 Deferred tax assets 24 482 8,293 6,278 Other financial assets 13 521 8,955 6,551 Other assets, net 13 289 4,993 4,917TOTAL ASSETS $ 23,805 Ps. 409,332 Ps. 376,173LIABILITIES AND EQUITYCurrent Liabilities: Bank loans and notes payable 18 $ 130 Ps. 2,239 Ps. 449 Current portion of long-term debt 18 213 3,656 1,104 Interest payable 35 597 482 Suppliers 2,080 35,773 26,467 Accounts payable 537 9,236 7,778 Taxes payable 531 9,136 8,177 Other current financial liabilities 25 274 4,709 4,862Total current liabilities 3,800 65,346 49,319Long-Term Liabilities: Bank loans and notes payable 18 5,000 85,969 82,935 Post-employment and other long-term employee benefits 16 246 4,229 4,207 Deferred tax liabilities 24 362 6,230 3,643 Other financial liabilities 25 29 495 328 Provisions and other long-term liabilities 25 303 5,207 5,619Total long-term liabilities 5,940 102,130 96,732Total liabilities 9,740 167,476 146,051Equity: Controlling interest: Capital stock 195 3,348 3,347 Additional paid-in capital 1,501 25,807 25,649 Retained earnings 9,103 156,532 147,122 Cumulative other comprehensive (loss) (243) (4,163) (5,645)Total controlling interest 10,556 181,524 170,473Non-controlling interest in consolidated subsidiaries 21 3,509 60,332 59,649Total equity 14,065 241,856 230,122TOTAL LIABILITIES AND EQUITY $ 23,805 Ps. 409,332 Ps. 376,173
(*) Convenience translation to U.S. dollars ($) – See Note 2.2.3The accompanying notes are an integral part of these consolidated statements of financial position.
Consolidated Statements of Financial Position
FOMENTO ECONÓMICO MEXICANO, S.A.B. DE C.V. AND SUBSIDIARIESMONTERREY, N.L., MEXICO
As of December 31, 2015 and 2014.Amounts expressed in millions of U.S. dollars ($) and in millions of Mexican pesos (Ps.)
FEMSA Annual Report 2015 4948 creating stories
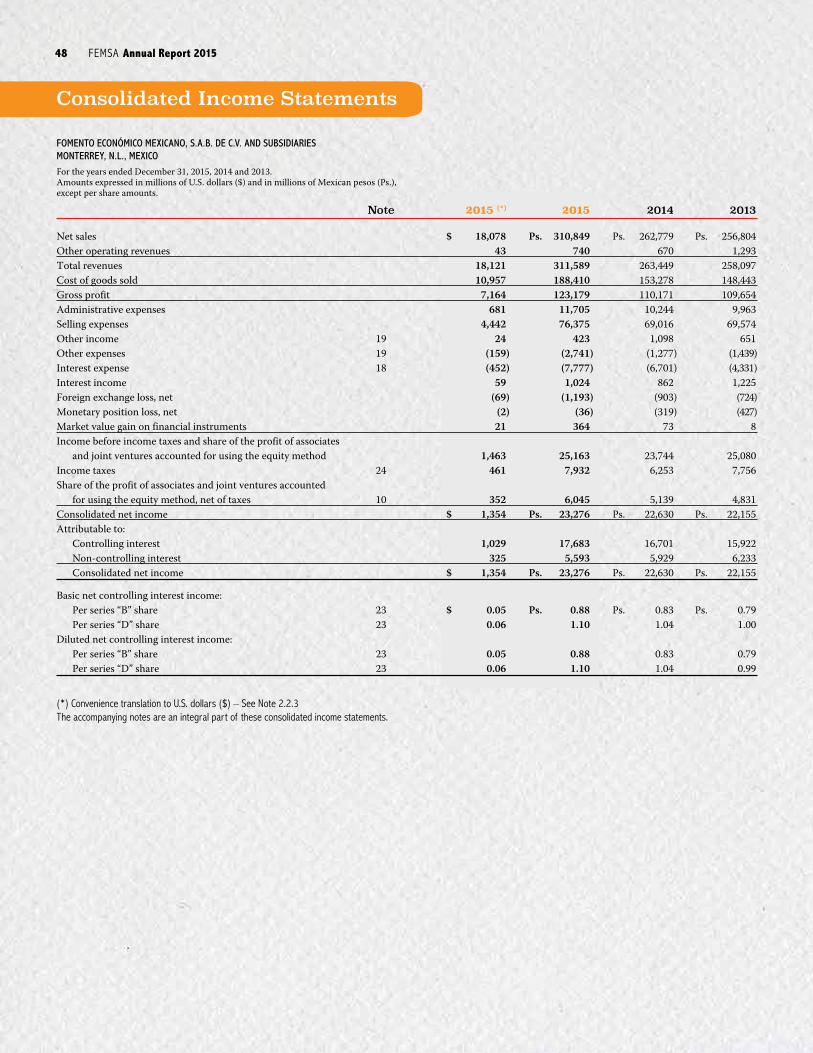
FOMENTO ECONÓMICO MEXICANO, S.A.B. DE C.V. AND SUBSIDIARIESMONTERREY, N.L., MEXICOFor the years ended December 31, 2015, 2014 and 2013.Amounts expressed in millions of U.S. dollars ($) and in millions of Mexican pesos (Ps.), except per share amounts.
Note 2015 (*) 2015 2014 2013
Net sales $ 18,078 Ps. 310,849 Ps. 262,779 Ps. 256,804Other operating revenues 43 740 670 1,293Total revenues 18,121 311,589 263,449 258,097Cost of goods sold 10,957 188,410 153,278 148,443Gross profit 7,164 123,179 110,171 109,654Administrative expenses 681 11,705 10,244 9,963Selling expenses 4,442 76,375 69,016 69,574Other income 19 24 423 1,098 651Other expenses 19 (159) (2,741) (1,277) (1,439)Interest expense 18 (452) (7,777) (6,701) (4,331)Interest income 59 1,024 862 1,225Foreign exchange loss, net (69) (1,193) (903) (724)Monetary position loss, net (2) (36) (319) (427)Market value gain on financial instruments 21 364 73 8Income before income taxes and share of the profit of associates and joint ventures accounted for using the equity method 1,463 25,163 23,744 25,080Income taxes 24 461 7,932 6,253 7,756Share of the profit of associates and joint ventures accounted for using the equity method, net of taxes 10 352 6,045 5,139 4,831Consolidated net income $ 1,354 Ps. 23,276 Ps. 22,630 Ps. 22,155Attributable to: Controlling interest 1,029 17,683 16,701 15,922 Non-controlling interest 325 5,593 5,929 6,233 Consolidated net income $ 1,354 Ps. 23,276 Ps. 22,630 Ps. 22,155
Basic net controlling interest income: Per series “B” share 23 $ 0.05 Ps. 0.88 Ps. 0.83 Ps. 0.79 Per series “D” share 23 0.06 1.10 1.04 1.00Diluted net controlling interest income: Per series “B” share 23 0.05 0.88 0.83 0.79 Per series “D” share 23 0.06 1.10 1.04 0.99
(*) Convenience translation to U.S. dollars ($) – See Note 2.2.3The accompanying notes are an integral part of these consolidated income statements.
Consolidated Income Statements

FEMSA Annual Report 2015 4948 creating stories
Note 2015 (*) 2015 2014 2013
Consolidated net income $ 1,354 Ps. 23,276 Ps. 22,630 Ps. 22,155Other comprehensive income:Items that may be reclassified to consolidated net income, net of tax: Unrealized loss on available for sale securities - - - (2) Valuation of the effective portion of derivative financial instruments 7 122 493 (246) Exchange differences on the translation of foreign operations and associates (129) (2,234) (12,256) 1,151 Share of other comprehensive income (loss) of associates and joint ventures 10 16 282 1,322 (3,120)Total items that may be reclassified (106) (1,830) (10,441) (2,217)Items that will not to be reclassified to consolidated net income in subsequent periods, net of tax: Remeasurements of the net defined benefit share of other comprehensive income (loss) of associates and joint ventures 10 169 (881) 491Remeasurements of the net defined benefit liability 8 144 (361) (112)Total items that will not be reclassified 18 313 (1,242) 379Total other comprehensive loss, net of tax (88) (1,517) (11,683) (1,838)Consolidated comprehensive income, net of tax $ 1,266 Ps. 21,759 Ps. 10,947 Ps. 20,317 Controlling interest comprehensive income 1,115 19,165 11,283 15,030 Reattribution to non-controlling interest of other comprehensive income by acquisition of Grupo YOLI - - - (36) Controlling interest, net of reattribution $ 1,115 Ps. 19,165 Ps. 11,283 Ps. 14,994 Non-controlling interest comprehensive income 151 2,594 (336) 5,287 Reattribution from controlling interest of other comprehensive income by acquisition of Grupo YOLI - - - 36 Non-controlling interest, net of reatribution $ 151 Ps. 2,594 Ps. (336) Ps. 5,323Consolidated comprehensive income, net of tax $ 1,266 Ps. 21,759 Ps. 10,947 Ps. 20,317
(*) Convenience translation to U.S. dollars ($) – See Note 2.2.3The accompanying notes are an integral part of these consolidated statements of comprehensive income.
Consolidated Statements of Comprehensive Income
FOMENTO ECONÓMICO MEXICANO, S.A.B. DE C.V. AND SUBSIDIARIESMONTERREY, N.L., MEXICO
For the years ended December 31, 2015, 2014 and 2013.Amounts expressed in millions of U.S. dollars ($) and in millions of Mexican pesos (Ps.)
FEMSA Annual Report 2015 5150 creating stories
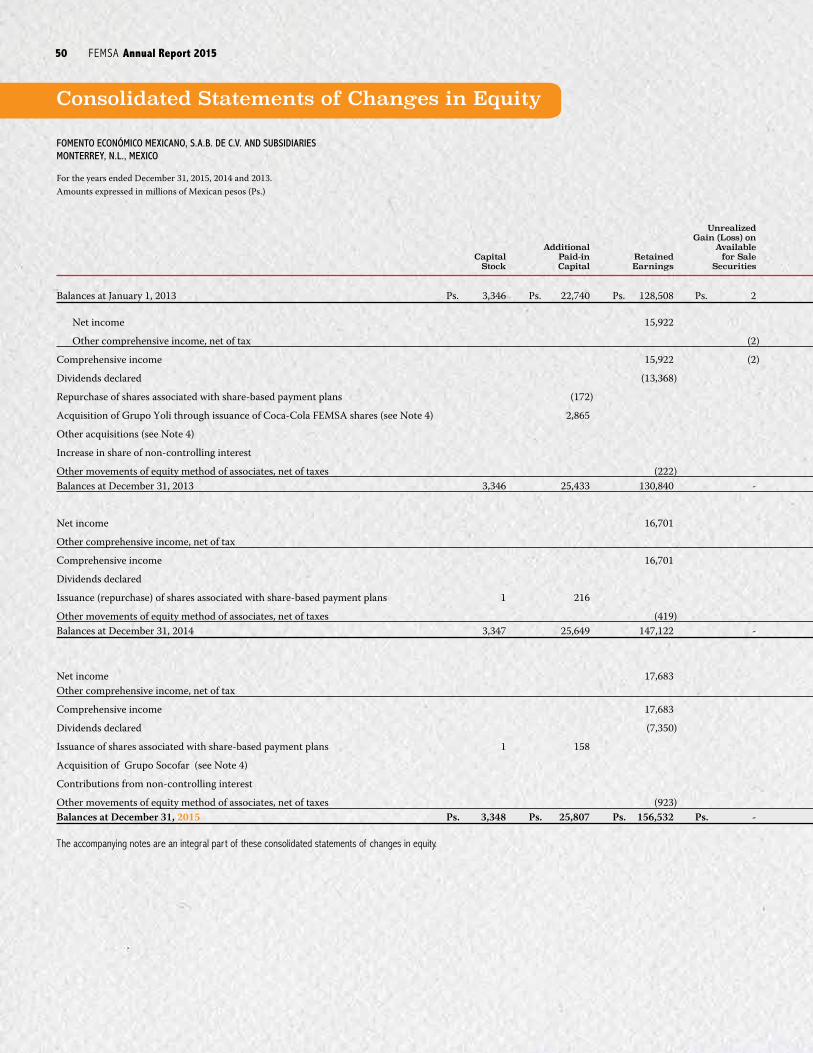
FOMENTO ECONÓMICO MEXICANO, S.A.B. DE C.V. AND SUBSIDIARIESMONTERREY, N.L., MEXICO
For the years ended December 31, 2015, 2014 and 2013.Amounts expressed in millions of Mexican pesos (Ps.)
Exchange Valuation of Differences Unrealized the Effective on the Remeasurements Gain (Loss) on Portion of Translation of the Net Additional Available Derivative of Foreign Defined Total Non- Capital Paid-in Retained for Sale Financial Operations Benefit Controlling Controlling Total Stock Capital Earnings Securities Instrument and Associates Liability Interest Interest Equity
Balances at January 1, 2013 Ps. 3,346 Ps. 22,740 Ps. 128,508 Ps. 2 Ps. 349 Ps. 1,961 Ps. (1,647) Ps. 155,259 Ps. 54,902 Ps. 210,161
Net income 15,922 15,922 6,233 22,155
Other comprehensive income, net of tax (2) (170) (1,214) 458 (928) (910) (1,838)
Comprehensive income 15,922 (2) (170) (1,214) 458 14,994 5,323 20,317
Dividends declared (13,368) (13,368) (3,125) (16,493)
Repurchase of shares associated with share-based payment plans (172) (172) (7) (179)
Acquisition of Grupo Yoli through issuance of Coca-Cola FEMSA shares (see Note 4) 2,865 2 32 2 2,901 5,120 8,021
Other acquisitions (see Note 4) - 430 430
Increase in share of non-controlling interest - 515 515
Other movements of equity method of associates, net of taxes (222) (222) - (222)Balances at December 31, 2013 3,346 25,433 130,840 - 181 779 (1,187) 159,392 63,158 222,550
Net income 16,701 16,701 5,929 22,630
Other comprehensive income, net of tax 126 (4,412) (1,132) (5,418) (6,265) (11,683)
Comprehensive income 16,701 126 (4,412) (1,132) 11,283 (336) 10,947
Dividends declared - (3,152) (3,152)
Issuance (repurchase) of shares associated with share-based payment plans 1 216 217 (21) 196
Other movements of equity method of associates, net of taxes (419) (419) - (419)Balances at December 31, 2014 3,347 25,649 147,122 - 307 (3,633) (2,319 ) 170,473 59,649 230,122
Net income 17,683 17,683 5,593 23,276Other comprehensive income, net of tax 299 945 238 1,482 (2,999) (1,517)
Comprehensive income 17,683 299 945 238 19,165 2,594 21,759
Dividends declared (7,350) (7,350) (3,351) (10,701)
Issuance of shares associated with share-based payment plans 1 158 159 57 216
Acquisition of Grupo Socofar (see Note 4) - 1,133 1,133
Contributions from non-controlling interest - - - - 250 250
Other movements of equity method of associates, net of taxes (923) (923) - (923)Balances at December 31, 2015 Ps. 3,348 Ps. 25,807 Ps. 156,532 Ps. - Ps. 606 Ps. (2,688) Ps. (2,081) Ps. 181,524 Ps. 60,332 Ps. 241,856
The accompanying notes are an integral part of these consolidated statements of changes in equity.
Consolidated Statements of Changes in Equity

FEMSA Annual Report 2015 5150 creating stories
Exchange Valuation of Differences Unrealized the Effective on the Remeasurements Gain (Loss) on Portion of Translation of the Net Additional Available Derivative of Foreign Defined Total Non- Capital Paid-in Retained for Sale Financial Operations Benefit Controlling Controlling Total Stock Capital Earnings Securities Instrument and Associates Liability Interest Interest Equity
Balances at January 1, 2013 Ps. 3,346 Ps. 22,740 Ps. 128,508 Ps. 2 Ps. 349 Ps. 1,961 Ps. (1,647) Ps. 155,259 Ps. 54,902 Ps. 210,161
Net income 15,922 15,922 6,233 22,155
Other comprehensive income, net of tax (2) (170) (1,214) 458 (928) (910) (1,838)
Comprehensive income 15,922 (2) (170) (1,214) 458 14,994 5,323 20,317
Dividends declared (13,368) (13,368) (3,125) (16,493)
Repurchase of shares associated with share-based payment plans (172) (172) (7) (179)
Acquisition of Grupo Yoli through issuance of Coca-Cola FEMSA shares (see Note 4) 2,865 2 32 2 2,901 5,120 8,021
Other acquisitions (see Note 4) - 430 430
Increase in share of non-controlling interest - 515 515
Other movements of equity method of associates, net of taxes (222) (222) - (222)Balances at December 31, 2013 3,346 25,433 130,840 - 181 779 (1,187) 159,392 63,158 222,550
Net income 16,701 16,701 5,929 22,630
Other comprehensive income, net of tax 126 (4,412) (1,132) (5,418) (6,265) (11,683)
Comprehensive income 16,701 126 (4,412) (1,132) 11,283 (336) 10,947
Dividends declared - (3,152) (3,152)
Issuance (repurchase) of shares associated with share-based payment plans 1 216 217 (21) 196
Other movements of equity method of associates, net of taxes (419) (419) - (419)Balances at December 31, 2014 3,347 25,649 147,122 - 307 (3,633) (2,319 ) 170,473 59,649 230,122
Net income 17,683 17,683 5,593 23,276Other comprehensive income, net of tax 299 945 238 1,482 (2,999) (1,517)
Comprehensive income 17,683 299 945 238 19,165 2,594 21,759
Dividends declared (7,350) (7,350) (3,351) (10,701)
Issuance of shares associated with share-based payment plans 1 158 159 57 216
Acquisition of Grupo Socofar (see Note 4) - 1,133 1,133
Contributions from non-controlling interest - - - - 250 250
Other movements of equity method of associates, net of taxes (923) (923) - (923)Balances at December 31, 2015 Ps. 3,348 Ps. 25,807 Ps. 156,532 Ps. - Ps. 606 Ps. (2,688) Ps. (2,081) Ps. 181,524 Ps. 60,332 Ps. 241,856
The accompanying notes are an integral part of these consolidated statements of changes in equity.

FEMSA Annual Report 2015 5352 creating stories
FOMENTO ECONÓMICO MEXICANO, S.A.B. DE C.V. AND SUBSIDIARIESMONTERREY, N.L., MEXICO
For the years ended December 31, 2015, 2014 and 2013.Amounts expressed in millions of U.S. dollars ($) and in millions of Mexican pesos (Ps.)
2015 (*) 2015 2014 2013
Cash flows from operating activities:Income before income taxes $ 1,815 Ps. 31,208 Ps. 28,883 Ps. 29,911Adjustments for: Non-cash operating expenses 167 2,873 209 752 Employee profit sharing 72 1,243 1,138 1,936 Depreciation 568 9,761 9,029 8,805 Amortization 62 1,064 985 891 (Gain) loss on sale of long-lived assets (14) (249) 7 (41) (Gain) on sale of shares (1) (14) - - Disposal of long-lived assets 24 416 153 122 Impairment of long-lived assets 8 134 145 - Share of the profit of associates and joint ventures accounted for using the equity method, net of taxes (352) (6,045) (5,139) (4,831) Interest income (59) (1,024) (862) (1,225) Interest expense 452 7,777 6,701 4,331 Foreign exchange loss, net 69 1,193 903 724 Monetary position loss, net 2 36 319 427 Market value (gain) on financial instruments (21) (364) (73) (8)Cash flow from operating activities before changes in operating accounts and employee profit sharing 2,792 48,009 42,398 41,794Accounts receivable and other current assets (255) (4,379) (4,962) (1,948)Other current financial assets 18 318 1,736 (1,508)Inventories (252) (4,330) (1,122) (1,541)Derivative financial instruments 26 441 245 402 Suppliers and other accounts payable 323 5,556 6,910 517Other long-term liabilities 48 822 (2,308) (109)Other current financial liabilities (33) (570) 793 417Post-employment and other long-term employee benefits (22) (382) (416) (317)Cash generated from operations 2,645 45,485 43,274 37,707Income taxes paid (508) (8,743) (5,910) (8,949)Net cash generated by operating activities 2,137 36,742 37,364 28,758Cash flows from investing activities: Acquisition of Grupo Socofar, net of cash acquired (see Note 4) (401) (6,890) - - Acquisition of Grupo Yoli, net of cash acquired (see Note 4) - - - (1,046) Acquisition of Companhia Fluminense de Refrigerantes, net of cash acquired (see Note 4) - - - (4,648) Acquisition of Spaipa S.A. Industria Brasileira de Bebidas, net of cash acquired (see Note 4) - - - (23,056) Other acquisitions, net of cash acquired (see Note 4) (339) (5,821) - (3,021) Investment in shares of Coca-Cola FEMSA Philippines, Inc. CCFPI (see Note 10) - - - (8,904) Other investments in associates and joint ventures (17) (291) 90 (335) Purchase of investments - - (607) (118) Proceeds from investments 7 126 589 1,488 Interest received 60 1,024 863 1,224 Derivative financial instruments 13 232 (25) 119 Dividends received from associates and joint ventures 139 2,394 1,801 1,759 Property, plant and equipment acquisitions (1,017) (17,485) (16,985) (16,380) Proceeds from the sale of property, plant and equipment 37 630 209 252 Acquisition of intangible assets (56) (971) (706) (1,077) Investment in other assets (87) (1,502) (796) (1,436) Collections of other assets 13 223 - - Investment in other financial assets (2) (28) (41) (52)Net cash used in investing activities (1,650) (28,359) (15,608) (55,231)Cash flows from financing activities: Proceeds from borrowings 490 8,422 5,354 78,907 Payments of bank loans (903) (15,520) (5,721) (39,962) Interest paid (265) (4,563) (3,984) (3,064) Derivative financial instruments 485 8,345 (2,267) 697 Dividends paid (622) (10,701) (3,152) (16,493) Contributions from non-controlling interest 15 250 - - Increase in shares of non-controlling interest - - - 515 Other financing activities 2 26 482 (16) Net cash (used in) generated by financing activities (798) (13,741) (9,288) 20,584 (Decrease) increase in cash and cash equivalents (311) (5,358) 12,468 (5,889) Initial balance of cash and cash equivalents 2,064 35,497 27,259 36,521 Effects of exchange rate changes and inflation effects on cash and cash equivalents held in foreign currencies (43) (743) (4,230) (3,373) Ending balance of cash and cash equivalents $ 1,710 Ps. 29,396 Ps. 35,497 Ps. 27,259
(*) Convenience translation to U.S. dollars ($) – see Note 2.2.3The accompanying notes are an integral part of these consolidated statements of cash flow.
Consolidated Statements of Cash Flows
FEMSA Annual Report 2015 5352 creating stories
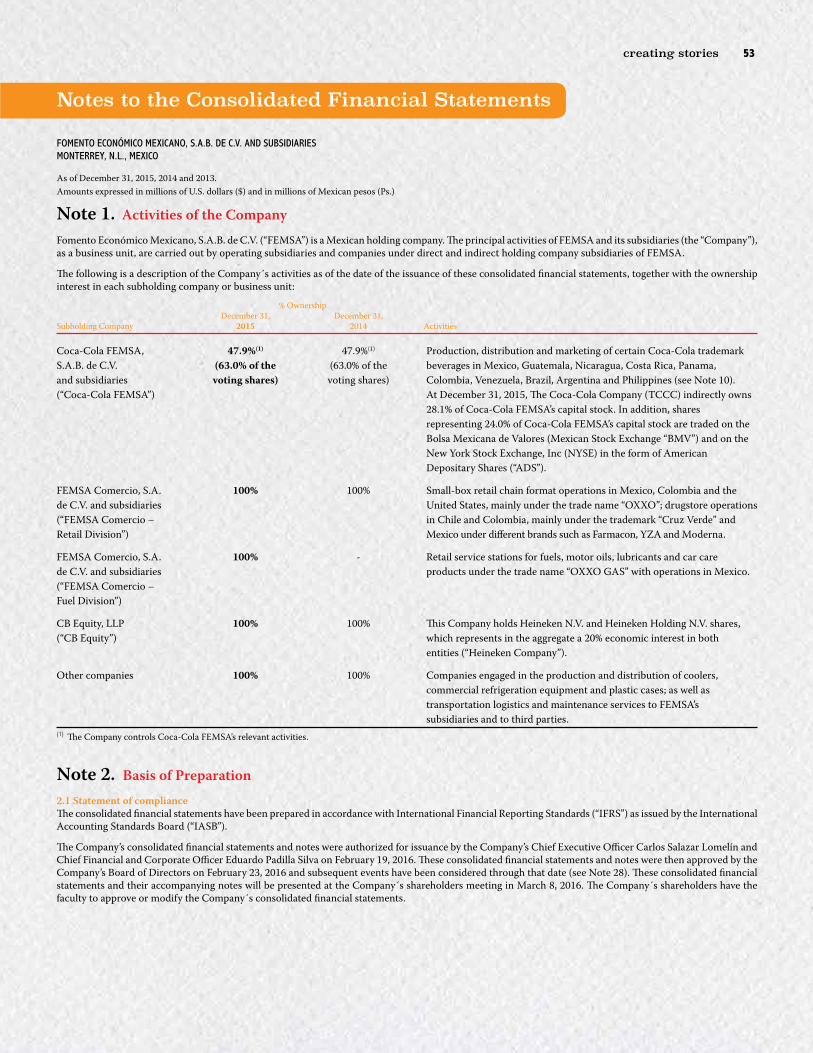
Note 1. Activities of the CompanyFomento Económico Mexicano, S.A.B. de C.V. (“FEMSA”) is a Mexican holding company. The principal activities of FEMSA and its subsidiaries (the “Company”), as a business unit, are carried out by operating subsidiaries and companies under direct and indirect holding company subsidiaries of FEMSA.
The following is a description of the Company´s activities as of the date of the issuance of these consolidated financial statements, together with the ownership interest in each subholding company or business unit:
% Ownership December 31, December 31, Subholding Company 2015 2014 Activities
Coca-Cola FEMSA, 47.9%(1) 47.9%(1) Production, distribution and marketing of certain Coca-Cola trademark S.A.B. de C.V. (63.0% of the (63.0% of the beverages in Mexico, Guatemala, Nicaragua, Costa Rica, Panama, and subsidiaries voting shares) voting shares) Colombia, Venezuela, Brazil, Argentina and Philippines (see Note 10). (“Coca-Cola FEMSA”) At December 31, 2015, The Coca-Cola Company (TCCC) indirectly owns 28.1% of Coca-Cola FEMSA’s capital stock. In addition, shares representing 24.0% of Coca-Cola FEMSA’s capital stock are traded on the Bolsa Mexicana de Valores (Mexican Stock Exchange “BMV”) and on the New York Stock Exchange, Inc (NYSE) in the form of American Depositary Shares (“ADS”).
FEMSA Comercio, S.A. 100% 100% Small-box retail chain format operations in Mexico, Colombia and the de C.V. and subsidiaries United States, mainly under the trade name “OXXO”; drugstore operations (“FEMSA Comercio – in Chile and Colombia, mainly under the trademark “Cruz Verde” and Retail Division”) Mexico under different brands such as Farmacon, YZA and Moderna.
FEMSA Comercio, S.A. 100% - Retail service stations for fuels, motor oils, lubricants and car care de C.V. and subsidiaries products under the trade name “OXXO GAS” with operations in Mexico. (“FEMSA Comercio – Fuel Division”)
CB Equity, LLP 100% 100% This Company holds Heineken N.V. and Heineken Holding N.V. shares, (“CB Equity”) which represents in the aggregate a 20% economic interest in both entities (“Heineken Company”).
Other companies 100% 100% Companies engaged in the production and distribution of coolers, commercial refrigeration equipment and plastic cases; as well as transportation logistics and maintenance services to FEMSA’s subsidiaries and to third parties.(1) The Company controls Coca-Cola FEMSA’s relevant activities.
Note 2. Basis of Preparation2.1 Statement of complianceThe consolidated financial statements have been prepared in accordance with International Financial Reporting Standards (“IFRS”) as issued by the International Accounting Standards Board (“IASB”).
The Company’s consolidated financial statements and notes were authorized for issuance by the Company’s Chief Executive Officer Carlos Salazar Lomelín and Chief Financial and Corporate Officer Eduardo Padilla Silva on February 19, 2016. These consolidated financial statements and notes were then approved by the Company’s Board of Directors on February 23, 2016 and subsequent events have been considered through that date (see Note 28). These consolidated financial statements and their accompanying notes will be presented at the Company´s shareholders meeting in March 8, 2016. The Company´s shareholders have the faculty to approve or modify the Company´s consolidated financial statements.
Notes to the Consolidated Financial Statements
FOMENTO ECONÓMICO MEXICANO, S.A.B. DE C.V. AND SUBSIDIARIESMONTERREY, N.L., MEXICO
As of December 31, 2015, 2014 and 2013.Amounts expressed in millions of U.S. dollars ($) and in millions of Mexican pesos (Ps.)

FEMSA Annual Report 2015 5554 creating stories
2.2 Basis of measurement and presentationThe consolidated financial statements have been prepared on the historical cost basis, except for the following:
• Available-for-sale investments.
• Derivative financial instruments.
• Long-term notes payable on which fair value hedge accounting is applied.
• Trust assets of post-employment and other long-term employee benefit plans.
The financial statements of subsidiaries whose functional currency is the currency of a hyperinflationary economy are stated in terms of the measuring unit current at the end of the reporting period.
2.2.1 Presentation of consolidated income statementThe Company classifies its costs and expenses by function in the consolidated income statement, in order to conform to the industry practices where the Company operates.
2.2.2 Presentation of consolidated statements of cash flowsThe Company’s consolidated statement of cash flows is presented using the indirect method.
2.2.3 Convenience translation to U.S. dollars ($)The consolidated financial statements are stated in millions of Mexican pesos (“Ps.”) and rounded to the nearest million unless stated otherwise. However, solely for the convenience of the readers, the consolidated statement of financial position as of December 31, 2015, the consolidated income statement, the consolidated statement of comprehensive income and consolidated statement of cash flows for the year ended December 31, 2015 were converted into U.S. dollars at the exchange rate of 17.1950 Mexican pesos per U.S. dollar as published by the U.S. Federal Reserve Board in its H.10 Weekly Release of Foreign Exchange Rates as of that date. This arithmetic conversion should not be construed as representation that the amounts expressed in Mexican pesos may be converted into U.S. dollars at that or any other exchange rate. As explained in Note 2.1 above, as of February 23, 2016 (the issuance date of these financial statements) such exchange rate was Ps. 18.2762 per U.S. dollar, a devaluation of 6.2% since December 31, 2015.
2.3 Critical accounting judgments and estimatesIn the application of the Company’s accounting policies, which are described in Note 3, management is required to make judgments, estimates and assumptions about the carrying amounts of assets and liabilities that are not readily apparent from other sources. The estimates and associated assumptions are based on historical experience and other factors that are considered to be relevant. Actual results may differ from these estimates.
The estimates and underlying assumptions are reviewed on an ongoing basis. Revisions to accounting estimates are recognized in the period in which the estimate is revised if the revision affects only that period or in the period of the revision and future periods if the revision affects both current and future periods.
2.3.1 Key sources of estimation uncertaintyThe following are the key assumptions concerning the future and other key sources of estimation uncertainty at the end of the reporting period that have a significant risk of causing a material adjustment to the carrying amounts of assets and liabilities within the next financial year. Existing circumstances and assumptions about future developments, however, may change due to market changes or circumstances arising beyond the control of the Company. Such changes are reflected in the assumptions when they occur.
2.3.1.1 Impairment of indefinite lived intangible assets, goodwill and depreciable long-lived assetsIntangible assets with indefinite lives including goodwill are subject to annual impairment tests. An impairment exists when the carrying value of an asset or cash generating unit (CGU) exceeds its recoverable amount, which is the higher of its fair value less costs to sell and its value in use. The fair value less costs to sell calculation is based on available data from binding sales transactions in arm’s length transactions of similar assets or observable market prices less incremental costs for disposing of the asset. In order to determine whether such assets are impaired, the Company initially calculates an estimation of the value in use of the cash-generating units to which such assets have been allocated. The value in use calculation requires management to estimate the future cash flows expected to arise from the cash-generating unit and a suitable discount rate in order to calculate present value. The Company reviews annually the carrying value of its intangible assets with indefinite lives and goodwill for impairment based on recognized valuation techniques. While the Company believes that its estimates are reasonable, different assumptions regarding such estimates could materially affect its evaluations. Impairment losses are recognized in current earnings in the period the related impairment is determined. The key assumptions used to determine the recoverable amount for the Company’s CGUs, including a sensitivity analysis, are further explained in Notes 3.16 and 12.
The Company assesses at each reporting date whether there is an indication that an asset may be impaired. If any indication exists, or when annual impairment testing for an asset is required, the Company estimates the asset’s recoverable amount. When the carrying amount of an asset or CGU exceeds its recoverable amount, the asset is considered impaired and is written down to its recoverable amount. In assessing value in use, the estimated future cash flows are discounted to their present value using a pre-tax discount rate that reflects current market assessments of the time value of money and the risks specific to the asset. In determining fair value less costs to sell, recent market transactions are taken into account, if available. If no such transactions can be identified, an appropriate valuation model is used. These calculations are corroborated by valuation multiples, quoted share prices for publicly traded subsidiaries or other available fair value indicators.
2.3.1.2 Useful lives of property, plant and equipment and intangible assets with defined useful livesProperty, plant and equipment, including returnable bottles as they are expected to provide benefits over a period of more than one year, as well as intangible assets with defined useful lives are depreciated/amortized over their estimated useful lives. The Company bases its estimates on the experience of its technical personnel as well as based on its experience in the industry for similar assets, see Notes 3.12, 3.14, 11 and 12.
2.3.1.3 Post-employment and other long-term employee benefitsThe Company regularly evaluates the reasonableness of the assumptions used in its post-employment and other long-term employee benefit computations. Information about such assumptions is described in Note 16.

FEMSA Annual Report 2015 5554 creating stories
2.3.1.4 Income taxesDeferred income tax assets and liabilities are determined based on the differences between the financial statement carrying amounts and the tax basis of assets and liabilities. The Company regularly reviews its deferred tax assets for recoverability, and records a deferred tax asset based on its judgment regarding the probability of historical taxable income continuing in the future, projected future taxable income and the expected timing of the reversals of existing temporary differences, see Note 24.
2.3.1.5 Tax, labor and legal contingencies and provisionsThe Company is subject to various claims and contingencies related to tax, labor and legal proceedings as described in Note 25. Due to their nature, such legal proceedings involve inherent uncertainties including, but not limited to, court rulings, negotiations between affected parties and governmental actions. Management periodically assesses the probability of loss for such contingencies and accrues a provision and/or discloses the relevant circumstances, as appropriate. If the potential loss of any claim or legal proceeding is considered probable and the amount can be reasonably estimated, the Company accrues a provision for the estimated loss. Management’s judgment must be exercised to determine the likelihood of such a loss and an estimate of the amount, due to the subjective nature of the loss.
2.3.1.6 Valuation of financial instrumentsThe Company is required to measure all derivative financial instruments at fair value.
The fair values of derivative financial instruments are determined considering quoted prices in recognized markets. If such instruments are not traded, fair value is determined by applying techniques based upon technical models supported by sufficient reliable and verifiable data, recognized in the financial sector. The Company bases its forward price curves upon market price quotations. Management believes that the chosen valuation techniques and assumptions used are appropriate in determining the fair value of financial instruments, see Note 20.
2.3.1.7 Business combinationsAcquisitions of businesses are accounted for using the acquisition method. The consideration transferred in a business combination is measured at fair value, which is calculated as the sum of the acquisition-date fair values of the assets transferred by the Company, liabilities assumed by the Company to the former owners of the acquiree and the equity interests issued by the Company in exchange for control of the acquiree.
At the acquisition date, the identifiable assets acquired and the liabilities assumed are recognized at their fair value, except that:
• Deferred tax assets or liabilities, and assets or liabilities related to employee benefit arrangements are recognized and measured in accordance with IAS 12, Income Taxes and IAS 19, Employee Benefits, respectively;
• Liabilities or equity instruments related to share-based payment arrangements of the acquiree or share-based payment arrangements of the Company entered into to replace share-based payment arrangements of the acquiree are measured in accordance with IFRS 2, Share-based Payment at the acquisition date, see Note 3.24; and
• Assets (or disposal groups) that are classified as held for sale in accordance with IFRS 5, Non-current Assets Held for Sale and Discontinued Operations are measured in accordance with that Standard.
Management’s judgment must be exercised to determine the fair value of assets acquired and liabilities assumed.
Goodwill is measured as the excess of the sum of the consideration transferred, the amount of any non-controlling interests in the acquiree, and the fair value of the Company previously held equity interest in the acquiree (if any) over the net of the acquisition-date amounts of the identifiable assets acquired and the liabilities assumed. If, after reassessment, the net of the acquisition-date amounts of the identifiable assets acquired and liabilities assumed exceeds the sum of the consideration transferred, the amount of any non-controlling interests in the acquiree and the fair value of the Company previously held interest in the acquiree (if any), the excess is recognized immediately in profit or loss as a bargain purchase gain.
For each business combination, with respect to the non-controlling present ownership interests in the acquiree that entitle their holders to a proportionate share of net assets in liquidation, the Company elects whether to measure such interests at fair value or at the proportionate share of the acquiree’s identifiable net assets.
2.3.1.8 Investments in associatesIf the Company holds, directly or indirectly, 20 per cent or more of the voting power of the investee, it is presumed that it has significant influence, unless it can be clearly demonstrated that this is not the case. If the Company holds, directly or indirectly, less than 20 per cent of the voting power of the investee, it is presumed that the Company does not have significant influence, unless such influence can be clearly demonstrated. Decisions regarding the propriety of utilizing the equity method of accounting for a less than 20 per cent-owned corporate investee requires a careful evaluation of voting rights and their impact on the Company’s ability to exercise significant influence. Management considers the existence of the following circumstances which may indicate that the Company is in a position to exercise significant influence over a less than 20 per cent-owned corporate investee:
• Representation on the board of directors or equivalent governing body of the investee;
• Participation in policy-making processes, including participation in decisions about dividends or other distributions;
• Material transactions between the Company and the investee;
• Interchange of managerial personnel; or
• Provision of essential technical information.
Management also considers the existence and effect of potential voting rights that are currently exercisable or currently convertible when assessing whether the Company has significant influence.
In addition, the Company evaluates certain indicators that provide evidence of significant influence, such as:
• Whether the extent of the Company’s ownership is significant relative to other shareholders (i.e., a lack of concentration of other shareholders);
• Whether the Company’s significant shareholders, fellow subsidiaries, or officers hold additional investment in the investee; and
• Whether the Company is a part of significant investee committees, such as the executive committee or the finance committee.
FEMSA Annual Report 2015 5756 creating stories
2.3.1.9 Joint arrangementsAn arrangement can be a joint arrangement even though not all of its parties have joint control of the arrangement. When the Company is a party to an arrangement it shall assess whether the contractual arrangement gives all the parties, or a group of the parties, control of the arrangement collectively; joint control exists only when decisions about the relevant activities require the unanimous consent of the parties that control the arrangement collectively. Management needs to apply judgment when assessing whether all the parties, or a group of the parties, have joint control of an arrangement. When assessing joint control, management considers the following facts and circumstances:
a) Whether all the parties or a group of the parties, control the arrangement, considering definition of joint control, as described in Note 3.11.2; and
b) Whether decisions about the relevant activities require the unanimous consent of all the parties, or of a group of the parties.
As mentioned in Note 10, Coca-Cola FEMSA accounts for its 51% investment at Coca-Cola FEMSA Philippines, Inc. (CCFPI) as a joint venture. This is based on the facts that Coca-Cola FEMSA and TCCC: (i) during the initial four-year period all decisions are taken jointly by Coca-Cola FEMSA and TCCC; and (ii) potential voting rights to acquire the remaining 49% of CCFPI are not probable to be executed in the foreseeable future due to the fact the call option was “out of the money” as of December 31, 2015 and 2014.
2.3.1.10 Venezuela exchange rates and consolidationAs is further explained in Note 3.3 below, the exchange rate used to account for foreign currency denominated monetary items arising in Venezuela, and also the exchange rate used to translate the financial statements of the Company’s Venezuelan subsidiary for group reporting purposes are both key sources of estimation uncertainty in preparing the accompanying consolidated financial statements.
As is also explained in Note 3.3 below, the Company believes that it currently controls its subsidiary operations in Venezuela but recognizes the challenging economic and political environment in Venezuela. Should the Company in the future conclude that it no longer controls such operations, its consolidated financial statements would change by material amounts as further explained below.
2.4 Changes in accounting policiesThe Company has adopted the following amendments to IFRS, during 2015:
Amendments to IAS 1 Disclosure Initiative
The amendments to IAS 1 “Presentation of Financial Statements” clarify, rather than significantly change, existing IAS 1 requirements, such as:
• The materiality requirements in IAS 1;
• That specific line items in the statement(s) of profit or loss and OCI and the statement of financial position may be disaggregated;
• That entities have flexibility as to the order in which they present the notes to financial statements; and
• That the share of OCI of associates and joint ventures accounted for using the equity method must be classified as either those items that will be subsequently reclassified to profit or loss and those that will not, and be presented as a single line item within each of those categories.
Furthermore, the amendments clarify the requirements that apply when additional subtotals are presented in the statement of financial position and the statement(s) of profit or loss and OCI. These amendments are effective for annual periods beginning on or after January 1, 2016, with early adoption permitted. The Company adopted these amendments and the only impact on the Company´s consolidated financial statements was presentation and disclosure.
Note 3. Significant Accounting Policies3.1 Basis of consolidationThe consolidated financial statements comprise the financial statements of the Company. Control is achieved when the Company is exposed, or has rights, to variable returns from its involvement with the investee and has the ability to affect those returns through its power over the investee.
Specifically, the Company controls an investee if and only if the Company has:
• Power over the investee (i.e. existing rights that give it the current ability to direct the relevant activities of the investee);
• Exposure, or rights, to variable returns from its involvement with the investee; and
• The ability to use its power over the investee to affect its returns.
When the Company has less than a majority of the voting or similar rights of an investee, the Company considers all relevant facts and circumstances in assessing whether it has power over an investee, including:
• The contractual arrangements with the other vote holders of the investee;
• Rights arising from other contractual arrangements; and
• The Company’s voting rights and potential voting rights.
The Company re-assesses whether or not it controls an investee if facts and circumstances indicate that there are changes to one or more of the three elements of control. Consolidation of a subsidiary begins when the Company obtains control over the subsidiary and ceases when the Company loses control of the subsidiary. Assets, liabilities, income and expenses of a subsidiary acquired or disposed of during the year are included in the consolidated financial statements of income and comprehensive income from the date the Company gains control until the date the Company ceases to control the subsidiary.

FEMSA Annual Report 2015 5756 creating stories
Consolidated net income and each component of other comprehensive income (OCI) are attributed to the equity holders of the parent of the Company and to the non-controlling interests, even if this results in the non-controlling interests having a deficit balance. When necessary, adjustments are made to the financial statements of subsidiaries to bring their accounting policies into line with the Company’s accounting policies. All intercompany assets and liabilities, equity, income, expenses and cash flows have been eliminated in full on consolidation.
3.1.1 Acquisitions of non-controlling interestsAcquisitions of non-controlling interests are accounted for as transactions with owners in their capacity as owners and therefore no goodwill is recognized as a result. Adjustments to non-controlling interests arising from transactions that do not involve the loss of control are measured at carrying amount and reflected in shareholders’ equity as part of additional paid-in capital.
3.2 Business combinationsBusiness combinations are accounted for using the acquisition method at the acquisition date, which is the date on which control is transferred to the Company. In assessing control, the Company takes into consideration substantive potential voting rights.
The Company measures goodwill at the acquisition date as the fair value of the consideration transferred plus the fair value of any previously-held equity interest in the acquiree and the recognized amount of any non-controlling interests in the acquiree (if any), less the net recognized amount of the identifiable assets acquired and liabilities assumed. If after reassessment, the excess is negative, a bargain purchase gain is recognized in consolidated net income at the time of the acquisition.
The consideration transferred does not include amounts related to the settlement of pre-existing relationships. Such amounts that differ from amounts previously recognized are recognized in consolidated net income of the Company.
Costs related to the acquisition, other than those associated with the issuance of debt or equity securities, that the Company incurs in connection with a business combination are expensed as incurred.
Any contingent consideration payable is recognized at fair value at the acquisition date. If the contingent consideration is classified as equity, it is not remeasured and settlement is accounted for within equity. Otherwise, if after reassessment, subsequent changes to the fair value of the contingent considerations are recognized in consolidated net income.
If the initial accounting for a business combination is incomplete by the end of the reporting period in which the combination occurs, the Company reports provisional amounts for the items for which the accounting is incomplete, and discloses that its allocation is preliminary in nature. Those provisional amounts are adjusted retrospectively during the measurement period (not greater than 12 months), or additional assets or liabilities are recognized, to reflect new information obtained about facts and circumstances that existed at the acquisition date that, if known, would have affected the amounts recognized at that date.
3.3 Foreign currencies, consolidation of foreign subsidiaries and accounting for investments in associates and joint venturesIn preparing the financial statements of each individual subsidiary and accounting for investments in associates and joint ventures, transactions in currencies other than the individual entity’s functional currency (foreign currencies) are recognized at the rates of exchange prevailing at the dates of the transactions. At the end of each reporting period, monetary items denominated in foreign currencies are retranslated at the rates prevailing at that date. Non-monetary items that are measured in terms of historical cost in a foreign currency are not remeasured.
Exchange differences on monetary items are recognized in consolidated net income in the period in which they arise except for:
• The variations in the net investment in foreign subsidiaries generated by exchange rate fluctuation which are included as part of the exchange differences on translation of foreign operations within the cumulative other comprehensive income (loss) item, which is recorded in equity.
• Intercompany financing balances with foreign subsidiaries are considered as long-term investments when there is no plan to pay such financing in the foreseeable future. Monetary position and exchange rate fluctuation regarding this financing is recorded in the exchange differences on translation of foreign operations within the cumulative other comprehensive income (loss) item, which is recorded in equity.
• Exchange differences on transactions entered into in order to hedge certain foreign currency risks.
Foreign exchange differences on monetary items are recognized in profit or loss. Their classification in the income statement depends on their nature. Differences arising from fluctuations related to operating activities are presented in the “other expenses” line (see Note 19) while fluctuations related to non-operating activities such as financing activities are presented as part of “foreign exchange gain (loss)” line in the income statement.
For incorporation into the Company’s consolidated financial statements, each foreign subsidiary, associates or joint venture’s individual financial statements are translated into Mexican pesos, as described as follows:
• For hyperinflationary economic environments, the inflation effects of the origin country are recognized, and subsequently translated into Mexican pesos using the year-end exchange rate for the consolidated statements of financial position and consolidated income statement and comprehensive income; and
• For non-hyperinflationary economic environments, assets and liabilities are translated into Mexican pesos using the year-end exchange rate, equity is translated into Mexican pesos using the historical exchange rate, and the income statement and comprehensive income is translated using the exchange rate at the date of each transaction. The Company uses the average exchange rate of each month only if the exchange rate does not fluctuate significantly.
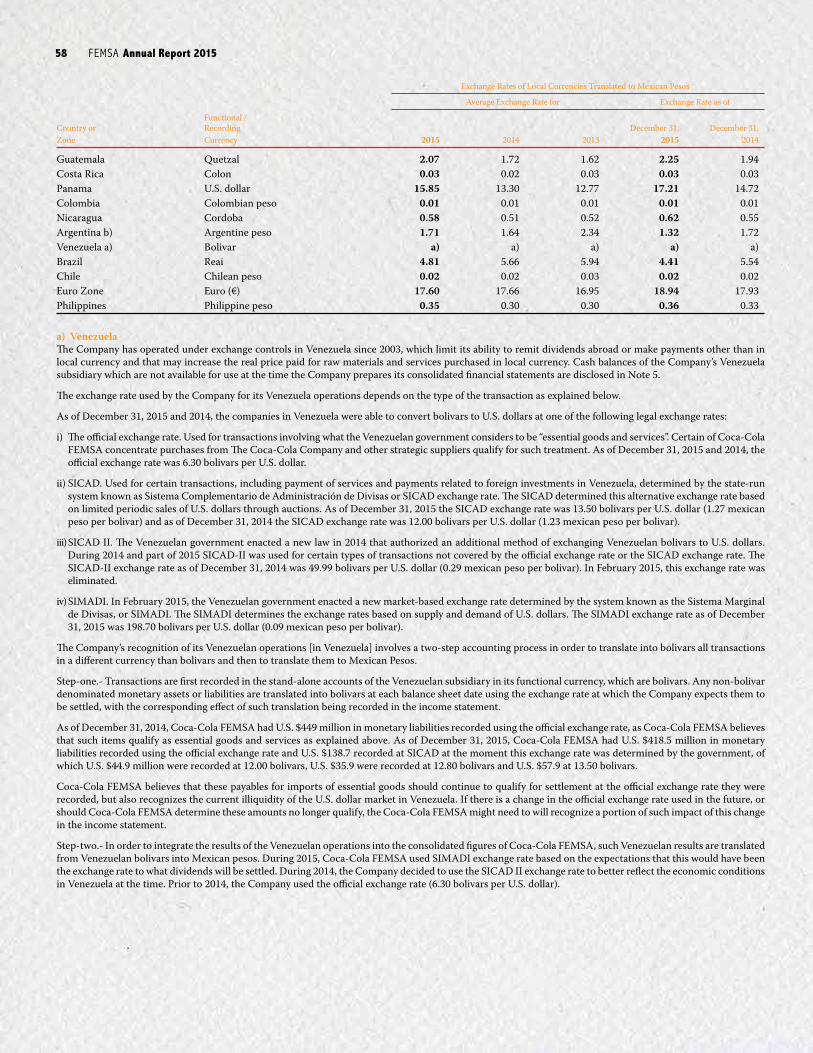
FEMSA Annual Report 2015 5958 creating stories
Exchange Rates of Local Currencies Translated to Mexican Pesos
Average Exchange Rate for Exchange Rate as of
Functional / Country or Recording December 31, December 31, Zone Currency 2015 2014 2013 2015 2014
Guatemala Quetzal 2.07 1.72 1.62 2.25 1.94Costa Rica Colon 0.03 0.02 0.03 0.03 0.03Panama U.S. dollar 15.85 13.30 12.77 17.21 14.72Colombia Colombian peso 0.01 0.01 0.01 0.01 0.01Nicaragua Cordoba 0.58 0.51 0.52 0.62 0.55Argentina b) Argentine peso 1.71 1.64 2.34 1.32 1.72Venezuela a) Bolivar a) a) a) a) a)Brazil Reai 4.81 5.66 5.94 4.41 5.54Chile Chilean peso 0.02 0.02 0.03 0.02 0.02Euro Zone Euro (€) 17.60 17.66 16.95 18.94 17.93Philippines Philippine peso 0.35 0.30 0.30 0.36 0.33
a) VenezuelaThe Company has operated under exchange controls in Venezuela since 2003, which limit its ability to remit dividends abroad or make payments other than in local currency and that may increase the real price paid for raw materials and services purchased in local currency. Cash balances of the Company’s Venezuela subsidiary which are not available for use at the time the Company prepares its consolidated financial statements are disclosed in Note 5.
The exchange rate used by the Company for its Venezuela operations depends on the type of the transaction as explained below.
As of December 31, 2015 and 2014, the companies in Venezuela were able to convert bolivars to U.S. dollars at one of the following legal exchange rates:
i) The official exchange rate. Used for transactions involving what the Venezuelan government considers to be “essential goods and services”. Certain of Coca-Cola FEMSA concentrate purchases from The Coca-Cola Company and other strategic suppliers qualify for such treatment. As of December 31, 2015 and 2014, the official exchange rate was 6.30 bolivars per U.S. dollar.
ii) SICAD. Used for certain transactions, including payment of services and payments related to foreign investments in Venezuela, determined by the state-run system known as Sistema Complementario de Administración de Divisas or SICAD exchange rate. The SICAD determined this alternative exchange rate based on limited periodic sales of U.S. dollars through auctions. As of December 31, 2015 the SICAD exchange rate was 13.50 bolivars per U.S. dollar (1.27 mexican peso per bolivar) and as of December 31, 2014 the SICAD exchange rate was 12.00 bolivars per U.S. dollar (1.23 mexican peso per bolivar).
iii) SICAD II. The Venezuelan government enacted a new law in 2014 that authorized an additional method of exchanging Venezuelan bolivars to U.S. dollars. During 2014 and part of 2015 SICAD-II was used for certain types of transactions not covered by the official exchange rate or the SICAD exchange rate. The SICAD-II exchange rate as of December 31, 2014 was 49.99 bolivars per U.S. dollar (0.29 mexican peso per bolivar). In February 2015, this exchange rate was eliminated.
iv) SIMADI. In February 2015, the Venezuelan government enacted a new market-based exchange rate determined by the system known as the Sistema Marginal de Divisas, or SIMADI. The SIMADI determines the exchange rates based on supply and demand of U.S. dollars. The SIMADI exchange rate as of December 31, 2015 was 198.70 bolivars per U.S. dollar (0.09 mexican peso per bolivar).
The Company’s recognition of its Venezuelan operations [in Venezuela] involves a two-step accounting process in order to translate into bolivars all transactions in a different currency than bolivars and then to translate them to Mexican Pesos.
Step-one.- Transactions are first recorded in the stand-alone accounts of the Venezuelan subsidiary in its functional currency, which are bolivars. Any non-bolivar denominated monetary assets or liabilities are translated into bolivars at each balance sheet date using the exchange rate at which the Company expects them to be settled, with the corresponding effect of such translation being recorded in the income statement.
As of December 31, 2014, Coca-Cola FEMSA had U.S. $449 million in monetary liabilities recorded using the official exchange rate, as Coca-Cola FEMSA believes that such items qualify as essential goods and services as explained above. As of December 31, 2015, Coca-Cola FEMSA had U.S. $418.5 million in monetary liabilities recorded using the official exchange rate and U.S. $138.7 recorded at SICAD at the moment this exchange rate was determined by the government, of which U.S. $44.9 million were recorded at 12.00 bolivars, U.S. $35.9 were recorded at 12.80 bolivars and U.S. $57.9 at 13.50 bolivars.
Coca-Cola FEMSA believes that these payables for imports of essential goods should continue to qualify for settlement at the official exchange rate they were recorded, but also recognizes the current illiquidity of the U.S. dollar market in Venezuela. If there is a change in the official exchange rate used in the future, or should Coca-Cola FEMSA determine these amounts no longer qualify, the Coca-Cola FEMSA might need to will recognize a portion of such impact of this change in the income statement.
Step-two.- In order to integrate the results of the Venezuelan operations into the consolidated figures of Coca-Cola FEMSA, such Venezuelan results are translated from Venezuelan bolivars into Mexican pesos. During 2015, Coca-Cola FEMSA used SIMADI exchange rate based on the expectations that this would have been the exchange rate to what dividends will be settled. During 2014, the Company decided to use the SICAD II exchange rate to better reflect the economic conditions in Venezuela at the time. Prior to 2014, the Company used the official exchange rate (6.30 bolivars per U.S. dollar).

FEMSA Annual Report 2015 5958 creating stories
b) ArgentinaOfficial exchange rates for Argentina are published by the Argentine Central Bank. The Argentine peso has experienced significant devaluation over the past several years and the government has adopted various rules and regulations since late 2011 that established new restrictive controls on capital flows into the country. These enhanced exchange controls have practically closed the foreign exchange market to retail transactions. It is widely reported that the Argentine peso/U.S. dollar exchange rate in the unofficial market substantially differs from the official foreign exchange rate. The Argentine government could impose further exchange controls or restrictions on the movement of capital and take other measures in the future in response to capital flight or a significant depreciation of the Argentine peso.
On the disposal of a foreign operation (i.e., a disposal of the Company’s entire interest in a foreign operation, or a disposal involving loss of control over a subsidiary that includes a foreign operation, a disposal involving loss of joint control over a joint venture that includes a foreign operation, or a disposal involving loss of significant influence over an associate that includes a foreign operation), all of the exchange differences accumulated in other comprehensive income in respect of that operation attributable to the owners of the Company are recognized in the consolidated income statement. The Company continues to monitor all of its foreign operations, but most notably its Venezuela operations for the reasons explained herein. Over the past few years, the Company has accumulated significant amounts of accumulated other comprehensive loss (approximating Ps. 15,536 million) related to such Venezuela operations. To the extent that economic and or operational conditions were to worsen in the future resulting in a conclusion that the Company no longer controls such operations, such would involve both deconsolidation and an income statement charge for accumulated amounts. There can be no assurances that such might not happen in the future.
In addition, in relation to a partial disposal of a subsidiary that does not result in the Company losing control over the subsidiary, the proportionate share of accumulated exchange differences are re-attributed to non-controlling interests and are not recognized in profit or loss. For all other partial disposals (i.e., partial disposals of associates or joint ventures that do not result in the Company losing significant influence or joint control), the proportionate share of the accumulated exchange differences is reclassified to profit or loss.
Goodwill and fair value adjustments on identifiable assets and liabilities acquired arising on the acquisition of a foreign operation are treated as assets and liabilities of the foreign operation and translated at the rate of exchange prevailing at the end of each reporting period. Foreign exchange differences arising are recognized in equity as part of the cumulative translation adjustment.
The translation of assets and liabilities denominated in foreign currencies into Mexican pesos is for consolidation purposes and does not indicate that the Company could realize or settle the reported value of those assets and liabilities in Mexican pesos. Additionally, this does not indicate that the Company could return or distribute the reported Mexican peso value equity to its shareholders.
3.4 Recognition of the effects of inflation in countries with hyperinflationary economic environmentsThe Company recognizes the effects of inflation on the financial information of its Venezuelan subsidiary that operates in hyperinflationary economic environments (when cumulative inflation of the three preceding years is approaching, or exceeds, 100% or more in addition to other qualitative factors), which consists of:
• Using inflation factors to restate non-monetary assets, such as inventories, property, plant and equipment, intangible assets, including related costs and expenses when such assets are consumed or depreciated;
• Applying the appropriate inflation factors to restate capital stock, additional paid-in capital, net income, retained earnings and items of other comprehensive income by the necessary amount to maintain the purchasing power equivalent in the currency of Venezuela on the dates such capital was contributed or income was generated up to the date of these consolidated financial statements are presented; and
• Including the monetary position gain or loss in consolidated net income.
The Company restates the financial information of subsidiaries that operate in a hyperinflationary economic environment (Venezuela) using the consumer price index of that country. The Venezuelan economy’s cumulative inflation rate for the period 2013-2015, 2012-2014 and 2011-2013 was 562.9%, 210.2% and 139.3%; respectively.
During 2014, the International Monetary Fund (IMF) issued a declaration of censure and called on Argentina to adopt remedial measures to address the quality of its official inflation data. The IMF noted that alternative data sources have shown considerably higher inflation rates than the official data since 2008. Consumer price data reported by Argentina from January 2014 onwards reflect the new national Consumer Price Index (CPI) which means Indice de Precios al Consumidor Nacional Urbano (IPCNu), which differs substantively from the preceding CPI. Because of the differences in geographical coverage, weights, sampling, and methodology, the IPCNu data cannot be directly compared to the earlier CPI-GBA data.
3.5 Cash and cash equivalents and restricted cashCash is measured at nominal value and consists of non-interest bearing bank deposits. Cash equivalents consist principally of short-term bank deposits and fixed rate investments, both with maturities of three months or less at the acquisition date and are recorded at acquisition cost plus interest income not yet received, which is similar to market prices.
The Company also maintains restricted cash held as collateral to meet certain contractual obligations (see Note 9.2). Restricted cash is presented within other current financial assets given that the restrictions are short-term in nature.
3.6 Financial assetsFinancial assets are classified into the following specified categories: “fair value through profit or loss (FVTPL) ,” “held-to-maturity investments,” “available-for-sale” and “loans and receivables” or as derivatives designated as hedging instruments in an effective hedge, as appropriate. The classification depends on the nature and purpose of holding the financial assets and is determined at the time of initial recognition.
When a financial asset is recognized initially, the Company measures it at its fair value plus, in the case of a financial asset not at fair value through profit or loss, transaction costs that are directly attributable to the acquisition of the financial asset.
The fair value of an asset or a liability is measured using the assumptions that market participants would use when pricing the asset or liability, assuming that market participants act in their economic best interest.
The Company’s financial assets include cash, cash equivalents and restricted cash, investments with maturities of greater than three months, loans and receivables, derivative financial instruments and other financial assets.
FEMSA Annual Report 2015 6160 creating stories
3.6.1 Effective interest rate methodThe effective interest rate method is a method of calculating the amortized cost of loans and receivables and other financial assets (designated as held to-maturity) and of allocating interest income/expense over the relevant period. The effective interest rate is the rate that exactly discounts estimated future cash receipts (including all fees on points paid or received that form an integral part of the effective interest rate, transaction costs and other premiums or discounts) through the expected life of the financial asset, or (where appropriate) a shorter period, to the net carrying amount on initial recognition.
3.6.2 InvestmentsInvestments consist of debt securities and bank deposits with maturities of more than three months at the acquisition date. Management determines the appropriate classification of investments at the time of purchase and assesses such designation as of each reporting date (see Note 6).
3.6.2.1 Available-for-sale investments are those non-derivative financial assets that are designated as available for sale or are not classified as loans and receivables, held to maturity investments or financial assets at fair value through profit or loss. These investments are carried at fair value, with the unrealized gains and losses, net of tax, reported in other comprehensive income. Interest and dividends on investments classified as available-for-sale are included in interest income. The fair values of the investments are readily available based on quoted market prices. The exchange effects of securities available for sale are recognized in the consolidated income statement in the period in which they arise.
3.6.2.2 Held-to maturity investments are those that the Company has the positive intent and ability to hold to maturity, and after initial measurement, such financial assets are subsequently measured at amortized cost, which includes any cost of purchase and premium or discount related to the investment. Subsequently, the premium/discount is amortized over the life of the investment based on its outstanding balance utilizing the effective interest method less any impairment. Interest and dividends on investments classified as held-to maturity are included in interest income.
3.6.3 Loans and receivablesLoans and receivables are non-derivative financial instruments with fixed or determinable payments that are not quoted in an active market. Loans and receivables with a stated term (including trade and other receivables) are measured at amortized cost using the effective interest method, less any impairment.
Interest income is recognized by applying the effective interest rate, except for short-term receivables when the recognition of interest would be immaterial. For the years ended December 31, 2015, 2014 and 2013 the interest income on loans and receivables recognized in the interest income line item within the consolidated income statements is Ps. 53, Ps. 47 and Ps. 127, respectively.
3.6.4 Other financial assetsOther financial assets include long term accounts receivable and derivative financial instruments. Long term accounts receivable with a stated term are measured at amortized cost using the effective interest method, less any impairment.
3.6.5 Impairment of financial assetsFinancial assets, other than those at FVTPL, are assessed for indicators of impairment at the end of each reporting period. Financial assets are considered to be impaired when there is objective evidence that, as a result of one or more events that occurred after the initial recognition of the financial asset, (an incurred “loss event”) and that loss event has an impact on the estimated future cash flows of the financial assets that can be reliably estimated.
Evidence of impairment may include indicators as follows:
• Significant financial difficulty of the issuer or counterparty; or
• Default or delinquent in interest or principal payments; or
• It becoming probable that the borrower will enter bankruptcy or financial re-organization; or
• The disappearance of an active market for that financial asset because of financial difficulties.
For financial assets carried at amortized cost, the amount of the impairment loss recognized is the difference between the asset’s carrying amount and the present value of estimated future cash flows, discounted at the financial asset’s original effective interest rate.
The carrying amount of the financial asset is reduced by the impairment loss directly for all financial assets with the exception of trade receivables, where the carrying amount is reduced through the use of an allowance for doubtful accounts. When a trade receivable is considered uncollectible, it is written off against the allowance account. Subsequent recoveries of amounts previously written off are credited against the allowance account. Changes in the carrying amount of the allowance account are recognized in consolidated net income.
No impairment was recognized for the years ended December 31, 2015, 2014 and 2013.
3.6.6 DerecognitionA financial asset (or, where applicable, a part of a financial asset or part of a group of similar financial assets) is derecognized when:
• The rights to receive cash flows from the financial asset have expired, or
• The Company has transferred its rights to receive cash flows from the asset or has assumed an obligation to pay the received cash flows in full without material delay to a third party under a ‘pass-through’ arrangement; and either (a) the Company has transferred substantially all the risks and rewards of the asset, or (b) the Company has neither transferred nor retained substantially all the risks and rewards of the asset, but has transferred control of the asset.
3.6.7 Offsetting of financial instrumentsFinancial assets are required to be offset against financial liabilities and the net amount reported in the consolidated statement of financial position if, and only when the Company:
• Currently has an enforceable legal right to offset the recognized amounts; and
• Intends to settle on a net basis, or to realize the assets and settle the liabilities simultaneously.

FEMSA Annual Report 2015 6160 creating stories
3.7 Derivative financial instrumentsThe Company is exposed to different risks related to cash flows, liquidity, market and third party credit. As a result, the Company contracts different derivative financial instruments in order to reduce its exposure to the risk of exchange rate fluctuations between the Mexican peso and other currencies, and interest rate fluctuations associated with its borrowings denominated in foreign currencies and the exposure to the risk of fluctuation in the costs of certain raw materials.
The Company values and records all derivative financial instruments and hedging activities, in the consolidated statement of financial position as either an asset or liability measured at fair value, considering quoted prices in recognized markets. If such instruments are not traded in a formal market, fair value is determined by applying techniques based upon technical models supported by sufficient, reliable and verifiable market data. Changes in the fair value of derivative financial instruments are recorded each year in current earnings or as a component of cumulative other comprehensive income based on the item being hedged and the effectiveness of the hedge.
3.7.1 Hedge accountingThe Company designates certain hedging instruments, which include derivatives to cover foreign currency risk, as either fair value hedges or cash flow hedges. Hedges of foreign exchange risk on firm commitments are accounted for as cash flow hedges.
At the inception of the hedge relationship, the Company documents the relationship between the hedging instrument and the hedged item, along with its risk management objectives and its strategy for undertaking various hedge transactions. Furthermore, at the inception of the hedge and on an ongoing basis, the Company documents whether the hedging instrument is highly effective in offsetting changes in fair values or cash flows of the hedged item attributable to the hedged risk.
3.7.2 Cash flow hedgesThe effective portion of changes in the fair value of derivatives that are designated and qualify as cash flow hedges is recognized in other comprehensive income and accumulated under the heading valuation of the effective portion of derivative financial instruments. The gain or loss relating to the ineffective portion is recognized immediately in consolidated net income, and is included in the market value (gain) loss on financial instruments line item within the consolidated income statements.
Amounts previously recognized in other comprehensive income and accumulated in equity are reclassified to consolidated net income in the periods when the hedged item is recognized in consolidated net income, in the same line of the consolidated income statement as the recognized hedged item. However, when the hedged forecast transaction results in the recognition of a non-financial asset or a non-financial liability, the gains and losses previously recognized in other comprehensive income and accumulated in equity are transferred from equity and included in the initial measurement of the cost of the non-financial asset or non-financial liability.
Hedge accounting is discontinued when the Company revokes the hedging relationship, when the hedging instrument expires or is sold, terminated, or exercised, or when it no longer qualifies for hedge accounting. Any gain or loss recognized in cumulative other comprehensive income in equity at that time remains in equity and is recognized when the forecast transaction is ultimately recognized in consolidated net income. When a forecast transaction is no longer expected to occur, the gain or loss accumulated in equity is recognized immediately in consolidated net income.
3.7.3 Fair value hedgesThe change in the fair value of a hedging derivative is recognized in the consolidated income statement as foreign exchange gain or loss. The change in the fair value of the hedged item attributable to the risk hedged is recorded as part of the carrying value of the hedged item and is also recognized in the consolidated income statement as foreign exchange gain or loss.
For items which had been accounted for as fair value hedges, and subsequently accounted for as a cash flow hedge and now carried at amortized cost, the adjustment to carrying value to its principal amount is amortized through profit or loss over the remaining term of the hedge using the EIR method. EIR amortization may begin as soon as an adjustment exists and no later than when the hedged item ceases to be adjusted for changes in its fair value attributable to the risk being hedged. If the hedged item is derecognized, the unamortized fair value is recognized immediately in profit or loss.
When an unrecognized firm commitment is designated as a hedged item, the subsequent cumulative change in the fair value of the firm commitment attributable to the hedged risk is recognized as an asset or liability with a corresponding gain or loss recognized in the consolidated net income.
3.8 Fair value measurementThe Company measures financial instruments, such as derivatives, and non-financial assets, at fair value at each balance sheet date. Also, fair values of financial instruments measured at amortized cost are disclosed in Notes 13 and 18.
Fair value is the price that would be received to sell an asset or paid to transfer a liability in an orderly transaction between market participants at the measurement date. The fair value measurement is based on the presumption that the transaction to sell the asset or transfer the liability takes place either:
• In the principal market for the asset or liability; or
• In the absence of a principal market, in the most advantageous market for the asset or liability.
A fair value measurement of a non-financial asset takes into account a market participant’s ability to generate economic benefits by using the asset in its highest and best use or by selling it to another market participant that would use the asset in its highest and best use.
The Company uses valuation techniques that are appropriate in the circumstances and for which sufficient data are available to measure fair value, maximizing the use of relevant observable inputs and minimizing the use of unobservable inputs.
All assets and liabilities for which fair value is measured or disclosed in the financial statements are categorized within the fair value hierarchy, described as follows, based on the lowest level input that is significant to the fair value measurement as a whole:
• Level 1 — Quoted prices (unadjusted) in active markets for identical assets or liabilities that the reporting entity has the ability to access at the measurement date.
• Level 2 — Inputs other than quoted prices included within level 1 that are observable for the asset or liability, either directly or indirectly.
• Level 3 — Are unobservable inputs for the asset or liability. Unobservable inputs shall be used to measure fair value to the extent that observable inputs are not available, thereby allowing for situations in which there is little, if any, market activity for the asset or liability at the measurement date.

FEMSA Annual Report 2015 6362 creating stories
For assets and liabilities that are recognized in the financial statements on a recurring basis, the Company determines whether transfers have occurred between Levels in the hierarchy by re-assessing categorization (based on the lowest level input that is significant to the fair value measurement as a whole) at the end of each reporting period.
The Company determines the policies and procedures for both recurring fair value measurements, such as those described in Note 20 and unquoted liabilities such as debt described in Note 18.
For the purpose of fair value disclosures, the Company has determined classes of assets and liabilities on the basis of the nature, characteristics and risks of the asset or liability and the level of the fair value hierarchy as explained above.
3.9 Inventories and cost of goods soldInventories are measured at the lower of cost and net realizable value. Net realizable value represents the estimated selling price for inventories less all estimated costs of completion and costs necessary to make the sale.
Inventories represent the acquisition or production cost which is incurred when purchasing or producing a product, and are based on the weighted average cost formula. The operating segments of the Company use inventory costing methodologies to value their inventories, such as the weighted average cost method in Coca-Cola FEMSA and retail method in FEMSA Comercio – Retail Division and FEMSA Comercio – Fuel Division.
Cost of goods sold is based on average cost of the inventories at the time of sale.
Cost of goods sold in Coca-Cola FEMSA includes expenses related to the purchase of raw materials used in the production process, as well as labor costs (wages and other benefits), depreciation of production facilities, equipment and other costs, including fuel, electricity, equipment maintenance and inspection.
Cost of goods sold in FEMSA Comercio – Retail Division includes expenses related to the purchase of goods and services used in the sale process of the Company´s products.
Cost of goods sold in FEMSA Comercio – Fuel Division includes expenses related to the purchase of gasoline, diesel and all engine lubricants used in the sale process of the Company.
3.10 Other current assetsOther current assets, which will be realized within a period of less than one year from the reporting date, are comprised of prepaid assets and agreements with customers.
Prepaid assets principally consist of advances to suppliers of raw materials, advertising, promotional, leasing and insurance costs, and are recognized as other current assets at the time of the cash disbursement. Prepaid assets are carried to the appropriate caption in the income statement when inherent benefits and risks have already been transferred to the Company or services have been received.
The Company has prepaid advertising costs which consist of television and radio advertising airtime paid in advance. These expenses are generally amortized over the period based on the transmission of the television and radio spots. The related production costs are recognized in consolidated net income as incurred.
Coca-Cola FEMSA has agreements with customers for the right to sell and promote Coca-Cola FEMSA’s products over a certain period. The majority of these agreements have terms of more than one year, and the related costs are amortized using the straight-line method over the term of the contract, with amortization presented as a reduction of net sales. During the years ended December 31, 2015, 2014 and 2013, such amortization aggregated to Ps. 317, Ps. 338 and Ps. 696, respectively.
3.11 Investments in associates and joint arrangements3.11.1 Investments in associatesAssociates are those entities over which the Company has significant influence. Significant influence is the power to participate in the financial and operating policy decisions of the investee, but is not control over those policies.
Investments in associates are accounted for using the equity method and initial recognition comprises the investment’s purchase price and any directly attributable expenditure necessary to acquire it.
The consolidated financial statements include the Company’s share of the consolidated net income and other comprehensive income, after adjustments to align the accounting policies with those of the Company, from the date that significant influence commences until the date that significant influence ceases.
Profits and losses resulting from ‘upstream’ and ‘downstream’ transactions between the Company (including its consolidated subsidiaries) and an associate are recognized in the consolidated financial statements only to the extent of unrelated investors’ interests in the associate. ‘Upstream’ transactions are, for example, sales of assets from an associate to the Company. ‘Downstream’ transactions are, for example, sales of assets from the Company to an associate. The Company’s share in the associate’s profits and losses resulting from these transactions is eliminated.
When the Company’s share of losses exceeds the carrying amount of the associate, including any long-term investments, the carrying amount is reduced to nil and recognition of further losses is discontinued except to the extent that the Company has a legal or constructive obligation to pay the associate or has to make payments on behalf of the associate.
Goodwill identified at the acquisition date is presented as part of the investment in shares of the associate in the consolidated statement of financial position. Any goodwill arising on the acquisition of the Company’s interest in an associate is measured in accordance with the Company’s accounting policy for goodwill arising in a business combination, see Note 3.2.
After application of the equity method, the Company determines whether it is necessary to recognize an additional impairment loss on its investment in its associate. The Company determines at each reporting date whether there is any objective evidence that the investment in the associates is impaired. If this is the case, the Company calculates the amount of impairment as the difference between the recoverable amount of the associate and its carrying value, and recognizes the amount in the share of the profit or loss of associates and joint ventures accounted for using the equity method in the consolidated income statements.
FEMSA Annual Report 2015 6362 creating stories
3.11.2 Joint arrangementsA joint arrangement is an arrangement of which two or more parties have joint control. Joint control is the contractually agreed sharing of control of an arrangement, which exists only when decisions about the relevant activities require the unanimous consent of the parties sharing control. The Company classifies its interests in joint arrangements as either joint operations or joint ventures depending on the Company’s rights to the assets and obligations for the liabilities of the arrangements.
Joint venture is a joint arrangement whereby the parties that have joint control of the arrangement have rights to the net assets of the arrangement. The Company recognizes its interest in the joint ventures as an investment and accounts for that investment using the equity method, as described in Note 3.11.1. As of December 31, 2015 and 2014 the Company does not have an interest in joint operations.
After application of the equity method, the Company determines whether it is necessary to recognize an impairment loss on its investment in its joint venture. The Company determines at each reporting date whether there is any objective evidence that the investment in the joint ventures is impaired. If this is the case, the Company calculates the amount of impairment as the difference between the recoverable amount of the joint venture and its carrying value and recognizes the amount in the share of the profit or loss of joint ventures accounted for using the equity method in the consolidated statements of income.
3.12 Property, plant and equipmentProperty, plant and equipment are initially recorded at their cost of acquisition and/or construction, and are presented net of accumulated depreciation and/or accumulated impairment losses, if any. The borrowing costs related to the acquisition or construction of qualifying asset is capitalized as part of the cost of that asset, if material.
Major maintenance costs are capitalized as part of total acquisition cost. Routine maintenance and repair costs are expensed as incurred.
Investments in progress consist of long-lived assets not yet in service, in other words, that are not yet used for the purpose that they were bought, built or developed. The Company expects to complete those investments during the following 12 months.
Depreciation is computed using the straight-line method over the asset’s estimated useful life. Where an item of property, plant and equipment comprises major components having different useful lives, they are accounted and depreciated for as separate items (major components) of property, plant and equipment. The Company estimates depreciation rates, considering the estimated useful lives of the assets.
The estimated useful lives of the Company’s principal assets are as follows:
Years
Buildings 15-50Machinery and equipment 10-20Distribution equipment 7-15Refrigeration equipment 5-7Returnable bottles 1.5-4Leasehold improvements The shorter of lease term or 15 yearsInformation technology equipment 3-5Other equipment 3-10
The estimated useful lives, residual values and depreciation method are reviewed at the end of each reporting period, with the effect of any changes in estimate accounted for on a prospective basis.
An item of property, plant and equipment is derecognized upon disposal or when no future economic benefits are expected to arise from the continued use of the asset. Any gain or loss arising on the disposal or retirement of an item of property, plant and equipment is determined as the difference between the sales proceeds (if any) and the carrying amount of the asset and is recognized in consolidated net income.
Returnable and non-returnable bottles:Coca-Cola FEMSA has two types of bottles: returnable and non-returnable.
• Non returnable: Are recorded in consolidated net income at the time of the sale of the product.
• Returnable: Are classified as long-lived assets as a component of property, plant and equipment. Returnable bottles are recorded at acquisition cost; and for countries with hyperinflationary economies, restated according to IAS 29, “Financial Reporting in Hyperinflationary Economies.” Depreciation of returnable bottles is computed using the straight-line method considering their estimated useful lives.
There are two types of returnable bottles:
• Those that are in Coca-Cola FEMSA’s control within its facilities, plants and distribution centers; and
• Those that have been placed in the hands of customers, and still belong to Coca-Cola FEMSA.
Returnable bottles that have been placed in the hands of customers are subject to an agreement with a retailer pursuant to which Coca-Cola FEMSA retains ownership. These bottles are monitored by sales personnel during periodic visits to retailers and Coca-Cola FEMSA has the right to charge any breakage identified to the retailer. Bottles that are not subject to such agreements are expensed when placed in the hands of retailers.
Coca-Cola FEMSA’s returnable bottles are depreciated according to their estimated useful lives (3 years for glass bottles and 1.5 years for PET bottles). Deposits received from customers are amortized over the same useful estimated lives of the bottles.
FEMSA Annual Report 2015 6564 creating stories
3.13 Borrowing costsBorrowing costs directly attributable to the acquisition, construction or production of qualifying assets, which are assets that necessarily take a substantial period of time to get ready for their intended use or sale, are added to the cost of those assets, until such time as the assets are substantially ready for their intended use or sale. Borrowing costs may include:
• Interest expense; and
• Exchange differences arising from foreign currency borrowings to the extent that they are regarded as an adjustment to interest costs.
Interest income earned on the temporary investment of specific borrowings pending their expenditure on qualifying assets is deducted from the borrowing costs eligible for capitalization.
All other borrowing costs are recognized in consolidated net income in the period in which they are incurred.
3.14 Intangible assetsIntangible assets are identifiable non monetary assets without physical substance and represent payments whose benefits will be received in future years. Intangible assets acquired separately are measured on initial recognition at cost. The cost of intangible assets acquired in a business combination is their fair value as at the date of acquisition (see Note 3.2). Following initial recognition, intangible assets are carried at cost less any accumulated amortization and accumulated impairment losses. The useful lives of intangible assets are assessed as either finite or indefinite, in accordance with the period over which the Company expects to receive the benefits.
Intangible assets with finite useful lives are amortized and mainly consist of:
• Information technology and management system costs incurred during the development stage which are currently in use. Such amounts are capitalized and then amortized using the straight-line method over their expected useful lives, with a range in useful lives from 3 to 10 years. Expenses that do not fulfill the requirements for capitalization are expensed as incurred.
• Long-term alcohol licenses are amortized using the straight-line method over their estimated useful lives, which range between 12 and 15 years, and are presented as part of intangible assets with finite useful lives.
Amortized intangible assets, such as finite lived intangible assets are reviewed for impairment whenever events or changes in circumstances indicate that the carrying amount of an asset or group of assets may not be recoverable through its expected future cash flows.
Intangible assets with an indefinite life are not amortized and are subject to impairment tests on an annual basis as well as whenever certain circumstances indicate that the carrying amount of those intangible assets exceeds their recoverable value.
The Company’s intangible assets with an indefinite life mainly consist of rights to produce and distribute Coca-Cola trademark products in the Company’s territories. These rights are contained in agreements that are standard contracts that The Coca-Cola Company has with its bottlers.
As of December 31, 2015, Coca-Cola FEMSA had nine bottler agreements in Mexico: (i) the agreements for the Valley of Mexico territory, which are up for renewal in May 2016 and June 2023, (ii) the agreement for the Southeast territory, which is up for renewal in June 2023, (iii) three agreements for the Central territory, which are up for renewal in May 2016, July 2016 and May 2025, (iv) the agreement for the Northeast territory, which is up for renewal in May 2016, and (v) two agreements for the Bajio territory, which are up for renewal in May 2016 and May 2025.
As of December 31, 2015, Coca-Cola FEMSA had four bottler agreements in Brazil, which are up for renewal in October 2017 (two agreements) and April 2024 (two agreements); and one bottler agreement in each of Argentina, which is up for renewal in September 2024; Colombia, which is up for renewal in June 2024; Venezuela, which is up for renewal in August 2016; Guatemala, which is up for renewal in March 2025; Costa Rica, which is up for renewal in September 2017; Nicaragua, which is up for renewal in May 2016 and Panama, which is up for renewal in November 2024.
The bottler agreements are automatically renewable for ten-year terms, subject to the right of either party to give prior notice that it does not wish to renew a specific agreement. In addition, these agreements generally may be terminated in the case of material breach. Termination would prevent the Company from selling Coca-Cola trademark beverages in the affected territory and would have an adverse effect on the Company´s business, financial conditions, results from operations and prospects.
3.15 Non-current assets held for saleNon-current assets and disposal groups are classified as held for sale if their carrying amount will be recovered principally through a sale transaction rather than through continuing use. This condition is regarded as met only when the sale is highly probable and the non-current asset (or disposal group) is available for immediate sale in its present condition. Management must be committed to the sale, which should be expected to qualify for recognition as a completed sale within one year from the date of classification.
When the Company is committed to a sale plan involving loss of control of a subsidiary, all of the assets and liabilities of that subsidiary are classified as held for sale when the criteria described above are met, regardless of whether the Company will retain a non-controlling interest in its former subsidiary after the sale.
Non-current assets (and disposal groups) classified as held for sale are measured at the lower of their previous carrying amount and fair value less costs to sell.
3.16 Impairment of non financial assetsAt the end of each reporting period, the Company reviews the carrying amounts of its tangible and intangible assets to determine whether there is any indication that those assets have suffered an impairment loss. If any such indication exists, the recoverable amount of the asset is estimated in order to determine the extent of the impairment loss (if any). Where it is not possible to estimate the recoverable amount of an individual asset, the Company estimates the recoverable amount of the cash-generating unit to which the asset belongs. Where a reasonable and consistent basis of allocation can be identified, corporate assets are also allocated to individual CGUs, or otherwise they are allocated to the smallest CGUs for which a reasonable and consistent allocation basis can be identified.
For goodwill and other indefinite lived intangible assets, the Company tests for impairment on an annual basis and whenever certain circumstances indicate that the carrying amount of the cash generating unit might exceed its recoverable amount.
FEMSA Annual Report 2015 6564 creating stories
Recoverable amount is the higher of fair value less costs to sell and value in use. In assessing value in use, the estimated future cash flows are discounted to their present value using a pre-tax discount rate that reflects current market assessments of the time value of money and the risks specific to the asset for which the estimates of future cash flows have not been adjusted.
If the recoverable amount of an asset (or CGU) is estimated to be less than its carrying amount, the carrying amount of the asset (or CGU) is reduced to its recoverable amount. An impairment loss is recognized immediately in consolidated net income.
Where an impairment loss subsequently reverses, the carrying amount of the asset (or CGU) is increased to the revised estimate of its recoverable amount, but so that the increased carrying amount does not exceed the carrying amount that would have been determined had no impairment loss been recognized for the asset (or CGU) in prior years. A reversal of an impairment loss is recognized immediately in consolidated net income. Impairment losses related to goodwill are not reversible.
For the year ended December 31, 2015 and 2014, the Company recognized impairment of Ps. 134 and Ps. 145, respectively (see Note 19). No impairment was recognized for the year ended December 31, 2013.
3.17 LeasesThe determination of whether an arrangement is, or contains, a lease is based on the substance of the arrangement at inception date, whether fulfillment of the arrangement is dependent on the use of a specific asset or assets or the arrangement conveys a right to use the asset, even if that right is not explicitly specified in an arrangement.
Leases are classified as finance leases whenever the terms of the lease transfer substantially all the risks and rewards of ownership to the lessee. All other leases are classified as operating leases.
Assets held under finance leases are initially recognized as assets of the Company at their fair value at the inception of the lease or, if lower, at the present value of the minimum lease payments. The corresponding liability to the lessor is included in the consolidated statement of financial position as a finance lease obligation. Lease payments are apportioned between finance expenses and reduction of the lease obligation so as to achieve a constant rate of interest on the remaining balance of the liability. Interest expenses are recognized immediately in consolidated net income, unless they are directly attributable to qualifying assets, in which case they are capitalized in accordance with the Company’s general policy on borrowing costs. Contingent rentals are recognized as expenses in the periods in which they are incurred. Assets held under finance leases are depreciated over their expected useful lives on the same basis as owned assets or, where shorter, the term of the relevant lease.
Operating lease payments are recognized as an expense on a straight-line basis over the lease term, except where another systematic basis is more representative of the time pattern in which economic benefits from the leased asset are consumed. Contingent rentals arising under operating leases are recognized as an expense in the period in which they are incurred. In the event that lease incentives are received to enter into operating leases, such incentives are recognized as a liability. The aggregate benefit of incentives is recognized as a reduction of rental expense on a straight-line basis, except where another systematic basis is more representative of the time pattern in which economic benefits from the leased asset are consumed. Leasehold improvements on operating leases are amortized using the straight-line method over the shorter of either the useful life of the assets or the related lease term.
3.18 Financial liabilities and equity instruments3.18.1 Classification as debt or equityDebt and equity instruments issued by the Company are classified as either financial liabilities or as equity in accordance with the substance of the contractual arrangements and the definitions of a financial liability and an equity instrument.
3.18.2 Equity instrumentsAn equity instrument is any contract that evidences a residual interest in the assets of an entity after deducting all of its liabilities. Equity instruments issued by the Company are recognized at the proceeds received, net of direct issue costs.
Repurchase of the Company’s own equity instruments is recognized and deducted directly in equity. No gain or loss is recognized in profit or loss on the purchase, sale, issue or cancellation of the Company’s own equity instruments.
3.18.3 Financial liabilitiesInitial recognition and measurementFinancial liabilities within the scope of IAS 39 are classified as financial liabilities at FVTPL, loans and borrowings, or as derivatives designated as hedging instruments in an effective hedge, as appropriate. The Company determines the classification of its financial liabilities at initial recognition.
All financial liabilities are recognized initially at fair value less, in the case of loans and borrowings, directly attributable transaction costs.
The Company financial liabilities include trade and other payables, loans and borrowings, and derivative financial instruments, see Note 3.7.
Subsequent measurementThe measurement of financial liabilities depends on their classification as described below.
3.18.4 Loans and borrowingsAfter initial recognition, interest bearing loans and borrowings are subsequently measured at amortized cost using the effective interest method. Gains and losses are recognized in the consolidated income statements when the liabilities are derecognized as well as through the effective interest method amortization process.
Amortized cost is calculated by taking into account any discount or premium on acquisition and fees or costs that are an integral part of the effective interest method. The effective interest method amortization is included in interest expense in the consolidated income statements, see Note 18.
3.18.5 DerecognitionA financial liability is derecognized when the obligation under the liability is discharged or cancelled or expires. When an existing financial liability is replaced by another from the same lender on substantially different terms, or the terms of an existing liability are substantially modified, such an exchange or modification is treated as the derecognition of the original liability and the recognition of a new liability. The difference in the respective carrying amounts is recognized in the consolidated income statements.

FEMSA Annual Report 2015 6766 creating stories
3.19 ProvisionsProvisions are recognized when the Company has a present obligation (legal or constructive) as a result of a past event, it is probable that the Company will be required to settle the obligation, and a reliable estimate can be made of the amount of the obligation.
The amount recognized as a provision is the best estimate of the consideration required to settle the present obligation at the end of the reporting period, taking into account the risks and uncertainties surrounding the obligation. When a provision is measured using the cash flows estimated to settle the present obligation, its carrying amount is the present value of those cash flows (where the effect of the time value of money is material).
When some or all of the economic benefits required to settle a provision are expected to be recovered from a third party, a receivable is recognized as an asset if it is virtually certain that reimbursement will be received and the amount of the receivable can be measured reliably.
The Company recognizes a provision for a loss contingency when it is probable (i.e., the probability that the event will occur is greater than the probability that it will not) that certain effects related to past events, would materialize and can be reasonably quantified. These events and their financial impact are also disclosed as loss contingencies in the consolidated financial statements when the risk of loss is deemed to be other than remote. The Company does not recognize an asset for a gain contingency until the gain is realized, see Note 25.
Restructuring provisions are recognized only when the recognition criteria for provisions are fulfilled. The Company has a constructive obligation when a detailed formal plan identifies the business or part of the business concerned, the location and number of employees affected, a detailed estimate of the associated costs, and an appropriate timeline. Furthermore, the employees affected must have been notified of the plan’s main features.
3.20 Post-employment and other long-term employee benefitsPost-employment and other long-term employee benefits, which are considered to be monetary items, include obligations for pension and retirement plans, seniority premiums and postretirement medical services, are all based on actuarial calculations, using the projected unit credit method.
In Mexico, the economic benefits from employee benefits and retirement pensions are granted to employees with 10 years of service and minimum age of 60. In accordance with Mexican Labor Law, the Company provides seniority premium benefits to its employees under certain circumstances. These benefits consist of a one-time payment equivalent to 12 days wages for each year of service (at the employee’s most recent salary, but not to exceed twice the legal minimum wage), payable to all employees with 15 or more years of service, as well as to certain employees terminated involuntarily prior to the vesting of their seniority premium benefit. For qualifying employees, the Company also provides certain post-employment healthcare benefits such as the medical-surgical services, pharmaceuticals and hospital.
For defined benefit retirement plans and other long-term employee benefits, such as the Company’s sponsored pension and retirement plans, seniority premiums and postretirement medical service plans, the cost of providing benefits is determined using the projected unit credit method, with actuarial valuations being carried out at the end of each reporting period. All remeasurements of the Company’s defined benefit obligation such as actuarial gains and losses are recognized directly in other comprehensive income (“OCI”). The Company presents service costs within cost of goods sold, administrative and selling expenses in the consolidated income statements. The Company presents net interest cost within interest expense in the consolidated income statements. The projected benefit obligation recognized in the consolidated statement of financial position represents the present value of the defined benefit obligation as of the end of each reporting period. Certain subsidiaries of the Company have established plan assets for the payment of pension benefits, seniority premiums and postretirement medical services through irrevocable trusts of which the employees are named as beneficiaries, which serve to increase the funded status of such plans’ related obligations.
Costs related to compensated absences, such as vacations and vacation premiums, are recognized on an accrual basis. Cost for mandatory severance benefits are recorded as incurred.
The Company recognizes a liability and expense for termination benefits at the earlier of the following dates:
a) When it can no longer withdraw the offer of those benefits; or
b) When it recognizes costs for a restructuring that is within the scope of IAS 37 “Provisions, Contingent Liabilities and Contingent Assets,” and involves the payment of termination benefits.
The Company is demonstrably committed to a termination when, and only when, the entity has a detailed formal plan for the termination and is without realistic possibility of withdrawal.
A settlement occurs when an employer enters into a transaction that eliminates all further legal of constructive obligations for part or all of the benefits provided under a defined benefit plan. A curtailment arises from an isolated event such as closing of a plant, discontinuance of an operation or termination or suspension of a plan. Gains or losses on the settlement or curtailment of a defined benefit plan are recognized when the settlement or curtailment occurs.
During 2014, the Company settled its pension plan in Brazil and consequently recognized the corresponding effects of the settlement on the results of the current period, refer to Note 16.
3.21 Revenue recognitionSales of products are recognized as revenue upon delivery to the customer, and once all the following conditions are satisfied:
• The Company has transferred to the buyer the significant risks and rewards of ownership of the goods;
• The Company retains neither continuing managerial involvement to the degree usually associated with ownership nor effective control over the goods sold;
• The amount of revenue can be measured reliably;
• It is probable that the economic benefits associated with the transaction will flow to the Company; and
• The costs incurred or to be incurred in respect of the transaction can be measured reliably.
All of the above conditions are typically met at the point in time that goods are delivered to the customer at the customers’ facilities. Net sales reflect units delivered at list prices reduced by promotional allowances, discounts and the amortization of the agreements with customers to obtain the rights to sell and promote the Company’s products.
FEMSA Annual Report 2015 6766 creating stories
Rendering of services and otherRevenue arising from services of sales of waste material and packing of raw materials are recognized in the other operating revenues caption in the consolidated income statement.
The Company recognized these transactions as revenues in accordance with the requirements established in the IAS 18 “Revenue” for delivery of goods and rendering of services, which are:
a) The amount of revenue can be measured reliably;
b) It is probable that the economic benefits associated with the transaction will flow to the entity.
Interest incomeRevenue arising from the use by others of entity assets yielding interest is recognized once all the following conditions are satisfied:
• The amount of the revenue can be measured reliably; and
• It is probable that the economic benefits associated with the transaction will flow to the entity.
For all financial instruments measured at amortized cost and interest bearing financial assets classified as held to maturity, interest income is recorded using the effective interest rate (“EIR”), which is the rate that exactly discounts the estimated future cash or receipts through the expected life of the financial instrument or a shorter period, where appropriate, to the net carrying amount of the financial asset. The related interest income is included in the consolidated income statements.
3.22 Administrative and selling expensesAdministrative expenses include labor costs (salaries and other benefits, including employee profit sharing “PTU”) of employees not directly involved in the sale or production of the Company’s products, as well as professional service fees, the depreciation of office facilities, amortization of capitalized information technology system implementation costs and any other similar costs.
Selling expenses include:
• Distribution: labor costs (salaries and other related benefits), outbound freight costs, warehousing costs of finished products, write off of returnable bottles in the distribution process, depreciation and maintenance of trucks and other distribution facilities and equipment. For the years ended December 31, 2015, 2014 and 2013, these distribution costs amounted to Ps. 20,205, Ps. 19,236 and Ps. 17,971, respectively;
• Sales: labor costs (salaries and other benefits, including PTU) and sales commissions paid to sales personnel; and
• Marketing: promotional expenses and advertising costs.
PTU is paid by the Company’s Mexican subsidiaries to its eligible employees. In Mexico, employee profit sharing is computed at the rate of 10% of the individual company taxable income, except for considering cumulative dividends received from resident legal persons in Mexico, depreciation of historical rather tax restated values, foreign exchange gains and losses, which are not included until the asset is disposed of or the liability is due and other effects of inflation are also excluded. As of January 1, 2014, PTU in Mexico will be calculated from the same taxable income for income tax, except for the following: a) neither tax losses from prior years nor the PTU paid during the year are deductible; and b) payments exempt from taxes for the employees are fully deductible in the PTU computation.
3.23 Income taxesIncome tax expense represents the sum of the tax currently payable and deferred tax. Income taxes are charged to consolidated net income as they are incurred, except when they relate to items that are recognized in other comprehensive income or directly in equity, in which case, the current and deferred tax are also recognized in other comprehensive income or directly in equity, respectively.
3.23.1 Current income taxesIncome taxes are recorded in the results of the year they are incurred.
3.23.2 Deferred income taxesDeferred tax is recognized on temporary differences between the carrying amounts of assets and liabilities in the consolidated financial statements and the corresponding tax bases used in the computation of taxable profit. Deferred tax liabilities are generally recognized for all taxable temporary differences. Deferred tax assets are generally recognized for all deductible temporary differences to the extent that it is probable that taxable profits will be available against which those deductible temporary differences can be utilized and if any, future benefits from tax loss carry forwards and certain tax credits. Such deferred tax assets and liabilities are not recognized if the temporary difference arises from initial recognition of goodwill (no recognition of deferred tax liabilities) or from the initial recognition (other than in a business combination) of other assets and liabilities in a transaction that affects neither the taxable profit nor the accounting profit, except in the case of Brazil, where certain goodwill amounts are at times deductible for tax purposes.
Deferred tax assets are recognized for all deductible temporary differences, the carry forward of unused tax credits and any unused tax losses. Deferred tax assets are recognized to the extent that it is probable that taxable profit will be available against which the deductible temporary differences, and the carry forward of unused tax credits and unused tax losses can be utilized. The carrying amount of deferred tax assets is reviewed at each reporting date and reduced to the extent that it is no longer probable that sufficient taxable profit will be available to allow all or part of the deferred tax asset to be utilized. Unrecognized deferred tax assets are re-assessed at each reporting date and are recognized to the extent that it has become probable that future taxable profits will allow the deferred tax asset to be recovered.
Deferred tax liabilities are recognized for taxable temporary differences associated with investments in subsidiaries, associates, and interests in joint ventures, except where the Company is able to control the reversal of the temporary difference and it is probable that the temporary difference will not reverse in the foreseeable future. Deferred tax assets arising from deductible temporary differences associated with such investments and interests are only recognized to the extent that it is probable that there will be sufficient taxable profits against which to utilize the benefits of the temporary differences and they are expected to reverse in the foreseeable future.
Deferred income taxes are classified as a long-term asset or liability, regardless of when the temporary differences are expected to reverse.
The carrying amount of deferred tax assets is reviewed at the end of each reporting period and reduced to the extent that it is no longer probable that sufficient taxable profits will be available to allow all or part of the asset to be recovered.
Deferred tax relating to items recognized in the other comprehensive income are recognized in correlation to the underlying transaction in OCI.
FEMSA Annual Report 2015 6968 creating stories
Deferred tax assets and liabilities are measured at the tax rates that are expected to apply in the period in which the liability is settled or the asset realized, based on tax rates (and tax laws) that have been enacted or substantively enacted by the end of the reporting period. The measurement of deferred tax liabilities and assets reflects the tax consequences that would follow from the manner in which the Company expects, at the end of the reporting period, to recover or settle the carrying amount of its assets and liabilities.
In Mexico, the income tax rate is 30% for 2013, 2014 and 2015, and as result of Mexican Tax Reform for 2014, it will remain at 30% for the following years (see Note 24).
3.24 Share-based payments arrangementsSenior executives of the Company receive remuneration in the form of share-based payment transactions, whereby employees render services as consideration for equity instruments. The equity instruments are granted and then held by a trust controlled by the Company until vesting. They are accounted for as equity settled transactions. The award of equity instruments is a fixed monetary value on grant date.
Equity-settled share-based payments to employees are measured at the fair value of the equity instruments at the grant date. The fair value determined at the grant date of the equity-settled share-based payments is expensed and recognized based on the graded vesting method over the vesting period, based on the Company’s estimate of equity instruments that will eventually vest. At the end of each reporting period, the Company revises its estimate of the number of equity instruments expected to vest. The impact of the revision of the original estimates, if any, is recognized in consolidated net income such that the cumulative expense reflects the revised estimate.
3.25 Earnings per shareThe Company presents basic and diluted earnings per share (EPS) data for its shares. Basic EPS is calculated by dividing the net income attributable to controlling interest by the weighted average number of shares outstanding during the period adjusted for the weighted average of own shares purchased in the year. Diluted EPS is determined by adjusting the weighted average number of shares outstanding including the weighted average of own shares purchased in the year for the effects of all potentially dilutive securities, which comprise share rights granted to employees described above.
3.26 Issuance of subsidiary stockThe Company recognizes the issuance of a subsidiary’s stock as an equity transaction. The difference between the book value of the shares issued and the amount contributed by the non-controlling interest holder or third party is recorded as additional paid-in capital.
Note 4. Mergers and Acquisitions4.1 Mergers and acquisitionsThe Company has had certain mergers and acquisitions for the years 2015, 2014 and 2013; which were recorded using the acquisition method of accounting. The results of the acquired operations have been included in the consolidated financial statements since the date on which the Company obtained control of the business, as disclosed below. Therefore, the consolidated income statements and the consolidated statements of financial position in the years of such acquisitions are not comparable with previous periods. The consolidated statements of cash flows for the years ended December 31, 2015 and 2013 show the cash outflow for the merged and acquired operations net of the cash acquired related to those mergers and acquisitions. For the year ended December 31, 2014, the Company did not have any acquisitions or mergers.
While the acquired companies disclosed below, from Note 4.1.2 to Note 4.1.4, represent bottlers of Coca-Cola trademarked beverages, such entities were not under common ownership control prior to their acquisition.
4.1.1 Acquisition of Grupo SocofarOn September 30, 2015, FEMSA Comercio – Retail Division completed the acquisition of 60% of Grupo Socofar. Grupo Socofar is an operator of pharmacies in South America which operated, directly and through franchises, 643 pharmacies and 154 beauty supply stores in Chile, and over 150 pharmacies in Colombia. Grupo Socofar was acquired for Ps. 7,685 in an all cash transaction. Transaction related costs of Ps. 116 were expensed by FEMSA Comercio – Retail Division as incurred, and recorded as a component of administrative expenses in the accompanying consolidated income statements. Socofar was included in operating results from the closing in September 2015.
FEMSA Comercio – Retail Division is currently in the process of allocating to all assets acquired and liabilities assumed in the acquisition the consideration transferred as the sum of the acquisition-date fair values of the net assets acquired because it is conducting a detailed review process. FEMSA Comercio – Retail Division expects to finish the allocation during the following year but before the measurement period allowed by IFRS; preliminary estimate of fair value of Socofar´s net assets acquired is as follows.
2015
Total current assets (including cash acquired of Ps. 795) Ps. 10,499Total non-current assets 3,875Total assets 14,374Total liabilities (11,555)
Net assets acquired 2,819Goodwill 5,994Non-controlling interest (1) (1,128)
Total consideration transferred Ps. 7,685(1) Measured at the proportionate share of the acquiree’s identificable net assets.
FEMSA Comercio – Retail Division expects to recover the amount recorded as goodwill through synergies related to the implementation of successful practices from its existing Mexican operations such as speed and quality in execution of the customer’s value proposition and growth. Goodwill has been allocated to FEMSA Comercio’s Pharma & Beauty cash generating unit.
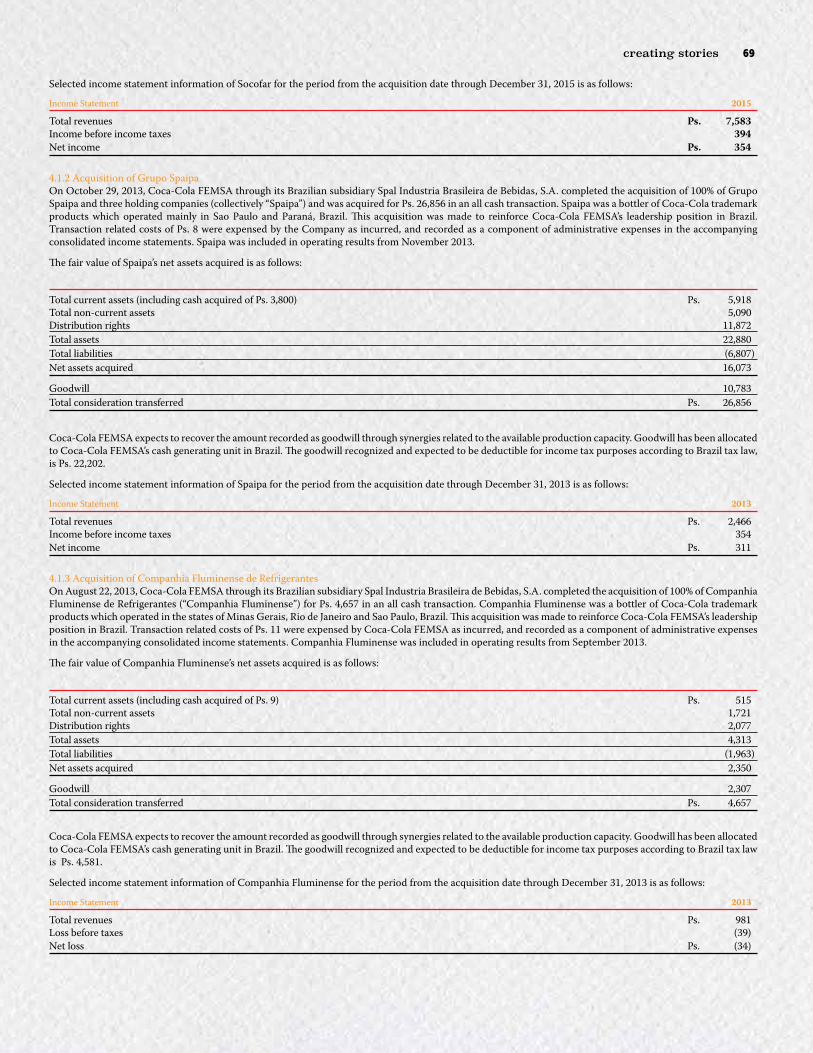
FEMSA Annual Report 2015 6968 creating stories
Selected income statement information of Socofar for the period from the acquisition date through December 31, 2015 is as follows:
Income Statement 2015
Total revenues Ps. 7,583Income before income taxes 394Net income Ps. 354
4.1.2 Acquisition of Grupo SpaipaOn October 29, 2013, Coca-Cola FEMSA through its Brazilian subsidiary Spal Industria Brasileira de Bebidas, S.A. completed the acquisition of 100% of Grupo Spaipa and three holding companies (collectively “Spaipa”) and was acquired for Ps. 26,856 in an all cash transaction. Spaipa was a bottler of Coca-Cola trademark products which operated mainly in Sao Paulo and Paraná, Brazil. This acquisition was made to reinforce Coca-Cola FEMSA’s leadership position in Brazil. Transaction related costs of Ps. 8 were expensed by the Company as incurred, and recorded as a component of administrative expenses in the accompanying consolidated income statements. Spaipa was included in operating results from November 2013.
The fair value of Spaipa’s net assets acquired is as follows:
Total current assets (including cash acquired of Ps. 3,800) Ps. 5,918Total non-current assets 5,090Distribution rights 11,872Total assets 22,880Total liabilities (6,807)Net assets acquired 16,073
Goodwill 10,783Total consideration transferred Ps. 26,856
Coca-Cola FEMSA expects to recover the amount recorded as goodwill through synergies related to the available production capacity. Goodwill has been allocated to Coca-Cola FEMSA’s cash generating unit in Brazil. The goodwill recognized and expected to be deductible for income tax purposes according to Brazil tax law, is Ps. 22,202.
Selected income statement information of Spaipa for the period from the acquisition date through December 31, 2013 is as follows:
Income Statement 2013
Total revenues Ps. 2,466Income before income taxes 354Net income Ps. 311
4.1.3 Acquisition of Companhia Fluminense de RefrigerantesOn August 22, 2013, Coca-Cola FEMSA through its Brazilian subsidiary Spal Industria Brasileira de Bebidas, S.A. completed the acquisition of 100% of Companhia Fluminense de Refrigerantes (“Companhia Fluminense”) for Ps. 4,657 in an all cash transaction. Companhia Fluminense was a bottler of Coca-Cola trademark products which operated in the states of Minas Gerais, Rio de Janeiro and Sao Paulo, Brazil. This acquisition was made to reinforce Coca-Cola FEMSA’s leadership position in Brazil. Transaction related costs of Ps. 11 were expensed by Coca-Cola FEMSA as incurred, and recorded as a component of administrative expenses in the accompanying consolidated income statements. Companhia Fluminense was included in operating results from September 2013.
The fair value of Companhia Fluminense’s net assets acquired is as follows:
Total current assets (including cash acquired of Ps. 9) Ps. 515Total non-current assets 1,721Distribution rights 2,077Total assets 4,313Total liabilities (1,963)Net assets acquired 2,350
Goodwill 2,307Total consideration transferred Ps. 4,657
Coca-Cola FEMSA expects to recover the amount recorded as goodwill through synergies related to the available production capacity. Goodwill has been allocated to Coca-Cola FEMSA’s cash generating unit in Brazil. The goodwill recognized and expected to be deductible for income tax purposes according to Brazil tax law is Ps. 4,581.
Selected income statement information of Companhia Fluminense for the period from the acquisition date through December 31, 2013 is as follows:
Income Statement 2013
Total revenues Ps. 981Loss before taxes (39)Net loss Ps. (34)
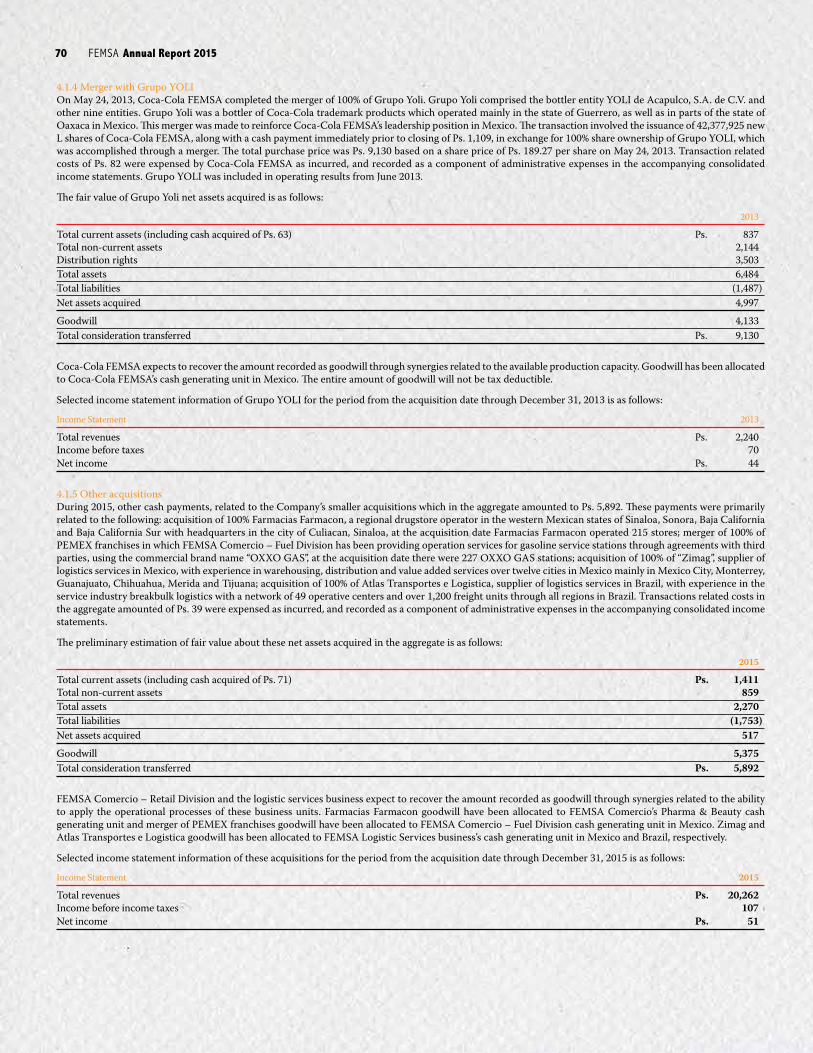
FEMSA Annual Report 2015 7170 creating stories
4.1.4 Merger with Grupo YOLIOn May 24, 2013, Coca-Cola FEMSA completed the merger of 100% of Grupo Yoli. Grupo Yoli comprised the bottler entity YOLI de Acapulco, S.A. de C.V. and other nine entities. Grupo Yoli was a bottler of Coca-Cola trademark products which operated mainly in the state of Guerrero, as well as in parts of the state of Oaxaca in Mexico. This merger was made to reinforce Coca-Cola FEMSA’s leadership position in Mexico. The transaction involved the issuance of 42,377,925 new L shares of Coca-Cola FEMSA, along with a cash payment immediately prior to closing of Ps. 1,109, in exchange for 100% share ownership of Grupo YOLI, which was accomplished through a merger. The total purchase price was Ps. 9,130 based on a share price of Ps. 189.27 per share on May 24, 2013. Transaction related costs of Ps. 82 were expensed by Coca-Cola FEMSA as incurred, and recorded as a component of administrative expenses in the accompanying consolidated income statements. Grupo YOLI was included in operating results from June 2013.
The fair value of Grupo Yoli net assets acquired is as follows:
2013
Total current assets (including cash acquired of Ps. 63) Ps. 837Total non-current assets 2,144Distribution rights 3,503Total assets 6,484Total liabilities (1,487)Net assets acquired 4,997
Goodwill 4,133Total consideration transferred Ps. 9,130
Coca-Cola FEMSA expects to recover the amount recorded as goodwill through synergies related to the available production capacity. Goodwill has been allocated to Coca-Cola FEMSA’s cash generating unit in Mexico. The entire amount of goodwill will not be tax deductible.
Selected income statement information of Grupo YOLI for the period from the acquisition date through December 31, 2013 is as follows:
Income Statement 2013
Total revenues Ps. 2,240Income before taxes 70Net income Ps. 44
4.1.5 Other acquisitionsDuring 2015, other cash payments, related to the Company’s smaller acquisitions which in the aggregate amounted to Ps. 5,892. These payments were primarily related to the following: acquisition of 100% Farmacias Farmacon, a regional drugstore operator in the western Mexican states of Sinaloa, Sonora, Baja California and Baja California Sur with headquarters in the city of Culiacan, Sinaloa, at the acquisition date Farmacias Farmacon operated 215 stores; merger of 100% of PEMEX franchises in which FEMSA Comercio – Fuel Division has been providing operation services for gasoline service stations through agreements with third parties, using the commercial brand name “OXXO GAS”, at the acquisition date there were 227 OXXO GAS stations; acquisition of 100% of “Zimag”, supplier of logistics services in Mexico, with experience in warehousing, distribution and value added services over twelve cities in Mexico mainly in Mexico City, Monterrey, Guanajuato, Chihuahua, Merida and Tijuana; acquisition of 100% of Atlas Transportes e Logistica, supplier of logistics services in Brazil, with experience in the service industry breakbulk logistics with a network of 49 operative centers and over 1,200 freight units through all regions in Brazil. Transactions related costs in the aggregate amounted of Ps. 39 were expensed as incurred, and recorded as a component of administrative expenses in the accompanying consolidated income statements.
The preliminary estimation of fair value about these net assets acquired in the aggregate is as follows:
2015
Total current assets (including cash acquired of Ps. 71) Ps. 1,411Total non-current assets 859Total assets 2,270Total liabilities (1,753)Net assets acquired 517
Goodwill 5,375Total consideration transferred Ps. 5,892
FEMSA Comercio – Retail Division and the logistic services business expect to recover the amount recorded as goodwill through synergies related to the ability to apply the operational processes of these business units. Farmacias Farmacon goodwill have been allocated to FEMSA Comercio’s Pharma & Beauty cash generating unit and merger of PEMEX franchises goodwill have been allocated to FEMSA Comercio – Fuel Division cash generating unit in Mexico. Zimag and Atlas Transportes e Logistica goodwill has been allocated to FEMSA Logistic Services business’s cash generating unit in Mexico and Brazil, respectively.
Selected income statement information of these acquisitions for the period from the acquisition date through December 31, 2015 is as follows:
Income Statement 2015
Total revenues Ps. 20,262Income before income taxes 107Net income Ps. 51
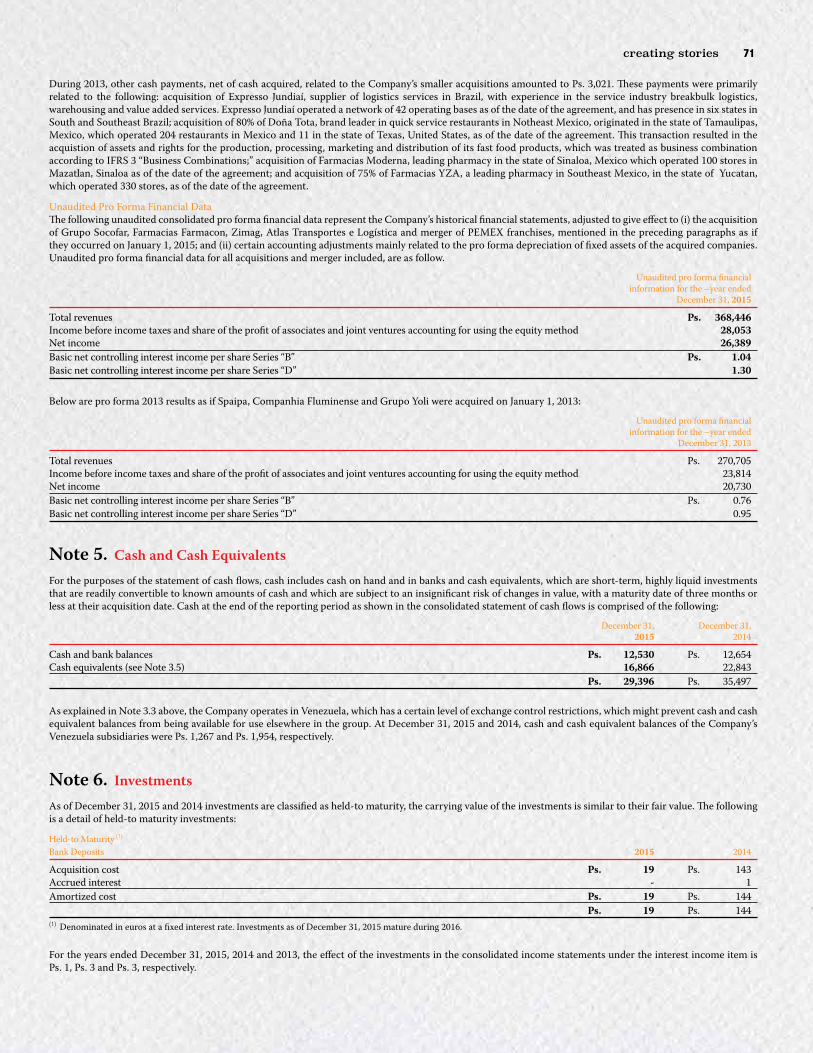
FEMSA Annual Report 2015 7170 creating stories
During 2013, other cash payments, net of cash acquired, related to the Company’s smaller acquisitions amounted to Ps. 3,021. These payments were primarily related to the following: acquisition of Expresso Jundiaí, supplier of logistics services in Brazil, with experience in the service industry breakbulk logistics, warehousing and value added services. Expresso Jundiaí operated a network of 42 operating bases as of the date of the agreement, and has presence in six states in South and Southeast Brazil; acquisition of 80% of Doña Tota, brand leader in quick service restaurants in Notheast Mexico, originated in the state of Tamaulipas, Mexico, which operated 204 restaurants in Mexico and 11 in the state of Texas, United States, as of the date of the agreement. This transaction resulted in the acquistion of assets and rights for the production, processing, marketing and distribution of its fast food products, which was treated as business combination according to IFRS 3 “Business Combinations;” acquisition of Farmacias Moderna, leading pharmacy in the state of Sinaloa, Mexico which operated 100 stores in Mazatlan, Sinaloa as of the date of the agreement; and acquisition of 75% of Farmacias YZA, a leading pharmacy in Southeast Mexico, in the state of Yucatan, which operated 330 stores, as of the date of the agreement.
Unaudited Pro Forma Financial DataThe following unaudited consolidated pro forma financial data represent the Company’s historical financial statements, adjusted to give effect to (i) the acquisition of Grupo Socofar, Farmacias Farmacon, Zimag, Atlas Transportes e Logística and merger of PEMEX franchises, mentioned in the preceding paragraphs as if they occurred on January 1, 2015; and (ii) certain accounting adjustments mainly related to the pro forma depreciation of fixed assets of the acquired companies. Unaudited pro forma financial data for all acquisitions and merger included, are as follow.
Unaudited pro forma financial information for the –year ended December 31, 2015
Total revenues Ps. 368,446Income before income taxes and share of the profit of associates and joint ventures accounting for using the equity method 28,053Net income 26,389Basic net controlling interest income per share Series “B” Ps. 1.04Basic net controlling interest income per share Series “D” 1.30
Below are pro forma 2013 results as if Spaipa, Companhia Fluminense and Grupo Yoli were acquired on January 1, 2013:
Unaudited pro forma financial information for the –year ended December 31, 2013
Total revenues Ps. 270,705Income before income taxes and share of the profit of associates and joint ventures accounting for using the equity method 23,814Net income 20,730Basic net controlling interest income per share Series “B” Ps. 0.76Basic net controlling interest income per share Series “D” 0.95
Note 5. Cash and Cash EquivalentsFor the purposes of the statement of cash flows, cash includes cash on hand and in banks and cash equivalents, which are short-term, highly liquid investments that are readily convertible to known amounts of cash and which are subject to an insignificant risk of changes in value, with a maturity date of three months or less at their acquisition date. Cash at the end of the reporting period as shown in the consolidated statement of cash flows is comprised of the following:
December 31, December 31, 2015 2014
Cash and bank balances Ps. 12,530 Ps. 12,654Cash equivalents (see Note 3.5) 16,866 22,843 Ps. 29,396 Ps. 35,497
As explained in Note 3.3 above, the Company operates in Venezuela, which has a certain level of exchange control restrictions, which might prevent cash and cash equivalent balances from being available for use elsewhere in the group. At December 31, 2015 and 2014, cash and cash equivalent balances of the Company’s Venezuela subsidiaries were Ps. 1,267 and Ps. 1,954, respectively.
Note 6. InvestmentsAs of December 31, 2015 and 2014 investments are classified as held-to maturity, the carrying value of the investments is similar to their fair value. The following is a detail of held-to maturity investments:
Held-to Maturity (1)
Bank Deposits 2015 2014
Acquisition cost Ps. 19 Ps. 143Accrued interest - 1Amortized cost Ps. 19 Ps. 144 Ps. 19 Ps. 144(1) Denominated in euros at a fixed interest rate. Investments as of December 31, 2015 mature during 2016.
For the years ended December 31, 2015, 2014 and 2013, the effect of the investments in the consolidated income statements under the interest income item is Ps. 1, Ps. 3 and Ps. 3, respectively.
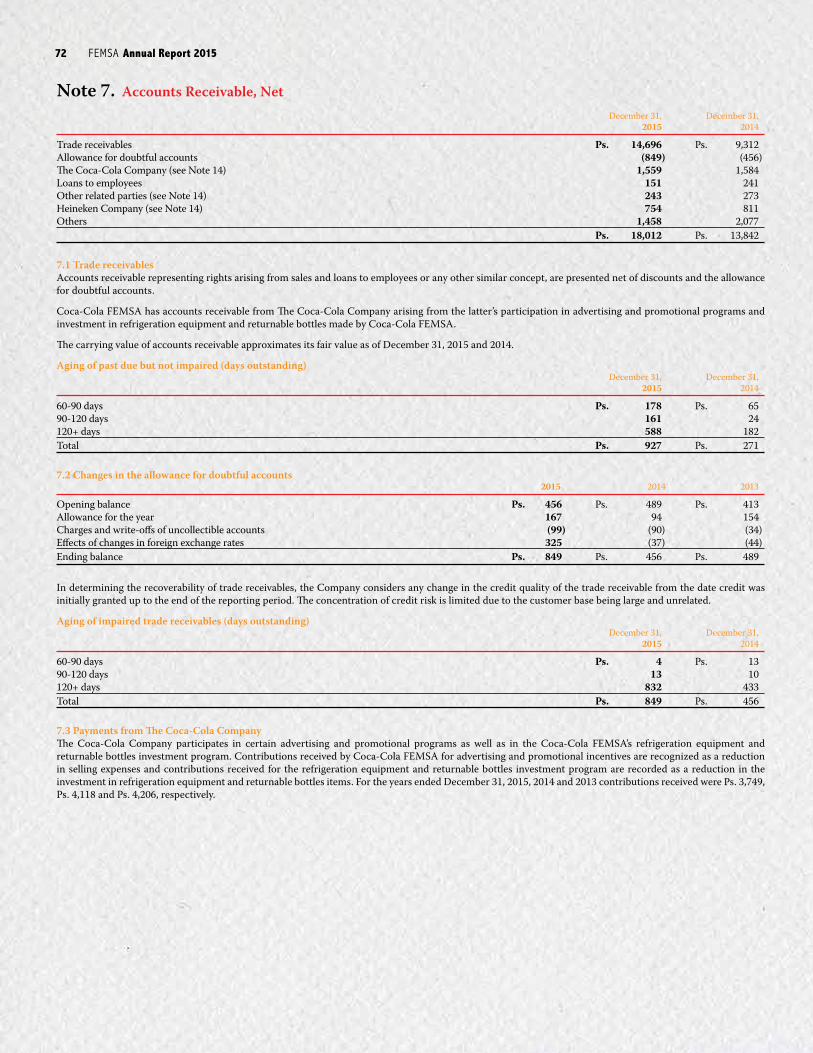
FEMSA Annual Report 2015 7372 creating stories
Note 7. Accounts Receivable, Net December 31, December 31, 2015 2014
Trade receivables Ps. 14,696 Ps. 9,312Allowance for doubtful accounts (849) (456)The Coca-Cola Company (see Note 14) 1,559 1,584Loans to employees 151 241Other related parties (see Note 14) 243 273Heineken Company (see Note 14) 754 811Others 1,458 2,077 Ps. 18,012 Ps. 13,842
7.1 Trade receivablesAccounts receivable representing rights arising from sales and loans to employees or any other similar concept, are presented net of discounts and the allowance for doubtful accounts.
Coca-Cola FEMSA has accounts receivable from The Coca-Cola Company arising from the latter’s participation in advertising and promotional programs and investment in refrigeration equipment and returnable bottles made by Coca-Cola FEMSA.
The carrying value of accounts receivable approximates its fair value as of December 31, 2015 and 2014.
Aging of past due but not impaired (days outstanding) December 31, December 31, 2015 2014
60-90 days Ps. 178 Ps. 6590-120 days 161 24120+ days 588 182Total Ps. 927 Ps. 271
7.2 Changes in the allowance for doubtful accounts 2015 2014 2013
Opening balance Ps. 456 Ps. 489 Ps. 413Allowance for the year 167 94 154Charges and write-offs of uncollectible accounts (99) (90) (34)Effects of changes in foreign exchange rates 325 (37) (44)Ending balance Ps. 849 Ps. 456 Ps. 489
In determining the recoverability of trade receivables, the Company considers any change in the credit quality of the trade receivable from the date credit was initially granted up to the end of the reporting period. The concentration of credit risk is limited due to the customer base being large and unrelated.
Aging of impaired trade receivables (days outstanding) December 31, December 31, 2015 2014
60-90 days Ps. 4 Ps. 1390-120 days 13 10120+ days 832 433Total Ps. 849 Ps. 456
7.3 Payments from The Coca-Cola CompanyThe Coca-Cola Company participates in certain advertising and promotional programs as well as in the Coca-Cola FEMSA’s refrigeration equipment and returnable bottles investment program. Contributions received by Coca-Cola FEMSA for advertising and promotional incentives are recognized as a reduction in selling expenses and contributions received for the refrigeration equipment and returnable bottles investment program are recorded as a reduction in the investment in refrigeration equipment and returnable bottles items. For the years ended December 31, 2015, 2014 and 2013 contributions received were Ps. 3,749, Ps. 4,118 and Ps. 4,206, respectively.

FEMSA Annual Report 2015 7372 creating stories
Note 8. Inventories December 31, December 31, 2015 2014
Finished products Ps. 17,631 Ps. 10,989Raw materials 3,629 3,493Spare parts 1,661 1,353Work in process 108 279Inventories in transit 1,534 929Other 117 171 Ps. 24,680 Ps. 17,214
For the years ended at 2015, 2014 and 2013, the Company recognized write-downs of its inventories for Ps. 1,290, Ps. 1,028 and Ps. 1,322 to net realizable value, respectively.
For the years ended at 2015, 2014 and 2013, changes in inventories are comprised as follows and included in the consolidated income statement under the cost of goods sold caption:
2015 2014 2013
Changes in inventories of finished goods and work in progress Ps. 132,835 Ps. 92,390 Ps. 76,163Raw materials and consumables used 53,514 55,038 49,740Total Ps. 186,349 Ps. 147,428 Ps. 125,903
Note 9. Other Current Assets and Other Current Financial Assets9.1 Other current assets December 31, December 31, 2015 2014
Prepaid expenses Ps. 3,363 Ps. 1,375Agreements with customers 168 161Short-term licenses 86 68Other 37 184 Ps. 3,654 Ps. 1,788
Prepaid expenses as of December 31, 2015 and 2014 are as follows:
December 31, December 31, 2015 2014
Advances for inventories Ps. 2,291 Ps. 380Advertising and promotional expenses paid in advance 58 156Advances to service suppliers 601 517Prepaid leases 115 80Prepaid insurance 58 29Others 240 213 Ps. 3,363 Ps. 1,375
Advertising and promotional expenses paid in advance recorded in the consolidated income statement for the years ended December 31, 2015, 2014 and 2013 amounted to Ps. 4,613, Ps. 4,460 and Ps. 6,232, respectively.
9.2 Other current financial assets December 31, December 31, 2015 2014
Restricted cash Ps. 704 Ps. 1,213Derivative financial instruments (see Note 20) 523 384Short term note receivable (1) 1,191 1,000 Ps. 2,418 Ps. 2,597(1) The carrying value approximates its fair value as of December 31, 2015 and 2014.
The Company has pledged part of its short-term deposits in order to fulfill the collateral requirements for the accounts payable in different currencies. As of December 31, 2015 and 2014, the fair value of the short-term deposit pledged were:
December 31, December 31, 2015 2014
Venezuelan bolivars Ps. 344 Ps. 550Brazilian reais 360 640Colombian pesos - 23 Ps. 704 Ps. 1,213
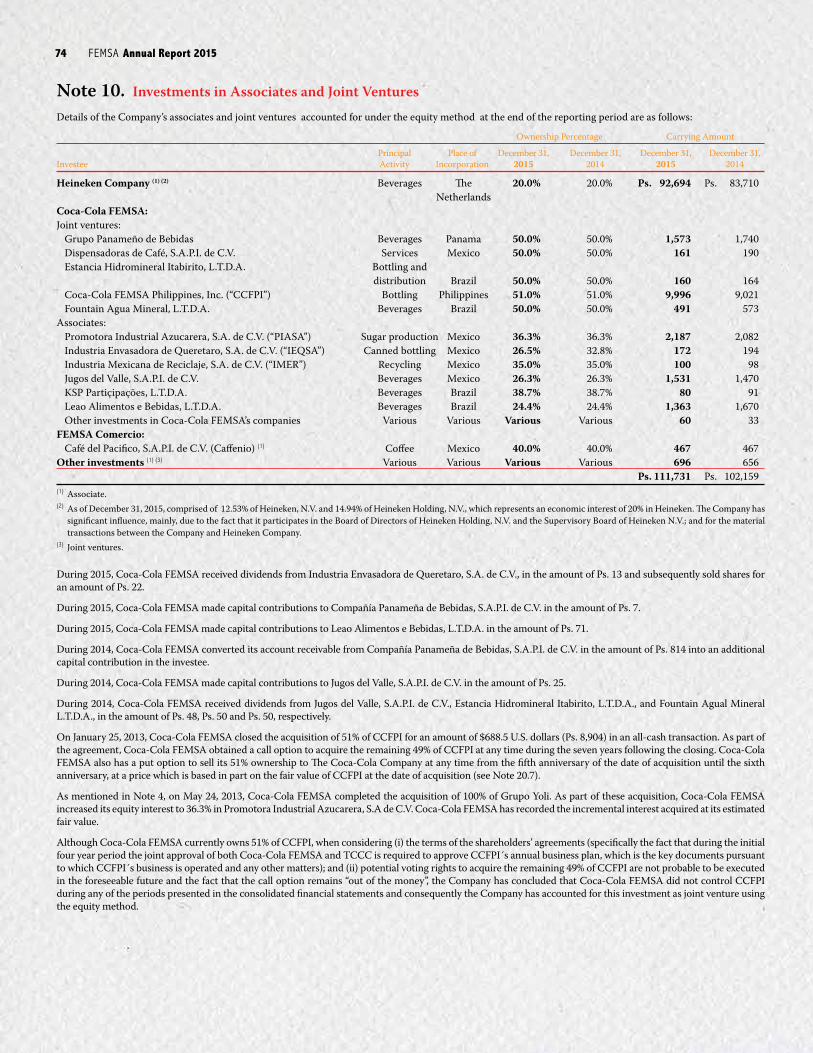
FEMSA Annual Report 2015 7574 creating stories
Note 10. Investments in Associates and Joint VenturesDetails of the Company’s associates and joint ventures accounted for under the equity method at the end of the reporting period are as follows:
Ownership Percentage Carrying Amount
Principal Place of December 31, December 31, December 31, December 31, Investee Activity Incorporation 2015 2014 2015 2014
Heineken Company (1) (2) Beverages The 20.0% 20.0% Ps. 92,694 Ps. 83,710 NetherlandsCoca-Cola FEMSA:Joint ventures:
Grupo Panameño de Bebidas Beverages Panama 50.0% 50.0% 1,573 1,740Dispensadoras de Café, S.A.P.I. de C.V. Services Mexico 50.0% 50.0% 161 190Estancia Hidromineral Itabirito, L.T.D.A. Bottling and distribution Brazil 50.0% 50.0% 160 164Coca-Cola FEMSA Philippines, Inc. (“CCFPI”) Bottling Philippines 51.0% 51.0% 9,996 9,021Fountain Agua Mineral, L.T.D.A. Beverages Brazil 50.0% 50.0% 491 573
Associates:Promotora Industrial Azucarera, S.A. de C.V. (“PIASA”) Sugar production Mexico 36.3% 36.3% 2,187 2,082Industria Envasadora de Queretaro, S.A. de C.V. (“IEQSA”) Canned bottling Mexico 26.5% 32.8% 172 194Industria Mexicana de Reciclaje, S.A. de C.V. (“IMER”) Recycling Mexico 35.0% 35.0% 100 98Jugos del Valle, S.A.P.I. de C.V. Beverages Mexico 26.3% 26.3% 1,531 1,470KSP Partiçipações, L.T.D.A. Beverages Brazil 38.7% 38.7% 80 91Leao Alimentos e Bebidas, L.T.D.A. Beverages Brazil 24.4% 24.4% 1,363 1,670Other investments in Coca-Cola FEMSA’s companies Various Various Various Various 60 33
FEMSA Comercio:Café del Pacifico, S.A.P.I. de C.V. (Caffenio) (1) Coffee Mexico 40.0% 40.0% 467 467
Other investments (1) (3) Various Various Various Various 696 656 Ps. 111,731 Ps. 102,159(1) Associate.(2) As of December 31, 2015, comprised of 12.53% of Heineken, N.V. and 14.94% of Heineken Holding, N.V., which represents an economic interest of 20% in Heineken. The Company has
significant influence, mainly, due to the fact that it participates in the Board of Directors of Heineken Holding, N.V. and the Supervisory Board of Heineken N.V.; and for the material transactions between the Company and Heineken Company.
(3) Joint ventures.
During 2015, Coca-Cola FEMSA received dividends from Industria Envasadora de Queretaro, S.A. de C.V., in the amount of Ps. 13 and subsequently sold shares for an amount of Ps. 22.
During 2015, Coca-Cola FEMSA made capital contributions to Compañía Panameña de Bebidas, S.A.P.I. de C.V. in the amount of Ps. 7.
During 2015, Coca-Cola FEMSA made capital contributions to Leao Alimentos e Bebidas, L.T.D.A. in the amount of Ps. 71.
During 2014, Coca-Cola FEMSA converted its account receivable from Compañía Panameña de Bebidas, S.A.P.I. de C.V. in the amount of Ps. 814 into an additional capital contribution in the investee.
During 2014, Coca-Cola FEMSA made capital contributions to Jugos del Valle, S.A.P.I. de C.V. in the amount of Ps. 25.
During 2014, Coca-Cola FEMSA received dividends from Jugos del Valle, S.A.P.I. de C.V., Estancia Hidromineral Itabirito, L.T.D.A., and Fountain Agual Mineral L.T.D.A., in the amount of Ps. 48, Ps. 50 and Ps. 50, respectively.
On January 25, 2013, Coca-Cola FEMSA closed the acquisition of 51% of CCFPI for an amount of $688.5 U.S. dollars (Ps. 8,904) in an all-cash transaction. As part of the agreement, Coca-Cola FEMSA obtained a call option to acquire the remaining 49% of CCFPI at any time during the seven years following the closing. Coca-Cola FEMSA also has a put option to sell its 51% ownership to The Coca-Cola Company at any time from the fifth anniversary of the date of acquisition until the sixth anniversary, at a price which is based in part on the fair value of CCFPI at the date of acquisition (see Note 20.7).
As mentioned in Note 4, on May 24, 2013, Coca-Cola FEMSA completed the acquisition of 100% of Grupo Yoli. As part of these acquisition, Coca-Cola FEMSA increased its equity interest to 36.3% in Promotora Industrial Azucarera, S.A de C.V. Coca-Cola FEMSA has recorded the incremental interest acquired at its estimated fair value.
Although Coca-Cola FEMSA currently owns 51% of CCFPI, when considering (i) the terms of the shareholders’ agreements (specifically the fact that during the initial four year period the joint approval of both Coca-Cola FEMSA and TCCC is required to approve CCFPI´s annual business plan, which is the key documents pursuant to which CCFPI´s business is operated and any other matters); and (ii) potential voting rights to acquire the remaining 49% of CCFPI are not probable to be executed in the foreseeable future and the fact that the call option remains “out of the money”, the Company has concluded that Coca-Cola FEMSA did not control CCFPI during any of the periods presented in the consolidated financial statements and consequently the Company has accounted for this investment as joint venture using the equity method.
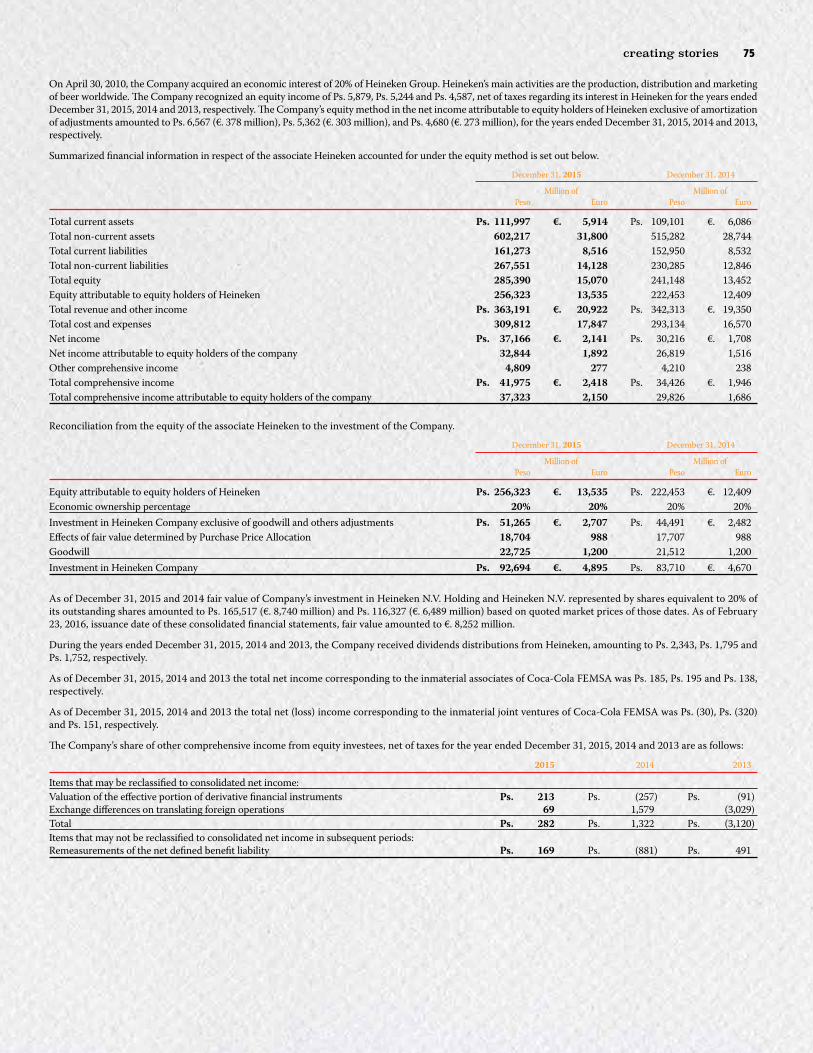
FEMSA Annual Report 2015 7574 creating stories
On April 30, 2010, the Company acquired an economic interest of 20% of Heineken Group. Heineken’s main activities are the production, distribution and marketing of beer worldwide. The Company recognized an equity income of Ps. 5,879, Ps. 5,244 and Ps. 4,587, net of taxes regarding its interest in Heineken for the years ended December 31, 2015, 2014 and 2013, respectively. The Company’s equity method in the net income attributable to equity holders of Heineken exclusive of amortization of adjustments amounted to Ps. 6,567 (€. 378 million), Ps. 5,362 (€. 303 million), and Ps. 4,680 (€. 273 million), for the years ended December 31, 2015, 2014 and 2013, respectively.
Summarized financial information in respect of the associate Heineken accounted for under the equity method is set out below.
December 31, 2015 December 31, 2014
Million of Million of Peso Euro Peso Euro
Total current assets Ps. 111,997 €. 5,914 Ps. 109,101 €. 6,086Total non-current assets 602,217 31,800 515,282 28,744Total current liabilities 161,273 8,516 152,950 8,532Total non-current liabilities 267,551 14,128 230,285 12,846Total equity 285,390 15,070 241,148 13,452Equity attributable to equity holders of Heineken 256,323 13,535 222,453 12,409Total revenue and other income Ps. 363,191 €. 20,922 Ps. 342,313 €. 19,350Total cost and expenses 309,812 17,847 293,134 16,570Net income Ps. 37,166 €. 2,141 Ps. 30,216 €. 1,708Net income attributable to equity holders of the company 32,844 1,892 26,819 1,516Other comprehensive income 4,809 277 4,210 238Total comprehensive income Ps. 41,975 €. 2,418 Ps. 34,426 €. 1,946Total comprehensive income attributable to equity holders of the company 37,323 2,150 29,826 1,686
Reconciliation from the equity of the associate Heineken to the investment of the Company.
December 31, 2015 December 31, 2014
Million of Million of Peso Euro Peso Euro
Equity attributable to equity holders of Heineken Ps. 256,323 €. 13,535 Ps. 222,453 €. 12,409Economic ownership percentage 20% 20% 20% 20%Investment in Heineken Company exclusive of goodwill and others adjustments Ps. 51,265 €. 2,707 Ps. 44,491 €. 2,482Effects of fair value determined by Purchase Price Allocation 18,704 988 17,707 988Goodwill 22,725 1,200 21,512 1,200Investment in Heineken Company Ps. 92,694 €. 4,895 Ps. 83,710 €. 4,670
As of December 31, 2015 and 2014 fair value of Company’s investment in Heineken N.V. Holding and Heineken N.V. represented by shares equivalent to 20% of its outstanding shares amounted to Ps. 165,517 (€. 8,740 million) and Ps. 116,327 (€. 6,489 million) based on quoted market prices of those dates. As of February 23, 2016, issuance date of these consolidated financial statements, fair value amounted to €. 8,252 million.
During the years ended December 31, 2015, 2014 and 2013, the Company received dividends distributions from Heineken, amounting to Ps. 2,343, Ps. 1,795 and Ps. 1,752, respectively.
As of December 31, 2015, 2014 and 2013 the total net income corresponding to the inmaterial associates of Coca-Cola FEMSA was Ps. 185, Ps. 195 and Ps. 138, respectively.
As of December 31, 2015, 2014 and 2013 the total net (loss) income corresponding to the inmaterial joint ventures of Coca-Cola FEMSA was Ps. (30), Ps. (320) and Ps. 151, respectively.
The Company’s share of other comprehensive income from equity investees, net of taxes for the year ended December 31, 2015, 2014 and 2013 are as follows:
2015 2014 2013
Items that may be reclassified to consolidated net income:Valuation of the effective portion of derivative financial instruments Ps. 213 Ps. (257) Ps. (91)Exchange differences on translating foreign operations 69 1,579 (3,029)Total Ps. 282 Ps. 1,322 Ps. (3,120)Items that may not be reclassified to consolidated net income in subsequent periods:Remeasurements of the net defined benefit liability Ps. 169 Ps. (881) Ps. 491

FEMSA Annual Report 2015 7776 creating stories
Note 11. Property, Plant and Equipment, Net Investments Machinery in Fixed and Refrigeration Returnable Assets in Leasehold Cost Land Buildings Equipment Equipment Bottles Progress Improvements Other Total
Cost as of January 1, 2013 Ps. 5,769 Ps. 14,377 Ps. 45,082 Ps. 11,991 Ps. 5,814 Ps. 5,357 Ps. 9,618 Ps. 754 Ps. 98,762Additions 433 167 4,648 1,107 1,435 8,238 11 341 16,380Additions from business combinations 536 2,278 2,814 428 96 614 36 264 7,066Transfer of completed projects in progress 389 1,158 992 1,144 785 (6,296) 1,828 - -Transfer to/(from) assets classified as held for sale - - (216) - - - - - (216)Disposals (11) (291) (2,049) (749) (324) (748) (697) (15) (4,884)Effects of changes in foreign exchange rates (250) (1,336) (3,678) (1,135) (466) (291) (103) (55) (7,314)Changes in value on the recognition of inflation effects 228 1,191 2,252 603 46 165 - 277 4,762Capitalization of borrowing costs - - 32 - - - - - 32Cost as of December 31, 2013 Ps. 7,094 Ps. 17,544 Ps. 49,877 Ps. 13,389 Ps. 7,386 Ps. 7,039 Ps. 10,693 Ps. 1,566 Ps. 114,588
Cost as of January 1, 2014 Ps. 7,094 Ps. 17,544 Ps. 49,877 Ps. 13,389 Ps. 7,386 Ps. 7,039 Ps. 10,693 Ps. 1,566 Ps. 114,588Additions 803 54 4,156 32 398 11,209 99 234 16,985Changes in fair value of past acquisitions (115) (610) 891 (57) - (68) 99 (253) (113)Transfer of completed projects in progress - 1,717 2,823 1,523 1,994 (10,050) 1,990 3 -Transfer to/(from) assets classified as held for sale - - (134) - - - - - (134)Disposals (17) (144) (2,243) (632) (60) (5) (587) (79) (3,767)Effects of changes in foreign exchange rates (664) (3,125) (5,415) (1,975) (323) (545) (44) (506) (12,597)Changes in value on the recognition of inflation effects 110 355 531 186 7 29 - 110 1,328Capitalization of borrowing costs - - 33 - - 263 - - 296Cost as of December 31, 2014 Ps. 7,211 Ps. 15,791 Ps. 50,519 Ps. 12,466 Ps. 9,402 Ps. 7,872 Ps. 12,250 Ps. 1,075 Ps. 116,586
Cost as of January 1, 2015 Ps. 7,211 Ps. 15,791 Ps. 50,519 Ps. 12,466 Ps. 9,402 Ps. 7,872 Ps. 12,250 Ps. 1,075 Ps. 116,586Additions 675 1,688 5,122 851 1,655 6,942 41 511 17,485Additions from business acquisitions 30 251 870 - - - 862 - 2,013Transfer of completed projects in progress 59 1,289 3,251 1,168 662 (8,143) 1,714 - -Transfer to/(from) assets classified as held for sale - - (10) - - - - - (10)Disposals (56) (219) (2,694) (972) (103) - (356) (40) (4,440)Effects of changes in foreign exchange rates (595) (1,352) (4,330) (1,216) (266) (1,004) (23) (848) (9,634)Changes in value on the recognition of inflation effects 245 503 957 295 301 91 - 229 2,621Capitalization of borrowing costs - - - - - 57 - - 57Cost as of December 31, 2015 Ps. 7,569 Ps. 17,951 Ps. 53,685 Ps. 12,592 Ps. 11,651 Ps. 5,815 Ps. 14,488 Ps. 927 Ps. 124,678
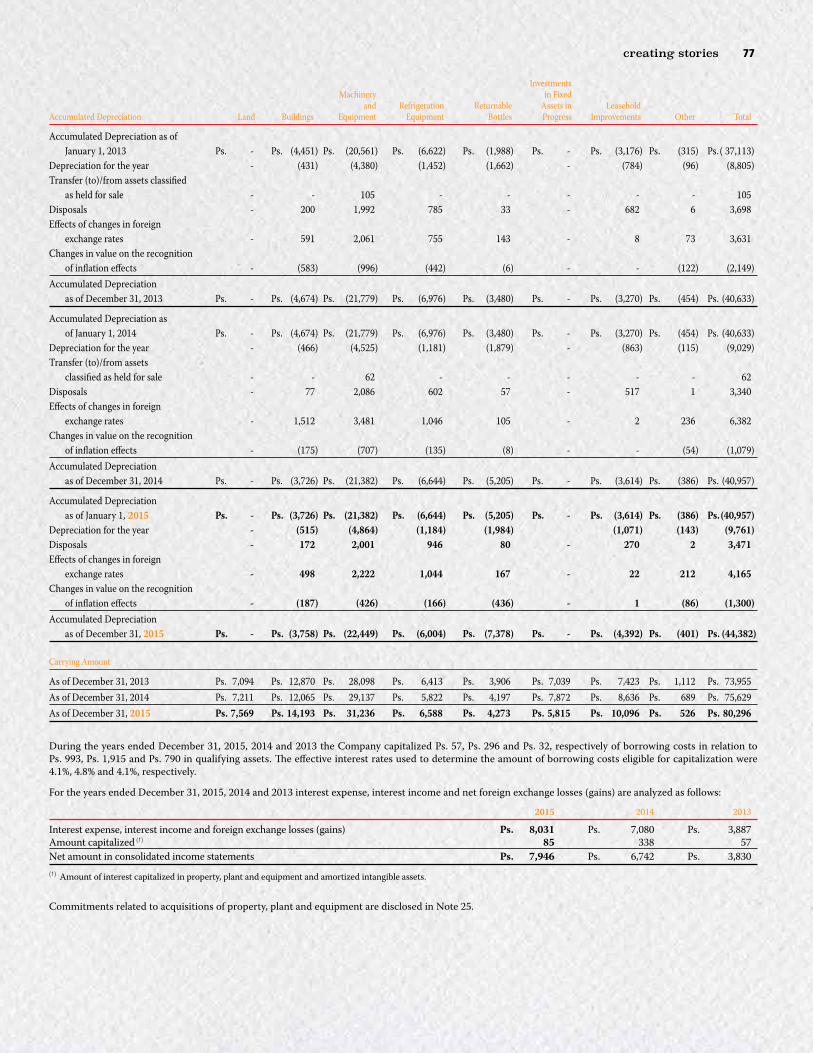
FEMSA Annual Report 2015 7776 creating stories
Investments Machinery in Fixed and Refrigeration Returnable Assets in Leasehold Accumulated Depreciation Land Buildings Equipment Equipment Bottles Progress Improvements Other Total
Accumulated Depreciation as of January 1, 2013 Ps. - Ps. (4,451) Ps. (20,561) Ps. (6,622) Ps. (1,988) Ps. - Ps. (3,176) Ps. (315) Ps. ( 37,113)Depreciation for the year - (431) (4,380) (1,452) (1,662) - (784) (96) (8,805)Transfer (to)/from assets classified as held for sale - - 105 - - - - - 105Disposals - 200 1,992 785 33 - 682 6 3,698Effects of changes in foreign exchange rates - 591 2,061 755 143 - 8 73 3,631Changes in value on the recognition of inflation effects - (583) (996) (442) (6) - - (122) (2,149)Accumulated Depreciation as of December 31, 2013 Ps. - Ps. (4,674) Ps. (21,779) Ps. (6,976) Ps. (3,480) Ps. - Ps. (3,270) Ps. (454) Ps. (40,633)
Accumulated Depreciation as of January 1, 2014 Ps. - Ps. (4,674) Ps. (21,779) Ps. (6,976) Ps. (3,480) Ps. - Ps. (3,270) Ps. (454) Ps. (40,633)Depreciation for the year - (466) (4,525) (1,181) (1,879) - (863) (115) (9,029)Transfer (to)/from assets classified as held for sale - - 62 - - - - - 62Disposals - 77 2,086 602 57 - 517 1 3,340Effects of changes in foreign exchange rates - 1,512 3,481 1,046 105 - 2 236 6,382Changes in value on the recognition of inflation effects - (175) (707) (135) (8) - - (54) (1,079)Accumulated Depreciation as of December 31, 2014 Ps. - Ps. (3,726) Ps. (21,382) Ps. (6,644) Ps. (5,205) Ps. - Ps. (3,614) Ps. (386) Ps. (40,957)
Accumulated Depreciation as of January 1, 2015 Ps. - Ps. (3,726) Ps. (21,382) Ps. (6,644) Ps. (5,205) Ps. - Ps. (3,614) Ps. (386) Ps. (40,957)Depreciation for the year - (515) (4,864) (1,184) (1,984) (1,071) (143) (9,761)Disposals - 172 2,001 946 80 - 270 2 3,471Effects of changes in foreign exchange rates - 498 2,222 1,044 167 - 22 212 4,165Changes in value on the recognition of inflation effects - (187) (426) (166) (436) - 1 (86) (1,300)Accumulated Depreciation as of December 31, 2015 Ps. - Ps. (3,758) Ps. (22,449) Ps. (6,004) Ps. (7,378) Ps. - Ps. (4,392) Ps. (401) Ps. (44,382) Carrying Amount
As of December 31, 2013 Ps. 7,094 Ps. 12,870 Ps. 28,098 Ps. 6,413 Ps. 3,906 Ps. 7,039 Ps. 7,423 Ps. 1,112 Ps. 73,955As of December 31, 2014 Ps. 7,211 Ps. 12,065 Ps. 29,137 Ps. 5,822 Ps. 4,197 Ps. 7,872 Ps. 8,636 Ps. 689 Ps. 75,629As of December 31, 2015 Ps. 7,569 Ps. 14,193 Ps. 31,236 Ps. 6,588 Ps. 4,273 Ps. 5,815 Ps. 10,096 Ps. 526 Ps. 80,296
During the years ended December 31, 2015, 2014 and 2013 the Company capitalized Ps. 57, Ps. 296 and Ps. 32, respectively of borrowing costs in relation to Ps. 993, Ps. 1,915 and Ps. 790 in qualifying assets. The effective interest rates used to determine the amount of borrowing costs eligible for capitalization were 4.1%, 4.8% and 4.1%, respectively.
For the years ended December 31, 2015, 2014 and 2013 interest expense, interest income and net foreign exchange losses (gains) are analyzed as follows:
2015 2014 2013
Interest expense, interest income and foreign exchange losses (gains) Ps. 8,031 Ps. 7,080 Ps. 3,887Amount capitalized (1) 85 338 57Net amount in consolidated income statements Ps. 7,946 Ps. 6,742 Ps. 3,830(1) Amount of interest capitalized in property, plant and equipment and amortized intangible assets.
Commitments related to acquisitions of property, plant and equipment are disclosed in Note 25.

FEMSA Annual Report 2015 7978 creating stories
Note 12. Intangible Assets Rights to Produce and Other Distribute Indefinite Total Technology Total Coca-Cola Lived Unamortized Costs and Amortized Total Trademark Intangible Intangible Management Systems in Alcohol Intangible Intangible Cost Products Goodwill Assets Assets Systems Development Licenses Other Assets Assets
Cost as of January 1, 2013 Ps. 57,270 Ps. 6,972 Ps. 339 Ps. 64,581 Ps. 2,863 Ps. 1,019 Ps. 726 Ps. 384 Ps. 4,992 Ps. 69,573Purchases - - - - 164 644 179 123 1,110 1,110Acquisition from business combinations 19,868 14,692 1,621 36,181 70 - - 196 266 36,447Transfer of completed development systems - - - - 172 (172) - - - -Disposals - - (163) (163) - - (46) - (46) (209)Effect of movements in exchange rates (1,828) (356) (10) (2,194) (75) - - (13) (88) (2,282)Changes in value on the recognition of inflation effects 417 - - 417 - 113 - - 113 530Capitalization of borrowing costs - - - - 25 - - - 25 25Cost as of December 31, 2013 Ps. 75,727 Ps. 21,308 Ps. 1,787 Ps. 98,822 Ps. 3,219 Ps. 1,604 Ps. 859 Ps. 690 Ps. 6,372 Ps. 105,194
Cost as of January 1, 2014 Ps. 75,727 Ps. 21,308 Ps. 1,787 Ps. 98,822 Ps. 3,219 Ps. 1,604 Ps. 859 Ps. 690 Ps. 6,372 Ps. 105,194Purchases - - 13 13 227 229 168 44 668 681Change in fair value of past acquisitions (2,416) 4,117 (205) 1,496 - - - (17) (17) 1,479Transfer of completed development systems - - - - 278 (278) - - - -Disposals - - (8) (8) (387) - - (33) (420) (428)Effect of movements in exchange rates (5,343) (251) (10) (5,604) (152) (1) - (13) (166) (5,770)Changes in value on the recognition of inflation effects 2,295 - - 2,295 (2) - - - (2) 2,293Capitalization of borrowing costs - - - - 42 - - - 42 42Cost as of December 31, 2014 Ps. 70,263 Ps. 25,174 Ps. 1,577 Ps. 97,014 Ps. 3,225 Ps. 1,554 Ps. 1,027 Ps. 671 Ps. 6,477 Ps. 103,491
Cost as of January 1, 2015 Ps. 70,263 Ps. 25,174 Ps. 1,577 Ps. 97,014 Ps. 3,225 Ps. 1,554 Ps. 1,027 Ps. 671 Ps. 6,477 Ps. 103,491Purchases - - - - 480 458 198 83 1,219 1,219Acquisitions from business combinations - 11,369 1,238 12,607 328 - - 199 527 13,134Transfer of completed development systems - - - - 1,085 (1,085) - - - -Disposals - - - - (150) (242) - (77) (469) (469)Effect of movements in exchange rates (4,992) (2,693) (52) (7,737) (94) (2) - (16) (112) (7,849)Changes in value on the recognition of inflation effects 1,121 - - 1,121 (12) - - - (12) 1,109Capitalization of borrowing costs - - - - 28 - - 28 28Cost as of December 31, 2015 Ps. 66,392 Ps. 33,850 Ps. 2,763 Ps. 103,005 Ps. 4,890 Ps. 683 Ps. 1,225 Ps. 860 Ps. 7,658 Ps. 110,663
Amortization and Impairment Losses
Amortization as of January 1, 2013 Ps. - Ps. - Ps. (103) Ps. (103) Ps. (1,228) Ps. - Ps. (150) Ps. (199) Ps. (1,577) Ps. (1,680)Amortization expense - - - - (271) - (73) (72) (416) (416)Disposals - - 103 103 2 - 46 - 48 151Effect of movements in exchange rates - - - - 35 - - 9 44 44Amortization as of December 31, 2013 Ps. - Ps. - Ps. - Ps. - Ps. (1,462) Ps. - Ps. (177) Ps. (262) Ps. (1,901) Ps. (1,901)
Amortization as of January 1, 2014 Ps. - Ps. - Ps. - Ps. - Ps. (1,462) Ps. - Ps. (177) Ps. (262) Ps. (1,901) Ps. (1,901)Amortization expense - - - - (268) - (58) (97) (423) (423)Impairment losses - - (36) (36) - - - - - (36)Disposals - - - - 387 - - - 387 387Effect of movements in exchange rates - - - - - - - 9 9 9Amortization as of December 31, 2014 Ps. - Ps. - Ps. (36) Ps. (36) Ps. (1,343) Ps. - Ps. (235) Ps. (350) Ps. (1,928) Ps. (1,964)
Amortization as of January 1, 2015 Ps. - Ps. - Ps. (36) Ps. (36) Ps. (1,343) Ps. - Ps. (235) Ps. (350) Ps. (1,928) Ps. (1,964)Amortization expense - - - - (461) - (67) (76) (604) (604)Disposals - - - - 126 - - 42 168 168Effect of movements in exchange rates - - - - 59 - - 19 78 78Amortization as of December 31, 2015 Ps. - Ps. - Ps. (36) Ps. (36) Ps. (1,619) Ps. - Ps. (302) Ps. (365) Ps. (2,286) Ps. (2,322)
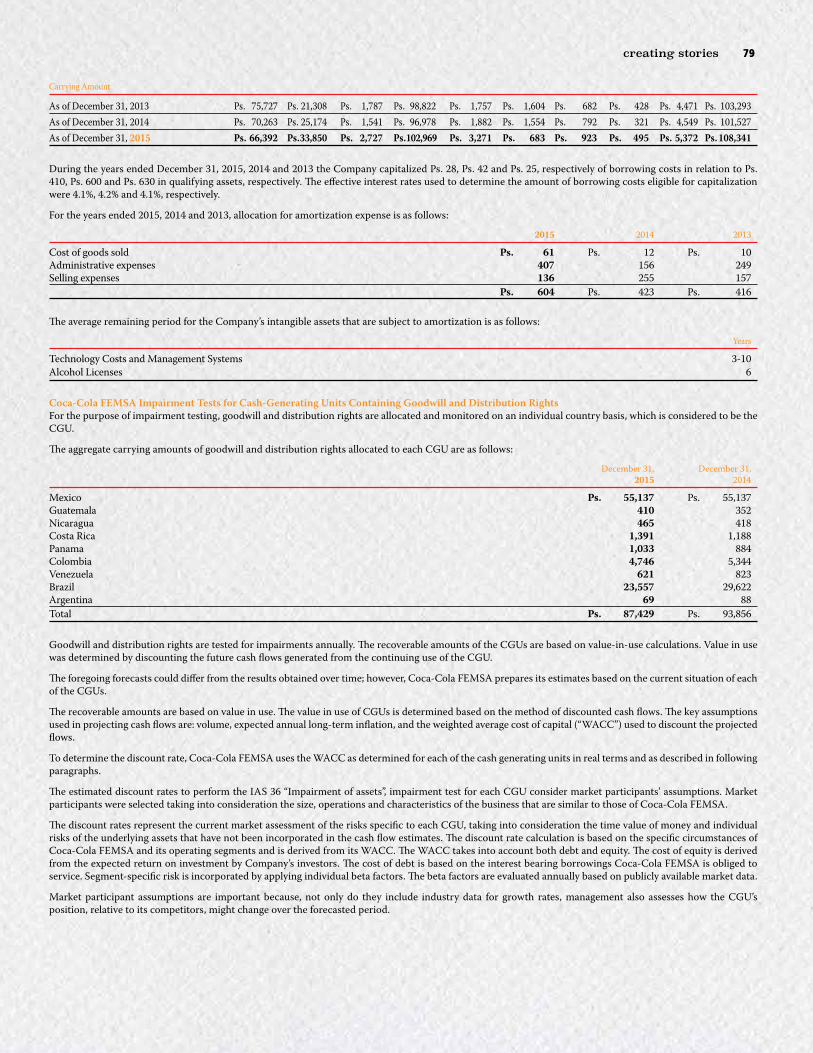
FEMSA Annual Report 2015 7978 creating stories
Carrying Amount
As of December 31, 2013 Ps. 75,727 Ps. 21,308 Ps. 1,787 Ps. 98,822 Ps. 1,757 Ps. 1,604 Ps. 682 Ps. 428 Ps. 4,471 Ps. 103,293As of December 31, 2014 Ps. 70,263 Ps. 25,174 Ps. 1,541 Ps. 96,978 Ps. 1,882 Ps. 1,554 Ps. 792 Ps. 321 Ps. 4,549 Ps. 101,527As of December 31, 2015 Ps. 66,392 Ps. 33,850 Ps. 2,727 Ps. 102,969 Ps. 3,271 Ps. 683 Ps. 923 Ps. 495 Ps. 5,372 Ps. 108,341
During the years ended December 31, 2015, 2014 and 2013 the Company capitalized Ps. 28, Ps. 42 and Ps. 25, respectively of borrowing costs in relation to Ps. 410, Ps. 600 and Ps. 630 in qualifying assets, respectively. The effective interest rates used to determine the amount of borrowing costs eligible for capitalization were 4.1%, 4.2% and 4.1%, respectively.
For the years ended 2015, 2014 and 2013, allocation for amortization expense is as follows:
2015 2014 2013
Cost of goods sold Ps. 61 Ps. 12 Ps. 10Administrative expenses 407 156 249Selling expenses 136 255 157 Ps. 604 Ps. 423 Ps. 416
The average remaining period for the Company’s intangible assets that are subject to amortization is as follows:
Years
Technology Costs and Management Systems 3-10Alcohol Licenses 6
Coca-Cola FEMSA Impairment Tests for Cash-Generating Units Containing Goodwill and Distribution RightsFor the purpose of impairment testing, goodwill and distribution rights are allocated and monitored on an individual country basis, which is considered to be the CGU.
The aggregate carrying amounts of goodwill and distribution rights allocated to each CGU are as follows:
December 31, December 31, 2015 2014
Mexico Ps. 55,137 Ps. 55,137Guatemala 410 352Nicaragua 465 418Costa Rica 1,391 1,188Panama 1,033 884Colombia 4,746 5,344Venezuela 621 823Brazil 23,557 29,622Argentina 69 88Total Ps. 87,429 Ps. 93,856
Goodwill and distribution rights are tested for impairments annually. The recoverable amounts of the CGUs are based on value-in-use calculations. Value in use was determined by discounting the future cash flows generated from the continuing use of the CGU.
The foregoing forecasts could differ from the results obtained over time; however, Coca-Cola FEMSA prepares its estimates based on the current situation of each of the CGUs.
The recoverable amounts are based on value in use. The value in use of CGUs is determined based on the method of discounted cash flows. The key assumptions used in projecting cash flows are: volume, expected annual long-term inflation, and the weighted average cost of capital (“WACC”) used to discount the projected flows.
To determine the discount rate, Coca-Cola FEMSA uses the WACC as determined for each of the cash generating units in real terms and as described in following paragraphs.
The estimated discount rates to perform the IAS 36 “Impairment of assets”, impairment test for each CGU consider market participants’ assumptions. Market participants were selected taking into consideration the size, operations and characteristics of the business that are similar to those of Coca-Cola FEMSA.
The discount rates represent the current market assessment of the risks specific to each CGU, taking into consideration the time value of money and individual risks of the underlying assets that have not been incorporated in the cash flow estimates. The discount rate calculation is based on the specific circumstances of Coca-Cola FEMSA and its operating segments and is derived from its WACC. The WACC takes into account both debt and equity. The cost of equity is derived from the expected return on investment by Company’s investors. The cost of debt is based on the interest bearing borrowings Coca-Cola FEMSA is obliged to service. Segment-specific risk is incorporated by applying individual beta factors. The beta factors are evaluated annually based on publicly available market data.
Market participant assumptions are important because, not only do they include industry data for growth rates, management also assesses how the CGU’s position, relative to its competitors, might change over the forecasted period.

FEMSA Annual Report 2015 8180 creating stories
The key assumptions used for the value-in-use calculations are as follows:
• Cash flows were projected based on actual operating results and the five-year business plan. Cash flows for a further five-year were forecasted maintaining the same stable growth and margins per country of the last year base. Coca-Cola FEMSA believes that this forecasted period is justified due to the non-current nature of the business and past experiences.
• Cash flows after the first ten-year period were extrapolated using a perpetual growth rate equal to the expected annual population growth, in order to calculate the terminal recoverable amount.
• A per CGU-specific Weighted Average Cost of Capital (“WACC”) was applied as a hurdle rate to discount cash flows to get the recoverable amount of the units; the calculation assumes, size premium adjusting.
The key assumptions by CGU for impairment test as of December 31, 2015 were as follows:
Expected Annual Expected Volume Pre-tax Post-tax Long-Term Inflation Growth Rates CGU WACC WACC 2016-2025 2016-2025
Mexico 6.7% 6.1% 3.4% 2.1% Colombia 7.6% 6.8% 3.0% 4.4% Venezuela 17.8% 17.1% 72.5% 3.9% Costa Rica 8.2% 7.9% 4.7% 3.9% Guatemala 10.6% 10.0% 3.7% 4.7% Nicaragua 13.4% 12.8% 5.3% 6.4% Panama 7.4% 6.8% 3.1% 5.2% Argentina 9.8% 9.1% 22.8% 3.4% Brazil 8.0% 7.4% 4.9% 4.0%
The key assumptions by CGU for impairment test as of December 31, 2014 were as follows:
Expected Annual Expected Volume Pre-tax Post-tax Long-Term Inflation Growth Inflation CGU WACC WACC 2015-2024 2015-2024
Mexico 5.5% 5.0% 3.5% 2.3% Colombia 6.4% 5.9% 3.0% 5.3% Venezuela 12.9% 12.3% 51.1% 3.9% Costa Rica 7.7% 7.6% 4.7% 2.7% Guatemala 10.0% 9.4% 5.0% 4.3% Nicaragua 12.7% 12.2% 6.0% 2.7% Panama 7.6% 7.2% 3.8% 4.1% Argentina 9.9% 9.3% 22.3% 2.5% Brazil 6.2% 5.6% 6.0% 3.8%
The values assigned to the key assumptions represent management’s assessment of future trends in the industry and are based on both external sources and internal sources (historical data). Coca-Cola FEMSA consistently applied its methodology to determine CGU specific WACC’s to perform its annual impairment testing.
Sensitivity to Changes in AssumptionsAt December 31, 2015, Coca-Cola FEMSA performed an additional impairment sensitivity calculation, taking into account an adverse change in post-tax WACC, according to the country risk premium, using for each country the relative standard deviation between equity and sovereign bonds and an additional sensitivity to the volume of 100 basis points and concluded that no impairment would be recorded.
Change in Change in Volume CGU WACC Growth CAGR (1) Effect on Valuation
Mexico +0.7% -1.0% Passes by 7.53x Colombia +0.9% -1.0% Passes by 5.16x Venezuela +5.8% -1.0% Passes by 7.08x Costa Rica +2.4% -1.0% Passes by 2.27x Guatemala +1.2% -1.0% Passes by 6.41x Nicaragua +2.6% -1.0% Passes by 3.53x Panama +0.6% -1.0% Passes by 11.89x Argentina +5.6% -1.0% Passes by 137.35x Brazil +1.1% -1.0% Passes by 2.29x(1) Compound Annual Growth Rate (CAGR).

FEMSA Annual Report 2015 8180 creating stories
Note 13. Other Assets, Net and Other Financial Assets13.1 Other assets, net December 31, December 31, 2015 2014
Agreement with customers, net Ps. 238 Ps. 239Long term prepaid advertising expenses 52 87Guarantee deposits (1) 1,870 1,400Prepaid bonuses 122 92Advances to acquire property, plant and equipment 370 988Recoverable taxes 1,181 1,329Others 1,160 782 Ps. 4,993 Ps. 4,917(1) As it is customary in Brazil, the Company is required to collaterize tax, legal and labor contingencies by guarantee deposits (see Note 25.7).
13.2 Other financial assets December 31, December 31, 2015 2014
Non-current accounts receivable Ps. 478 Ps. 155Derivative financial instruments (see Note 20) 8,377 6,299Other non-current financial assets 100 97 Ps. 8,955 Ps. 6,551
As of December 31, 2015 and 2014, the fair value of long term accounts receivable amounted to Ps. 452 and Ps. 69, respectively. The fair value is calculated based on the discounted value of contractual cash flows whereby the discount rate is estimated using rates currently offered for receivable of similar amounts and maturities, which is considered to be level 2 in the fair value hierarchy.
Note 14. Balances and Transactions with Related Parties and Affiliated CompaniesBalances and transactions between the Company and its subsidiaries have been eliminated on consolidation and are not disclosed in this note.
The consolidated statements of financial positions and consolidated income statements include the following balances and transactions with related parties and affiliated companies:
December 31, December 31, 2015 2014
BalancesDue from The Coca-Cola Company (see Note 7) (1) (8) Ps. 1,559 Ps. 1,584Balance with BBVA Bancomer, S.A. de C.V. (2) 2,683 4,083Balance with Grupo Financiero Banorte, S.A. de C.V. (2) 1,178 3,653Instituto Tecnológico y de Estudios Superiores de Monterrey, A.C. (3) 79 126Due from Heineken Company (1) (7) 754 811Due from Grupo Estrella Azul (3) 69 59Other receivables (1) (4) 1,352 1,209Due to The Coca-Cola Company (5) (6) (8) Ps. 3,140 Ps. 4,343Due to BBVA Bancomer, S.A. de C.V. (5) 292 149Due to Caffenio (6) (7) 108 111Due to Heineken Company (6) (7) 2,588 2,408Other payables (6) 981 1,206(1) Presented within accounts receivable.(2) Presented within cash and cash equivalents.(3) Presented within other financial assets.(4) Presented within other current financial assets.(5) Recorded within bank loans.(6) Recorded within accounts payable.(7) Associates.(8) Non controlling interest.
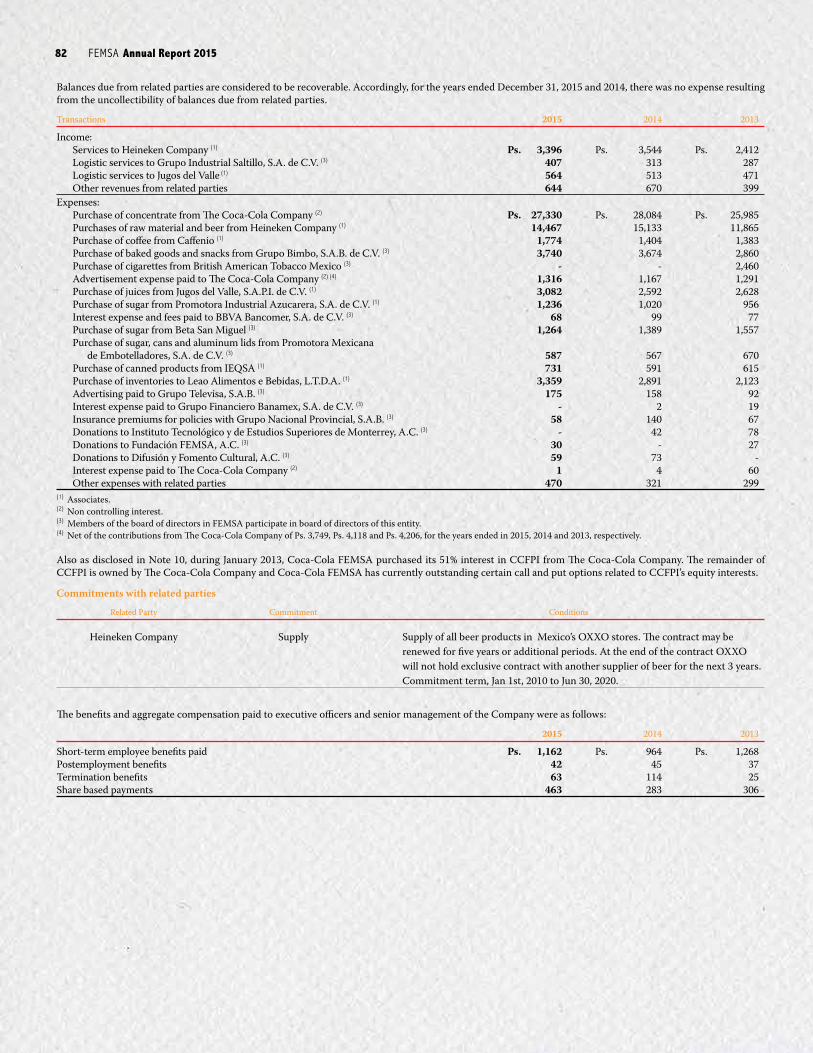
FEMSA Annual Report 2015 8382 creating stories
Balances due from related parties are considered to be recoverable. Accordingly, for the years ended December 31, 2015 and 2014, there was no expense resulting from the uncollectibility of balances due from related parties.
Transactions 2015 2014 2013
Income: Services to Heineken Company (1) Ps. 3,396 Ps. 3,544 Ps. 2,412 Logistic services to Grupo Industrial Saltillo, S.A. de C.V. (3) 407 313 287 Logistic services to Jugos del Valle (1) 564 513 471 Other revenues from related parties 644 670 399Expenses: Purchase of concentrate from The Coca-Cola Company (2) Ps. 27,330 Ps. 28,084 Ps. 25,985 Purchases of raw material and beer from Heineken Company (1) 14,467 15,133 11,865 Purchase of coffee from Caffenio (1) 1,774 1,404 1,383 Purchase of baked goods and snacks from Grupo Bimbo, S.A.B. de C.V. (3) 3,740 3,674 2,860 Purchase of cigarettes from British American Tobacco Mexico (3) - - 2,460 Advertisement expense paid to The Coca-Cola Company (2) (4) 1,316 1,167 1,291 Purchase of juices from Jugos del Valle, S.A.P.I. de C.V. (1) 3,082 2,592 2,628 Purchase of sugar from Promotora Industrial Azucarera, S.A. de C.V. (1) 1,236 1,020 956 Interest expense and fees paid to BBVA Bancomer, S.A. de C.V. (3) 68 99 77 Purchase of sugar from Beta San Miguel (3) 1,264 1,389 1,557 Purchase of sugar, cans and aluminum lids from Promotora Mexicana de Embotelladores, S.A. de C.V. (3) 587 567 670 Purchase of canned products from IEQSA (1) 731 591 615 Purchase of inventories to Leao Alimentos e Bebidas, L.T.D.A. (1) 3,359 2,891 2,123 Advertising paid to Grupo Televisa, S.A.B. (3) 175 158 92 Interest expense paid to Grupo Financiero Banamex, S.A. de C.V. (3) - 2 19 Insurance premiums for policies with Grupo Nacional Provincial, S.A.B. (3) 58 140 67 Donations to Instituto Tecnológico y de Estudios Superiores de Monterrey, A.C. (3) - 42 78 Donations to Fundación FEMSA, A.C. (3) 30 - 27 Donations to Difusión y Fomento Cultural, A.C. (3) 59 73 - Interest expense paid to The Coca-Cola Company (2) 1 4 60 Other expenses with related parties 470 321 299(1) Associates.(2) Non controlling interest.(3) Members of the board of directors in FEMSA participate in board of directors of this entity.(4) Net of the contributions from The Coca-Cola Company of Ps. 3,749, Ps. 4,118 and Ps. 4,206, for the years ended in 2015, 2014 and 2013, respectively.
Also as disclosed in Note 10, during January 2013, Coca-Cola FEMSA purchased its 51% interest in CCFPI from The Coca-Cola Company. The remainder of CCFPI is owned by The Coca-Cola Company and Coca-Cola FEMSA has currently outstanding certain call and put options related to CCFPI’s equity interests.
Commitments with related parties
Related Party Commitment Conditions
Heineken Company Supply Supply of all beer products in Mexico’s OXXO stores. The contract may be renewed for five years or additional periods. At the end of the contract OXXO will not hold exclusive contract with another supplier of beer for the next 3 years. Commitment term, Jan 1st, 2010 to Jun 30, 2020.
The benefits and aggregate compensation paid to executive officers and senior management of the Company were as follows:
2015 2014 2013
Short-term employee benefits paid Ps. 1,162 Ps. 964 Ps. 1,268Postemployment benefits 42 45 37Termination benefits 63 114 25Share based payments 463 283 306

FEMSA Annual Report 2015 8382 creating stories
Note 15. Balances and Transactions in Foreign CurrenciesAssets, liabilities and transactions denominated in foreign currencies are those realized in a currency different than the functional currency of the Company. As of the end and for the years ended on December 31, 2015, 2014 and 2013, assets, liabilities and transactions denominated in foreign currencies, expressed in Mexican pesos (contractual amounts) are as follows:
Assets Liabilities
Balances Short-Term Long-Term Short-Term Long- Term
As of December 31, 2015U.S. dollars Ps. 10,939 Ps. 630 Ps. 1,672 Ps. 71,123Euros 3 - 23 -Other currencies - 1,173 152 41Total Ps. 10,942 Ps. 1,803 Ps. 1,847 Ps. 71,164As of December 31, 2014U.S. dollars Ps. 5,890 Ps. 989 Ps. 7,218 Ps. 66,140Euros 32 - 27 -Other currencies 27 1,214 50 31Total Ps. 5,949 Ps. 2,203 Ps. 7,295 Ps. 66,171
Purchases of Other Raw Interest Consulting Assets Transactions Revenues Revenues Materials Expense Fees Acquisitions Other
For the year ended December 31, 2015U.S. dollars Ps. 1,891 Ps. 472 Ps. 11,710 Ps. 1,973 Ps. 34 Ps. 75 Ps. 2,035Euros - 1 2 - 2 - 37Other currencies 20 - - - - - 204Total Ps. 1,911 Ps. 473 Ps. 11,712 Ps. 1,973 Ps. 36 Ps. 75 Ps. 2,276
For the year ended December 31, 2014U.S. dollars Ps. 2,817 Ps. 641 Ps. 15,006 Ps. 1,669 Ps. 14 Ps. 478 Ps. 2,068Euros 7 - 80 15 - 5 13Other currencies 178 - 10 - - - 4Total Ps. 3,002 Ps. 641 Ps. 15,096 Ps. 1,684 Ps. 14 Ps. 483 Ps. 2,085
For the year ended December 31, 2013U.S. dollars Ps. 2,013 Ps. 605 Ps. 15,017 Ps. 435 Ps. 11 Ps. 80 Ps. 1,348Euros 1 3 55 9 - 2 15Other currencies - - - - - - 3Total Ps. 2,014 Ps. 608 Ps. 15,072 Ps. 444 Ps. 11 Ps. 82 Ps. 1,366
Mexican peso exchange rates effective at the dates of the consolidated statements of financial position and at the issuance date of the Company’s consolidated financial statements were as follows:
December 31, February 23, 2015 2014 2016
U.S. dollar 17.2065 14.7180 18.2762Euro 18.7873 17.9182 19.9997
Note 16. Post-Employment and Other Long-Term Employee BenefitsThe Company has various labor liabilities for employee benefits in connection with pension, seniority and post-retirement medical benefits. Benefits vary depending upon the country where the individual employees are located. Presented below is a discussion of the Company’s labor liabilities in Mexico, which comprise the substantial majority of those recorded in the consolidated financial statements.
During 2014, Coca-Cola FEMSA settled its pension plan in Brazil and consequently Coca-Cola FEMSA recognized the corresponding effects of the settlement as disclosed below.
16.1 AssumptionsThe Company annually evaluates the reasonableness of the assumptions used in its labor liability for post-employment and other non-current employee benefits computations.
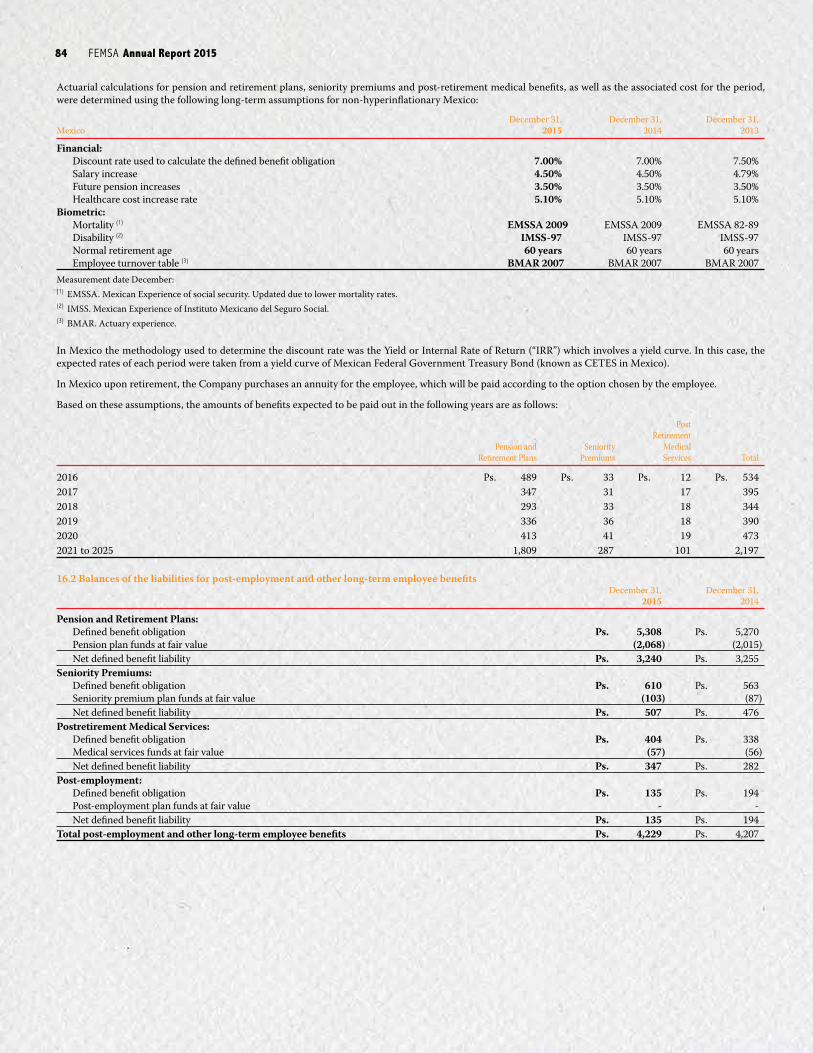
FEMSA Annual Report 2015 8584 creating stories
Actuarial calculations for pension and retirement plans, seniority premiums and post-retirement medical benefits, as well as the associated cost for the period, were determined using the following long-term assumptions for non-hyperinflationary Mexico:
December 31, December 31, December 31, Mexico 2015 2014 2013
Financial: Discount rate used to calculate the defined benefit obligation 7.00% 7.00% 7.50% Salary increase 4.50% 4.50% 4.79% Future pension increases 3.50% 3.50% 3.50% Healthcare cost increase rate 5.10% 5.10% 5.10%Biometric: Mortality (1) EMSSA 2009 EMSSA 2009 EMSSA 82-89 Disability (2) IMSS-97 IMSS-97 IMSS-97 Normal retirement age 60 years 60 years 60 years Employee turnover table (3) BMAR 2007 BMAR 2007 BMAR 2007Measurement date December:(1) EMSSA. Mexican Experience of social security. Updated due to lower mortality rates.(2) IMSS. Mexican Experience of Instituto Mexicano del Seguro Social.(3) BMAR. Actuary experience.
In Mexico the methodology used to determine the discount rate was the Yield or Internal Rate of Return (“IRR”) which involves a yield curve. In this case, the expected rates of each period were taken from a yield curve of Mexican Federal Government Treasury Bond (known as CETES in Mexico).
In Mexico upon retirement, the Company purchases an annuity for the employee, which will be paid according to the option chosen by the employee.
Based on these assumptions, the amounts of benefits expected to be paid out in the following years are as follows:
Post Retirement Pension and Seniority Medical Retirement Plans Premiums Services Total
2016 Ps. 489 Ps. 33 Ps. 12 Ps. 5342017 347 31 17 3952018 293 33 18 3442019 336 36 18 3902020 413 41 19 4732021 to 2025 1,809 287 101 2,197
16.2 Balances of the liabilities for post-employment and other long-term employee benefits December 31, December 31, 2015 2014
Pension and Retirement Plans: Defined benefit obligation Ps. 5,308 Ps. 5,270 Pension plan funds at fair value (2,068) (2,015) Net defined benefit liability Ps. 3,240 Ps. 3,255Seniority Premiums: Defined benefit obligation Ps. 610 Ps. 563 Seniority premium plan funds at fair value (103) (87) Net defined benefit liability Ps. 507 Ps. 476Postretirement Medical Services: Defined benefit obligation Ps. 404 Ps. 338 Medical services funds at fair value (57) (56) Net defined benefit liability Ps. 347 Ps. 282Post-employment: Defined benefit obligation Ps. 135 Ps. 194 Post-employment plan funds at fair value - - Net defined benefit liability Ps. 135 Ps. 194Total post-employment and other long-term employee benefits Ps. 4,229 Ps. 4,207
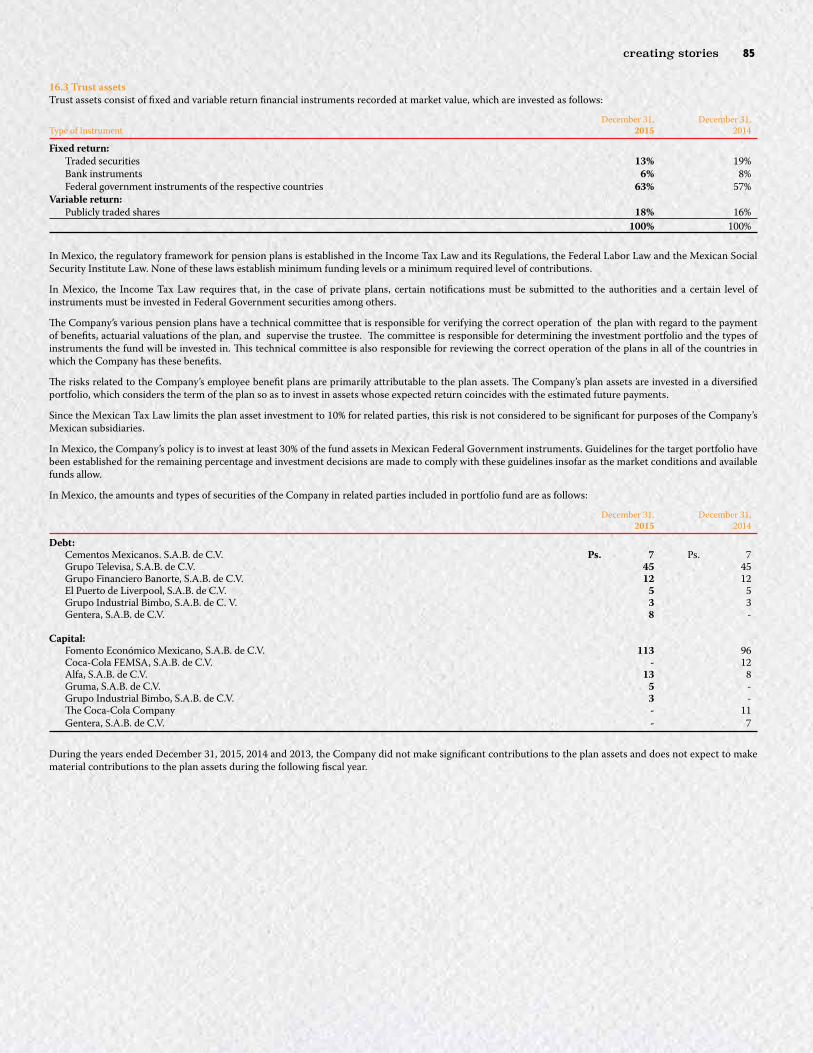
FEMSA Annual Report 2015 8584 creating stories
16.3 Trust assetsTrust assets consist of fixed and variable return financial instruments recorded at market value, which are invested as follows:
December 31, December 31, Type of Instrument 2015 2014
Fixed return: Traded securities 13% 19% Bank instruments 6% 8% Federal government instruments of the respective countries 63% 57%Variable return: Publicly traded shares 18% 16% 100% 100%
In Mexico, the regulatory framework for pension plans is established in the Income Tax Law and its Regulations, the Federal Labor Law and the Mexican Social Security Institute Law. None of these laws establish minimum funding levels or a minimum required level of contributions.
In Mexico, the Income Tax Law requires that, in the case of private plans, certain notifications must be submitted to the authorities and a certain level of instruments must be invested in Federal Government securities among others.
The Company’s various pension plans have a technical committee that is responsible for verifying the correct operation of the plan with regard to the payment of benefits, actuarial valuations of the plan, and supervise the trustee. The committee is responsible for determining the investment portfolio and the types of instruments the fund will be invested in. This technical committee is also responsible for reviewing the correct operation of the plans in all of the countries in which the Company has these benefits.
The risks related to the Company’s employee benefit plans are primarily attributable to the plan assets. The Company’s plan assets are invested in a diversified portfolio, which considers the term of the plan so as to invest in assets whose expected return coincides with the estimated future payments.
Since the Mexican Tax Law limits the plan asset investment to 10% for related parties, this risk is not considered to be significant for purposes of the Company’s Mexican subsidiaries.
In Mexico, the Company’s policy is to invest at least 30% of the fund assets in Mexican Federal Government instruments. Guidelines for the target portfolio have been established for the remaining percentage and investment decisions are made to comply with these guidelines insofar as the market conditions and available funds allow.
In Mexico, the amounts and types of securities of the Company in related parties included in portfolio fund are as follows:
December 31, December 31, 2015 2014
Debt: Cementos Mexicanos. S.A.B. de C.V. Ps. 7 Ps. 7 Grupo Televisa, S.A.B. de C.V. 45 45 Grupo Financiero Banorte, S.A.B. de C.V. 12 12 El Puerto de Liverpool, S.A.B. de C.V. 5 5 Grupo Industrial Bimbo, S.A.B. de C. V. 3 3 Gentera, S.A.B. de C.V. 8 -
Capital: Fomento Económico Mexicano, S.A.B. de C.V. 113 96 Coca-Cola FEMSA, S.A.B. de C.V. - 12 Alfa, S.A.B. de C.V. 13 8 Gruma, S.A.B. de C.V. 5 - Grupo Industrial Bimbo, S.A.B. de C.V. 3 - The Coca-Cola Company - 11 Gentera, S.A.B. de C.V. - 7
During the years ended December 31, 2015, 2014 and 2013, the Company did not make significant contributions to the plan assets and does not expect to make material contributions to the plan assets during the following fiscal year.
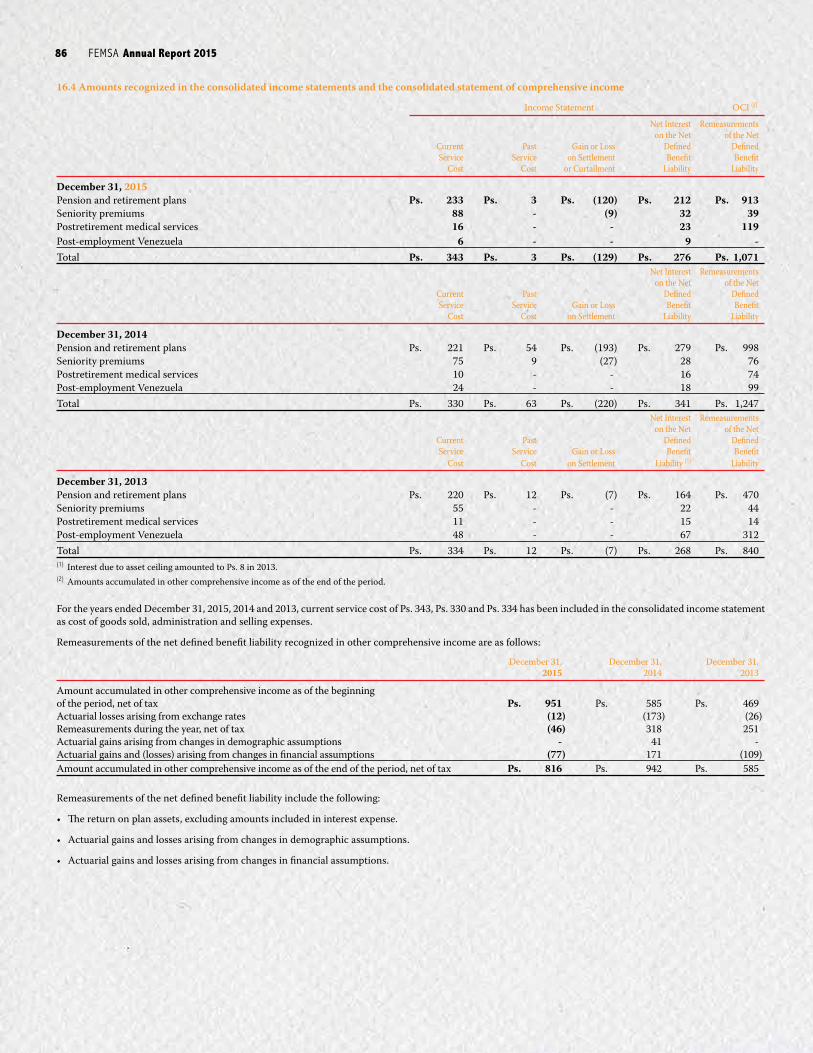
FEMSA Annual Report 2015 8786 creating stories
16.4 Amounts recognized in the consolidated income statements and the consolidated statement of comprehensive income
Income Statement OCI (2)
Net Interest Remeasurements on the Net of the Net Current Past Gain or Loss Defined Defined Service Service on Settlement Benefit Benefit Cost Cost or Curtailment Liability Liability
December 31, 2015Pension and retirement plans Ps. 233 Ps. 3 Ps. (120) Ps. 212 Ps. 913Seniority premiums 88 - (9) 32 39Postretirement medical services 16 - - 23 119Post-employment Venezuela 6 - - 9 -Total Ps. 343 Ps. 3 Ps. (129) Ps. 276 Ps. 1,071 Net Interest Remeasurements on the Net of the Net Current Past Defined Defined Service Service Gain or Loss Benefit Benefit Cost Cost on Settlement Liability Liability
December 31, 2014Pension and retirement plans Ps. 221 Ps. 54 Ps. (193) Ps. 279 Ps. 998Seniority premiums 75 9 (27) 28 76Postretirement medical services 10 - - 16 74Post-employment Venezuela 24 - - 18 99Total Ps. 330 Ps. 63 Ps. (220) Ps. 341 Ps. 1,247 Net Interest Remeasurements on the Net of the Net Current Past Defined Defined Service Service Gain or Loss Benefit Benefit Cost Cost on Settlement Liability (1) Liability
December 31, 2013Pension and retirement plans Ps. 220 Ps. 12 Ps. (7) Ps. 164 Ps. 470Seniority premiums 55 - - 22 44Postretirement medical services 11 - - 15 14Post-employment Venezuela 48 - - 67 312Total Ps. 334 Ps. 12 Ps. (7) Ps. 268 Ps. 840(1) Interest due to asset ceiling amounted to Ps. 8 in 2013.(2) Amounts accumulated in other comprehensive income as of the end of the period.
For the years ended December 31, 2015, 2014 and 2013, current service cost of Ps. 343, Ps. 330 and Ps. 334 has been included in the consolidated income statement as cost of goods sold, administration and selling expenses.
Remeasurements of the net defined benefit liability recognized in other comprehensive income are as follows:
December 31, December 31, December 31, 2015 2014 2013
Amount accumulated in other comprehensive income as of the beginning of the period, net of tax Ps. 951 Ps. 585 Ps. 469Actuarial losses arising from exchange rates (12) (173) (26)Remeasurements during the year, net of tax (46) 318 251Actuarial gains arising from changes in demographic assumptions - 41 -Actuarial gains and (losses) arising from changes in financial assumptions (77) 171 (109)Amount accumulated in other comprehensive income as of the end of the period, net of tax Ps. 816 Ps. 942 Ps. 585
Remeasurements of the net defined benefit liability include the following:
• The return on plan assets, excluding amounts included in interest expense.
• Actuarial gains and losses arising from changes in demographic assumptions.
• Actuarial gains and losses arising from changes in financial assumptions.

FEMSA Annual Report 2015 8786 creating stories
16.5 Changes in the balance of the defined benefit obligation for post-employment December 31, December 31, December 31, 2015 2014 2013
Pension and Retirement Plans: Initial balance Ps. 5,270 Ps. 4,866 Ps. 4,495 Current service cost 233 221 220 Past service cost 3 54 - Interest expense 353 353 311 Settlement - (482) (7) Effect on curtailment (120) - - Remeasurements of the net defined benefit obligation (154) 378 (143) Foreign exchange loss (gain) 39 42 (60) Benefits paid (316) (162) (152) Plan amendments - - 28 Acquisitions - - 174 Ending balance Ps. 5,308 Ps. 5,270 Ps. 4,866Seniority Premiums: Initial balance Ps. 563 Ps. 475 Ps. 324 Current service cost 88 75 55 Past service cost - 9 - Interest expense 38 33 24 Settlement - (27) - Effect on curtailment (9) - - Remeasurements of the net defined benefit obligation (34) 29 2 Benefits paid (45) (37) (36) Acquisitions 9 6 106 Ending balance Ps. 610 Ps. 563 Ps. 475Postretirement Medical Services: Initial balance Ps. 338 Ps. 267 Ps. 267 Current service cost 16 10 11 Interest expense 26 20 17 Remeasurements of the net defined benefit obligation 44 60 (11) Benefits paid (20) (19) (17) Ending balance Ps. 404 Ps. 338 Ps. 267Post-employment: Initial balance Ps. 194 Ps. 743 Ps. 594 Current service cost 5 24 48 Certain liability cost 73 - - Interest expense - 18 67 Remeasurements of the net defined benefit obligation - 54 238 Foreign exchange (gain) (137) (638) (187) Benefits paid - (7) (17) Ending balance Ps. 135 Ps. 194 Ps. 743
16.6 Changes in the balance of plan assets December 31, December 31, December 31, 2015 2014 2013
Total Plan Assets: Initial balance Ps. 2,158 Ps. 2,371 Ps. 2,110 Actual return on trust assets 65 133 29 Foreign exchange loss (gain) 7 (8) (73) Life annuities 61 197 88 Benefits paid (63) - - Acquisitions - - 201 Plan amendments - - 16 Effect due to settlement - (535) - Ending balance Ps. 2,228 Ps. 2,158 Ps. 2,371
As a result of the Company’s investments in life annuities plan, management does not expect it will need to make material contributions to plan assets in order to meet its future obligations.
16.7 Variation in assumptionsThe Company decided that the relevant actuarial assumptions that are subject to sensitivity and valuated through the projected unit credit method, are the discount rate, the salary increase rate and healthcare cost increase rate. The reasons for choosing these assumptions are as follows:
• Discount rate: The rate that determines the value of the obligations over time.• Salary increase rate: The rate that considers the salary increase which implies an increase in the benefit payable.• Healthcare cost increase rate: The rate that considers the trends of health care costs which implies an impact on the postretirement medical service obligations
and the cost for the year.
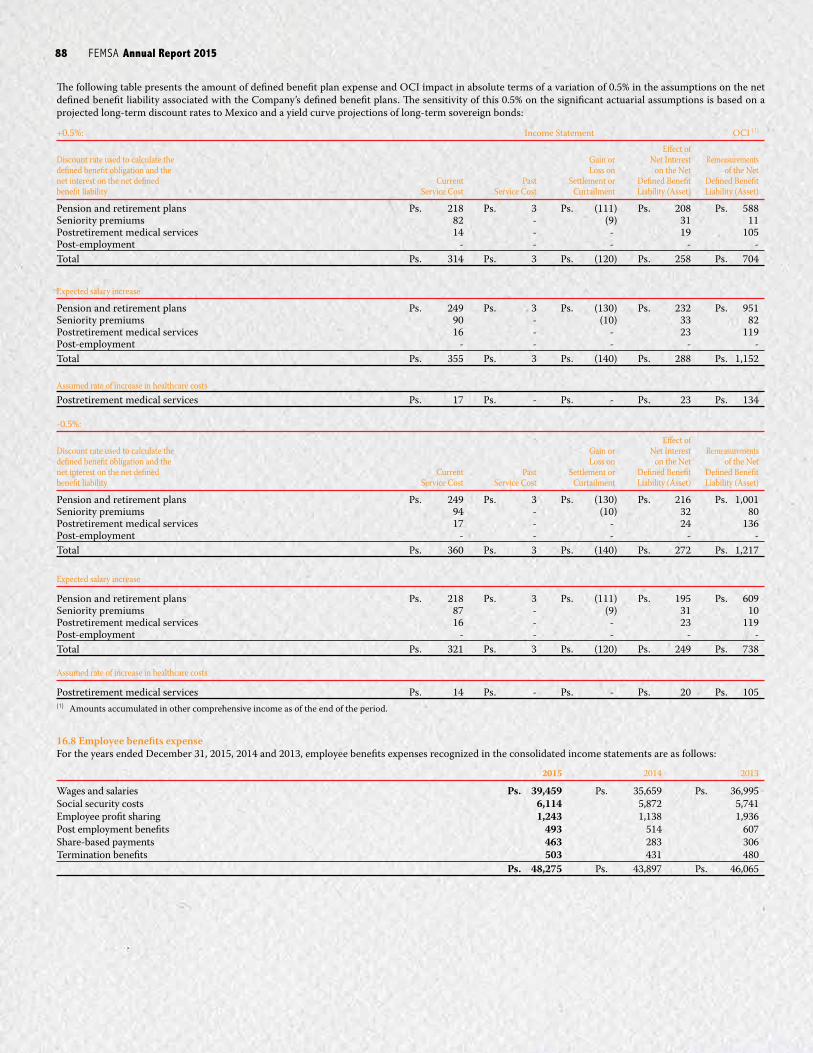
FEMSA Annual Report 2015 8988 creating stories
The following table presents the amount of defined benefit plan expense and OCI impact in absolute terms of a variation of 0.5% in the assumptions on the net defined benefit liability associated with the Company’s defined benefit plans. The sensitivity of this 0.5% on the significant actuarial assumptions is based on a projected long-term discount rates to Mexico and a yield curve projections of long-term sovereign bonds:
+0.5%: Income Statement OCI (1)
Effect of Discount rate used to calculate the Gain or Net Interest Remeasurements defined benefit obligation and the Loss on on the Net of the Net net interest on the net defined Current Past Settlement or Defined Benefit Defined Benefit benefit liability Service Cost Service Cost Curtailment Liability (Asset) Liability (Asset)
Pension and retirement plans Ps. 218 Ps. 3 Ps. (111) Ps. 208 Ps. 588Seniority premiums 82 - (9) 31 11Postretirement medical services 14 - - 19 105Post-employment - - - - -Total Ps. 314 Ps. 3 Ps. (120) Ps. 258 Ps. 704
Expected salary increase
Pension and retirement plans Ps. 249 Ps. 3 Ps. (130) Ps. 232 Ps. 951 Seniority premiums 90 - (10) 33 82Postretirement medical services 16 - - 23 119Post-employment - - - - -Total Ps. 355 Ps. 3 Ps. (140) Ps. 288 Ps. 1,152
Assumed rate of increase in healthcare costs Postretirement medical services Ps. 17 Ps. - Ps. - Ps. 23 Ps. 134
-0.5%: Effect of Discount rate used to calculate the Gain or Net Interest Remeasurements defined benefit obligation and the Loss on on the Net of the Net net interest on the net defined Current Past Settlement or Defined Benefit Defined Benefit benefit liability Service Cost Service Cost Curtailment Liability (Asset) Liability (Asset)
Pension and retirement plans Ps. 249 Ps. 3 Ps. (130) Ps. 216 Ps. 1,001Seniority premiums 94 - (10) 32 80Postretirement medical services 17 - - 24 136Post-employment - - - - -Total Ps. 360 Ps. 3 Ps. (140) Ps. 272 Ps. 1,217
Expected salary increase
Pension and retirement plans Ps. 218 Ps. 3 Ps. (111) Ps. 195 Ps. 609Seniority premiums 87 - (9) 31 10Postretirement medical services 16 - - 23 119Post-employment - - - - -Total Ps. 321 Ps. 3 Ps. (120) Ps. 249 Ps. 738
Assumed rate of increase in healthcare costs
Postretirement medical services Ps. 14 Ps. - Ps. - Ps. 20 Ps. 105(1) Amounts accumulated in other comprehensive income as of the end of the period.
16.8 Employee benefits expenseFor the years ended December 31, 2015, 2014 and 2013, employee benefits expenses recognized in the consolidated income statements are as follows:
2015 2014 2013
Wages and salaries Ps. 39,459 Ps. 35,659 Ps. 36,995Social security costs 6,114 5,872 5,741Employee profit sharing 1,243 1,138 1,936Post employment benefits 493 514 607Share-based payments 463 283 306Termination benefits 503 431 480 Ps. 48,275 Ps. 43,897 Ps. 46,065
FEMSA Annual Report 2015 8988 creating stories
Note 17. Bonus Programs17.1 Quantitative and qualitative objectivesThe bonus program for executives is based on complying with certain goals established annually by management, which include quantitative and qualitative objectives, and special projects.
The quantitative objectives represent approximately 50% of the bonus, and are based on the Economic Value Added (“EVA”) methodology. The objective established for the executives at each entity is based on a combination of the EVA generated per entity and the EVA generated by the Company, calculated at approximately 70% and 30%, respectively. The qualitative objectives and special projects represent the remaining 50% of the annual bonus and are based on the critical success factors established at the beginning of the year for each executive.
The bonus amount is determined based on each eligible participant’s level of responsibility and based on the EVA generated by the applicable business unit the employee works for. This formula is established by considering the level of responsibility within the organization, the employees’ evaluation and competitive compensation in the market. The bonus is granted to the eligible employee on an annual basis and after withholding applicable taxes.
17.2 Share-based payment bonus planThe Company has implemented a stock incentive plan for the benefit of its senior executives. As discussed above, this plan uses as its main evaluation metric the EVA. Under the EVA stock incentive plan, eligible employees are entitled to receive a special annual bonus (fixed amount), to be paid in shares of FEMSA or Coca-Cola FEMSA, as applicable or stock options (the plan considers providing stock options to employees; however, since inception only shares of FEMSA or Coca-Cola FEMSA have been granted).
The plan is managed by FEMSA’s chief executive officer (CEO), with the support of the board of directors, together with the CEO of the respective sub-holding company. FEMSA’s Board of Directors is responsible for approving the plan’s structure, and the annual amount of the bonus. Each year, FEMSA’s CEO in conjunction with the Evaluation and Compensation Committee of the board of directors and the CEO of the respective sub-holding company determine the employees eligible to participate in the plan and the bonus formula to determine the number of shares to be received. Until 2015 the shares were vested ratably over a six year period, beginning with January 01, 2016 onwards they will ratably vest over a four year period, with retrospective effects. Early December 31, 2015, the Company and the eligible employee agree to the share-based payment arrangement, being when it and the counterparty have a shared understanding of the terms and conditions of the arrangement. FEMSA accounts for its share-based payment bonus plan as an equity-settled share based payment transaction as it will ultimately settle its obligations with its employees by issuing its own shares or those of its subsidiary Coca-Cola FEMSA.
The Company contributes the individual employee’s special bonus (after taxes) in cash to the Administrative Trust (which is controlled and consolidated by FEMSA), who then uses the funds to purchase FEMSA or Coca-Cola FEMSA shares (as instructed by the Administrative Trust’s Technical Committee), which are then allocated to such employee. The Administrative Trust tracks the individual employees’ account balance. FEMSA created the Administrative Trust with the objective of administering the purchase of FEMSA and Coca-Cola FEMSA shares by each of its subsidiaries with eligible executives participating in the stock incentive plan. The Administrative Trust’s objectives are to acquire FEMSA shares, or shares of Coca-Cola FEMSA and to manage the shares granted to the individual employees based on instructions set forth by the Technical Committee. Once the shares are acquired following the Technical Committee’s instructions, the Administrative Trust assigns to each participant their respective rights. As the trust is controlled and therefore consolidated by FEMSA, shares purchased in the market and held within the Administrative Trust are presented as treasury stock (as it relates to FEMSA’s shares) or as a reduction of the noncontrolling interest (as it relates to Coca-Cola FEMSA’s shares) in the consolidated statement of changes in equity, on the line issuance (repurchase) of shares associated with share-based payment plans. Should an employee leave prior to their shares vesting, they would lose the rights to such shares, which would then remain within the Administrative Trust and be able to be reallocated to other eligible employees as determined by the Company. The incentive plan target is expressed in months of salary, and the final amount payable is computed based on a percentage of compliance with the goals established every year. For the years ended December 31, 2015, 2014 and 2013, the compensation expense recorded in the consolidated income statement amounted to Ps. 463, Ps. 283 and Ps. 306, respectively.
All shares held in the Administrative Trust are considered outstanding for diluted earnings per share purposes and dividends on shares held by the trust are charged to retained earnings.
As of December 31, 2015 and 2014, the number of shares held by the trust associated with the Company’s share based payment plans is as follows:
Number of Shares
FEMSA UBD KOF L
2015 2014 2015 2014
Beginning balance 4,763,755 7,001,428 1,298,533 1,780,064Shares acquired by the Administrative Trust to employees 1,491,330 517,855 466,036 330,730Shares released from Administrative Trust to employees upon vesting (2,008,293) (2,755,528) (604,258) (812,261)Forfeitures - - - -Ending balance 4,246,792 4,763,755 1,160,311 1,298,533
The fair value of the shares held by the trust as of the end of December 31, 2015 and 2014 was Ps. 830 and Ps. 788, respectively, based on quoted market prices of those dates.

FEMSA Annual Report 2015 9190 creating stories
Note 18. Bank Loans and Notes Payables Carrying Fair Carrying At December 31, (1) Value at Value at Value at 2021 and December 31, December 31, December 31, (in millions of Mexican pesos) 2016 2017 2018 2019 2020 Thereafter 2015 2015 2014(1)
Short-term debt:Fixed rate debt:Colombian pesos Bank loans Ps. 219 Ps. - Ps. - Ps. - Ps. - Ps. - Ps. 219 Ps. 220 Ps. - Interest rate 6.5% - - - - - 6.5% - -Argentine pesos Notes payable 165 - - - - - 165 164 301 Interest rate 26.2% - - - - - 26.2% - 30.9%Chilean pesos Bank loans 1,442 - - - - - 1,442 1,442 - Interest rate 4.2% - - - - - 4.2% - -Finance leases 10 - - - - - 10 10 - Interest rate 2.4% - - - - - 2.4% - -Variable rate debt:Colombian pesos Bank loans 235 - - - - - 235 235 - Interest rate 8.2% - - - - - 8.2% - -Brazilian Reais Bank loans 168 - - - - - 168 168 148 Interest rate 14.8% - - - - - 14.8% - 12.6%Total short-term debt Ps. 2,239 Ps. - Ps. - Ps. - Ps. - Ps. - Ps. 2,239 Ps. 2,239 Ps. 449
Long-term debt:Fixed rate debt:U.S. dollarsYankee bond Ps. - Ps. - Ps. 17,158 Ps. - Ps. 8,566 Ps. 25,609 Ps. 51,333 Ps. 52,990 Ps. 43,893 Interest rate - - 2.4% - 4.6% 4.4% 3.8% - 3.8%Bank of NY (FEMSA USD 2023) - - - - - 5,068 5,068 4,852 4,308 Interest rate - - - - - 2.9% 2.9% - 2.9%Bank of NY (FEMSA USD 2043) - - - - - 11,675 11,675 10,737 9,900 Interest rate - - - - - 4.4% 4.4% - 4.4%Bank loans - - - - - - - - 30 Interest rate - - - - - - - - 3.9%Mexican pesos Units of investment (UDIs) - 3,385 - - - - 3,385 3,385 3,599 Interest rate - 4.2% - - - - 4.2% - 4.2%Domestic senior notes - - - - - 9,989 9,989 9,527 9,988 Interest rate - - - - - 6.2% 6.2% - 6.2%Brazilian reais Bank loans 174 187 151 116 80 111 819 653 601 Interest rate 5.4% 5.7% 6.3% 6.6% 6.7% 5.6% 6.0% - 4.6%Finance leases 67 66 65 62 51 149 460 356 762 Interest rate 4.6% 4.6% 4.6% 4.6% 4.6% 4.6% 4.6% - 4.6%Argentine pesos Bank loans 18 - - - - - 18 17 309 Interest rate 15.3% - - - - - 15.3% - 26.8%Chilean pesos Bank loans 120 82 30 - - - 232 232 - Interest rate 7.3% 7.6% 7.9% - - - 7.5% - -Finance leases 14 15 16 17 18 12 92 92 - Interest rate 3.6% 3.6% 3.5% 3.5% 3.3% 3.2% 3.4% - -Subtotal Ps. 393 Ps. 3,735 Ps. 17,420 Ps. 195 Ps. 8,715 Ps. 52,613 Ps. 83,071 Ps. 82,841 Ps. 73,390(1) All interest rates shown in this table are weighted average contractual annual rates.

FEMSA Annual Report 2015 9190 creating stories
Carrying Fair Carrying At December 31, (1) Value at Value at Value at 2021 and December 31, December 31, December 31, (in millions of Mexican pesos) 2016 2017 2018 2019 2020 Thereafter 2015 2015 2014(1)
Variable rate debt:U.S. dollarsBank loans Ps. - Ps. - Ps. - Ps. - Ps. - Ps. - Ps. - Ps. - Ps. 6,956 Interest rate - - - - - - - - 0.9%Mexican pesosDomestic senior notes 2,496 - - - - - 2,496 2,500 2,473 Interest rate 3.6% - - - - - 3.6% - 3.4%Argentine pesosBank loans 82 41 - - - - 123 120 232 Interest rate 32.2% 32.2% - - - - 32.2% - 21.5%Brazilian reaisBank loans 189 107 107 107 74 - 584 511 156 Interest rate 11.9% 9.2% 9.2% 9.2% 9.2% - 10.1% - 6.7%Finance leases - - - - - - - - 63 Interest rate - - - - - - - - 10.0%Colombian pesosBank loans 280 684 54 53 53 52 1,176 1,165 769 Interest rate 6.9% 6.5% 8.0% 8.0% 8.0% 8.2% 6.9% - 5.9%Finance leases 0.04 0.04 0.05 0.05 0.01 - 0.19 0.19 - Interest rate 8.4% 8.4% 8.4% 8.4% 8.4% - 8.4% - -Chilean pesos Bank loans 216 283 374 358 549 395 2,175 2,175 - Interest rate 6.2% 6.3% 6.2% 6.2% 5.7% 5.9% 6.0% - -Subtotal Ps. 3,263 Ps. 1,115 Ps. 535 Ps. 518 Ps. 676 Ps. 447 Ps. 6,554 Ps. 6,471 Ps. 10,649Total long-term debt Ps. 3,656 Ps. 4,850 Ps. 17,955 Ps. 713 Ps. 9,391 Ps. 53,060 Ps. 89,625 Ps. 89,312 Ps. 84,039Current portion of long term debt (3,656) (1,104) Ps. 85,969 Ps. 82,935(1) All interest rates shown in this table are weighted average contractual annual rates.

FEMSA Annual Report 2015 9392 creating stories
Hedging Derivative 2021 and Total Total Financial Instruments (1) 2016 2017 2018 2019 2020 Thereafter 2015 2014
(notional amounts in millions of Mexican pesos)Cross currency swaps:Units of investments to Mexican pesos and variable rate:Fixed to variable (2) Ps. - Ps. 2,500 Ps. - Ps. - Ps. - Ps. - Ps. 2,500 Ps. 2,500 Interest pay rate - 3.4% - - - - 3.4% 3.1% Interest receive rate - 4.2% - - - - 4.2% 4.2%U.S. dollars to Mexican pesosFixed to variable (3) - - - - - 11,403 11,403 11,403 Interest pay rate - - - - - 4.8% 4.8% 4.6% Interest receive rate - - - - - 4.0% 4.0% 4.0%Variable to fixed - - 7,571 - - - 7,571 6,476 Interest pay rate - - 3.5% - - - 3.5% 3.2% Interest receive rate - - 2.4% - - - 2.4% 2.4%Fixed to fixed - - - - - 1,267 1,267 1,267 Interest pay rate - - - - - 5.7% 5.7% 5.7% Interest receive rate - - - - - 2.9% 2.9% 2.9%U.S. dollars to Brazilian reaisFixed to variable - - 5,592 - - - 5,592 6,653 Interest pay rate - - 12.7% - - - 12.7% 11.3% Interest receive rate - - 2.7% - - - 2.7% 2.7%Variable to variable - - 17,551 - - - 17,551 20,311 Interest pay rate - - 12.6% - - - 12.6% 11.3% Interest receive rate - - 2.1% - - - 2.1% 1.5%Chilean pesos Variable to fixed - - - - 1,097 - 1,097 - Interest pay rate - - - - 6.9% - 6.9% - Interest receive rate - - - - 6.8% - 6.8% -Interest rate swap:Mexican pesosVariable to fixed rate: - - - 76 - 1,197 1,273 - Interest pay rate - - - 6.5% - 7.1% 7.0% - Interest receive rate - - - 4.5% - 5.5% 5.5% -Variable to fixed rate (2): Interest pay rate - 5.2% - - - - 5.2% 5.0% Interest receive rate - 3.4% - - - - 3.4% 3.2%Variable to fixed rate (3): Interest pay rate - - - - - 7.2% 7.2% 7.2% Interest receive rate - - - - - 4.8% 4.8% 4.6%(1) All interest rates shown in this table are weighted average contractual annual rates.(2) Interest rate swaps with a notional amount of Ps. 1,250 that receive a variable rate of 3.4% and pay a fixed rate of 5.2%; joined with a cross currency swap of the same notional amount,
which covers units of investments to Mexican pesos, that receives a fixed rate of 4.2% and pays a variable rate of 3.4%.(3) Interest rate swaps with a notional amount of Ps. 11,403 that receive a variable rate of 4.8% and pay a fixed rate of 7.2%; joined with a cross currency swap of the same notional amount,
which covers U.S. dollars to Mexican pesos, that receives a fixed rate of 4.0% and pay a variable rate of 4.8%.
For the years ended December 31, 2015, 2014 and 2013, the interest expense is comprised as follows:
2015 2014 2013
Interest on debts and borrowings Ps. 4,586 Ps. 3,992 Ps. 3,055Finance charges payable under capitalized interest (60) (117) (59)Finance charges for employee benefits 276 341 268Derivative instruments 2,894 2,413 825Finance operating charges 79 66 225Finance charges payable under finance leases 2 6 17 Ps. 7,777 Ps. 6,701 Ps. 4,331
On May 7, 2013, the Company issued long-term debt on the NYSE in the amount of $1,000, which was made up of senior notes of $300 with a maturity of 10 years and a fixed interest rate of 2.875%; and senior notes of $700 with a maturity of 30 years and a fixed interest rate of 4.375%. After the issuance, the Company contracted cross-currency swaps to reduce its exposure to risk of exchange rate and interest rate fluctuations associated with this issuance, see Note 20.
In November, 2013, Coca-Cola FEMSA issued U.S. $1,000 in aggregate principal amount of 2.375% senior notes due 2018, U.S. $750 in aggregate principal amount of 3.875% senior notes due 2023 and U.S. $400 in aggregate principal amount of 5.250% senior notes due 2043, in an SEC registered offering. These notes are guaranteed by its subsidiaries: Propimex, S. de R.L. de C.V., Comercializadora La Pureza de Bebidas, S. de R.L. de C.V., Controladora Interamericana de Bebidas, S. de R.L. de C.V., Grupo Embotellador Cimsa, S. de R.L. de C.V., Refrescos Victoria del Centro, S. de R.L. de C.V., Servicios Integrados Inmuebles del Golfo, S. de R.L. de C.V. and Yoli de Acapulco, S.A. de C.V. (“Guarantors”).

FEMSA Annual Report 2015 9392 creating stories
On December 4, 2007, the Company obtained the approval from the National Banking and Securities Commission (Comisión Nacional Bancaria y de Valores or “CNBV”) for the issuance of long-term domestic senior notes (“Certificados Bursátiles”) in the amount of Ps. 10,000 (nominal amount) or its equivalent in investment units. As of December 31, 2014 the Company has issued the following domestic senior notes: i) on December 7, 2007, the Company issued domestic senior notes composed of Ps. 3,500 (nominal amount) with a maturity date on November 29, 2013 and a floating interest rate, which was paid at maturiry; ii) on December 7, 2007, the Company issued domestic senior notes in the amount of 637,587,000 investment units (Ps. 2,500 nominal amount), with a maturity date on November 24, 2017 and a fixed interest rate.
Coca-Cola FEMSA has the following debt bonds: a) registered with the Mexican stock exchange: i) Ps. 2,500 (nominal amount) with a maturity date in 2016 and a variable interest rate, ii) Ps. 2,500 (nominal amount) with a maturity date in 2021 and fixed interest rate of 8.27% and iii) Ps. 7,500 (nominal amount) with a maturity date in 2023 and fixed interest rate of 5.46%; and b) registered with the SEC: i) Senior notes of U.S. $500 with interest at a fixed rate of 4.63% and maturity date on February 15, 2020, ii) Senior notes of U.S. $1,000 with interest at a fixed rate of 2.38% and maturity date on November 26, 2018, iii) Senior notes of U.S. $900 with interest at a fixed rate of 3.88% and maturity date on November 26, 2023 and iv) Senior notes of U.S. $600 with interest at a fixed rate of 5.25% and maturity date on November 26, 2043 all of which are guaranteed by Coca-Cola FEMSA subsidiaries: Propimex, S. de R.L. de C.V., Comercializadora La Pureza de Bebidas, S. de R.L. de C.V., Controladora Interamericana de Bebidas, S. de R.L. de C.V., Grupo Embotellador Cimsa, S. de R.L. de C.V., Refrescos Victoria del Centro, S. de R.L. de C.V., Distribuidora y Manufacturera del Valle de Mexico, S. de R.L. de C.V (as successor guarantor of Servicios Integrados Inmuebles del Golfo, S. de R.L. de C.V.) and Yoli de Acapulco, S. de R.L. de C.V. (“Guarantors”).
The Company has financing from different institutions under agreements that stipulate different restrictions and covenants, which mainly consist of maximum levels of leverage and capitalization as well as minimum consolidated net worth and debt and interest coverage ratios. As of the date of these consolidated financial statements, the Company was in compliance with all restrictions and covenants contained in its financing agreements.
In January 13, 2014, Coca-Cola FEMSA issued an additional U.S. $350 million of senior notes comprised of 10 year and 30 year bonds. The interest rates and maturity dates of the new notes are the same as those of the initial 2013 notes offering. These notes are also guaranteed by the same Guarantors.
In February 2014, Coca-Cola FEMSA prepaid in full outstanding Bank loans denominated in pesos for a total amount of Ps. 4,175 (nominal amount).
In December 2015, Coca-Cola FEMSA prepaid in full outstanding Bank loans denominated in U.S. million dolars for a total amount of $450 (nominal amount).
Note 19. Other Income and Expenses 2015 2014 2013
Gain on sale of shares (see Note 4) Ps. 14 Ps. - Ps. -Gain on sale of long-lived assets 249 - 41Gain on sale of other assets - 276 170Sale of waste material 41 44 43Write off-contingencies (see Note 25.5) - 475 120Recoveries from previous years 16 89 -Insurance rebates 17 18 -Others 86 196 277Other income Ps. 423 Ps. 1,098 Ps. 651Contingencies associated with prior acquisitions or disposals Ps. 93 Ps. - Ps. 385Loss on sale of long-lived assets - 7 -Impairment of long-lived assets 134 145 -Disposal of long-lived assets (1) 416 153 122Foreign exchange losses related to operating activities 917 147 99Securities taxes from Colombia 30 69 51Severance payments 285 277 190Donations 362 172 119Legal fees and other expenses from past acquisitions 223 31 110Other 281 276 363Other expenses Ps. 2,741 Ps. 1,277 Ps. 1,439(1) Charges related to fixed assets retirement from ordinary operations and other long-lived assets.

FEMSA Annual Report 2015 9594 creating stories
Note 20. Financial InstrumentsFair Value of Financial InstrumentsThe Company measures the fair value of its financial assets and liabilities classified as level 2 applying the income approach method, which estimates the fair value based on expected cash flows discounted to net present value. The following table summarizes the Company’s financial assets and liabilities measured at fair value, as of December 31, 2015 and 2014:
December 31, 2015 December 31, 2014
Level 1 Level 2 Level 1 Level 2
Derivative financial instrument (current asset) - 523 - 384Derivative financial instrument (non-current asset) - 8,377 - 6,299Derivative financial instrument (current liability) 270 89 313 34Derivative financial instrument (non-current liability) - 277 112 39
20.1 Total debtThe fair value of bank and syndicated loans is calculated based on the discounted value of contractual cash flows whereby the discount rate is estimated using rates currently offered for debt of similar amounts and maturities, which is considered to be level 2 in the fair value hierarchy. The fair value of the Company’s publicly traded debt is based on quoted market prices as of December 31, 2015 and 2014, which is considered to be level 1 in the fair value hierarchy.
2015 2014
Carrying value Ps. 91,864 Ps. 84,488Fair value 91,551 86,595
20.2 Interest rate swapsThe Company uses interest rate swaps to offset the interest rate risk associated with its borrowings, pursuant to which it pays amounts based on a fixed rate and receives amounts based on a floating rate. These instruments have been designated as cash flow hedges and are recognized in the consolidated statement of financial position at their estimated fair value. The fair value is estimated using formal technical models. The valuation method involves discounting to present value the expected cash flows of interest, calculated from the rate curve of the cash flow currency, and expresses the net result in the reporting currency. Changes in fair value are recorded in cumulative other comprehensive income, net of taxes until such time as the hedged amount is recorded in the consolidated income statements.
At December 31, 2015, the Company has the following outstanding interest rate swap agreements:
Fair Value Liability Fair Value Asset Notional December 31, December 31, Maturity Date Amount 2015 2015
2017 Ps. 1,250 Ps. (36) Ps. -2019 76 (3) -2021 623 (62) -2022 574 (9) -2023 11,403 - 89
At December 31, 2014 the Company has the following outstanding interest rate swap agreements:
Fair Value Liability Fair Value Asset Notional December 31, December 31, Maturity Date Amount 2014 2014
2017 Ps. 1,250 Ps. (35) Ps. -2023 11,403 (4) 12
The net effect of expired contracts treated as hedges are recognized as interest expense within the consolidated income statements.
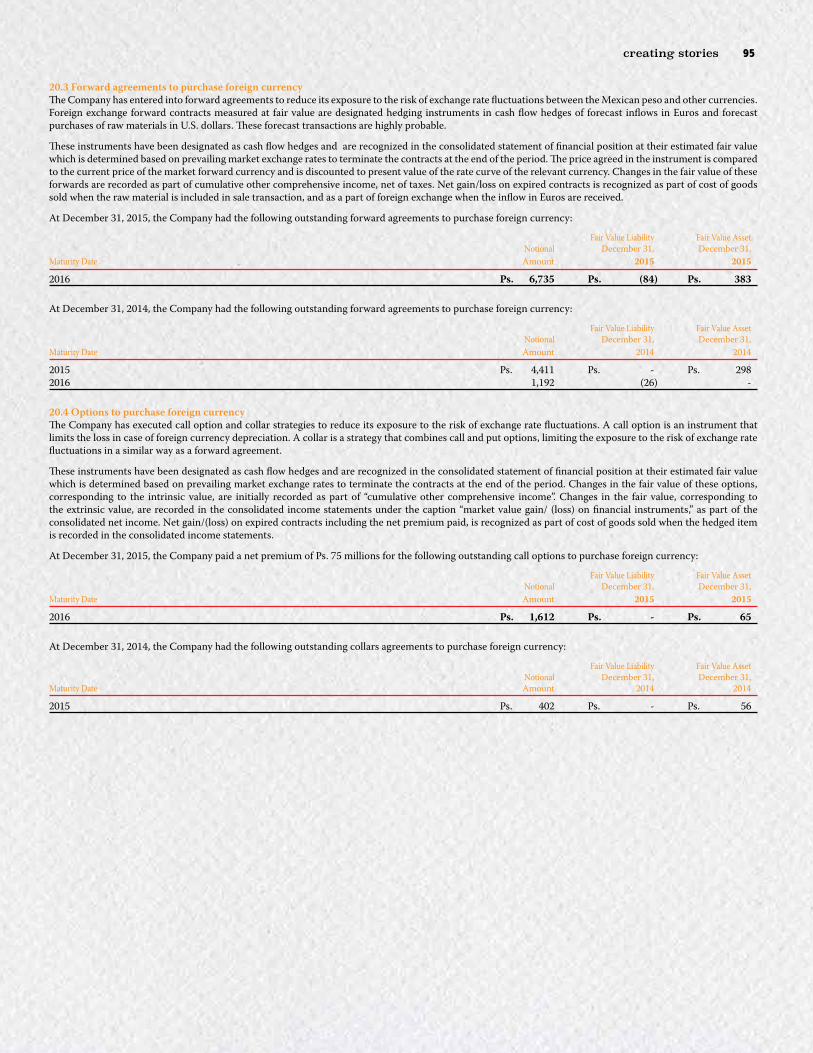
FEMSA Annual Report 2015 9594 creating stories
20.3 Forward agreements to purchase foreign currencyThe Company has entered into forward agreements to reduce its exposure to the risk of exchange rate fluctuations between the Mexican peso and other currencies. Foreign exchange forward contracts measured at fair value are designated hedging instruments in cash flow hedges of forecast inflows in Euros and forecast purchases of raw materials in U.S. dollars. These forecast transactions are highly probable.
These instruments have been designated as cash flow hedges and are recognized in the consolidated statement of financial position at their estimated fair value which is determined based on prevailing market exchange rates to terminate the contracts at the end of the period. The price agreed in the instrument is compared to the current price of the market forward currency and is discounted to present value of the rate curve of the relevant currency. Changes in the fair value of these forwards are recorded as part of cumulative other comprehensive income, net of taxes. Net gain/loss on expired contracts is recognized as part of cost of goods sold when the raw material is included in sale transaction, and as a part of foreign exchange when the inflow in Euros are received.
At December 31, 2015, the Company had the following outstanding forward agreements to purchase foreign currency:
Fair Value Liability Fair Value Asset Notional December 31, December 31, Maturity Date Amount 2015 2015
2016 Ps. 6,735 Ps. (84) Ps. 383
At December 31, 2014, the Company had the following outstanding forward agreements to purchase foreign currency:
Fair Value Liability Fair Value Asset Notional December 31, December 31, Maturity Date Amount 2014 2014
2015 Ps. 4,411 Ps. - Ps. 2982016 1,192 (26) -
20.4 Options to purchase foreign currencyThe Company has executed call option and collar strategies to reduce its exposure to the risk of exchange rate fluctuations. A call option is an instrument that limits the loss in case of foreign currency depreciation. A collar is a strategy that combines call and put options, limiting the exposure to the risk of exchange rate fluctuations in a similar way as a forward agreement.
These instruments have been designated as cash flow hedges and are recognized in the consolidated statement of financial position at their estimated fair value which is determined based on prevailing market exchange rates to terminate the contracts at the end of the period. Changes in the fair value of these options, corresponding to the intrinsic value, are initially recorded as part of “cumulative other comprehensive income”. Changes in the fair value, corresponding to the extrinsic value, are recorded in the consolidated income statements under the caption “market value gain/ (loss) on financial instruments,” as part of the consolidated net income. Net gain/(loss) on expired contracts including the net premium paid, is recognized as part of cost of goods sold when the hedged item is recorded in the consolidated income statements.
At December 31, 2015, the Company paid a net premium of Ps. 75 millions for the following outstanding call options to purchase foreign currency:
Fair Value Liability Fair Value Asset Notional December 31, December 31, Maturity Date Amount 2015 2015
2016 Ps. 1,612 Ps. - Ps. 65
At December 31, 2014, the Company had the following outstanding collars agreements to purchase foreign currency:
Fair Value Liability Fair Value Asset Notional December 31, December 31, Maturity Date Amount 2014 2014
2015 Ps. 402 Ps. - Ps. 56
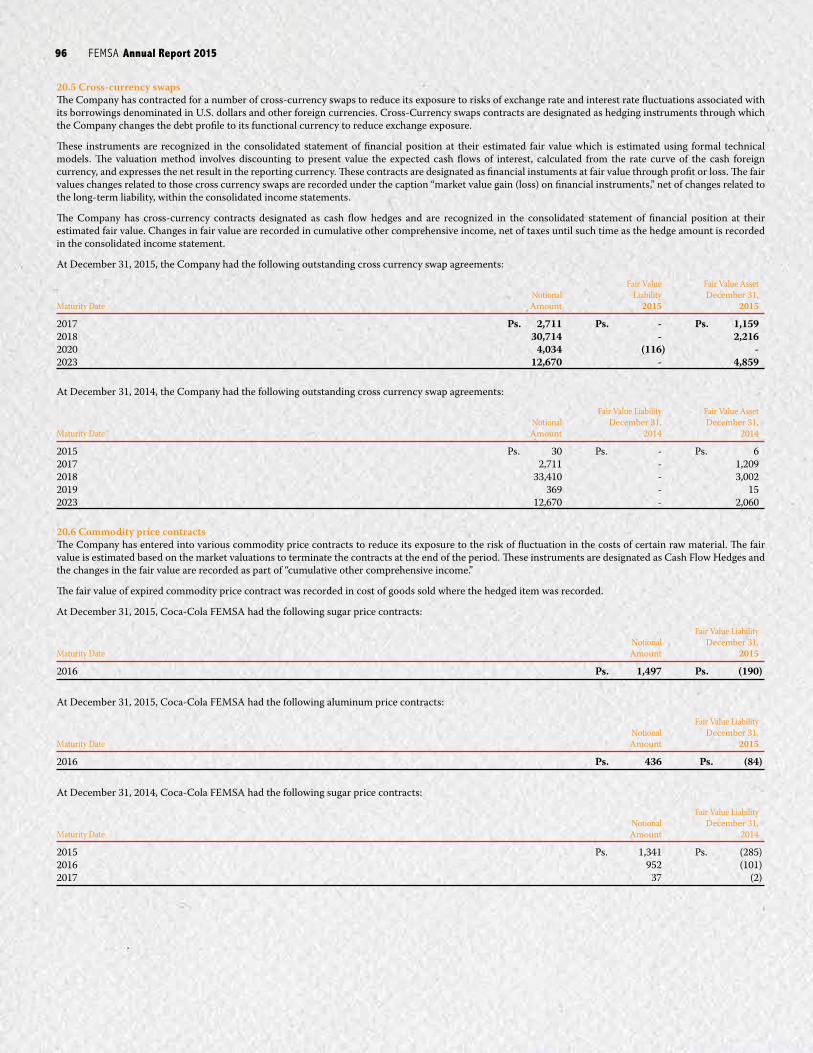
FEMSA Annual Report 2015 9796 creating stories
20.5 Cross-currency swapsThe Company has contracted for a number of cross-currency swaps to reduce its exposure to risks of exchange rate and interest rate fluctuations associated with its borrowings denominated in U.S. dollars and other foreign currencies. Cross-Currency swaps contracts are designated as hedging instruments through which the Company changes the debt profile to its functional currency to reduce exchange exposure.
These instruments are recognized in the consolidated statement of financial position at their estimated fair value which is estimated using formal technical models. The valuation method involves discounting to present value the expected cash flows of interest, calculated from the rate curve of the cash foreign currency, and expresses the net result in the reporting currency. These contracts are designated as financial instuments at fair value through profit or loss. The fair values changes related to those cross currency swaps are recorded under the caption “market value gain (loss) on financial instruments,” net of changes related to the long-term liability, within the consolidated income statements.
The Company has cross-currency contracts designated as cash flow hedges and are recognized in the consolidated statement of financial position at their estimated fair value. Changes in fair value are recorded in cumulative other comprehensive income, net of taxes until such time as the hedge amount is recorded in the consolidated income statement.
At December 31, 2015, the Company had the following outstanding cross currency swap agreements:
Fair Value Fair Value Asset Notional Liability December 31, Maturity Date Amount 2015 2015
2017 Ps. 2,711 Ps. - Ps. 1,1592018 30,714 - 2,2162020 4,034 (116) -2023 12,670 - 4,859
At December 31, 2014, the Company had the following outstanding cross currency swap agreements:
Fair Value Liability Fair Value Asset Notional December 31, December 31, Maturity Date Amount 2014 2014
2015 Ps. 30 Ps. - Ps. 62017 2,711 - 1,2092018 33,410 - 3,0022019 369 - 152023 12,670 - 2,060
20.6 Commodity price contractsThe Company has entered into various commodity price contracts to reduce its exposure to the risk of fluctuation in the costs of certain raw material. The fair value is estimated based on the market valuations to terminate the contracts at the end of the period. These instruments are designated as Cash Flow Hedges and the changes in the fair value are recorded as part of “cumulative other comprehensive income.”
The fair value of expired commodity price contract was recorded in cost of goods sold where the hedged item was recorded.
At December 31, 2015, Coca-Cola FEMSA had the following sugar price contracts:
Fair Value Liability Notional December 31, Maturity Date Amount 2015
2016 Ps. 1,497 Ps. (190)
At December 31, 2015, Coca-Cola FEMSA had the following aluminum price contracts:
Fair Value Liability Notional December 31, Maturity Date Amount 2015
2016 Ps. 436 Ps. (84)
At December 31, 2014, Coca-Cola FEMSA had the following sugar price contracts:
Fair Value Liability Notional December 31, Maturity Date Amount 2014
2015 Ps. 1,341 Ps. (285)2016 952 (101)2017 37 (2)
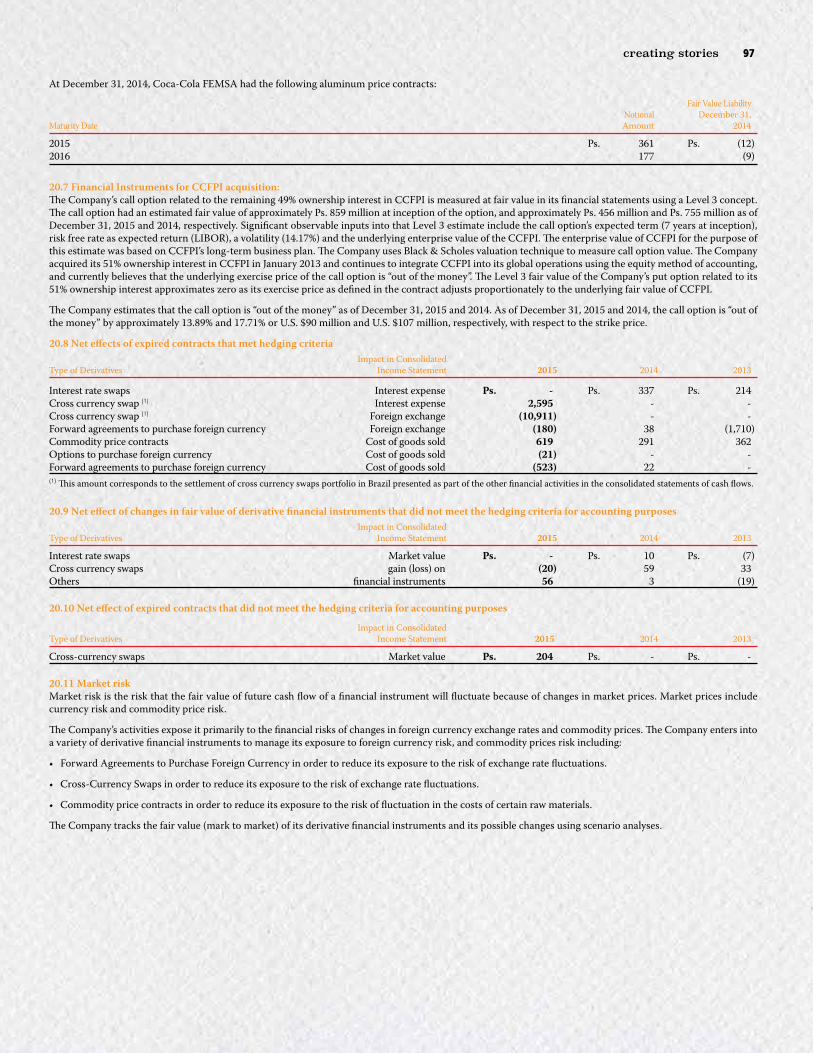
FEMSA Annual Report 2015 9796 creating stories
At December 31, 2014, Coca-Cola FEMSA had the following aluminum price contracts:
Fair Value Liability Notional December 31, Maturity Date Amount 2014
2015 Ps. 361 Ps. (12)2016 177 (9)
20.7 Financial Instruments for CCFPI acquisition:The Company’s call option related to the remaining 49% ownership interest in CCFPI is measured at fair value in its financial statements using a Level 3 concept. The call option had an estimated fair value of approximately Ps. 859 million at inception of the option, and approximately Ps. 456 million and Ps. 755 million as of December 31, 2015 and 2014, respectively. Significant observable inputs into that Level 3 estimate include the call option’s expected term (7 years at inception), risk free rate as expected return (LIBOR), a volatility (14.17%) and the underlying enterprise value of the CCFPI. The enterprise value of CCFPI for the purpose of this estimate was based on CCFPI’s long-term business plan. The Company uses Black & Scholes valuation technique to measure call option value. The Company acquired its 51% ownership interest in CCFPI in January 2013 and continues to integrate CCFPI into its global operations using the equity method of accounting, and currently believes that the underlying exercise price of the call option is “out of the money”. The Level 3 fair value of the Company’s put option related to its 51% ownership interest approximates zero as its exercise price as defined in the contract adjusts proportionately to the underlying fair value of CCFPI.
The Company estimates that the call option is “out of the money” as of December 31, 2015 and 2014. As of December 31, 2015 and 2014, the call option is “out of the money” by approximately 13.89% and 17.71% or U.S. $90 million and U.S. $107 million, respectively, with respect to the strike price.
20.8 Net effects of expired contracts that met hedging criteria Impact in Consolidated Type of Derivatives Income Statement 2015 2014 2013
Interest rate swaps Interest expense Ps. - Ps. 337 Ps. 214Cross currency swap (1) Interest expense 2,595 - -Cross currency swap (1) Foreign exchange (10,911) - -Forward agreements to purchase foreign currency Foreign exchange (180) 38 (1,710)Commodity price contracts Cost of goods sold 619 291 362Options to purchase foreign currency Cost of goods sold (21) - -Forward agreements to purchase foreign currency Cost of goods sold (523) 22 -(1) This amount corresponds to the settlement of cross currency swaps portfolio in Brazil presented as part of the other financial activities in the consolidated statements of cash flows.
20.9 Net effect of changes in fair value of derivative financial instruments that did not meet the hedging criteria for accounting purposes Impact in Consolidated Type of Derivatives Income Statement 2015 2014 2013
Interest rate swaps Market value Ps. - Ps. 10 Ps. (7)Cross currency swaps gain (loss) on (20) 59 33Others financial instruments 56 3 (19)
20.10 Net effect of expired contracts that did not meet the hedging criteria for accounting purposes
Impact in Consolidated Type of Derivatives Income Statement 2015 2014 2013
Cross-currency swaps Market value Ps. 204 Ps. - Ps. -
20.11 Market riskMarket risk is the risk that the fair value of future cash flow of a financial instrument will fluctuate because of changes in market prices. Market prices include currency risk and commodity price risk.
The Company’s activities expose it primarily to the financial risks of changes in foreign currency exchange rates and commodity prices. The Company enters into a variety of derivative financial instruments to manage its exposure to foreign currency risk, and commodity prices risk including:
• Forward Agreements to Purchase Foreign Currency in order to reduce its exposure to the risk of exchange rate fluctuations.
• Cross-Currency Swaps in order to reduce its exposure to the risk of exchange rate fluctuations.
• Commodity price contracts in order to reduce its exposure to the risk of fluctuation in the costs of certain raw materials.
The Company tracks the fair value (mark to market) of its derivative financial instruments and its possible changes using scenario analyses.
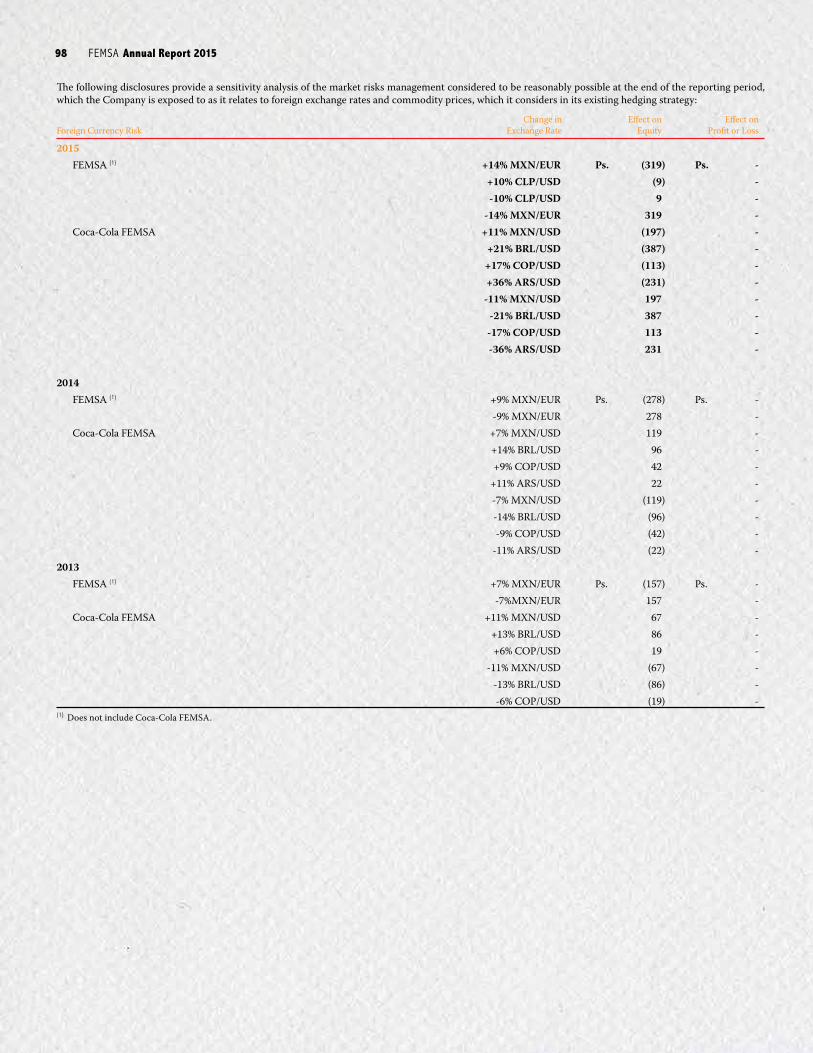
FEMSA Annual Report 2015 9998 creating stories
The following disclosures provide a sensitivity analysis of the market risks management considered to be reasonably possible at the end of the reporting period, which the Company is exposed to as it relates to foreign exchange rates and commodity prices, which it considers in its existing hedging strategy:
Change in Effect on Effect on Foreign Currency Risk Exchange Rate Equity Profit or Loss
2015 FEMSA (1) +14% MXN/EUR Ps. (319) Ps. - +10% CLP/USD (9) - -10% CLP/USD 9 - -14% MXN/EUR 319 - Coca-Cola FEMSA +11% MXN/USD (197) - +21% BRL/USD (387) - +17% COP/USD (113) - +36% ARS/USD (231) - -11% MXN/USD 197 - -21% BRL/USD 387 - -17% COP/USD 113 - -36% ARS/USD 231 -
2014 FEMSA (1) +9% MXN/EUR Ps. (278) Ps. - -9% MXN/EUR 278 - Coca-Cola FEMSA +7% MXN/USD 119 - +14% BRL/USD 96 - +9% COP/USD 42 - +11% ARS/USD 22 - -7% MXN/USD (119) - -14% BRL/USD (96) - -9% COP/USD (42) - -11% ARS/USD (22) -2013 FEMSA (1) +7% MXN/EUR Ps. (157) Ps. - -7%MXN/EUR 157 - Coca-Cola FEMSA +11% MXN/USD 67 - +13% BRL/USD 86 - +6% COP/USD 19 - -11% MXN/USD (67) - -13% BRL/USD (86) - -6% COP/USD (19) -(1) Does not include Coca-Cola FEMSA.
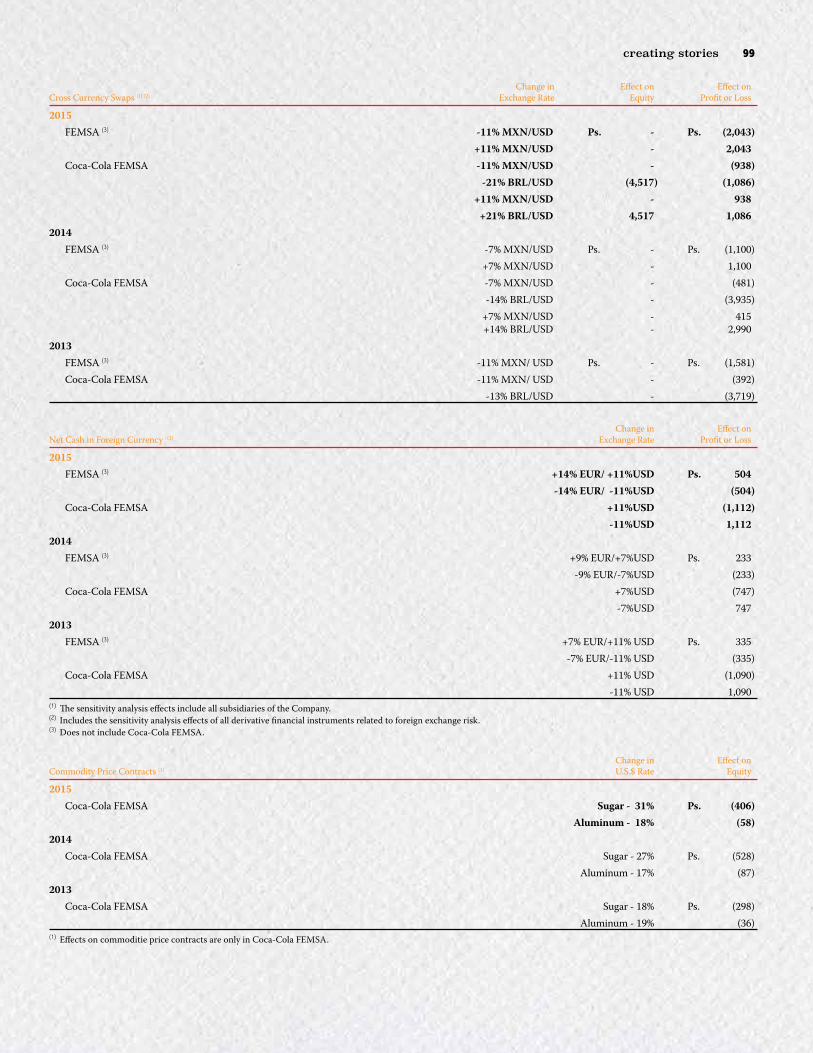
FEMSA Annual Report 2015 9998 creating stories
Change in Effect on Effect on Cross Currency Swaps (1) (2) Exchange Rate Equity Profit or Loss
2015 FEMSA (3) -11% MXN/USD Ps. - Ps. (2,043) +11% MXN/USD - 2,043 Coca-Cola FEMSA -11% MXN/USD - (938) -21% BRL/USD (4,517) (1,086) +11% MXN/USD - 938 +21% BRL/USD 4,517 1,0862014 FEMSA (3) -7% MXN/USD Ps. - Ps. (1,100) +7% MXN/USD - 1,100 Coca-Cola FEMSA -7% MXN/USD - (481) -14% BRL/USD - (3,935) +7% MXN/USD - 415 +14% BRL/USD - 2,9902013 FEMSA (3) -11% MXN/ USD Ps. - Ps. (1,581) Coca-Cola FEMSA -11% MXN/ USD - (392) -13% BRL/USD - (3,719)
Change in Effect on Net Cash in Foreign Currency (1) Exchange Rate Profit or Loss
2015 FEMSA (3) +14% EUR/ +11%USD Ps. 504 -14% EUR/ -11%USD (504) Coca-Cola FEMSA +11%USD (1,112) -11%USD 1,1122014 FEMSA (3) +9% EUR/+7%USD Ps. 233 -9% EUR/-7%USD (233) Coca-Cola FEMSA +7%USD (747) -7%USD 7472013 FEMSA (3) +7% EUR/+11% USD Ps. 335 -7% EUR/-11% USD (335) Coca-Cola FEMSA +11% USD (1,090) -11% USD 1,090(1) The sensitivity analysis effects include all subsidiaries of the Company.(2) Includes the sensitivity analysis effects of all derivative financial instruments related to foreign exchange risk.(3) Does not include Coca-Cola FEMSA.
Change in Effect on Commodity Price Contracts (1) U.S.$ Rate Equity
2015 Coca-Cola FEMSA Sugar - 31% Ps. (406) Aluminum - 18% (58)2014 Coca-Cola FEMSA Sugar - 27% Ps. (528) Aluminum - 17% (87)2013 Coca-Cola FEMSA Sugar - 18% Ps. (298) Aluminum - 19% (36)(1) Effects on commoditie price contracts are only in Coca-Cola FEMSA.

FEMSA Annual Report 2015 101100 creating stories
20.12 Interest rate riskInterest rate risk is the risk that the fair value or future cash flow of a financial instrument will fluctuate because of changes in market interest rates.
The Company is exposed to interest rate risk because it and its subsidiaries borrow funds at both fixed and variable interest rates. The risk is managed by the Company by maintaining an appropriate mix between fixed and variable rate borrowings, and by the use of the different derivative financial instruments. Hedging activities are evaluated regularly to align with interest rate views and defined risk appetite, ensuring the most cost-effective hedging strategies are applied.
The following disclosures provide a sensitivity analysis of the interest rate risks management considered to be reasonably possible at the end of the reporting period, which the Company is exposed to as it relates to its fixed and floating rate borrowings, which it considers in its existing hedging strategy:
Change in Effect on Interest Rate Swap (1) Bps. Equity
2015 FEMSA(2) (100 Bps.) Ps. (542) Coca-Cola FEMSA - -2014 FEMSA(2) (100 Bps.) Ps. (528) Coca-Cola FEMSA - -2013 FEMSA(2) - - Coca-Cola FEMSA (100 Bps.) Ps. (32)(1) The sensitivity analysis effects include all subsidiaries of the Company.(2) Does not include Coca-Cola FEMSA.
Interest Effect of Unhedged Portion Bank Loans 2015 2014 2013
Change in interest rate +100 Bps. +100 Bps. +100 Bps.Effect on profit loss Ps. (192) Ps. (244) Ps. (332)
20.13 Liquidity riskEach of the Company’s sub-holding companies generally finances its operational and capital requirements on an independent basis. As of December 31, 2015 and 2014, 82.66% and 80.66%, respectively of the Company’s outstanding consolidated total indebtedness was at the level of its sub-holding companies. This structure is attributable, in part, to the inclusion of third parties in the capital structure of Coca-Cola FEMSA. Currently, the Company’s management expects to continue financing its operations and capital requirements when it is considering domestic funding at the level of its sub-holding companies, otherwise; it is generally more convenient that its foreign operations would be financed directly through the Company because of better market conditions obtained by itself. Nonetheless, sub-holdings companies may decide to incur indebtedness in the future to finance their own operations and capital requirements of the Company’s subsidiaries or significant acquisitions, investments or capital expenditures. As a holding company, the Company depends on dividends and other distributions from its subsidiaries to service the Company’s indebtedness.
The Company’s principal source of liquidity has generally been cash generated from its operations. The Company has traditionally been able to rely on cash generated from operations because a significant majority of the sales of Coca-Cola FEMSA and FEMSA Comercio are on a cash or short-term credit basis, and FEMSA Comercio’s OXXO stores are able to finance a significant portion of their initial and ongoing inventories with supplier credit. The Company’s principal use of cash has generally been for capital expenditure programs, acquisitions, debt repayment and dividend payments.
Ultimate responsibility for liquidity risk management rests with the Company’s board of directors, which has established an appropriate liquidity risk management framework for the management of the Company’s short-, medium- and long-term funding and liquidity requirements. The Company manages liquidity risk by maintaining adequate reserves and continuously monitoring forecast and actual cash flows, and with a low concentration of maturities per year.
The Company has access to credit from national and international bank institutions in order to meet treasury needs; besides, the Company has the highest rating for Mexican companies (AAA) given by independent rating agencies, allowing the Company to evaluate capital markets in case it needs resources.
As part of the Company’s financing policy, management expects to continue financing its liquidity needs with cash from operations. Nonetheless, as a result of regulations in certain countries in which the Company operates, it may not be beneficial or, as in the case of exchange controls in Venezuela, practicable to remit cash generated in local operations to fund cash requirements in other countries. Exchange controls like those in Venezuela may also increase the real price of remitting cash from operations to fund debt requirements in other countries. In the event that cash from operations in these countries is not sufficient to fund future working capital requirements and capital expenditures, management may decide, or be required, to fund cash requirements in these countries through local borrowings rather than remitting funds another country. In addition, the Company’s liquidity in Venezuela could be affected by changes in the rules applicable to exchange rates as well as other regulations, such as exchange controls. In the future the Company management may finance its working capital and capital expenditure needs with short-term or other borrowings.
The Company’s management continuously evaluates opportunities to pursue acquisitions or engage in joint ventures or other transactions. We would expect to finance any significant future transactions with a combination of cash from operations, long-term indebtedness and capital stock.
The Company’s sub-holding companies generally incur short-term indebtedness in the event that they are temporarily unable to finance operations or meet any capital requirements with cash from operations. A significant decline in the business of any of the Company’s sub-holding companies may affect the sub-holding company’s ability to fund its capital requirements. A significant and prolonged deterioration in the economies in which we operate or in the Company’s businesses may affect the Company’s ability to obtain short-term and long-term credit or to refinance existing indebtedness on terms satisfactory to the Company’s management.
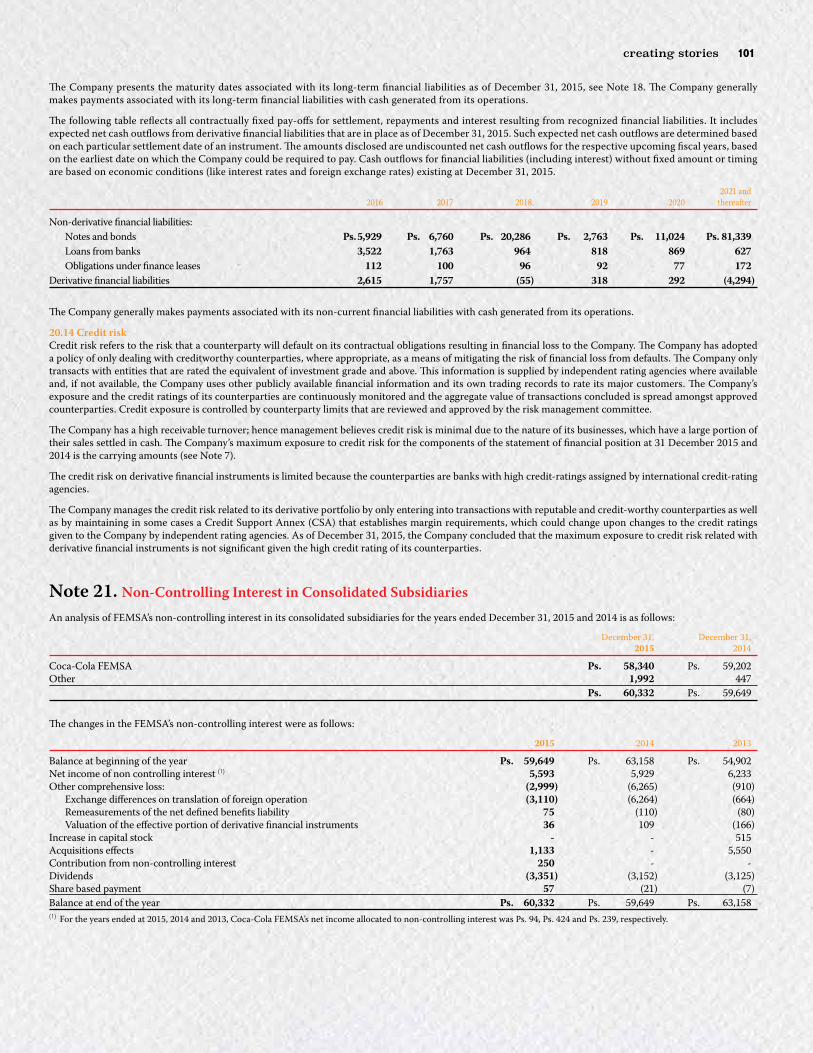
FEMSA Annual Report 2015 101100 creating stories
The Company presents the maturity dates associated with its long-term financial liabilities as of December 31, 2015, see Note 18. The Company generally makes payments associated with its long-term financial liabilities with cash generated from its operations.
The following table reflects all contractually fixed pay-offs for settlement, repayments and interest resulting from recognized financial liabilities. It includes expected net cash outflows from derivative financial liabilities that are in place as of December 31, 2015. Such expected net cash outflows are determined based on each particular settlement date of an instrument. The amounts disclosed are undiscounted net cash outflows for the respective upcoming fiscal years, based on the earliest date on which the Company could be required to pay. Cash outflows for financial liabilities (including interest) without fixed amount or timing are based on economic conditions (like interest rates and foreign exchange rates) existing at December 31, 2015.
2021 and 2016 2017 2018 2019 2020 thereafter
Non-derivative financial liabilities: Notes and bonds Ps. 5,929 Ps. 6,760 Ps. 20,286 Ps. 2,763 Ps. 11,024 Ps. 81,339 Loans from banks 3,522 1,763 964 818 869 627 Obligations under finance leases 112 100 96 92 77 172Derivative financial liabilities 2,615 1,757 (55) 318 292 (4,294)
The Company generally makes payments associated with its non-current financial liabilities with cash generated from its operations.
20.14 Credit riskCredit risk refers to the risk that a counterparty will default on its contractual obligations resulting in financial loss to the Company. The Company has adopted a policy of only dealing with creditworthy counterparties, where appropriate, as a means of mitigating the risk of financial loss from defaults. The Company only transacts with entities that are rated the equivalent of investment grade and above. This information is supplied by independent rating agencies where available and, if not available, the Company uses other publicly available financial information and its own trading records to rate its major customers. The Company’s exposure and the credit ratings of its counterparties are continuously monitored and the aggregate value of transactions concluded is spread amongst approved counterparties. Credit exposure is controlled by counterparty limits that are reviewed and approved by the risk management committee.
The Company has a high receivable turnover; hence management believes credit risk is minimal due to the nature of its businesses, which have a large portion of their sales settled in cash. The Company’s maximum exposure to credit risk for the components of the statement of financial position at 31 December 2015 and 2014 is the carrying amounts (see Note 7).
The credit risk on derivative financial instruments is limited because the counterparties are banks with high credit-ratings assigned by international credit-rating agencies.
The Company manages the credit risk related to its derivative portfolio by only entering into transactions with reputable and credit-worthy counterparties as well as by maintaining in some cases a Credit Support Annex (CSA) that establishes margin requirements, which could change upon changes to the credit ratings given to the Company by independent rating agencies. As of December 31, 2015, the Company concluded that the maximum exposure to credit risk related with derivative financial instruments is not significant given the high credit rating of its counterparties.
Note 21. Non-Controlling Interest in Consolidated SubsidiariesAn analysis of FEMSA’s non-controlling interest in its consolidated subsidiaries for the years ended December 31, 2015 and 2014 is as follows:
December 31, December 31, 2015 2014
Coca-Cola FEMSA Ps. 58,340 Ps. 59,202Other 1,992 447 Ps. 60,332 Ps. 59,649
The changes in the FEMSA’s non-controlling interest were as follows:
2015 2014 2013
Balance at beginning of the year Ps. 59,649 Ps. 63,158 Ps. 54,902Net income of non controlling interest (1) 5,593 5,929 6,233Other comprehensive loss: (2,999) (6,265) (910) Exchange differences on translation of foreign operation (3,110) (6,264) (664) Remeasurements of the net defined benefits liability 75 (110) (80) Valuation of the effective portion of derivative financial instruments 36 109 (166)Increase in capital stock - - 515Acquisitions effects 1,133 - 5,550Contribution from non-controlling interest 250 - -Dividends (3,351) (3,152) (3,125)Share based payment 57 (21) (7)Balance at end of the year Ps. 60,332 Ps. 59,649 Ps. 63,158(1) For the years ended at 2015, 2014 and 2013, Coca-Cola FEMSA’s net income allocated to non-controlling interest was Ps. 94, Ps. 424 and Ps. 239, respectively.

FEMSA Annual Report 2015 103102 creating stories
Non controlling cumulative other comprehensive loss is comprised as follows:
December 31, December 31, 2015 2014
Exchange differences on translation foreign operation Ps. (9,436) Ps. (6,326)Remeasurements of the net defined benefits liability (241) (316)Valuation of the effective portion of derivative financial instruments (93) (129)Cumulative other comprehensive loss Ps. (9,770) Ps. (6,771)
Coca-Cola FEMSA shareholders, especially the Coca-Cola Company which hold Series D shares, have some protective rights about investing in or disposing of significant businesses. However, these rights do not limit the continued normal operations of Coca-Cola FEMSA.
Summarized financial information in respect of Coca-Cola FEMSA is set out below.
December 31, December 31, 2015 2014
Total current assets Ps. 40,717 Ps. 38,128Total non-current assets 168,536 174,238Total current liabilities 29,484 28,403Total non-current liabilities 71,034 73,845Total revenue Ps. 152,360 Ps. 147,298Total consolidated net income 10,329 10,966Total consolidated comprehensive income Ps. 5,033 Ps. (1,005)Net cash flow from operating activities 23,519 24,406Net cash flow from used in investing activities (10,945) (11,137)Net cash flow from financing activities (8,567) (11,350)
Note 22. Equity22.1 Equity accountsThe capital stock of FEMSA is comprised of 2,161,177,770 BD units and 1,417,048,500 B units.
As of December 31, 2015 and 2014, the capital stock of FEMSA was comprised 17,891,131,350 common shares, without par value and with no foreign ownership restrictions. Fixed capital stock amounts to Ps. 300 (nominal value) and the variable capital may not exceed 10 times the minimum fixed capital stock amount.
The characteristics of the common shares are as follows:
• Series “B” shares, with unlimited voting rights, which at all times must represent a minimum of 51% of total capital stock;
• Series “L” shares, with limited voting rights, which may represent up to 25% of total capital stock; and
• Series “D” shares, with limited voting rights, which individually or jointly with series “L” shares may represent up to 49% of total capital stock.
The Series “D” shares are comprised as follows:
• Subseries “D-L” shares may represent up to 25% of the series “D” shares;
• Subseries “D-B” shares may comprise the remainder of outstanding series “D” shares; and
• The non-cumulative premium dividend to be paid to series “D” shareholders will be 125% of any dividend paid to series “B” shareholders.
The Series “B” and “D” shares are linked together in related units as follows:
• “B units” each of which represents five series “B” shares and which are traded on the BMV; and
• “BD units” each of which represents one series “B” share, two subseries “D-B” shares and two subseries “D-L” shares, and which are traded both on the BMV and the NYSE.
As of December 31, 2015 and 2014, FEMSA’s capital stock is comprised as follows:
“B” Units “BD” Units Total
Units 1,417,048,500 2,161,177,770 3,578,226,270Shares: Series “B” 7,085,242,500 2,161,177,770 9,246,420,270 Series “D” - 8,644,711,080 8,644,711,080 Subseries “D-B” - 4,322,355,540 4,322,355,540 Subseries “D-L” - 4,322,355,540 4,322,355,540Total shares 7,085,242,500 10,805,888,850 17,891,131,350
The net income of the Company is subject to the legal requirement that 5% thereof be transferred to a legal reserve until such reserve equals 20% of capital stock at nominal value. This reserve may not be distributed to shareholders during the existence of the Company, except as a stock dividend. As of December 31, 2015 and 2014, this reserve amounted to Ps. 596.

FEMSA Annual Report 2015 103102 creating stories
Retained earnings and other reserves distributed as dividends, as well as the effects derived from capital reductions, are subject to income tax at the rate in effect at the date of distribution, except when capital reductions come from restated shareholder contributions and when the distributions of dividends come from net taxable income, denominated “Cuenta de Utilidad Fiscal Neta” (“CUFIN”).
Dividends paid in excess of CUFIN are subject to income tax at a grossed-up rate based on the current statutory rate. Since 2003, this tax may be credited against the income tax of the year in which the dividends are paid, and in the following two years against the income tax and estimated tax payments. Due to the Mexican Tax Reform, a new Income Tax Law (LISR) went into effect on January 1, 2014. Such law no longer includes the tax consolidation regime which allowed calculating the CUFIN on a consolidated basis; therefore, beginning in 2014, distributed dividends must be taken from the individual CUFIN balance of FEMSA, which can be increased with the subsidiary companies’ individual CUFINES through the transfers of dividends. The sum of the individual CUFIN balances of FEMSA and its subsidiaries as of December 31, 2015 amounted to Ps. 91,248.
In addition, the new LISR sets forth that entities that distribute dividends to its stockholders who are individuals and foreign residents must withhold 10% thereof for ISR purposes, which will be paid in Mexico. The foregoing will not be applicable when distributed dividends arise from the accumulated CUFIN balances as December 31, 2013.
At an ordinary shareholders’ meeting of FEMSA held on March 15, 2013, the shareholders approved a dividend of Ps. 6,684 that was paid 50% on May 7, 2013 and other 50% on November 7, 2013; and a reserve for share repurchase of a maximum of Ps. 3,000. As of December 31, 2014, the Company has not repurchased shares. Treasury shares resulted from share-based payment bonus plan are disclosed in Note 17.
At an ordinary shareholders’ meeting of FEMSA held on December 6, 2013, the shareholders approved a dividend of Ps. 6,684 that was paid on December 18, 2013.
At an ordinary shareholders’ meeting of Coca-Cola FEMSA held on March 5, 2013, the shareholders approved a dividend of Ps. 5,950 that was paid 50% on May 2, 2013 and other 50% on November 5, 2013. The corresponding payment to the non-controlling interest was Ps. 3,073.
At an ordinary shareholders’ meeting of Coca-Cola FEMSA held on March 6, 2014, the shareholders approved a dividend of Ps. 6,012 that was paid 50% on May 4, 2014 and other 50% on November 5, 2014. The corresponding payment to the non-controlling interest was Ps. 3,134.
At an ordinary shareholders’ meeting of FEMSA held on March 19, 2015, the shareholders approved a dividend of Ps. 7,350 that was paid 50% on May 7, 2015 and other 50% on November 5, 2015; and a reserve for share repurchase of a maximum of Ps. 3,000. As of December 31, 2015, the Company has not repurchased shares. Treasury shares resulted from share-based payment bonus plan are disclosed in Note 17.
At an ordinary shareholders’ meeting of Coca-Cola FEMSA held on March 12, 2015, the shareholders approved a dividend of Ps. 6,405 that was paid 50% on May 5, 2015 and other 50% on November 3, 2015. The corresponding payment to the non-controlling interest was Ps. 3,340.
For the years ended December 31, 2015, 2014 and 2013 the dividends declared and paid by the Company and Coca-Cola FEMSA were as follows:
2015 2014 2013
FEMSA Ps. 7,350 Ps. - Ps. 13,368Coca-Cola FEMSA (100% of dividend) 6,405 6,012 5,950
For the years ended December 31, 2015 and 2014 the dividends declared and paid per share by the Company are as follows:
Series of Shares 2015 2014
“B” Ps. 0.36649 Ps. -“D” 0.45811 -
22.2 Capital managementThe Company manages its capital to ensure that its subsidiaries will be able to continue as going concerns while maximizing the return to shareholders through the optimization of its debt and equity balance in order to obtain the lowest cost of capital available. The Company manages its capital structure and makes adjustments to it in light of changes in economic conditions. To maintain or adjust the capital structure, the Company may adjust the dividend payment to shareholders, return capital to shareholders or issue new shares. No changes were made in the objectives, policies or processes for managing capital during the years ended December 31, 2015 and 2014.
The Company is not subject to any externally imposed capital requirements, other than the legal reserve (see Note 22.1) and debt covenants (see Note 18).
The Company’s finance committee reviews the capital structure of the Company on a quarterly basis. As part of this review, the committee considers the cost of capital and the risks associated with each class of capital. In conjunction with this objective, the Company seeks to maintain the highest credit rating both nationally and internationally and is currently rated AAA in Mexico and BBB+ in the United States, which requires it to have a debt to earnings before interest, taxes, depreciation and amortization (“EBITDA”) ratio lower than 2. As a result, prior to entering into new business ventures, acquisitions or divestures, management evaluates the optimal ratio of debt to EBITDA in order to maintain its credit rating.

FEMSA Annual Report 2015 105104 creating stories
Note 23. Earnings per ShareBasic earnings per share amounts are calculated by dividing consolidated net income for the year attributable to controlling interest by the weighted average number of shares outstanding during the period adjusted for the weighted average of own shares purchased in the period.
Diluted earnings per share amounts are calculated by dividing consolidated net income for the year attributable to controlling interest by the weighted average number of shares outstanding during the period plus the weighted average number of shares for the effects of dilutive potential shares (originated by the Company’s share based payment program).
2015 2014 2013
Per Series Per Series Per Series Per Series Per Series Per Series “B” Shares “D” Shares “B” Shares “D” Shares “B” Shares “D” Shares
Shares expressed in millions: Weighted average number of shares for basic earnings per share 9,241.91 8,626.69 9,240.54 8,621.18 9,238.69 8,613.80 Effect of dilution associated with non-vested shares for share based payment plans 4.51 18.02 5.88 23.53 7.73 30.91 Weighted average number of shares adjusted for the effect of dilution (Shares outstanding) 9,246.42 8,644.71 9,246.42 8,644.71 9,246.42 8,644.71 Dividend rights per series (see note 22.1) 100% 125% 100% 125% 100% 125% Weighted average number of shares further adjusted to reflect dividend rights 9,246.42 10,805.89 9,246.42 10,805.89 9,246.42 10,805.89 Allocation of earnings, weighted 46.11% 53.89% 46.11% 53.89% 46.11% 53.89% Net Controlling Interest Income Allocated Ps. 8,153.84 Ps. 9,529.04 Ps. 7,701.08 Ps. 8,999.92 Ps. 7,341.74 Ps. 8,579.98
Note 24. Income TaxesIn December of 2013, the Mexican government enacted a package of tax reforms (the “2014 Tax Reform”) which includes several significant changes to tax laws, discussed in further detail below, entering into effect on January 1, 2014. The following changes are expected to most significantly impact the Company’s financial position and results of operations:
• The introduction of a new withholding tax at the rate of 10% for dividends and/or distributions of earnings generated in 2014 and beyond;
• A fee of one Mexican peso per liter on the sale and import of flavored beverages with added sugar, and an excise tax of 8% on food with caloric content equal to, or greater than 275 kilocalories per 100 grams of product;
• The prior 11% value added tax (VAT) rate that applied to transaction in the border region was raised to 16%, matching the general VAT rate applicable in the rest of Mexico;
• The elimination of the tax on cash deposits (IDE) and the business flat tax (IETU);
• Deductions on exempt payroll items for workers are limited to 53%;
• The income tax rate in 2013 was 30%. Scheduled decreases to the income tax rate that would have reduced the rate to 29% in 2014 and 28% in 2015 and thereafter, were canceled in connection with the 2014 Tax Reform;
• The repeal of the existing tax consolidation regime, which was effective as of January 1, 2014, modified the payment term of a tax on assets payable of Ps. 180, which will be paid over the following 5 years instead of an indefinite term. Additionally, deferred tax assets and liabilities associated with the Company’s subsidiaries in Mexico are no longer offset as of December 31, 2015 and 2014, as the future income tax balances are expected to reverse in periods where the Company is no longer consolidating these entities for tax purposes and the right of offset does not exist; and
• The introduction of an new optional tax integration regime (a modified form of tax consolidation), which replaces the previous tax consolidation regime. The new optional tax integration regime requires an equity ownership of at least 80% for qualifying subsidiaries and would allow the Company to defer the annual tax payment of its profitable participating subsidiaries for a period equivalent to 3 years to the extent their individual tax expense exceeds the integrated tax expense of the Company.
The impacts of the 2014 Tax Reform on the Company’s financial position and results of operations as of and for the year ended December 31, 2013, resulted from the repeal of the tax consolidation regime as described above regarding the payable of Ps. 180 and the effects of the changes in tax rates on deferred tax assets and liabilities as disclosed below, which was recognized in earnings in 2013.
On November 18, 2014, a tax reform became effective in Venezuela. This reform included changes on how the carrying value of operating losses is reported. The reform established that operating losses carried forward year over year (but limited to three fiscal years) may not exceed 25% of the taxable income in the relevant period. The reform also eliminated the possibility to carry over losses relating to inflationary adjustments and included changes that grant Venezuelan tax authorities broader powers and authority in connection with their ability to enact administrative rulings related to income tax withholding and to collect taxes and increase fines and penalties for tax-related violations, including the ability to confiscate assets without a court order.
On December 30, 2015, the Venezuelan government published a tax reform for 2016 which establishes: (i) a new tax on financial transactions that will be effective beginning February 1, 2016, for those identified as “special taxpayers” at a rate of 0.75% over certain financial transactions, including bank withdraws, transfers of bonds and securities, payments of debts not utilizing a bank account and forgiveness of debt; and (ii) elimination of inflationary effects on calculations of income tax.

FEMSA Annual Report 2015 105104 creating stories
In Guatemala, the income tax rate for 2014 was 28.0% and it decreased for 2015 to 25.0%, as scheduled.
In 2009, Nicaragua established rules related with transfer pricing. This obligation originally would be effective on January 1, 2016, but the National Assembly passed an amendment to postpone the measure until June 30, 2017.
In Brazil, since July 2015, all the financial revenues (except exchange variance) have been subjected to Federal Social Contributions at the rate of 4.65%.
Also in Brazil, starting 2016 the rates of value-added tax in certain states will be changed as follows: Mato Grosso do Sul – from 17% to 20%; Minas Gerais - the tax rate will remain at 18% but there will be an additional 2% as a contribution to poverty eradication just for the sales to non-taxpayer (final consumers); Rio de Janeiro - the contribution related to poverty eradication fund will be increased from 1% to 2% effectively in April; Paraná - the rate will be reduced to 16% but a rate of 2% as a contribution to poverty eradication will be charged on sales to non-taxpayers.
Additionally in Brazil, starting on January 1st, 2016, the rates of federal production tax will be reduced and the rates of the federal sales tax will be increased. Coca-Cola FEMSA estimates the average of these taxes over the net sales would move from 14.4% in 2015 to 15.5% in 2016.
24.1 Income TaxThe major components of income tax expense for the years ended December 31, 2015, 2014 and 2013 are:
2015 2014 2013
Current tax expense Ps. 9,879 Ps. 7,810 Ps. 7,855Deferred tax expense: Origination and reversal of temporary differences 826 1,303 257 (Recognition) application of tax losses (2,789) (2,874) (212)Total deferred tax (income) expense (1,963) (1,571) 45Change in the statutory rate (1) 16 14 (144) Ps. 7,932 Ps. 6,253 Ps. 7,756(1) Effect in 2013 because of 2014 Mexican Tax Reform.
Recognized in Consolidated Statement of Other Comprehensive Income (OCI)
Income tax related to items charged or recognized directly in OCI during the year: 2015 2014 2013
Unrealized loss (gain) on cash flow hedges Ps. 93 Ps. 219 Ps. (128)Unrealized gain on available for sale securities - - (1)Exchange differences on translation of foreign operations 1,699 (60) 1,384Remeasurements of the net defined benefit liability 49 (49) (56)Share of the other comprehensive income of associates and joint ventures 193 189 (1,203)Total income tax cost (benefit) recognized in OCI Ps. 2,034 Ps. 299 Ps. (4)
A reconciliation between tax expense and income before income taxes and share of the profit or loss of associates and joint ventures accounted for using the equity method multiplied by the Mexican domestic tax rate for the years ended December 31, 2015, 2014 and 2013 is as follows:
2015 2014 2013
Mexican statutory income tax rate 30.0% 30.0% 30.0%Difference between book and tax inflationary values and translation effects (1.3%) (3.1%) (0.2%)Annual inflation tax adjustment (1.5%) (4.4%) (1.2%)Difference between statutory income tax rates 0.4% 0.9% 1.2%Non-deductible expenses 3.3% 3.7% 1.0%Taxable (non-taxable) income, net (0.3%) (1.1%) 0.7%Change in the statutory Mexican tax rate 0.1% 0.1% (0.6%)Others 0.8% 0.2% - 31.5% 26.3% 30.9%

FEMSA Annual Report 2015 107106 creating stories
Deferred Income Tax Related to: Consolidated Statement Consolidated Statement of Financial Position as of of Income
December 31, December 31, 2015 2014 2015 2014 2013
Allowance for doubtful accounts Ps. (128) Ps. (242) Ps. 93 Ps. (106) Ps. (24)Inventories 66 132 (14) 77 (2)Other current assets 120 114 21 (18) 109Property, plant and equipment, net (1,858) (1,654) (314) (968) (630)Investments in associates and joint ventures 307 (176) 684 87 115Other assets 99 226 (52) 422 (2)Finite useful lived intangible assets 419 246 201 (133) 236Indefinite lived intangible assets 146 75 84 (195) 88 Post-employment and other long-term employee benefits (672) (753) 86 (92) 30 Derivative financial instruments 127 (38) 165 (99) 62 Provisions (1,209) (1,318) (8) (477) (164)Temporary non-deductible provision 2,486 2,534 735 2,450 562Employee profit sharing payable (311) (268) (43) (13) (27)Tax loss carryforwards (5,272) (3,249) (2,789) (2,874) (212)Cumulative other comprehensive income (1) (171) (303) - - - Exchange differences on translation of foreign operations in OCI 3,834 2,135 - - - Other liabilities (46) (96) (113) 475 (131)Deferred tax (income) expense Ps. (1,264) Ps. (1,464) Ps. 10Deferred tax income net recorded in share of the profit of associates and joint ventures accounted for using the equity method (683) (93) (109)Deferred tax (income) expense, net Ps. (1,947) Ps. (1,557) Ps. (99)Deferred income taxes, net (2,063) (2,635)Deferred tax asset (8,293) (6,278)Deferred tax liability Ps. 6,230 Ps. 3,643(1) Deferred tax related to derivative financial instruments and remeasurements of the ned defined benefit liability.
Deferred tax related to Other Comprehensive Income (OCI)
Income tax related to items charged or recognized directly in OCI as of the year: 2015 2014
Unrealized loss (gain) on derivative financial instruments Ps. 105 Ps. 12Remeasurements of the net defined benefit liability (275) (315)Total deferred tax income related to OCI Ps. (170) Ps. (303)
The changes in the balance of the net deferred income tax asset are as follows:
2015 2014 2013
Initial balance Ps. (2,635) Ps. (799) Ps. (1,328)Deferred tax provision for the year (1,963) (1,571) 45Change in the statutory rate 16 14 (144)Deferred tax income net recorded in share of the profit of associates and joint ventures accounted for using the equity method 683 93 109Acquisition of subsidiaries (see Note 4) (161) (516) 647Effects in equity: Unrealized loss (gain) on cash flow hedges 184 109 (149) Unrealized gain on available for sale securities - - (1) Exchange differences on translation of foreign operations 1,729 617 2 Remeasurements of the net defined benefit liability 121 (427) 102 Retained earnings of associates (396) (180) (121)Restatement effect of beginning balances associated with hyperinflationary economies 359 25 39Ending balance Ps. (2,063) Ps. (2,635) Ps. (799)
The Company offsets tax assets and liabilities if and only if it has a legally enforceable right to set off current tax assets and current tax liabilities and the deferred tax assets and deferred tax liabilities related to income taxes are levied by the same tax authority.
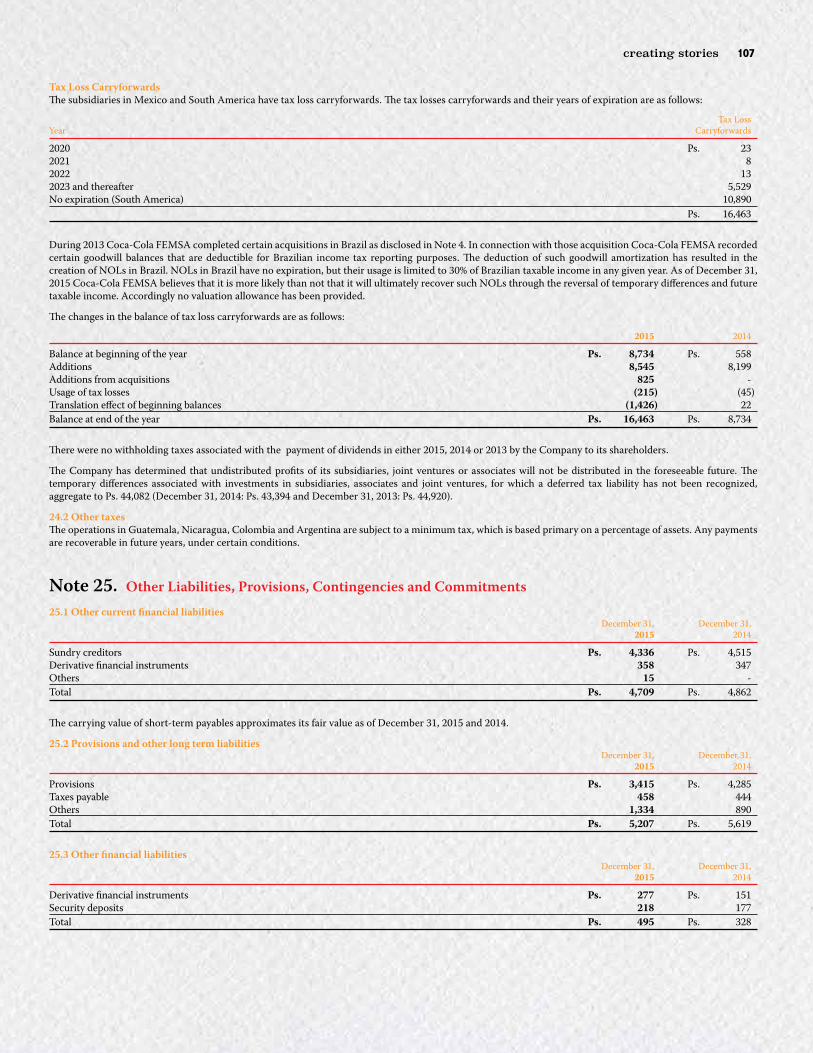
FEMSA Annual Report 2015 107106 creating stories
Tax Loss CarryforwardsThe subsidiaries in Mexico and South America have tax loss carryforwards. The tax losses carryforwards and their years of expiration are as follows:
Tax Loss Year Carryforwards
2020 Ps. 232021 82022 132023 and thereafter 5,529No expiration (South America) 10,890 Ps. 16,463
During 2013 Coca-Cola FEMSA completed certain acquisitions in Brazil as disclosed in Note 4. In connection with those acquisition Coca-Cola FEMSA recorded certain goodwill balances that are deductible for Brazilian income tax reporting purposes. The deduction of such goodwill amortization has resulted in the creation of NOLs in Brazil. NOLs in Brazil have no expiration, but their usage is limited to 30% of Brazilian taxable income in any given year. As of December 31, 2015 Coca-Cola FEMSA believes that it is more likely than not that it will ultimately recover such NOLs through the reversal of temporary differences and future taxable income. Accordingly no valuation allowance has been provided.
The changes in the balance of tax loss carryforwards are as follows:
2015 2014
Balance at beginning of the year Ps. 8,734 Ps. 558Additions 8,545 8,199Additions from acquisitions 825 -Usage of tax losses (215) (45)Translation effect of beginning balances (1,426) 22Balance at end of the year Ps. 16,463 Ps. 8,734
There were no withholding taxes associated with the payment of dividends in either 2015, 2014 or 2013 by the Company to its shareholders.
The Company has determined that undistributed profits of its subsidiaries, joint ventures or associates will not be distributed in the foreseeable future. The temporary differences associated with investments in subsidiaries, associates and joint ventures, for which a deferred tax liability has not been recognized, aggregate to Ps. 44,082 (December 31, 2014: Ps. 43,394 and December 31, 2013: Ps. 44,920).
24.2 Other taxesThe operations in Guatemala, Nicaragua, Colombia and Argentina are subject to a minimum tax, which is based primary on a percentage of assets. Any payments are recoverable in future years, under certain conditions.
Note 25. Other Liabilities, Provisions, Contingencies and Commitments25.1 Other current financial liabilities December 31, December 31, 2015 2014
Sundry creditors Ps. 4,336 Ps. 4,515Derivative financial instruments 358 347Others 15 -Total Ps. 4,709 Ps. 4,862
The carrying value of short-term payables approximates its fair value as of December 31, 2015 and 2014.
25.2 Provisions and other long term liabilities December 31, December 31, 2015 2014
Provisions Ps. 3,415 Ps. 4,285Taxes payable 458 444Others 1,334 890Total Ps. 5,207 Ps. 5,619
25.3 Other financial liabilities December 31, December 31, 2015 2014
Derivative financial instruments Ps. 277 Ps. 151Security deposits 218 177Total Ps. 495 Ps. 328

FEMSA Annual Report 2015 109108 creating stories
25.4 Provisions recorded in the consolidated statement of financial positionThe Company has various loss contingencies, and has recorded reserves as other liabilities for those legal proceedings for which it believes an unfavorable resolution is probable. Most of these loss contingencies are the result of the Company’s business acquisitions. The following table presents the nature and amount of the loss contingencies recorded as of December 31, 2015 and 2014:
December 31, December 31, 2015 2014
Indirect taxes Ps. 1,725 Ps. 2,271Labor 1,372 1,587Legal 318 427Total Ps. 3,415 Ps. 4,285
25.5 Changes in the balance of provisions recorded25.5.1 Indirect taxes December 31, December 31, December 31, 2015 2014 2013
Balance at beginning of the year Ps. 2,271 Ps. 3,300 Ps. 1,263Penalties and other charges 21 220 1New contingencies 84 38 263Reclasification in tax contingencies with Heineken - 1,349 -Contingencies added in business combination - 1,190 2,143Cancellation and expiration (205) (798) (5)Payments (214) (2,517) (303)Current portion - - (163)Brazil amnesty adoption - (599) -Effects of changes in foreign exchange rates (232) 88 101Balance at end of the year Ps. 1,725 Ps. 2,271 Ps. 3,300
During 2014, Coca-Cola FEMSA took advantage of a Brazilian tax amnesty program. The settlementof certain outstanding matters under that amnesty program generated a benefit Ps. 455 which is reflected in other income during the year ended December 31, 2014 (see Note 19).
25.5.2 Labor December 31, December 31, December 31, 2015 2014 2013
Balance at beginning of the year Ps. 1,587 Ps. 1,063 Ps. 934Penalties and other charges 210 107 139New contingencies 44 145 187Contingencies added in business combination - 442 157Cancellation and expiration (102) (53) (226)Payments (114) (57) (69)Effects of changes in foreign exchange rates (253) (60) (59)Balance at end of the year Ps. 1,372 Ps. 1,587 Ps. 1,063
A roll forward for legal contingencies is not disclosed because the amounts are not considered to be material.
While provision for all claims has already been made, the actual outcome of the disputes and the timing of the resolution cannot be estimated by the Company at this time.
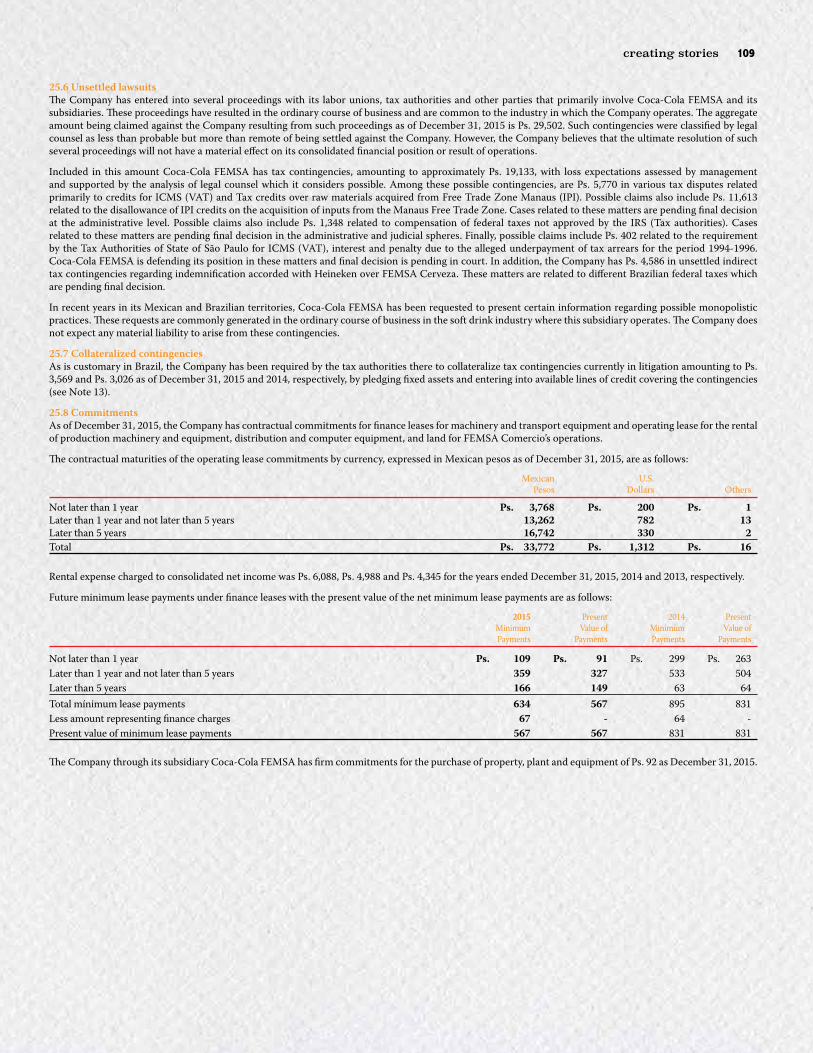
FEMSA Annual Report 2015 109108 creating stories
25.6 Unsettled lawsuitsThe Company has entered into several proceedings with its labor unions, tax authorities and other parties that primarily involve Coca-Cola FEMSA and its subsidiaries. These proceedings have resulted in the ordinary course of business and are common to the industry in which the Company operates. The aggregate amount being claimed against the Company resulting from such proceedings as of December 31, 2015 is Ps. 29,502. Such contingencies were classified by legal counsel as less than probable but more than remote of being settled against the Company. However, the Company believes that the ultimate resolution of such several proceedings will not have a material effect on its consolidated financial position or result of operations.
Included in this amount Coca-Cola FEMSA has tax contingencies, amounting to approximately Ps. 19,133, with loss expectations assessed by management and supported by the analysis of legal counsel which it considers possible. Among these possible contingencies, are Ps. 5,770 in various tax disputes related primarily to credits for ICMS (VAT) and Tax credits over raw materials acquired from Free Trade Zone Manaus (IPI). Possible claims also include Ps. 11,613 related to the disallowance of IPI credits on the acquisition of inputs from the Manaus Free Trade Zone. Cases related to these matters are pending final decision at the administrative level. Possible claims also include Ps. 1,348 related to compensation of federal taxes not approved by the IRS (Tax authorities). Cases related to these matters are pending final decision in the administrative and judicial spheres. Finally, possible claims include Ps. 402 related to the requirement by the Tax Authorities of State of São Paulo for ICMS (VAT), interest and penalty due to the alleged underpayment of tax arrears for the period 1994-1996. Coca-Cola FEMSA is defending its position in these matters and final decision is pending in court. In addition, the Company has Ps. 4,586 in unsettled indirect tax contingencies regarding indemnification accorded with Heineken over FEMSA Cerveza. These matters are related to different Brazilian federal taxes which are pending final decision.
In recent years in its Mexican and Brazilian territories, Coca-Cola FEMSA has been requested to present certain information regarding possible monopolistic practices. These requests are commonly generated in the ordinary course of business in the soft drink industry where this subsidiary operates. The Company does not expect any material liability to arise from these contingencies.
25.7 Collateralized contingenciesAs is customary in Brazil, the Company has been required by the tax authorities there to collateralize tax contingencies currently in litigation amounting to Ps. 3,569 and Ps. 3,026 as of December 31, 2015 and 2014, respectively, by pledging fixed assets and entering into available lines of credit covering the contingencies (see Note 13).
25.8 CommitmentsAs of December 31, 2015, the Company has contractual commitments for finance leases for machinery and transport equipment and operating lease for the rental of production machinery and equipment, distribution and computer equipment, and land for FEMSA Comercio’s operations.
The contractual maturities of the operating lease commitments by currency, expressed in Mexican pesos as of December 31, 2015, are as follows:
Mexican U.S. Pesos Dollars Others
Not later than 1 year Ps. 3,768 Ps. 200 Ps. 1Later than 1 year and not later than 5 years 13,262 782 13Later than 5 years 16,742 330 2Total Ps. 33,772 Ps. 1,312 Ps. 16
Rental expense charged to consolidated net income was Ps. 6,088, Ps. 4,988 and Ps. 4,345 for the years ended December 31, 2015, 2014 and 2013, respectively.
Future minimum lease payments under finance leases with the present value of the net minimum lease payments are as follows:
2015 Present 2014 Present Minimum Value of Minimum Value of Payments Payments Payments Payments
Not later than 1 year Ps. 109 Ps. 91 Ps. 299 Ps. 263Later than 1 year and not later than 5 years 359 327 533 504Later than 5 years 166 149 63 64Total mínimum lease payments 634 567 895 831Less amount representing finance charges 67 - 64 -Present value of minimum lease payments 567 567 831 831
The Company through its subsidiary Coca-Cola FEMSA has firm commitments for the purchase of property, plant and equipment of Ps. 92 as December 31, 2015.
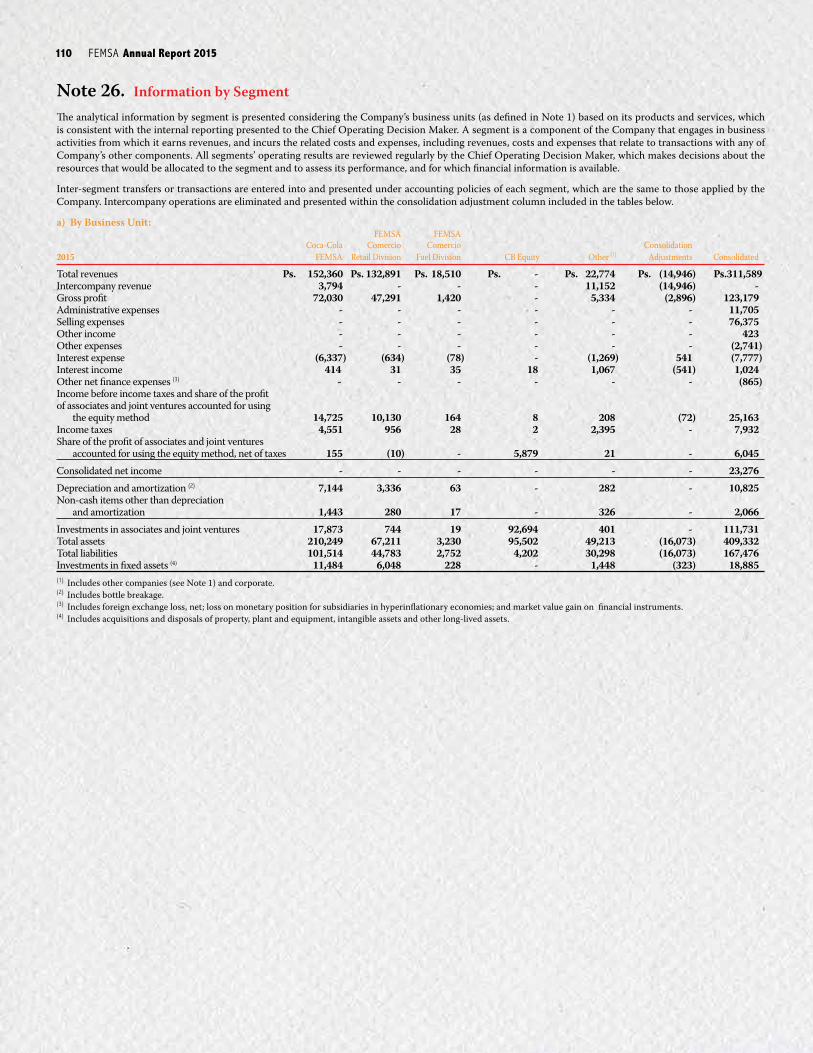
FEMSA Annual Report 2015 111110 creating stories
Note 26. Information by SegmentThe analytical information by segment is presented considering the Company’s business units (as defined in Note 1) based on its products and services, which is consistent with the internal reporting presented to the Chief Operating Decision Maker. A segment is a component of the Company that engages in business activities from which it earns revenues, and incurs the related costs and expenses, including revenues, costs and expenses that relate to transactions with any of Company’s other components. All segments’ operating results are reviewed regularly by the Chief Operating Decision Maker, which makes decisions about the resources that would be allocated to the segment and to assess its performance, and for which financial information is available.
Inter-segment transfers or transactions are entered into and presented under accounting policies of each segment, which are the same to those applied by the Company. Intercompany operations are eliminated and presented within the consolidation adjustment column included in the tables below.
a) By Business Unit: FEMSA FEMSA Coca-Cola Comercio Comercio Consolidation 2015 FEMSA Retail Division Fuel Division CB Equity Other (1) Adjustments Consolidated
Total revenues Ps. 152,360 Ps. 132,891 Ps. 18,510 Ps. - Ps. 22,774 Ps. (14,946) Ps. 311,589Intercompany revenue 3,794 - - - 11,152 (14,946) -Gross profit 72,030 47,291 1,420 - 5,334 (2,896) 123,179Administrative expenses - - - - - - 11,705Selling expenses - - - - - - 76,375Other income - - - - - - 423Other expenses - - - - - - (2,741)Interest expense (6,337) (634) (78) - (1,269) 541 (7,777)Interest income 414 31 35 18 1,067 (541) 1,024Other net finance expenses (3) - - - - - - (865)Income before income taxes and share of the profit of associates and joint ventures accounted for using the equity method 14,725 10,130 164 8 208 (72) 25,163Income taxes 4,551 956 28 2 2,395 - 7,932Share of the profit of associates and joint ventures accounted for using the equity method, net of taxes 155 (10) - 5,879 21 - 6,045Consolidated net income - - - - - - 23,276Depreciation and amortization (2) 7,144 3,336 63 - 282 - 10,825Non-cash items other than depreciation and amortization 1,443 280 17 - 326 - 2,066Investments in associates and joint ventures 17,873 744 19 92,694 401 - 111,731Total assets 210,249 67,211 3,230 95,502 49,213 (16,073) 409,332Total liabilities 101,514 44,783 2,752 4,202 30,298 (16,073) 167,476Investments in fixed assets (4) 11,484 6,048 228 - 1,448 (323) 18,885(1) Includes other companies (see Note 1) and corporate.(2) Includes bottle breakage.(3) Includes foreign exchange loss, net; loss on monetary position for subsidiaries in hyperinflationary economies; and market value gain on financial instruments.(4) Includes acquisitions and disposals of property, plant and equipment, intangible assets and other long-lived assets.
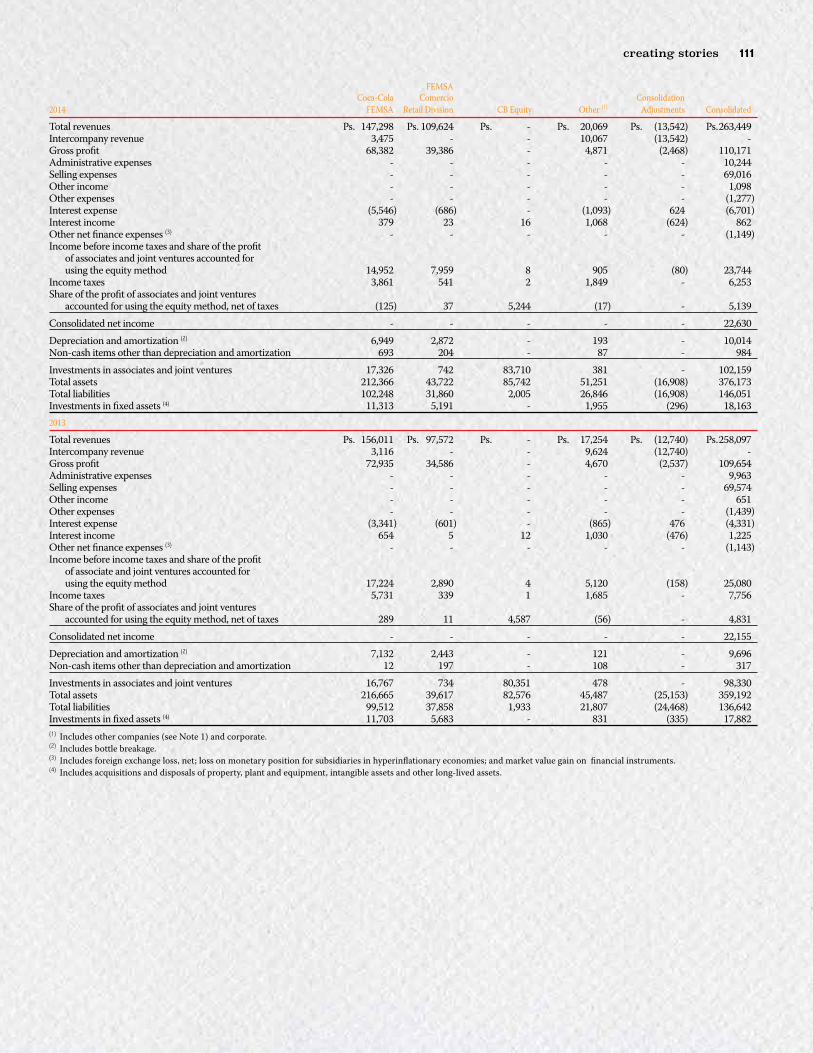
FEMSA Annual Report 2015 111110 creating stories
FEMSA Coca-Cola Comercio Consolidation 2014 FEMSA Retail Division CB Equity Other (1) Adjustments Consolidated
Total revenues Ps. 147,298 Ps. 109,624 Ps. - Ps. 20,069 Ps. (13,542) Ps. 263,449Intercompany revenue 3,475 - - 10,067 (13,542) -Gross profit 68,382 39,386 - 4,871 (2,468) 110,171Administrative expenses - - - - - 10,244Selling expenses - - - - - 69,016Other income - - - - - 1,098Other expenses - - - - - (1,277)Interest expense (5,546) (686) - (1,093) 624 (6,701)Interest income 379 23 16 1,068 (624) 862Other net finance expenses (3) - - - - - (1,149)Income before income taxes and share of the profit of associates and joint ventures accounted for using the equity method 14,952 7,959 8 905 (80) 23,744Income taxes 3,861 541 2 1,849 - 6,253Share of the profit of associates and joint ventures accounted for using the equity method, net of taxes (125) 37 5,244 (17) - 5,139Consolidated net income - - - - - 22,630Depreciation and amortization (2) 6,949 2,872 - 193 - 10,014Non-cash items other than depreciation and amortization 693 204 - 87 - 984Investments in associates and joint ventures 17,326 742 83,710 381 - 102,159Total assets 212,366 43,722 85,742 51,251 (16,908) 376,173Total liabilities 102,248 31,860 2,005 26,846 (16,908) 146,051Investments in fixed assets (4) 11,313 5,191 - 1,955 (296) 18,1632013
Total revenues Ps. 156,011 Ps. 97,572 Ps. - Ps. 17,254 Ps. (12,740) Ps. 258,097Intercompany revenue 3,116 - - 9,624 (12,740) -Gross profit 72,935 34,586 - 4,670 (2,537) 109,654Administrative expenses - - - - - 9,963Selling expenses - - - - - 69,574Other income - - - - - 651Other expenses - - - - - (1,439)Interest expense (3,341) (601) - (865) 476 (4,331)Interest income 654 5 12 1,030 (476) 1,225Other net finance expenses (3) - - - - - (1,143)Income before income taxes and share of the profit of associate and joint ventures accounted for using the equity method 17,224 2,890 4 5,120 (158) 25,080Income taxes 5,731 339 1 1,685 - 7,756Share of the profit of associates and joint ventures accounted for using the equity method, net of taxes 289 11 4,587 (56) - 4,831Consolidated net income - - - - - 22,155Depreciation and amortization (2) 7,132 2,443 - 121 - 9,696Non-cash items other than depreciation and amortization 12 197 - 108 - 317Investments in associates and joint ventures 16,767 734 80,351 478 - 98,330Total assets 216,665 39,617 82,576 45,487 (25,153) 359,192Total liabilities 99,512 37,858 1,933 21,807 (24,468) 136,642Investments in fixed assets (4) 11,703 5,683 - 831 (335) 17,882(1) Includes other companies (see Note 1) and corporate.(2) Includes bottle breakage.(3) Includes foreign exchange loss, net; loss on monetary position for subsidiaries in hyperinflationary economies; and market value gain on financial instruments.(4) Includes acquisitions and disposals of property, plant and equipment, intangible assets and other long-lived assets.

FEMSA Annual Report 2015 113112 creating stories
b) By Geographic Area:The Company aggregates geographic areas into the following for the purposes of its consolidated financial statements: (i) Mexico and Central America division (comprising the following countries: Mexico, Guatemala, Nicaragua, Costa Rica and Panama) and (ii) the South America division (comprising the following countries: Brazil, Argentina, Colombia, Chile and Venezuela). Venezuela operates in an economy with exchange controls and hyper-inflation; and as a result,it is not aggregated into the South America area, (iii) Europe (comprised of the Company’s equity method investment in Heineken) and (iv) the Asian division comprised of the Coca Cola FEMSA’s equity method investment in CCFPI (Philippines) which was acquired in January 2013.
Geographic disclosure for the Company is as follow: Total Total Non Current Revenues Assets
2015Mexico and Central America (1) (2) Ps. 228,563 Ps. 158,506South America (3) 74,928 67,568Venezuela 8,904 3,841Europe - 92,694Consolidation adjustments (806) -Consolidated Ps. 311,589 Ps. 322,6092014Mexico and Central America (1) (2) Ps. 186,736 Ps. 139,899South America (3) 69,172 67,078Venezuela 8,835 6,374Europe - 83,710Consolidation adjustments (1,294) -Consolidated Ps. 263,449 Ps. 297,061 Total Revenues
2013Mexico and Central America (1) (2) Ps. 171,726South America (3) 55,157Venezuela 31,601Europe -Consolidation adjustments (387)Consolidated Ps. 258,097(1) Central America includes Guatemala, Nicaragua, Costa Rica and Panama. Domestic (Mexico only) revenues were Ps. 218,809, Ps. 178,125 and Ps. 163,351 during the years ended
December 31, 2015, 2014 and 2013, respectively. Domestic (Mexico only) non-current assets were Ps. 157,080 and Ps. 138,662, as of December 31, 2015, and December 31, 2014, respectively.
(2) Coca-Cola FEMSA’s Asian division consists of the 51% equity investment in CCFPI (Philippines) which was acquired in 2013, and is accounted for using the equity method of accounting (see Note 10). The equity in earnings of the Asian division were Ps. 86, Ps. (334) and Ps. 108 in 2015, 2014 and 2013, respectively as is the equity method investment in CCFPI was Ps. 9,996, Ps. 9,021 and Ps. 9,398 this is presented as part of the Company’s corporate operations in 2015, 2014 and 2013, respectively and thus disclosed net in the table above as part of the “Total Non Current assets” in the Mexico & Central America division. However, the Asian division is represented by the following investee level amounts, prior to reflection of the Company’s 51% equity interest in the accompanying consolidated financial statements: revenues Ps. 19,576, Ps. 16,548 and Ps. 13,438, gross profit Ps. 5,325, Ps. 4,913 and Ps. 4,285, income before income taxes Ps. 334, Ps. 664 and Ps. 310, depreciation and amortization Ps. 2,369, Ps. 643 and Ps. 1,229, total assets Ps. 22,002 Ps. 19,877 and Ps. 17,232, total liabilities Ps. 6,493, Ps. 6,614 and Ps. 4,488, capital expenditures Ps. 1,778, Ps. 2,215 and Ps. 1,889, as of December 31, 2015, 2104 and 2013, respectively.
(3) South America includes Brazil, Argentina, Colombia, Chile and Venezuela, although Venezuela is shown separately above. South America revenues include Brazilian revenues of Ps. 39,749, Ps. 45,799 and Ps. 31,138 during the years ended December 31, 2015, 2014 and 2013, respectively. Brazilian non-current assets were Ps. 44,851 and Ps. 51,587, as of December 31, 2015 and December 31, 2014, respectively. South America revenues include Colombia revenues of Ps. 14,283, Ps. 14,207 and Ps. 13,354 during the years ended December 31, 2015, 2014 and 2013, respectively. Colombia non-current assets were Ps. 12,755 and Ps. 12,933, as of December 31, 2015 and December 31, 2014, respectively. South America revenues include Argentina revenues of Ps. 14,004, Ps. 9,714 and Ps. 10,729 during the years ended December 31, 2015, 2014 and 2013, respectively. Argentina non-current assets were Ps. 2,861 and Ps. 2,470, as of December 31, 2015 and December 31, 2014, respectively. South America revenues include Chile revenues of Ps. 7,586 during the year ended December 31, 2015. Chile non-current assets were Ps. 7,031, as of December 31, 2015.
Note 27. Future Impact of Recently Issued Accounting Standards not yet in EffectThe Company has not applied the following standards and interpretations that are issued, but not yet effective, up to the date of issuance of the Company’s financial statements are disclosed below. The Company intends to adopt these standards, if applicable, when they become effective.
IFRS 9, Financial InstrumentsIn July 2014, the IASB issued the final version of IFRS 9 Financial Instruments which reflects all phases of the financial instruments project and replaces IAS 39 Financial Instruments: Recognition and Measurement and all previous versions of IFRS 9. The standard introduces new requirements for classification and measurement, impairment, and hedge accounting. IFRS 9 is effective for annual periods beginning on or after January 1, 2018, with early application permitted. The transition to IFRS 9 differs by requirements and is partly retrospective and partly prospective. The Company has not early adopted this IFRS, and the Company has yet to complete its evaluation of whether it will have a material impact on its consolidated financial statements.

FEMSA Annual Report 2015 113112 creating stories
IFRS 15, Revenue from Contracts with CustomersIFRS 15, “Revenue from Contracts with Customers”, was originally issued in May 2014 and applies to annual reporting periods beginning on or after January 1, 2018, earlier application is permitted. Revenue is recognized as control is passed, either over time or at a point in time.
The standard outlines a single comprehensive model for entities to use in accounting for revenue arising from contracts with customers and supersedes most current revenue recognition guidance, including industry specific guidance. In applying the revenue model to contracts within its scope, an entity will: 1) Identify the contract(s) with a customer; 2) Identify the performance obligations in the contract; 3) Determine the transaction price; 4) Allocate the transaction price to the performance obligations in the contract; 5) Recognize revenue when (or as) the entity satisfies a performance obligation. Also, an entity needs to disclose sufficient information to enable users of financial statements to understand the nature, amount, timing and uncertainty of revenue and cash flows arising from contracts with customers. The Company has yet to complete its evaluation of whether there will be a significant impact as a consequence of this standard’s adoption; nonetheless most of the Company’s operations are at a single point in time, which is when the Company transfers goods or services to a customer. The Company does not expect a potential impact on its consolidated financial statements and the Company expects to complete its evaluation during 2017.
IFRS 16, LeasesIFRS 16 “Leases” was issued in January 2016 and supersedes IAS 17 “Leases” and related interpretations. The new standard brings most leases on-balance sheet for lessees under a single model, eliminating the distinction between operating and finance leases. Lessor accounting, however, remains largely unchanged and the distinction between operating and finance leases is retained. IFRS 16 is effective for periods beginning on or after 1 January 2019, with earlier adoption permitted if IFRS 15 ‘Revenue from Contracts with Customers’ has also been applied.
Under IFRS 16 a lessee recognizes a right-of-use asset and a lease liability. The right-of-use asset is treated similarly to other non-financial assets and depreciated accordingly and the liability accrues interest. This will typically produce a front-loaded expense profile (whereas operating leases under IAS 17 would typically have had straight-line expenses) as an assumed linear depreciation of the right-of-use asset and the decreasing interest on the liability will lead to an overall decrease of expense over the life of the lease.
The lease liability is initially measured at the present value of the lease payments payable over the lease term, discounted at the rate implicit in the lease if that can be readily determined. If that rate cannot be readily determined, the lessee shall use their incremental borrowing rate. However, a lessee may elect to account for lease payments as an expense on a straight-line basis over the lease term for leases with a lease term of 12 months or less and containing no purchase options (this election is made by class of underlying asset); and leases where the underlying asset has a low value when new, such as personal computers or small items of office furniture (this election can be made on a lease-by-lease basis). The Company has yet to complete its evaluation whether there will be a potential impact as a consequence of this standard’s adoption, although given the nature of the Company’s operations, it will expect a significant impact on its consolidated financial statements.
Amendments to IAS 7, Disclosure InitiativeThe amendments to IAS 7 Statement of Cash Flows, require that the following changes in liabilities arising from financing activities be disclosed separately from changes in other assets and liabilities: (i) changes from financing cash flows; (ii) changes arising from obtaining or losing control of subsidiaries or other businesses; (iii) the effect of changes in foreign exchange rates; (iv) changes in fair values; and (v) other changes. One way to fulfill the new disclosure requirement is to provide a reconciliation between the opening and closing balances in the statement of financial position for liabilities arising from financing activities.
Liabilities arising from financing activities are those for which cash flows were, or future cash flows will be, classified in the statement of cash flows as cash flows from financing activities. The new disclosure requirements also relate to changes in financial assets if they meet the same definition.
These amendments are effective for annual periods beginning on or after 1 January 2017 with earlier application permitted, and entities need not provide comparative information when they first apply them. The Company is in the process of assessing the potential impacts from the adoption of these amendments in its financial statements.
Note 28. Subsequent EventsIn January 18, 2016, Eduardo Padilla Silva replaced Daniel Rodriguez Cofré as our Chief Financial and Corporate Officer, and Mr. Rodriguez Cofré replaced Mr. Padilla Silva as Chief Executive Officer of FEMSA Comercio.
In February 17, 2016, the president of Venezuela announced a devaluation of the official exchange rate of 37% and moved the existing three-tier exchange rates system into dual system as part of a package of economic policies aimed to face the economic crisis from the OPEC member-countries. The official exchange rate (6.30 bolivars per U.S. dollar as of December 31, 2015) and the SICAD exchange rate (13.50 bolivars per U.S. dollar as of December 31, 2015), were merged into a new official exchange rate at 10 bolivars per U.S. dollar. The SIMADI exchange rate was maintained in the same conditions it operated before this date. At the date of this report, no specific guidance has been defined with respect to the use of each exchange rate available. The Company will closely monitor developments in this area, which may affect the exchange rate(s) used prospectively.

FEMSA Annual Report 2015 PB114 creating stories
Headquarters
FEMSA Corporate OfficesGeneral Anaya No. 601 Pte.Col. Bella VistaMonterrey, Nuevo LeónMexico, C.P. 64410Phone: (52) 81 8328-6000Fax: (52) 81 8328-6080
Coca-Cola FEMSAMario Pani N° 100Col. Santa Fé Cuajimalpa 05348,México, D.F. MexicoPhone: (52) 55 1519-5000
FEMSA ComercioEdison No. 1235 Nte.Col. TalleresMonterrey, Nuevo LeónMexico, C.P. 64480Phone: (52) 81 8389-2121Fax: (52) 81 8389-2106
FEMSA Negocios EstratégicosGeneral Anaya No. 601 Pte.Col. Bella VistaMonterrey, Nuevo LeónMexico, C.P. 64410Phone: (52) 81 8328-6600Fax: (52) 81 8328-6601
The FEMSA 2015 Annual Repor t may contain cer tain forward-looking statements concerning FEMSA and its subsidiaries’ future performance and should be considered as good faith estimates of FEMSA and its subsidiaries. These forward-looking statements reflect management’s expectations and are based upon currently available data. Actual results are subject to fur ther events and uncer tainties which could materially impact the Company’s subsidiaries’ actual performance.