Coca-Cola FEMSA Announces First Quarter 2019 Results · 2019-04-26 · Coca-Cola FEMSA Reports...
13
Investor Relations Maria Dyla Castro | [email protected] Jorge Collazo | [email protected] Maria Fernanda Garcia | [email protected] Page 1 of 13 Coca-Cola FEMSA Announces First Quarter 2019 Results Mexico City, April 26, 2019, Coca-Cola FEMSA, S.A.B. de C.V. (BMV: KOF UBL, NYSE: KOF) (“Coca-Cola FEMSA”, “KOF” or the “Company”), the largest Coca-Cola franchise bottler in the world by sales volume, announces results for the first quarter of 2019. OPERATIONAL AND FINANCIAL HIGHLIGHTS Volumes performed strongly in Brazil; transactions outperformed volumes in Argentina and Brazil. Revenues increased 4.8%, while comparable revenues grew 10.0%. Pricing ahead of inflation in most of our operations, combined with volume growth in Brazil was partially offset by unfavorable currency translation effects from all of our operating currencies. Operating income declined 0.9% while comparable operating income increased 9.2%, driven mainly by higher concentrate costs, higher PET prices, the depreciation of most of our operating currencies as applied to our U.S. dollar denominated raw material costs and higher labor expenses, effects that were partially offset by lower sweetener costs and operating expense efficiencies. Earnings per share 1 were Ps. 0.15 (earnings per unit were Ps. 1.23 and per ADS were Ps. 12.33). John Santa Maria, Coca-Cola FEMSA’s CEO, commented: “I am pleased with our Company’s positive results to start the year. Despite currency volatility and uncertain economic conditions that affected our financial performance, our revenues grew 4.8% while our comparable revenues grew 10.0%. In addition, our operating income declined 0.9% while our comparable operating income increased 9.2%. In Mexico & Central America, we reported healthy top-and-bottom line growth, as we continued leveraging our state-of-the-art analytics capabilities. Our South America Division’s performance was driven mainly by strong volume growth in Brazil, where we continued to gain share across categories thanks to our robust portfolio and relentless point-of-sale execution. To protect our profitability, we continued to implement mitigation actions to navigate complex environments in Colombia and Argentina. Finally, guided by the clarity of our vision of becoming a total beverage leader with global footprint, on April 11, we completed our previously announced stock split and listing of units for trading in the Mexican Stock Exchange and the New York Stock Exchange. This important milestone enhances the flexibility of our capital structure by increasing our capacity to issue equity, positioning our Company for further sustainable, profitable growth and expansion.” (1) Quarterly earnings / outstanding shares. Earnings per share (EPS) for all periods are adjusted to give effect to the stock split resulting in 16,806.7 million shares outstanding. For the convenience of the reader, as a KOF UBL Unit is comprised of 8 shares (3 Series B shares and 5 Series L shares); earnings per unit are equal to EPS multiplied by 8. Each ADS represents 10 KOF UBL Units. (2) According to IFRS 5, figures for 2018 do not include the Philippines as it is presented as a discontinued operation as of January 1, 2018. (3) Please refer to page 7 for our definition of “comparable” and a description of the factors affecting the comparability of our financial and operating performance. 1Q19 1Q19 1Q19 1Q19 Consolidated 4.8% 3.3% (0.9%) 7.3% Mexico & Central America 11.4% 12.4% 15.6% South America (1.9%) (6.4%) (15.0%) Consolidated 10.0% 8.8% 9.2% Mexico & Central America 7.2% 8.3% 12.4% South America 13.7% 9.7% 5.4% Comparable (3) Majority Net Income FINANCIAL SUMMARY FOR THE FIRST QUARTER RESULTS Total Revenues Gross Profit Operating Income As Reported (2) Change vs. same period of last year
Transcript of Coca-Cola FEMSA Announces First Quarter 2019 Results · 2019-04-26 · Coca-Cola FEMSA Reports...

Investor Relations Maria Dyla Castro | [email protected] Jorge Collazo | [email protected] Maria Fernanda Garcia | [email protected]
Page 1 of 13
Coca-Cola FEMSA Announces First Quarter 2019 Results Mexico City, April 26, 2019, Coca-Cola FEMSA, S.A.B. de C.V. (BMV: KOF UBL, NYSE: KOF) (“Coca-Cola FEMSA”, “KOF” or the “Company”), the largest Coca-Cola franchise bottler in the world by sales volume, announces results for the first quarter of 2019.
OPERATIONAL AND FINANCIAL HIGHLIGHTS
Volumes performed strongly in Brazil; transactions outperformed volumes in Argentina and Brazil.
Revenues increased 4.8%, while comparable revenues grew 10.0%. Pricing ahead of inflation in most of our operations,
combined with volume growth in Brazil was partially offset by unfavorable currency translation effects from all of our
operating currencies.
Operating income declined 0.9% while comparable operating income increased 9.2%, driven mainly by higher concentrate
costs, higher PET prices, the depreciation of most of our operating currencies as applied to our U.S. dollar denominated
raw material costs and higher labor expenses, effects that were partially offset by lower sweetener costs and operating
expense efficiencies.
Earnings per share1 were Ps. 0.15 (earnings per unit were Ps. 1.23 and per ADS were Ps. 12.33).
John Santa Maria, Coca-Cola FEMSA’s CEO, commented:
“I am pleased with our Company’s positive results to start the year. Despite currency volatility and uncertain economic
conditions that affected our financial performance, our revenues grew 4.8% while our comparable revenues grew 10.0%.
In addition, our operating income declined 0.9% while our comparable operating income increased 9.2%. In Mexico &
Central America, we reported healthy top-and-bottom line growth, as we continued leveraging our state-of-the-art
analytics capabilities. Our South America Division’s performance was driven mainly by strong volume growth in Brazil,
where we continued to gain share across categories thanks to our robust portfolio and relentless point-of-sale execution.
To protect our profitability, we continued to implement mitigation actions to navigate complex environments in Colombia
and Argentina. Finally, guided by the clarity of our vision of becoming a total beverage leader with global footprint, on April
11, we completed our previously announced stock split and listing of units for trading in the Mexican Stock Exchange and
the New York Stock Exchange. This important milestone enhances the flexibility of our capital structure by increasing our
capacity to issue equity, positioning our Company for further sustainable, profitable growth and expansion.”
(1) Quarterly earnings / outstanding shares. Earnings per share (EPS) for all periods are adjusted to give effect to the stock split resulting in 16,806.7 million shares
outstanding. For the convenience of the reader, as a KOF UBL Unit is comprised of 8 shares (3 Series B shares and 5 Series L shares); earnings per unit are equal to EPS
multiplied by 8. Each ADS represents 10 KOF UBL Units.
(2) According to IFRS 5, figures for 2018 do not include the Philippines as it is presented as a discontinued operation as of January 1, 2018. (3) Please refer to page 7 for our definition of “comparable” and a description of the factors affecting the comparability of our financial and operating performance.
1Q19 1Q19 1Q19 1Q19
Consolidated 4.8% 3.3% (0.9%) 7.3%
Mexico & Central America 11.4% 12.4% 15.6%
South America (1.9%) (6.4%) (15.0%)
Consolidated 10.0% 8.8% 9.2%
Mexico & Central America 7.2% 8.3% 12.4%
South America 13.7% 9.7% 5.4%Comparable (3)
Majority Net Income
FINANCIAL SUMMARY FOR THE FIRST QUARTER RESULTS
Total Revenues Gross Profit Operating Income
As Reported (2)
Change vs. same period of last year

Coca-Cola FEMSA Reports 1Q2019 Results
April 26, 2019 Page 2 of 13
RECENT DEVELOPMENTS
During the first quarter 2019, the Company prepaid Ps. 4,700 million of bilateral loans due in October 2019.
On March 8, 2019, the Company held an Extraordinary General Shareholders Meeting that resolved amendments to the Company´s bylaws. As a result, Series A shareholders are entitled to appoint up to 13 Directors, Series D shareholders are entitled to appoint up to 5 and Series L shareholders continue to have the right to appoint up to 3. On March 14, as a result of these amendments our shareholders approved a Board of Directors composed of 18 members as compared to 21, previously.
On March 14, 2019, the Company held its Annual Ordinary General Shareholders Meeting, during which its shareholders approved the Company’s consolidated financial statements for the year ended December 31, 2018, the annual report presented by the Board of Directors, the declaration of dividends corresponding to fiscal year 2018, and the composition of the Board of Directors and the Finance and Planning, Audit, and Corporate Practices Committees for 2019. Shareholders approved the payment of the proposed cash dividend of Ps. 3.54 per share. After giving effect to the stock split, the dividend payment approved is equivalent to Ps. 0.4425 per share, to be paid in two installments as of May 3, 2019, and November 1, 2019.
On April 11, 2019, Coca-Cola FEMSA completed the previously announced eight-for-one stock split, the issuance of new Series B shares (with full voting rights) and the creation and listing of KOF UBL units. As a result, (a) Series A and Series D split eight-for-one, and (b) for each Series L shares (KOF L), its holders received a new KOF UBL unit that replaces the previous KOF L. Each new KOF UBL unit consists of 3 Series B shares and 5 Series L shares (with limited voting rights). As of the same date, KOF UBL units were listed for trading on the Mexican Stock Exchange (BMV) under ticker symbol KOF UBL and ADSs (each representing 10 units) were listed for trading on the New York Stock Exchange (NYSE) under ticker symbol KOF.
The capital stock of the Company prior to and immediately after the Stock Split is as follows:
Coca-Cola FEMSA released its 2018 integrated report entitled “Clarity, Consistency and Commitment”, the annual report on Form
20-F filing to the U.S. Securities and Exchange Commission, and the annual report filing to the Mexican National Banking and
Securities Commission (Comisión Nacional Bancaria y de Valores). These three reports are available on the Investor Relations
section of Coca-Cola FEMSA´s website at www.coca-colafemsa.com
CONFERENCE CALL INFORMATION
Trading TickerSeries of
sharesShareholders
Outstanding
shares
% of the
capital stock
% of shares with
full voting rightsTrading Ticker
Series of
sharesShareholders
Outstanding
shares
% of the
capital stock
% of shares with
full voting rights
Not trading A
Wholly-owned
subsidiary of Fomento
Económico Mexicano,
S.A.B. de C.V.
992,078,519 47.223% 62.964% Not trading A
Wholly-owned
subsidiary of Fomento
Económico Mexicano,
S.A.B. de C.V.
7,936,628,152 47.223% 55.968%
Not trading D
Wholly-owned
subsidiaries of
The Coca-Cola Company
583,545,678 27.777% 37.036% Not trading D
Wholly-owned
subsidiaries of
The Coca-Cola Company
4,668,365,424 27.777% 32.921%
Trading
KOF L in BMV
KOF in NYSE
LPublic float
(limited voting rights)525,208,065 25.0% 0.0% B
Public float
(full voting rights)1,575,624,195 9.375% 11.111%
LPublic float
(limited voting rights)2,626,040,325 15.625% 0.0%
Total 2,100,832,262 100% 100% Total 16,806,658,096 100% 100%
OUTSTANDING SHARES PRIOR TO THE STOCK SPLIT OUTSTANDING SHARES IMMEDIATELY AFTER THE STOCK SPLIT
Trading
KOF UBL unit in BMV
KOF in NYSE
(Each unit comprised
of 3 series B shares
and 5 series L shares)
Mr. John Anthony Santa Maria, Chief Executive Officer
Mr. Constantino Spas, Chief Financial Officer
Mrs. Maria Dyla Castro, Investor Relations Director
Webcast: https://webcastlite.mziq.com/cover.html?web
castId=c8568ec6-23db-4cd3-9c82-a8e604b1c320
Tuesday February 26, 2019 10:00 A.M. Eastern Time
9:00 A.M. Mexico City Time
To participate in the conference call please dial:
Domestic U.S.: 866 548 4713
International: +1 323 794 2093
Participant passcode: 9335777
Mr. John Anthony Santa Maria, Chief Executive Officer Mr. Constantino Spas, Chief Financial Officer Mrs. Maria Dyla Castro, Investor Relations Director
Friday April 26, 2019 9:30 A.M. Eastern Time
8:30 A.M. Mexico City Time
Webcast: http://bit.do/KOF1Qresults
Coca-Cola FEMSA Reports 1Q2019 Results
April 26, 2019 Page 3 of 13
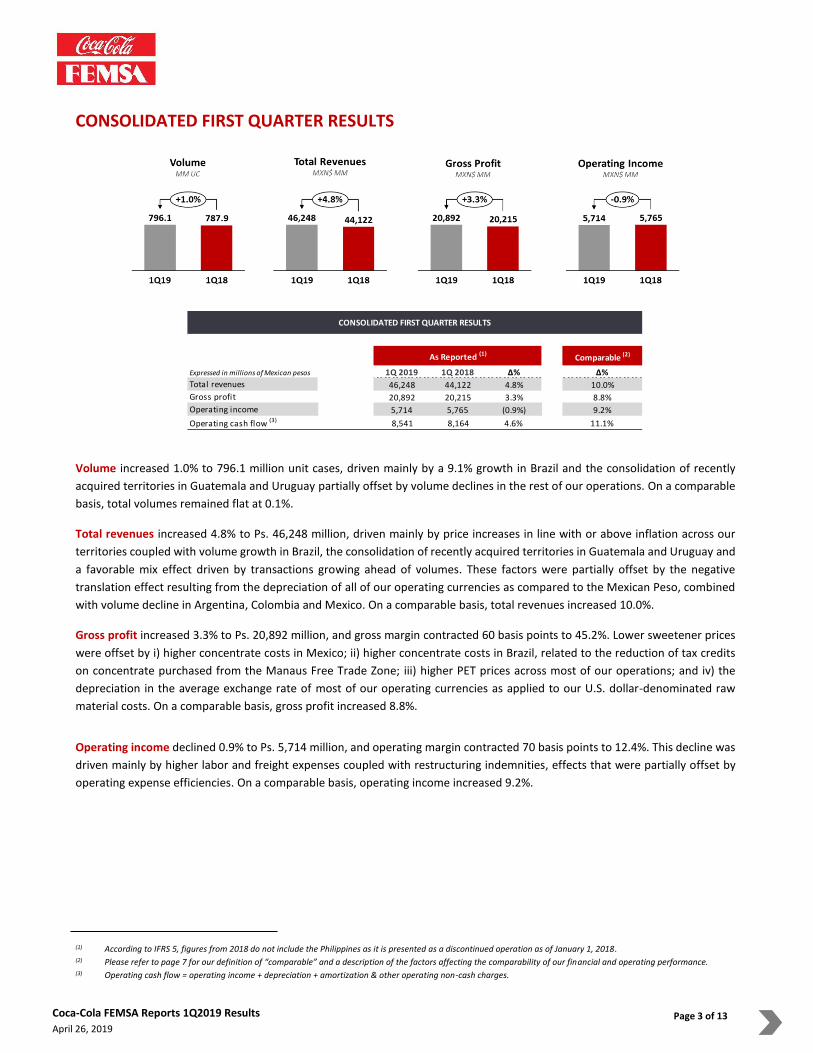
CONSOLIDATED FIRST QUARTER RESULTS
Volume increased 1.0% to 796.1 million unit cases, driven mainly by a 9.1% growth in Brazil and the consolidation of recently
acquired territories in Guatemala and Uruguay partially offset by volume declines in the rest of our operations. On a comparable
basis, total volumes remained flat at 0.1%.
Total revenues increased 4.8% to Ps. 46,248 million, driven mainly by price increases in line with or above inflation across our
territories coupled with volume growth in Brazil, the consolidation of recently acquired territories in Guatemala and Uruguay and
a favorable mix effect driven by transactions growing ahead of volumes. These factors were partially offset by the negative
translation effect resulting from the depreciation of all of our operating currencies as compared to the Mexican Peso, combined
with volume decline in Argentina, Colombia and Mexico. On a comparable basis, total revenues increased 10.0%.
Gross profit increased 3.3% to Ps. 20,892 million, and gross margin contracted 60 basis points to 45.2%. Lower sweetener prices
were offset by i) higher concentrate costs in Mexico; ii) higher concentrate costs in Brazil, related to the reduction of tax credits
on concentrate purchased from the Manaus Free Trade Zone; iii) higher PET prices across most of our operations; and iv) the
depreciation in the average exchange rate of most of our operating currencies as applied to our U.S. dollar-denominated raw
material costs. On a comparable basis, gross profit increased 8.8%.
Operating income declined 0.9% to Ps. 5,714 million, and operating margin contracted 70 basis points to 12.4%. This decline was
driven mainly by higher labor and freight expenses coupled with restructuring indemnities, effects that were partially offset by
operating expense efficiencies. On a comparable basis, operating income increased 9.2%.
(1) According to IFRS 5, figures from 2018 do not include the Philippines as it is presented as a discontinued operation as of January 1, 2018.
(2) Please refer to page 7 for our definition of “comparable” and a description of the factors affecting the comparability of our financial and operating performance.
(3) Operating cash flow = operating income + depreciation + amortization & other operating non-cash charges.
Comparable (2)
Expressed in millions of Mexican pesos 1Q 2019 1Q 2018 Δ% Δ%
Total revenues 46,248 44,122 4.8% 10.0%
Gross profit 20,892 20,215 3.3% 8.8%
Operating income 5,714 5,765 (0.9%) 9.2%
Operating cash flow (3) 8,541 8,164 4.6% 11.1%
CONSOLIDATED FIRST QUARTER RESULTS
As Reported (1)

Coca-Cola FEMSA Reports 1Q2019 Results
April 26, 2019 Page 4 of 13
Comprehensive financing result recorded an expense of Ps. 1,593 million, compared to an expense of Ps. 2,100 million in the
same period of 2018. This reduction was driven mainly by a reduction in our interest expense, net, a reduction in foreign exchange
loss—as our cash exposure in U.S. dollars was negatively impacted by the appreciation of the Mexican Peso during the first quarter
of 2019—and a reduction in other financial expenses.
Income tax as a percentage of income before taxes was 32.6% as compared to 30.7% during the same period of the previous year.
This increase was driven mainly by the increase in the relative weight of Brazil’s profits in our consolidated results, which has a
higher tax rate, and a higher effective tax in Colombia.
Net income attributable to equity holders of the company reached Ps. 2,590 million as compared to Ps. 2,414 million during the
same period of the previous year. Earnings per share1 were Ps. 0.15 (earnings per unit5 were Ps. 1.23 and earnings per ADS were
Ps. 12.33).
(1) Quarterly earnings / outstanding shares. Earnings per share (EPS) for all periods are adjusted to give effect to the stock split resulting in 16,806.7 million shares
outstanding. For the convenience of the reader, as a KOF UBL Unit is comprised of 8 shares (3 Series B shares and 5 Series L shares), earnings per unit are equal to EPS
multiplied by 8. Each ADS represents 10 KOF UBL Units.

Coca-Cola FEMSA Reports 1Q2019 Results
April 26, 2019 Page 5 of 13
MEXICO & CENTRAL AMERICA DIVISION FIRST QUARTER RESULTS
(Mexico, Guatemala, Costa Rica, Panama, and Nicaragua)
Volume increased 0.7% to 478.0 million unit cases, driven by the consolidation of recently acquired territories in Guatemala and
volume growth in Costa Rica, partially offset by volume decline in Mexico, Nicaragua and Panama. On a comparable basis, volume
declined 2.3%.
Total revenues increased 11.4% to Ps. 24,823 million, driven by pricing ahead of inflation across the division, volume growth in
Costa Rica and the consolidation of recently acquired territories in Guatemala as of May 1, 2018, partially offset by volume declines
in Mexico, Nicaragua and Panama and by an slight unfavorable mix driven by volumes outperforming transactions. On a
comparable basis, total revenues increased 7.2%.
Gross profit increased 12.4% to Ps. 11,781 million and gross profit margin expanded 40 basis points to 47.5% driven mainly by our
pricing initiatives and lower sweetener costs. These factors were partially offset by higher concentrate costs in Mexico, higher PET
prices and an unfavorable currency hedging position in Mexico. On a comparable basis, gross profit increased 8.3%.
Operating income increased 15.6% to Ps. 3,076 million in the first quarter of 2019, and operating income margin expanded 50
basis points to 12.4% during the period driven mainly by lower maintenance and freight costs, partially offset by a non-cash
operating foreign exchange loss and restructuring indemnities. On a comparable basis, operating income increased 12.4%.
(1) According to IFRS 5, figures from 2018 do not include the Philippines as it is presented as a discontinued operation as of January 1, 2018.
(2) Please refer to page 7 for our definition of “comparable” and a description of the factors affecting the comparability of our financial and operating performance.
(3) Operating cash flow = operating income + depreciation + amortization & other operating non-cash charges.
Comparable (2)
Expressed in millions of Mexican pesos 1Q 2019 1Q 2018 Δ% Δ%
Total revenues 24,823 22,277 11.4% 7.2%
Gross profit 11,781 10,484 12.4% 8.3%
Operating income 3,076 2,662 15.6% 12.4%Operating cash flow (3)
4,772 4,096 16.5% 12.5%
MEXICO & CENTRAL AMERICA DIVISION RESULTS
As Reported (1)

Coca-Cola FEMSA Reports 1Q2019 Results
April 26, 2019 Page 6 of 13
SOUTH AMERICA DIVISION FIRST QUARTER RESULTS
(Brazil, Argentina, Colombia, and Uruguay)
Volume increased 1.6% to 318.1 million unit cases, driven by a 9.1% volume growth in Brazil and the consolidation of the recently
acquired territory in Uruguay partially offset by volume declines in Argentina and Colombia. On a comparable basis, volume grew
4.3%.
Total revenues declined 1.9% to Ps. 21,425 million, driven mainly by a volume contraction in Argentina and Colombia, coupled
with an unfavorable currency translation effect resulting from the depreciation of the Argentine Peso, the Brazilian Real, and the
Colombian Peso as compared to the Mexican Peso. These factors were partially offset by strong volume growth in Brazil, pricing
ahead of inflation in Argentina, Brazil, and Colombia, a favorable mix effect driven by transactions outperforming volumes, and
the consolidation of the recently acquired territory in Uruguay as of July 1, 2018. On a comparable basis, total revenues increased
13.7%.
Gross profit decreased 6.4% to Ps. 9,111 million, and gross profit margin contracted 200 basis points to 42.5%. This is a result of
higher PET prices in the division, higher concentrate costs in Brazil related to the reduction of tax credits on concentrate purchased
from the Manaus free trade zone, and the depreciation of the average exchange rate of the Argentine Peso, the Brazilian Real,
and the Colombian Peso as applied to our U.S. dollar-denominated raw material costs. These factors were partially offset by our
pricing initiatives and lower sweetener prices. On a comparable basis, gross profit increased 9.7%.
Operating income decreased 15.0% to Ps. 2,638 million in the first quarter of 2019, resulting in a margin contraction of 190 basis
points to 12.3% driven mainly by restructuring indemnities in Colombia, partially offset by operating expense efficiencies. On a
comparable basis, operating income increased 5.4%.
(1) According to IFRS 5, figures from 2018 do not include the Philippines as it is presented as a discontinued operation as of January 1, 2018.
(2) Please refer to page 7 for our definition of “comparable” and a description of the factors affecting the comparability of our financial and operating performance.
(3) Operating cash flow = operating income + depreciation + amortization & other operating non-cash charges.
Comparable (2)
Expressed in millions of Mexican pesos 1Q 2019 1Q 2018 Δ% Δ%
Total revenues 21,425 21,845 (1.9%) 13.7%
Gross profit 9,111 9,732 (6.4%) 9.7%
Operating income 2,638 3,103 (15.0%) 5.4%Operating cash flow (3)
3,768 4,068 (7.4%) 9.1%
As Reported (1)
SOUTH AMERICA DIVISION RESULTS

Coca-Cola FEMSA Reports 1Q2019 Results
April 26, 2019 Page 7 of 13
DEFINITIONS
Volume is expressed in unit cases. Unit case refers to 192 ounces of finished beverage product (24 eight-ounce servings) and,
when applied to soda fountains, refers to the volume of syrup, powders and concentrate that is required to produce 192 ounces
of finished beverage product.
Transactions refers to the number of single units (e.g. a can or a bottle) sold, regardless of their size or volume or whether they
are sold individually or in multipacks, except for soda fountains, which represent multiple transactions based on a standard 12 oz.
serving.
Operating income is a non-GAAP financial measure computed as “gross profit – operating expenses – other operating expenses,
net + operative equity method (gain) loss in associates.”
Operating cash flow is a non-GAAP financial measure computed as “operating income + depreciation + amortization & other
operating non-cash charges.”
Earnings per share are equal to “quarterly earnings / outstanding shares.” Earnings per share (EPS) for all periods are adjusted to
give effect to the stock split resulting in 16,806,658,096 shares outstanding. For the convenience of the reader, as a KOF UBL Unit
is comprised of 8 shares (3 Series B shares and 5 Series L shares), earnings per unit are equal to EPS multiplied by 8. Each ADS
represents 10 KOF UBL Units.
COMPARABILITY
In an effort to provide our readers with a more useful representation of our company's underlying financial and operating
performance, we are including the term “Comparable.” This means, with respect to a year-over-year comparison, the change of
a given measure excluding the effects of: (i) mergers, acquisitions, and divestitures, including acquisitions made in Guatemala and
Uruguay as of May and July 2018, respectively; (ii) translation effects resulting from exchange rate movements; and (iii) the results
of hyperinflationary subsidiaries in both periods: Argentina’s results from 2019 and 2018. In preparing this measure, management
has used its best judgment, estimates, and assumptions in order to maintain comparability. The relation between our reported
and comparable figures is described in the following chart:
(*)Reported 2018 figures reflect the Philippines as a discontinued operation.

Coca-Cola FEMSA Reports 1Q2019 Results
April 26, 2019 Page 8 of 13
ABOUT THE COMPANY
Stock listing information: Mexican Stock Exchange, Ticker: KOF UBL | NYSE (ADS), Ticker: KOF | Ratio of KOF UBL to KOF = 10:1
Coca-Cola FEMSA files reports, including annual reports and other information with the U.S. Securities and Exchange Commission,
or the “SEC”, and the Mexican Stock Exchange (Bolsa Mexicana de Valores, or the “BMV”) pursuant to the rules and regulations
of the SEC (that apply to foreign private issuers) and of the BMV. Filings we make electronically with the SEC and the BMV are
available to the public on the Internet at the SEC’s website at www.sec.gov, the BMV’s website at www.bmv.com.mx and our
website at www.coca-colafemsa.com.
Coca-Cola FEMSA, S.A.B. de C.V. is the largest Coca-Cola franchise bottler in the world by sales volume. The Company produces
and distributes trademark beverages of The Coca-Cola Company, offering a wide portfolio of 131 brands to a population of more
than 257 million. With over 83 thousand employees, the Company markets and sells approximately 3.3 billion unit cases through
close to 2 million points of sale a year. Operating 49 manufacturing plants and 275 distribution centers, Coca-Cola FEMSA is
committed to generating economic, social, and environmental value for all of its stakeholders across the value chain. The Company
is a member of the Dow Jones Sustainability Emerging Markets Index, Dow Jones Sustainability MILA Pacific Alliance Index,
FTSE4Good Emerging Index, and the Mexican Stock Exchange’s IPC and Social Responsibility and Sustainability Indices, among
others. Its operations encompass franchise territories in Mexico, Brazil, Guatemala, Colombia, and Argentina, and, nationwide, in
Costa Rica, Nicaragua, Panama, Uruguay, and Venezuela through its investment in KOF Venezuela. For further information, please
visit www.coca-colafemsa.com
ADDITIONAL INFORMATION
All of the financial information presented in this report was prepared under International Financial Reporting Standards (IFRS).
This news release may contain forward-looking statements concerning Coca-Cola FEMSA’s future performance, which should be
considered as good faith estimates by Coca-Cola FEMSA. These forward-looking statements reflect management’s expectations
and are based upon currently available data. Actual results are subject to future events and uncertainties, many of which are
outside Coca-Cola FEMSA’s control, which could materially impact the Company’s actual performance. References herein to “US$”
are to United States dollars. This news release contains translations of certain Mexican peso amounts into U.S. dollars for the
convenience of the reader. These translations should not be construed as representations that Mexican peso amounts actually
represent such U.S. dollar amounts or could be converted into U.S. dollars at the rate indicated.
(5 pages of tables to follow)

Coca-Cola FEMSA Reports 1Q2019 Results
April 26, 2019 Page 9 of 13
(1) Except volume and average price per unit case figures. (2) Please refer to page 12 for revenue breakdown. (3) Includes equity method in Jugos del Valle, Leao Alimentos, Estrella Azul, among others. (4) According to IFRS 5, figures from 2018 do not include the Philippines as it is presented as a discontinued operation as of January 1, 2018. (5) Includes equity method in PIASA, IEQSA, Beta San Miguel, IMER and KSP Participacoes among others. (6) The operating income and operating cash flow lines are presented as non-gaap measures for the convenience of the reader. (7) Operating cash flow = operating income + depreciation, amortization & other operating non-cash charges. (8) Please refer to page 7 for our definition of “comparable” and a description of the factors affecting the comparability of our financial and operating performance.
2019 % of Rev. 2018 (4) % of Rev. Δ% Reported Δ% Comparable (8)
Transactions (million transactions) 4,837.8 4,685.5 3.3% 3.1%
Volume (million unit cases) 796.1 787.9 1.0% 0.1%
Average price per unit case 52.57 51.30 2.5%
Net revenues 46,021 44,005 4.6%
Other operating revenues 227 117 93.8%
Total revenues (2) 46,248 100.0% 44,122 100.0% 4.8% 10.0%
Cost of goods sold 25,355 54.8% 23,907 54.2% 6.1%
Gross profit 20,892 45.2% 20,215 45.8% 3.3% 8.8%
Operating expenses 14,847 32.1% 14,370 32.6% 3.3%
Other operative expenses, net 310 0.7% 31 0.1% 890.0%
Operative equity method (gain) loss in associates (3) 22 0.0% 49 0.1% -55.6%
Operating income (6) 5,714 12.4% 5,765 13.1% -0.9% 9.2%
Other non operative expenses, net 75 0.2% 62 0.1% 21.1%
Non Operative equity method (gain) loss in associates (5) (34) -0.1% 12 0.0% NA
Interest expense 1,735 2,009 -13.7%
Interest income 249 376 -33.9%
Interest expense, net 1,486 1,633 -9.0%
Foreign exchange loss (gain) 112 221 -49.1%
Loss (gain) on monetary position in inflationary subsidiries (5) - NA
Market value (gain) loss on financial instruments (0) 246 NA
Comprehensive financing result 1,593 2,100 -24.1%
Income before taxes 4,079 3,592 13.6%
Income taxes 1,331 1,102 20.8%
Result of discontinued operations - 51 NA
Consolidated net income 2,749 2,541 8.2%
Net income attributable to equity holders of the company 2,590 5.6% 2,414 5.5% 7.3%
Non-controlling interest 158 0.3% 127 0.3% 24.3%
Operating Cash Flow & CAPEX 2019 % of Rev. 2018 (4) % of Rev. Δ% Reported Δ% Comparable (8)
Operating income (6) 5,714 12.4% 5,765 13.1% -0.9%
Depreciation 2,262 1,983 14.1%
Amortization and other operative non-cash charges 564 416 35.6%
Operating cash flow (6)(7) 8,541 18.5% 8,164 18.5% 4.6% 11.1%
CAPEX 1,541 1,612 -4.5%
COCA-COLA FEMSACONSOLIDATED INCOME STATEMENT
Millions of Pesos (1)
For the First Quarter of:

Coca-Cola FEMSA Reports 1Q2019 Results
April 26, 2019 Page 10 of 13
(1) Except volume and average price per unit case figures. (2) Please refer to page 12 for revenue breakdown. (3) Includes equity method in Jugos del Valle, Estrella Azul, among others. (4) The operating income and operating cash flow lines are presented as non-gaap measures for the convenience of the reader. (5) Operating cash flow = operating income + depreciation, amortization & other operating non-cash charges. (6) Please refer to page 7 for our definition of “comparable” and a description of the factors affecting the comparability of our financial and operating performance.
(1) Except volume and average price per unit case figures. (2) Please refer to page 12 for revenue breakdown. (3) Includes equity method in Leao Alimentos, Verde Campo, among others. (4) The operating income and operating cash flow lines are presented as non-gaap measures for the convenience of the reader. (5) Operating cash flow = operating income + depreciation, amortization & other operating non-cash charges. (6) Please refer to page 7 for our definition of “comparable” and a description of the factors affecting the comparabil ity of our financial and operating performance.
2019 % of Rev. 2018 % of Rev. Δ% Reported Δ% Comparable (6)
Transactions (million transactions) 2,688.4 2,674.0 0.5% 0.0%
Volume (million unit cases) 478.0 474.9 0.7% -2.2%
Average price per unit case 51.86 46.89 10.6%
Net revenues 24,788 22,269
Other operating revenues 35 9
Total Revenues (2)
24,823 100.0% 22,277 100.0% 11.4% 7.2%
Cost of goods sold 13,042 52.5% 11,794 52.9%
Gross profit 11,781 47.5% 10,484 47.1% 12.4% 8.3%
Operating expenses 8,556 34.5% 7,866 35.3%
Other operative expenses , net 112 0.5% (103) -0.5%
Operative equity method (ga in) loss in associates (3) 36 0.1% 59 0.3%
Operating income (4) 3,076 12.4% 2,662 11.9% 15.6% 12.4%
Depreciation, amortization & other operating non-cash charges 1,696 6.8% 1,434 6.4%
Operating cash flow (4)(5) 4,772 19.2% 4,096 18.4% 16.5% 12.5%
For the First Quarter of:
Millions of Pesos (1)
MEXICO & CENTRAL AMERICA DIVISION RESULTS OF OPERATIONS
2019 % of Rev. 2018 % of Rev. Δ% Reported Δ% Comparable (6)
Transactions (million transactions) 2,149.4 2,011.5 6.9% 7.9%
Volume (million unit cases) 318.1 313.0 1.6% 4.3%
Average price per unit case 53.65 57.98 -7.5%
Net revenues 21,233 21,737
Other operating revenues 192 108
Total Revenues (2)
21,425 100.0% 21,845 100.0% -1.9% 13.7%
Cost of goods sold 12,314 57.5% 12,113 55.5%
Gross profit 9,111 42.5% 9,732 44.5% -6.4% 9.7%
Operating expenses 6,291 29.4% 6,504 29.8%
Other operative expenses , net 197 0.9% 135 0.6%
Operative equity method (ga in) loss in associates (3) (15) -0.1% (10) 0.0%
Operating income (4) 2,638 12.3% 3,103 14.2% -15.0% 5.4%
Depreciation, amortization & other operating non-cash charges 1,130 5.3% 965 4.4%
Operating cash flow (4)(5) 3,768 17.6% 4,068 18.6% -7.4% 9.1%
RESULTS OF OPERATIONS
SOUTH AMERICA DIVISION
For the First Quarter of:
Millions of Pesos (1)

Coca-Cola FEMSA Reports 1Q2019 Results
April 26, 2019 Page 11 of 13
Assets Mar-19 Dec-18 % Var. Liabilities & Equity Mar-19 Dec-18 % Var.
Current Assets Current Liabilities
Short-term bank loans and notes payable 16,862 11,604 45%
23,615 23,727 0% Suppliers 16,547 19,746 -16%
Total accounts receivable 10,814 14,847 -27% Short-term leasing Liabilities 498 -
Inventories 10,661 10,051 6% Other current liabilities 22,587 14,174 59%
Other current assets 8,699 8,865 -2% Total current liabilities 56,494 45,524 24%
Total current assets 53,789 57,490 -6% Non-Current Liabilities
Non-Current Assets Long-term bank loans and notes payable 59,328 70,201 -15%
Property, plant and equipment 105,485 106,259 -1% Long Term Leasing Liabilities. 1,146 -
Accumulated depreciation (45,073) (44,316) 2% Other long-term liabilities 16,645 16,313 2%
Total property, plant and equipment, net 60,411 61,942 -2% Total liabilities 133,612 132,037 1%
Right of use assets 1,637 - NA Equity
Investment in shares 10,688 10,518 2% Non-controlling interest 6,808 6,807 0%
Intangible assets and other assets 115,640 116,804 -1% Total controlling interest 118,674 124,943 -5%
Other non-current assets 16,931 17,033 -1% Total equity 125,483 131,750 -5%
Total Assets 259,095 263,788 -2% Total Liabilities and Equity 259,095 263,788 -2%
Debt Mix% Total Debt
(1)
% Interest Rate
Floating (1) (2)
Average
Rate
Currency
Mexican Pesos 57.3% 10.9% 8.4%
U.S. Dollars 9.5% 0.0% 3.9%
Colombian Pesos 1.9% 85.3% 5.7%
Brazilian Reals 29.3% 1.8% 8.5%
Uruguayan Pesos 1.7% 0.0% 10.0%
Argentine Pesos 0.3% 0.0% 39.7%
Total Debt 100% 4.6% 8.1%(1) After giving effect to cross- currency swaps.(2) Calculated by weighting each year´s outstanding debt balance mix.
Financial Ratios LTM 2019 FY 2018 Δ%
Net debt including effect of hedges (1)(3) 51,590 56,934 -9.4%
Net debt including effect of hedges /
Operating cash flow (1)(3) 1.43 1.61
Operating cash flow/ Interest expense, net (1) 5.75 5.40
Capitalization (2) 41.2% 40.5%(1) Net debt = total debt - cash(2) Total debt / (long-term debt + shareholders' equity)(3) After giving effect to cross-currency swaps.
March 31, 2019
Debt Maturity Profile
COCA-COLA FEMSA
CONSOLIDATED BALANCE SHEETMillions of Pesos
Cash, cash equivalents and marketable
securities

Coca-Cola FEMSA Reports 1Q2019 Results
April 26, 2019 Page 12 of 13
(1) Volume is expressed in unit cases. Unit case refers to 192 ounces of finished beverage product (24 eight-ounce servings) and, when applied to soda fountains, refers to
the volume of syrup, powders and concentrate that is required to produce 192 ounces of finished beverage product. (2) Transactions refers to the number of single units (e.g. a can or a bottle) sold, regardless of their size or volume or whether they are sold individually or in multipacks,
except for fountain which represents multiple transactions based on a standard 12 oz. serving.
YoY
Sparkling Water (1)
Bulk (2) Stills Total Sparkling Water
(1)Bulk
(2) Stills Total Δ %
Mexico 304.5 21.9 66.0 29.2 421.6 310.1 25.2 66.5 28.2 430.0 -1.9%
Central America 48.0 3.0 0.2 5.1 56.4 36.8 2.9 0.2 5.0 44.9 25.5%
Mexico and Central America 352.5 24.9 66.2 34.3 478.0 347.0 28.1 66.7 33.1 474.9 0.7%
Colombia 45.7 6.3 4.7 3.6 60.4 50.4 6.8 5.1 4.4 66.7 -9.4%
Brazil 182.3 14.6 2.4 13.1 212.4 169.3 12.4 2.1 10.9 194.8 9.1%
Argentina 27.4 3.8 1.0 2.5 34.7 40.8 5.3 1.5 4.0 51.6 -32.7%
Uruguay 9.5 1.0 - 0.1 10.6 - - - - - NA
South America 264.9 25.7 8.1 19.4 318.1 260.5 24.6 8.6 19.3 313.0 1.6%
TOTAL 617.4 50.6 74.3 53.7 796.1 607.5 52.6 75.3 52.4 787.9 1.0%
(1) Excludes water presentations larger than 5.0 Lt ; includes flavored water.(2) Bulk Water = Still bottled water in 5.0, 19.0 and 20.0 - liter packaging presentations; includes flavored water
Transactions YoY
Sparkling Stills Total Sparkling Stills Total Δ %
Mexico 1,827.4 251.4 2,223.1 1,886.4 230.3 2,299.4 -3.3%
Central America 388.4 58.9 465.3 295.2 63.1 374.6 24.2%
Mexico and Central America 2,215.9 310.3 2,688.4 2,181.6 293.4 2,674.0 0.5%
Colombia 333.5 39.5 457.8 373.5 48.7 505.8 -9.5%
Brazil 1,180.9 130.0 1,435.7 1,024.3 116.0 1,248.7 15.0%
Argentina 160.0 18.3 200.9 204.4 25.1 257.0 -21.8%
Uruguay 50.1 0.7 55.0 - - - -
South America 1,724.4 188.6 2,149.4 1,602.2 189.9 2,011.5 6.9%
TOTAL 3,940.3 498.8 4,837.8 3,783.8 483.3 4,685.5 3.3%
Revenues
Expressed in million Mexican Pesos 1Q 2019 1Q 2018 (3)
Δ %
Mexico 20,574 19,084 7.8%
Central America 4,248 3,193 33.0%
Mexico and Central America 24,823 22,277 11.4%
Colombia 3,189 3,600 -11.4%
Brazil (4) 15,512 14,848 4.5%
Argentina 1,825 3,397 -46.3%
Uruguay 899 - -
South America 21,425 21,845 -1.9%
TOTAL 46,248 44,122 4.8%
(3) Volume, transactions and revenues for 1Q 2018 are re-presented excluding the Philippines.(4) Brazil includes beer revenues of Ps.4,166.6 million for the first quarter of 2019 and Ps. 3,586.5 million for the same period of the previous year.
1Q 2019
COCA-COLA FEMSA
QUARTERLY- VOLUME, TRANSACTIONS & REVENUES
Volume
Water
144.3
17.9
162.3
84.8
124.8
22.6
4.2 -
236.4
398.7
1Q 2018 (3)1Q 2019
Water
182.7
16.3
418.4
1Q 2018 (3)
199.0
83.6
108.3
27.5
219.4
Mexico 53%
Central America 7%
Colombia 8%
Brazil 27%
Argentina 4%
Uruguay 1%
VOLUME (1)
Mexico 46%
Central America 10%
Colombia 9%
Brazil 30%
Argentina 4%
Uruguay 1%
TRANSACTIONS (2)

Coca-Cola FEMSA Reports 1Q2019 Results
April 26, 2019 Page 13 of 13
LTM 1Q19
Mexico 3.52% 0.03%
Colombia 2.88% 1.76%
Brazi l 4.00% 1.18%
Argentina 53.26% 10.80%
Costa Rica 1.40% 0.21%
Panama -0.70% -0.09%
Guatemala 4.81% 1.63%
Nicaragua 3.41% 0.30%
Uruguay 7.60% 4.17%
(1) Source: inflation estimated by the company based on historic publications from the Central Bank of each country.
1Q19 1Q18 Δ %
Mexico 19.22 18.76 2.5%
Colombia 3,134.36 2,860.36 9.6%
Brazi l 3.77 3.24 16.2%
Argentina 39.10 19.70 98.4%
Costa Rica 609.96 571.95 6.6%
Panama 1.00 1.00 0.0%
Guatemala 7.72 7.37 4.8%
Nicaragua 32.53 30.98 5.0%
Uruguay 32.83 28.46 15.4%
Mar-19 Mar-18 Δ % Dic-18 Dic-17 Δ %
Mexico 19.38 18.34 5.6% 19.68 19.74 -0.3%
Colombia 3,174.79 2,780.47 14.2% 3,249.75 2,984.00 8.9%
Brazi l 3.90 3.32 17.2% 3.87 3.31 17.1%
Argentina 43.35 20.15 115.1% 37.70 18.65 102.1%
Costa Rica 602.36 569.31 5.8% 611.75 572.56 6.8%
Panama 1.00 1.00 0.0% 1.00 1.00 0.0%
Guatemala 7.68 7.40 3.8% 7.74 7.34 5.4%
Nicaragua 32.72 31.16 5.0% 32.33 30.79 5.0%
Uruguay 33.48 28.35 18.1% 32.39 28.76 12.6%
(2) Average exchange rate for each period computed with the average exchange rate of each month.
Closing Exchange Rate
(Local Currency per USD)
Closing Exchange Rate
(Local Currency per USD)
COCA-COLA FEMSAMACROECONOMIC INFORMATION
Quarterly Exchange Rate
(Local Currency per USD)
Inflation (1)
Average Exchange Rates for each period (2)
End-of-period Exchange Rates