condensed consolidated interim financial statements 2015 · Condensed Consolidated Interim...
17
JANUARY – MARCH 2015 CONDENSED CONSOLIDATED INTERIM FINANCIAL STATEMENTS 2015 (UNAUDITED)
-
Upload
truongthuy -
Category
Documents
-
view
216 -
download
0
Transcript of condensed consolidated interim financial statements 2015 · Condensed Consolidated Interim...
January – march 2015
condensed consolidated
interim financial statements 2015
(unaudited)
contents
1. income statement 1
2. statement of comprehensive income 2
3. Balance sheet 3
4. statement of changes in equit y 4
5. cash flow statement 5
6. notes to the condensed consolidated
interim financial statements 6
7. financial calendar 14
Schindellegi, April 13, 2015
1 Condensed Consolidated Interim Financial Statements 2015 Income StAtement
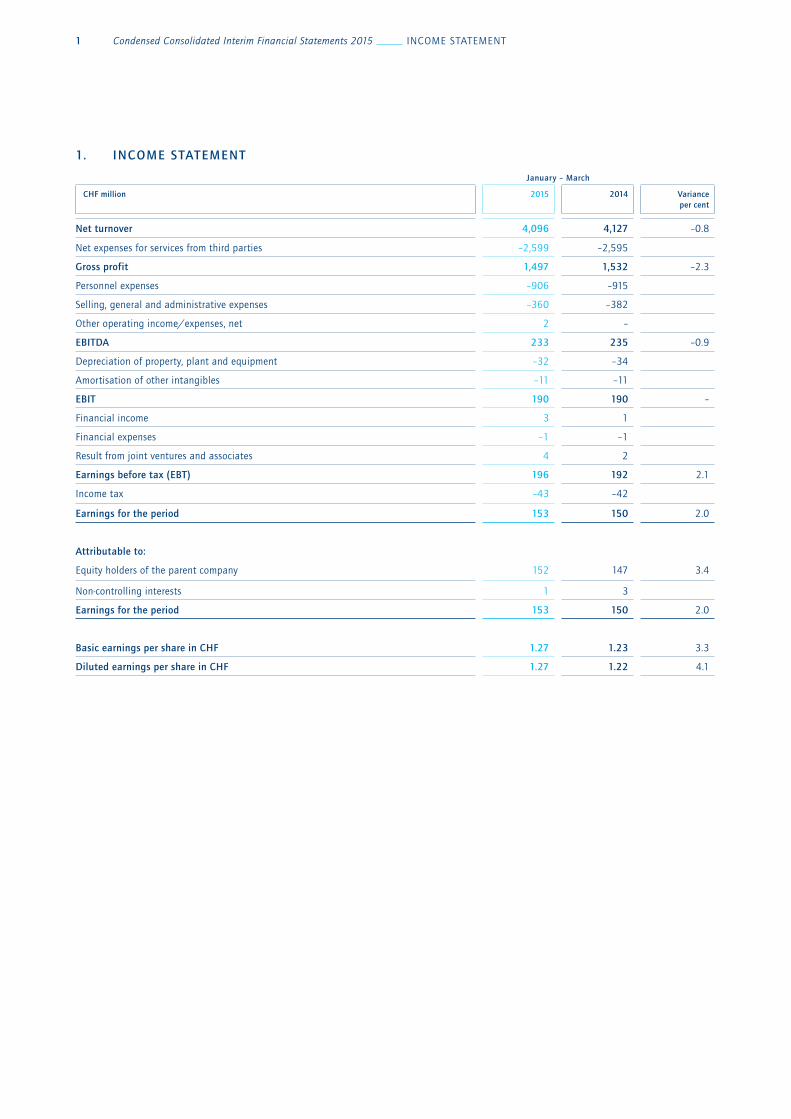
1. income statement
January – march
chf million 2015 2014 varianceper cent
net turnover 4,096 4,127 –0.8
net expenses for services from third parties –2,599 –2,595
gross profit 1,497 1,532 –2.3
Personnel expenses –906 –915
Selling, general and administrative expenses –360 –382
other operating income/expenses, net 2 –
eBitda 233 235 –0.9
Depreciation of property, plant and equipment –32 –34
Amortisation of other intangibles –11 –11
eBit 190 190 –
Financial income 3 1
Financial expenses –1 –1
Result from joint ventures and associates 4 2
earnings before tax (eBt) 196 192 2.1
Income tax –43 –42
earnings for the period 153 150 2.0
attributable to:
equity holders of the parent company 152 147 3.4
non-controlling interests 1 3
earnings for the period 153 150 2.0
Basic earnings per share in chf 1.27 1.23 3.3
diluted earnings per share in chf 1.27 1.22 4.1
Condensed Consolidated Interim Financial Statements 2015 StAtement oF comPRehenSIve Income 2
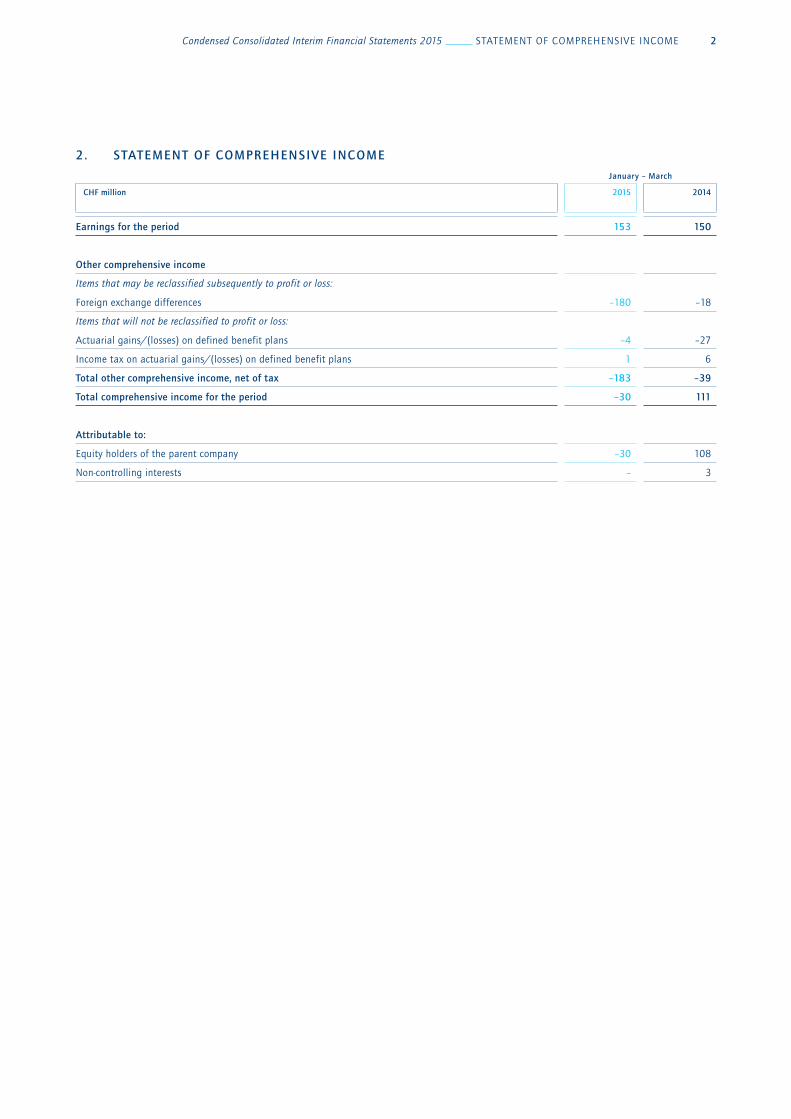
2. statement of comprehensive income
January – march
chf million 2015 2014
earnings for the period 153 150
other comprehensive income
Items that may be reclassified subsequently to profit or loss:
Foreign exchange differences –180 –18
Items that will not be reclassified to profit or loss:
Actuarial gains/(losses) on defined benefit plans –4 –27
Income tax on actuarial gains/(losses) on defined benefit plans 1 6
total other comprehensive income, net of tax –183 –39
total comprehensive income for the period –30 111
attributable to:
equity holders of the parent company –30 108
non-controlling interests – 3
3 Condensed Consolidated Interim Financial Statements 2015 BAl Ance Sheet
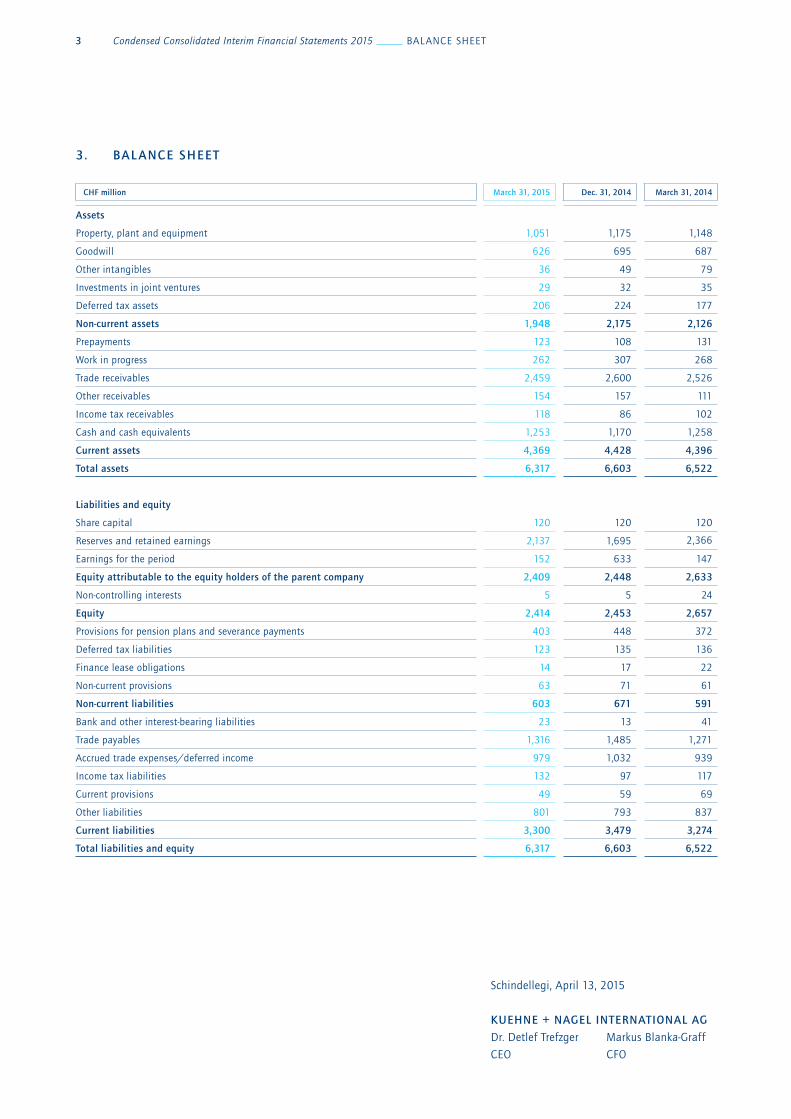
Schindellegi, April 13, 2015
Kuehne + nagel international ag
Dr. Detlef trefzger markus Blanka-Graff
ceo cFo
3. Bal ance sheet
chf million march 31, 2015 dec. 31, 2014 march 31, 2014
assets
Property, plant and equipment 1,051 1,175 1,148
Goodwill 626 695 687
other intangibles 36 49 79
Investments in joint ventures 29 32 35
Deferred tax assets 206 224 177
non-current assets 1,948 2,175 2,126
Prepayments 123 108 131
Work in progress 262 307 268
trade receivables 2,459 2,600 2,526
other receivables 154 157 111
Income tax receivables 118 86 102
cash and cash equivalents 1,253 1,170 1,258
current assets 4,369 4,428 4,396
total assets 6,317 6,603 6,522
liabilities and equity
Share capital 120 120 120
Reserves and retained earnings 2,137 1,695 2,366
earnings for the period 152 633 147
equity attributable to the equity holders of the parent company 2,409 2,448 2,633
non-controlling interests 5 5 24
equity 2,414 2,453 2,657
Provisions for pension plans and severance payments 403 448 372
Deferred tax liabilities 123 135 136
Finance lease obligations 14 17 22
non-current provisions 63 71 61
non-current liabilities 603 671 591
Bank and other interest-bearing liabilities 23 13 41
trade payables 1,316 1,485 1,271
Accrued trade expenses/deferred income 979 1,032 939
Income tax liabilities 132 97 117
current provisions 49 59 69
other liabilities 801 793 837
current liabilities 3,300 3,479 3,274
total liabilities and equity 6,317 6,603 6,522
Condensed Consolidated Interim Financial Statements 2015 StAtement oF chAnGeS In equIt y 4
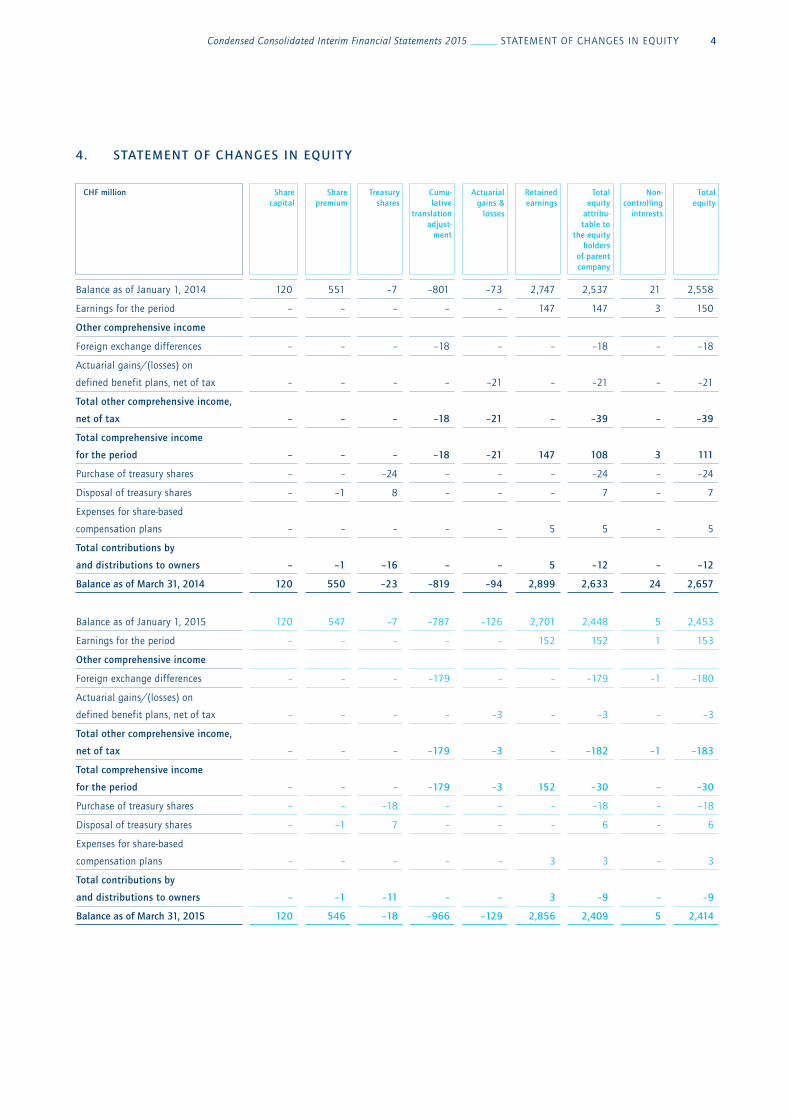
4. statement of changes in equit y
chf million sharecapital
sharepremium
treasuryshares
cumu-lative
translation adjust-
ment
actuarial gains &
losses
retained earnings
total equity
attribu-table to
the equity holders
of parent company
non-controlling
interests
total equity
Balance as of January 1, 2014 120 551 –7 –801 –73 2,747 2,537 21 2,558
earnings for the period – – – – – 147 147 3 150
other comprehensive income
Foreign exchange differences – – – –18 – – –18 – –18
Actuarial gains/(losses) on
defined benefit plans, net of tax – – – – –21 – –21 – –21
total other comprehensive income,
net of tax – – – –18 –21 – –39 – –39
total comprehensive income
for the period – – – –18 –21 147 108
3 111
Purchase of treasury shares – – –24 – – – –24 – –24
Disposal of treasury shares – –1 8 – – – 7 – 7
expenses for share-based
compensation plans – – – – – 5 5 – 5
total contributions by
and distributions to owners – –1 –16 – – 5 –12 – –12
Balance as of march 31, 2014 120 550 –23 –819 –94 2,899 2,633 24 2,657
Balance as of January 1, 2015 120 547 –7 –787 –126 2,701 2,448 5 2,453
earnings for the period – – – – – 152 152 1 153
other comprehensive income
Foreign exchange differences – – – –179 – – –179 –1 –180
Actuarial gains/(losses) on
defined benefit plans, net of tax – – – – –3 – –3 – –3
total other comprehensive income,
net of tax – –
– –179 –3 – –182 –1 –183
total comprehensive income
for the period – – – –179 –3
152 –30 – –30
Purchase of treasury shares – – –18 – – – –18 – –18
Disposal of treasury shares – –1 7 – – – 6 – 6
expenses for share-based
compensation plans – – – –
– 3 3 – 3
total contributions by
and distributions to owners – –1 –11 – – 3 –9 – –9
Balance as of march 31, 2015 120 546 –18 –966 –129 2,856 2,409 5 2,414
5 Condensed Consolidated Interim Financial Statements 2015 cASh FloW StAtement
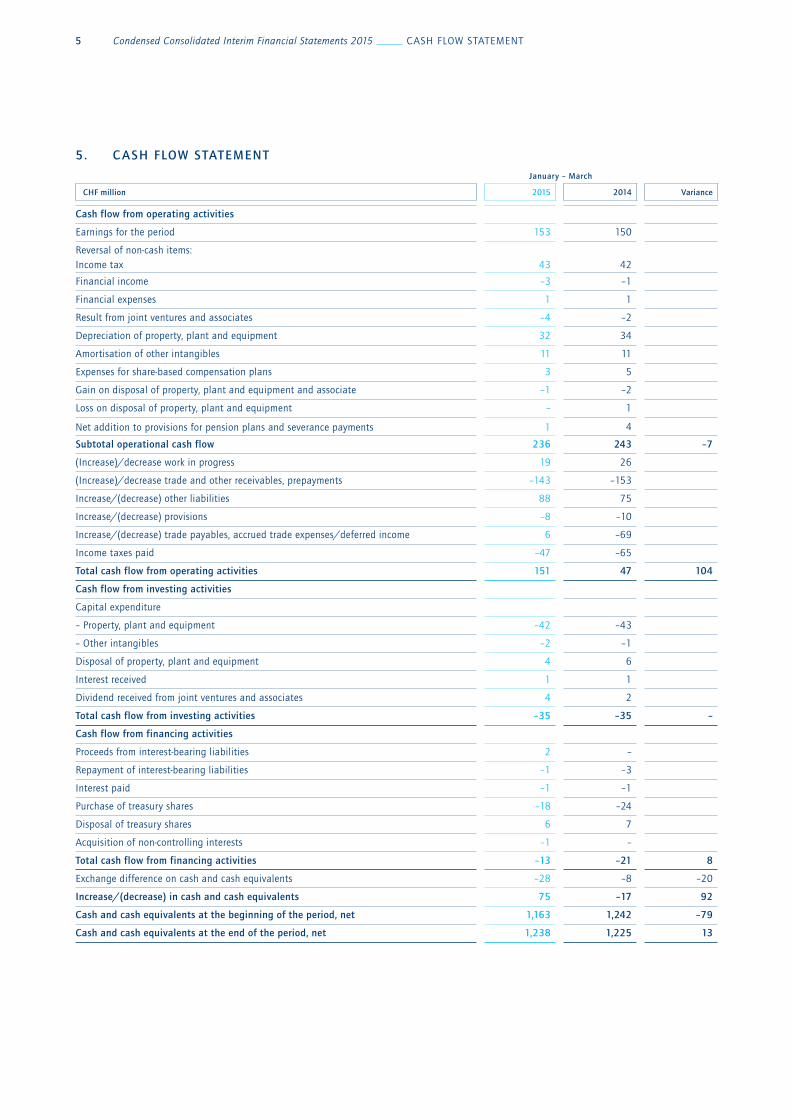
5. c ash flow statement
January – march
chf million 2015 2014 variance
cash flow from operating activities
earnings for the period 153 150
Reversal of non-cash items: Income tax 43 42
Financial income –3 –1
Financial expenses 1 1
Result from joint ventures and associates –4 –2
Depreciation of property, plant and equipment 32 34
Amortisation of other intangibles 11 11
expenses for share-based compensation plans 3 5
Gain on disposal of property, plant and equipment and associate –1 –2
loss on disposal of property, plant and equipment – 1
net addition to provisions for pension plans and severance payments 1 4
subtotal operational cash flow 236 243 –7
(Increase)/decrease work in progress 19 26
(Increase)/decrease trade and other receivables, prepayments –143 –153
Increase/(decrease) other liabilities 88 75
Increase/(decrease) provisions –8 –10
Increase/(decrease) trade payables, accrued trade expenses/deferred income 6 –69
Income taxes paid –47 –65
total cash flow from operating activities 151 47 104
cash flow from investing activities
capital expenditure
– Property, plant and equipment –42 –43
– other intangibles –2 –1
Disposal of property, plant and equipment 4 6
Interest received 1 1
Dividend received from joint ventures and associates 4 2
total cash flow from investing activities –35 –35 –
cash flow from financing activities
Proceeds from interest-bearing liabilities 2 –
Repayment of interest-bearing liabilities –1 –3
Interest paid –1 –1
Purchase of treasury shares –18 –24
Disposal of treasury shares 6 7
Acquisition of non-controlling interests –1 –
total cash flow from financing activities –13 –21 8
exchange difference on cash and cash equivalents –28 –8 –20
increase/(decrease) in cash and cash equivalents 75 –17 92
cash and cash equivalents at the beginning of the period, net 1,163 1,242 –79
cash and cash equivalents at the end of the period, net 1,238 1,225 13

Condensed Consolidated Interim Financial Statements 2015 noteS 6
6. notes to the condensed consolidated interim financial statements
6.1 organisation
Kuehne + nagel International AG (the company) is incorporated
in Schindellegi (Feusisberg), Switzerland. the company is one of
the world’s leading logistics providers. Its strong market position
lies in the seafreight, airfreight, overland and contract logistics
businesses.
the condensed consolidated Interim Financial Statements of the
company for the three months ended march 31, 2015, comprise
the company, its subsidiaries (the Group) and its interests in
joint ventures.
the Group voluntarily presents a balance sheet as of march 31,
2014.
6.2 statement of compliance
the unaudited condensed consolidated Interim Financial
Statements have been prepared in accordance with IAS 34
Interim Financial Reporting. they do not include all of the
information required for full annual financial statements, and
should be read in conjunction with the consolidated Financial
Statements of the Group for the year ended December 31, 2014.
6.3 Basis of preparation
the condensed consolidated Interim Financial Statements are
presented in Swiss Francs (chF) million. they are prepared on a
historical cost basis except for certain financial instruments
which are stated at fair value. non-current assets and disposal
groups held for sale are stated at the lower of the carrying
amount and fair value less costs to sell.
the preparation of condensed consolidated Interim Financial
Statements in conformity with IFRS requires the management to
make judgements, estimates and assumptions that affect the
application of policies and reported amounts of assets and lia-
bilities, income and expenses. the actual result may differ from
these estimates. Judgements made by the management in
the application of IFRS that have a significant effect on the
condensed consolidated Interim Financial Statements and
estimates with a significant risk of material adjustment in the
next period were the same as those applied to the consolidated
Financial Statements for the year ended December 31, 2014.
accounting policies
the accounting policies are the same as those applied in
the consolidated Financial Statements for the year ended
December 31, 2014.
new, revised and amended standards that are effective for the
2015 reporting year are either not relevant for the Group, or
do not have a material impact on the condensed consolidated
Interim Financial Statements.
As of January 1, 2015, the Group changed its geographical
information by presenting the former regions ‘europe’ and
‘middle east, central Asia and Africa’ as one region ‘emeA’.
the previous year’s figures have been restated accordingly. For
further details to the change of geographical information refer
to note 6.8.
6.4 foreign exchange rates
the major foreign currency exchange rates applied are as
follows:
income statement and cash f low statement
(average rates for the period)
Balance sheet
(period end rates)
6.5 seasonalit y
the Group is not exposed to significant seasonal or cyclical
variations in its operations.
currency Jan. – march 2015chf
varianceper cent
Jan. – march 2014chf
euR 1.– 1.0859 –11.2 1.2232
uSD 1.– 0.9502 6.7 0.8904
GBP 1.– 1.4498 –1.8 1.4756
currency march 2015chf
varianceper cent
march 2014chf
dec. 2014chf
euR 1.– 1.0465 –14.3 1.2210 1.2028
uSD 1.– 0.9612 8.7 0.8845 0.9877
GBP 1.– 1.4301 –2.3 1.4635 1.5375
7 Condensed Consolidated Interim Financial Statements 2015 noteS
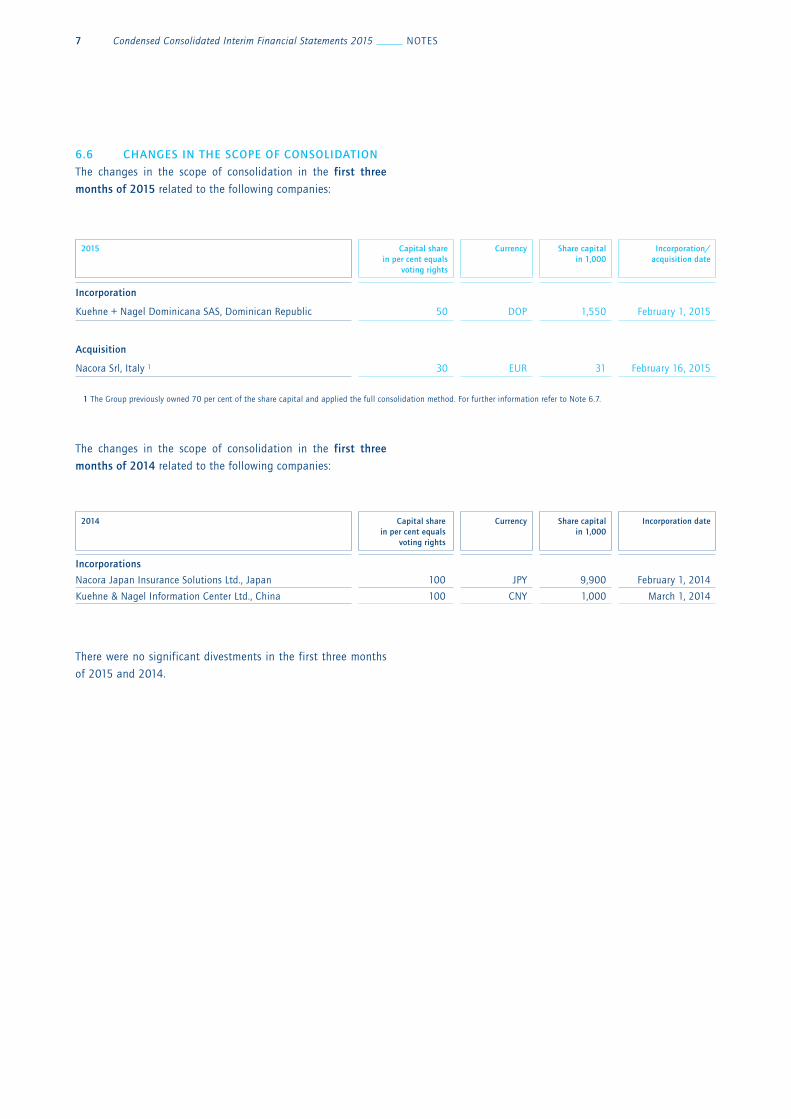
there were no significant divestments in the first three months
of 2015 and 2014.
2014 capital sharein per cent equals
voting rights
currency share capital in 1,000
incorporation date
incorporations
nacora Japan Insurance Solutions ltd., Japan 100 JPy 9,900 February 1, 2014
Kuehne & nagel Information center ltd., china 100 cny 1,000 march 1, 2014
6.6 changes in the scope of consolidation the changes in the scope of consolidation in the first three
months of 2015 related to the following companies:
the changes in the scope of consolidation in the first three
months of 2014 related to the following companies:
2015 capital sharein per cent equals
voting rights
currency share capital in 1,000
incorporation/acquisition date
incorporation
Kuehne + nagel Dominicana SAS, Dominican Republic 50 DoP 1,550 February 1, 2015
acquisition
nacora Srl, Italy 1 30 euR 31 February 16, 2015
1 the Group previously owned 70 per cent of the share capital and applied the full consolidation method. For further information refer to note 6.7.
Condensed Consolidated Interim Financial Statements 2015 noteS 8
6.7 acquisitions
2015 acquisitions
there were no acquisitions of subsidiaries in the first three
months of 2015.
effective February 16, 2015, the Group acquired the non-
controlling interest of 30 per cent of the shares of nacora Srl,
Italy, for a purchase price of chF 0.6 million, which has been
paid in cash. the Group previously owned 70 per cent of nacora
Srl, which was founded in 1998.
2014 acquisitions
there were no acquisitions of subsidiaries in the first three
months of 2014.
6.8 segment reporting
a) reportable segments
the Group provides integrated logistics solutions across
customer’s supply chains using its global logistics network.
the four reportable segments, seafreight, airfreight, overland
and contract logistics, reflect the internal management and
reporting structure to the management Board (the chief operating
decision maker, coDm) and are managed through specific
organisational structures. the coDm reviews internal management
reports on a monthly basis. each segment is a distinguishable
business unit and is engaged in providing and selling
discrete products and services.
the discrete distinction between Seafreight, Airfreight and
overland is the usage of the same transportation mode within a
reportable segment. In addition to common business processes
and management routines, a single main transportation mode is
used within a reportable segment. For the reportable segment
contract logistics the services performed are related to customer
contracts for warehouse and distribution activities, whereby
services performed are storage, handling and distribution.
Pricing between segments is determined on an arm’s length
basis. the accounting policies of the reportable segments are
the same as applied in the consolidated Financial Statements.
Information about the reportable segments is presented on the
next pages. Segment performance is based on eBIt as reviewed
by the coDm. the column “eliminations” shows the eliminations
of turnover and expenses between segments. All operating
expenses are allocated to the segments and included in the eBIt.
b) geographical information
the Group operates on a worldwide basis in several geographical
areas. until December 31, 2014, the geographical information
of the Group was divided into four regions namely europe,
Americas, Asia-Pacific and middle east, central Asia and Africa.
As of January 1, 2015, the Kuehne + nagel Group has amended
the reporting structure. the former regions europe and middle
east, central Asia and Africa are now reported as one region
emeA.
All products and services are provided in each of these three
regions emea, americas and asia-pacific. the regional revenue
is based on the geographical location of the customers invoiced,
and regional assets are based on the geographical location of
assets.
to facilitate comparability between the years, 2014 geographical
information has been restated.
c) major customers
there is no single customer who represents more than 10 per cent
of the Group’s total revenue.
9 Condensed Consolidated Interim Financial Statements 2015 noteS
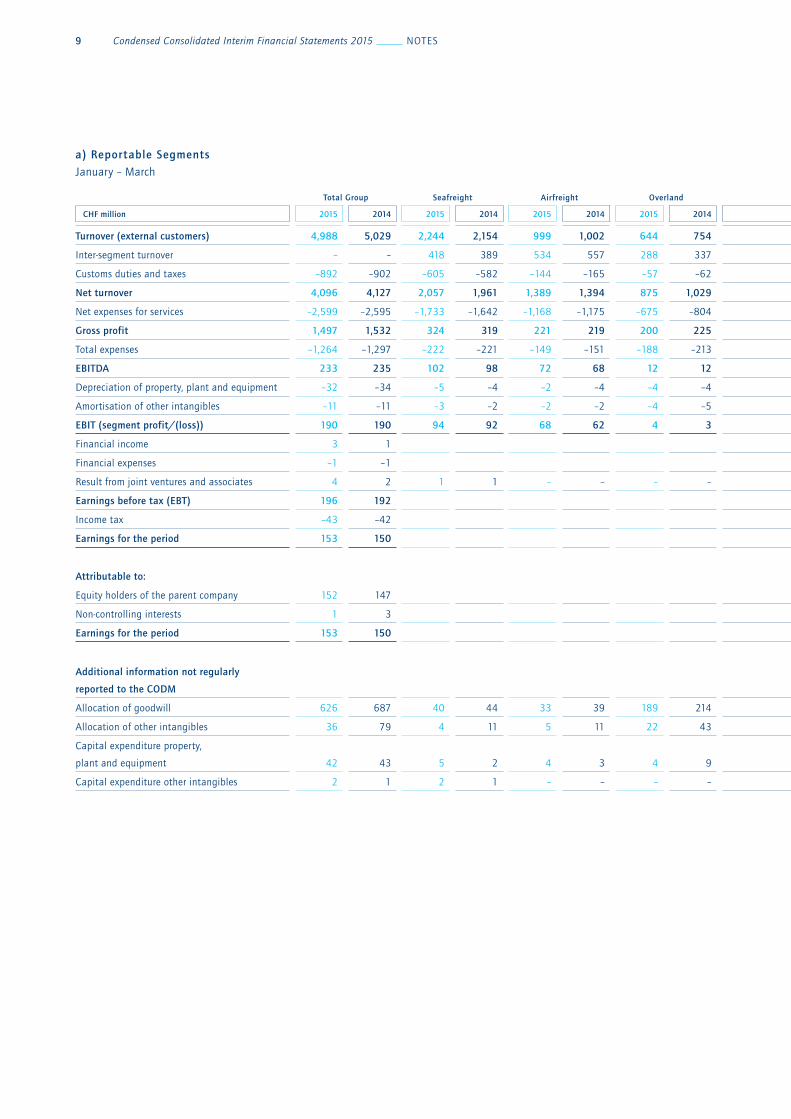
a) reportable segments
January – march
total group seafreight airfreight overland contract logistics total
reportable segments eliminations
chf million 2015 2014 2015 2014 2015 2014 2015 2014 2015 2014 2015 2014 2015 2014
turnover (external customers) 4,988 5,029 2,244 2,154 999 1,002 644 754 1,101 1,119 4,988 5,029 – –
Inter-segment turnover – – 418 389 534 557 288 337 49 55 1,289 1,338 –1,289 –1,338
customs duties and taxes –892 –902 –605 –582 –144 –165 –57 –62 –86 –93 –892 –902 – –
net turnover 4,096 4,127 2,057 1,961 1,389 1,394 875 1,029 1,064 1,081 5,385 5,465 –1,289 –1,338
net expenses for services –2,599 –2,595 –1,733 –1,642 –1,168 –1,175 –675 –804 –312 –312 –3,888 –3,933 1,289 1,338
gross profit 1,497 1,532 324 319 221 219 200 225 752 769 1,497 1,532 – –
total expenses –1,264 –1,297 –222 –221 –149 –151 –188 –213 –705 –712 –1,264 –1,297 – –
eBitda 233 235 102 98 72 68 12 12 47 57 233 235 – –
Depreciation of property, plant and equipment –32 –34 –5 –4 –2 –4 –4 –4 –21 –22 –32 –34 – –
Amortisation of other intangibles –11 –11 –3 –2 –2 –2 –4 –5 –2 –2 –11 –11 – –
eBit (segment profit/(loss)) 190 190 94 92 68 62 4 3 24 33 190 190 – –
Financial income 3 1
Financial expenses –1 –1
Result from joint ventures and associates 4 2 1 1 – – – – 3 1 4 2 – –
earnings before tax (eBt) 196 192
Income tax –43 –42
earnings for the period 153 150
attributable to:
equity holders of the parent company 152 147
non-controlling interests 1 3
earnings for the period 153 150
additional information not regularly
reported to the codm
Allocation of goodwill 626 687 40 44 33 39 189 214 364 390 626 687 – –
Allocation of other intangibles 36 79 4 11 5 11 22 43 5 14 36 79 – –
capital expenditure property,
plant and equipment 42 43 5 2 4 3 4 9 29 29 42 43 – –
capital expenditure other intangibles 2 1 2 1 – – – – – – 2 1 – –
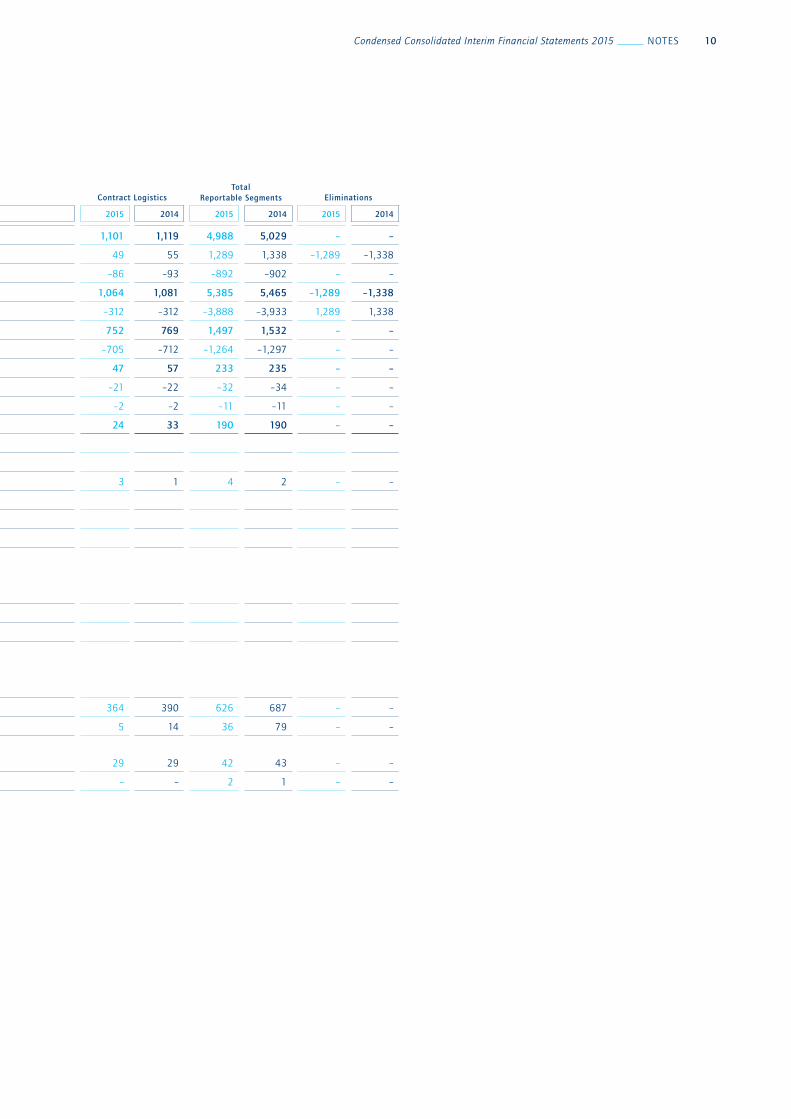
Condensed Consolidated Interim Financial Statements 2015 noteS 10
total group seafreight airfreight overland contract logistics
total reportable segments eliminations
chf million 2015 2014 2015 2014 2015 2014 2015 2014 2015 2014 2015 2014 2015 2014
turnover (external customers) 4,988 5,029 2,244 2,154 999 1,002 644 754 1,101 1,119 4,988 5,029 – –
Inter-segment turnover – – 418 389 534 557 288 337 49 55 1,289 1,338 –1,289 –1,338
customs duties and taxes –892 –902 –605 –582 –144 –165 –57 –62 –86 –93 –892 –902 – –
net turnover 4,096 4,127 2,057 1,961 1,389 1,394 875 1,029 1,064 1,081 5,385 5,465 –1,289 –1,338
net expenses for services –2,599 –2,595 –1,733 –1,642 –1,168 –1,175 –675 –804 –312 –312 –3,888 –3,933 1,289 1,338
gross profit 1,497 1,532 324 319 221 219 200 225 752 769 1,497 1,532 – –
total expenses –1,264 –1,297 –222 –221 –149 –151 –188 –213 –705 –712 –1,264 –1,297 – –
eBitda 233 235 102 98 72 68 12 12 47 57 233 235 – –
Depreciation of property, plant and equipment –32 –34 –5 –4 –2 –4 –4 –4 –21 –22 –32 –34 – –
Amortisation of other intangibles –11 –11 –3 –2 –2 –2 –4 –5 –2 –2 –11 –11 – –
eBit (segment profit/(loss)) 190 190 94 92 68 62 4 3 24 33 190 190 – –
Financial income 3 1
Financial expenses –1 –1
Result from joint ventures and associates 4 2 1 1 – – – – 3 1 4 2 – –
earnings before tax (eBt) 196 192
Income tax –43 –42
earnings for the period 153 150
attributable to:
equity holders of the parent company 152 147
non-controlling interests 1 3
earnings for the period 153 150
additional information not regularly
reported to the codm
Allocation of goodwill 626 687 40 44 33 39 189 214 364 390 626 687 – –
Allocation of other intangibles 36 79 4 11 5 11 22 43 5 14 36 79 – –
capital expenditure property,
plant and equipment 42 43 5 2 4 3 4 9 29 29 42 43 – –
capital expenditure other intangibles 2 1 2 1 – – – – – – 2 1 – –
11 Condensed Consolidated Interim Financial Statements 2015 noteS
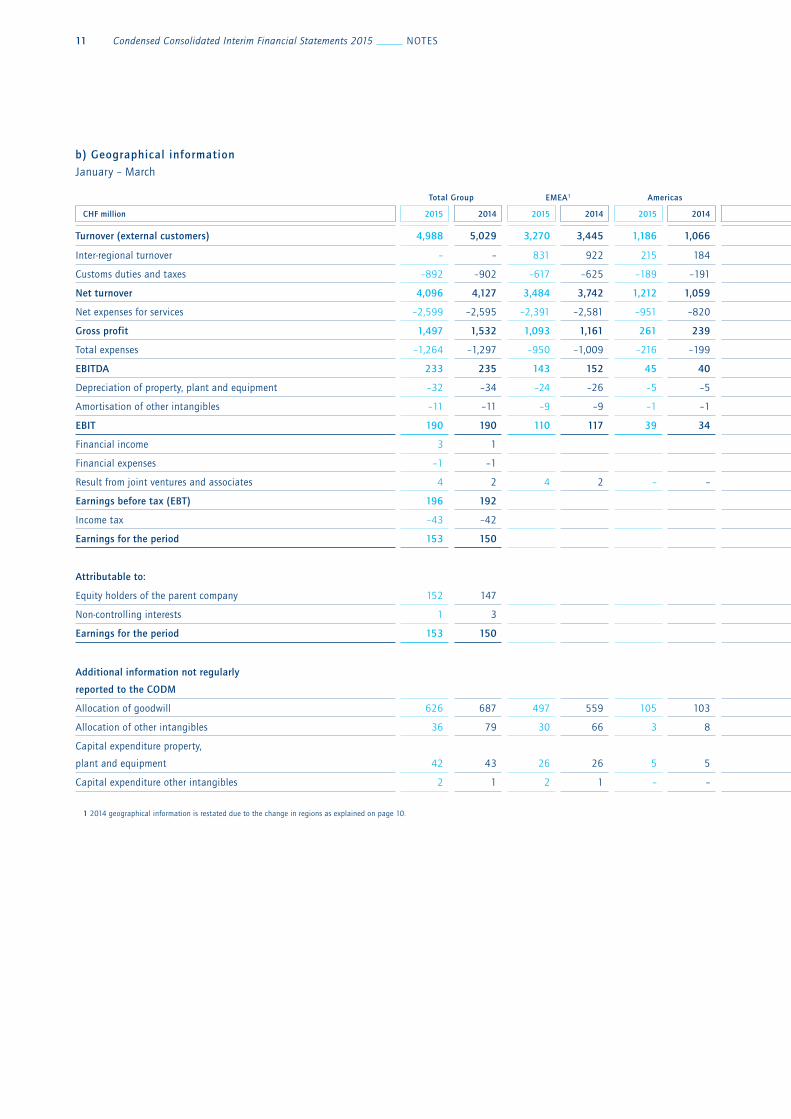
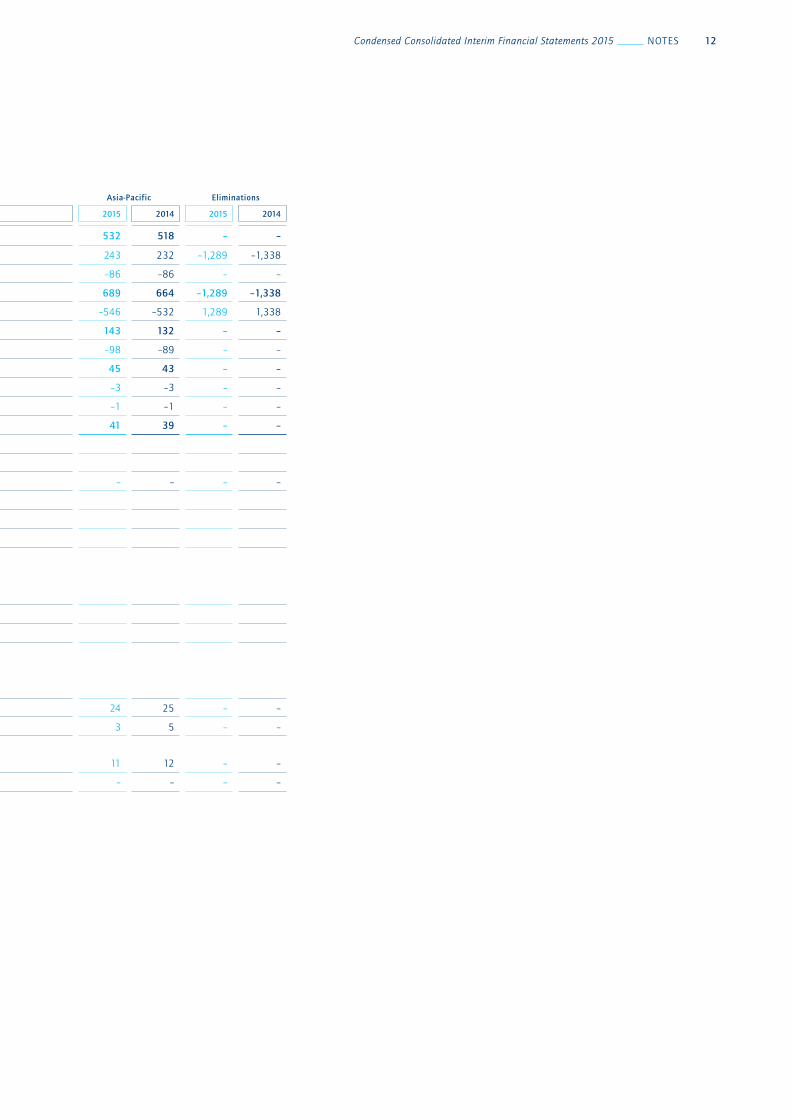
b) geographical information
January – march
total group emea1 americas asia-pacific eliminations
chf million 2015 2014 2015 2014 2015 2014 2015 2014 2015 2014
turnover (external customers) 4,988 5,029 3,270 3,445 1,186 1,066 532 518 – –
Inter-regional turnover – – 831 922 215 184 243 232 –1,289 –1,338
customs duties and taxes –892 –902 –617 –625 –189 –191 –86 –86 – –
net turnover 4,096 4,127 3,484 3,742 1,212 1,059 689 664 –1,289 –1,338
net expenses for services –2,599 –2,595 –2,391 –2,581 –951 –820 –546 –532 1,289 1,338
gross profit 1,497 1,532 1,093 1,161 261 239 143 132 – –
total expenses –1,264 –1,297 –950 –1,009 –216 –199 –98 –89 – –
eBitda 233 235 143 152 45 40 45 43 – –
Depreciation of property, plant and equipment –32 –34 –24 –26 –5 –5 –3 –3 – –
Amortisation of other intangibles –11 –11 –9 –9 –1 –1 –1 –1 – –
eBit 190 190 110 117 39 34 41 39 – –
Financial income 3 1
Financial expenses –1 –1
Result from joint ventures and associates 4 2 4 2 – – – – – –
earnings before tax (eBt) 196 192
Income tax –43 –42
earnings for the period 153 150
attributable to:
equity holders of the parent company 152 147
non-controlling interests 1 3
earnings for the period 153 150
additional information not regularly
reported to the codm
Allocation of goodwill 626 687 497 559 105 103 24 25 – –
Allocation of other intangibles 36 79 30 66 3 8 3 5 – –
capital expenditure property,
plant and equipment 42 43 26 26 5 5 11 12 – –
capital expenditure other intangibles 2 1 2 1 – – – – – –
1 2014 geographical information is restated due to the change in regions as explained on page 10.
Condensed Consolidated Interim Financial Statements 2015 noteS 12
total group emea1 americas asia-pacific eliminations
chf million 2015 2014 2015 2014 2015 2014 2015 2014 2015 2014
turnover (external customers) 4,988 5,029 3,270 3,445 1,186 1,066 532 518 – –
Inter-regional turnover – – 831 922 215 184 243 232 –1,289 –1,338
customs duties and taxes –892 –902 –617 –625 –189 –191 –86 –86 – –
net turnover 4,096 4,127 3,484 3,742 1,212 1,059 689 664 –1,289 –1,338
net expenses for services –2,599 –2,595 –2,391 –2,581 –951 –820 –546 –532 1,289 1,338
gross profit 1,497 1,532 1,093 1,161 261 239 143 132 – –
total expenses –1,264 –1,297 –950 –1,009 –216 –199 –98 –89 – –
eBitda 233 235 143 152 45 40 45 43 – –
Depreciation of property, plant and equipment –32 –34 –24 –26 –5 –5 –3 –3 – –
Amortisation of other intangibles –11 –11 –9 –9 –1 –1 –1 –1 – –
eBit 190 190 110 117 39 34 41 39 – –
Financial income 3 1
Financial expenses –1 –1
Result from joint ventures and associates 4 2 4 2 – – – – – –
earnings before tax (eBt) 196 192
Income tax –43 –42
earnings for the period 153 150
attributable to:
equity holders of the parent company 152 147
non-controlling interests 1 3
earnings for the period 153 150
additional information not regularly
reported to the codm
Allocation of goodwill 626 687 497 559 105 103 24 25 – –
Allocation of other intangibles 36 79 30 66 3 8 3 5 – –
capital expenditure property,
plant and equipment 42 43 26 26 5 5 11 12 – –
capital expenditure other intangibles 2 1 2 1 – – – – – –
1 2014 geographical information is restated due to the change in regions as explained on page 10.
13 Condensed Consolidated Interim Financial Statements 2015 noteS
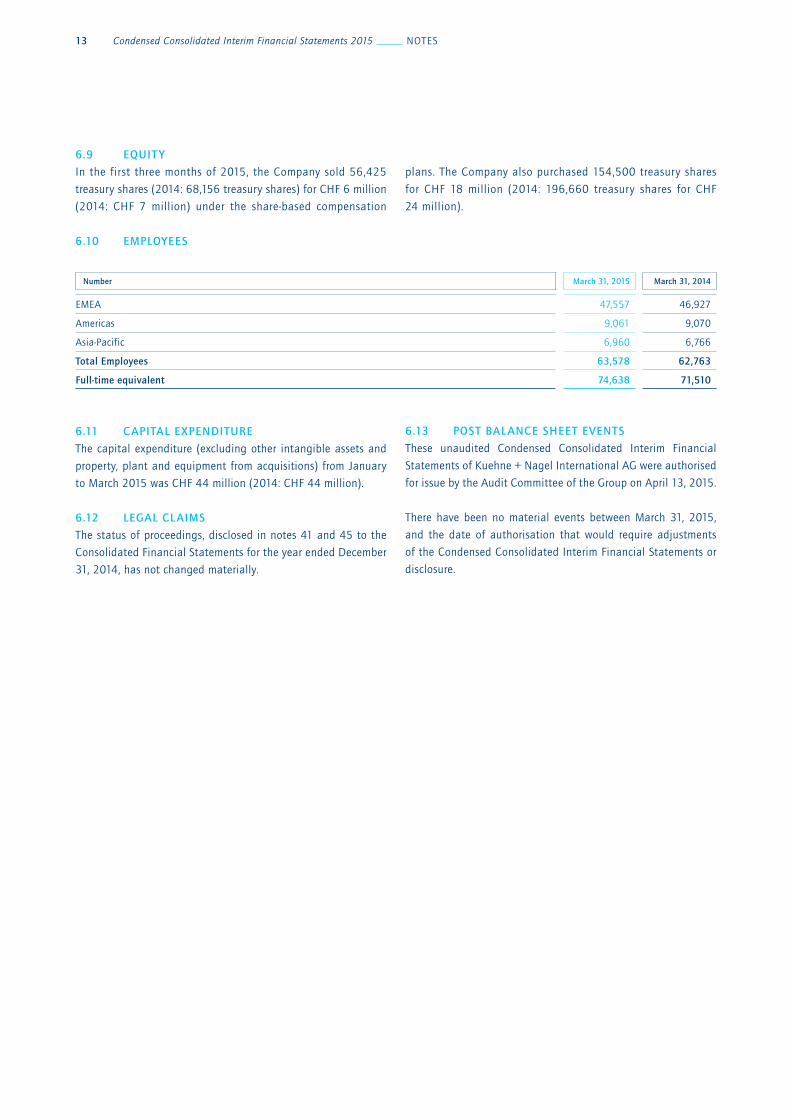
6.9 equit y
In the first three months of 2015, the company sold 56,425
treasury shares (2014: 68,156 treasury shares) for chF 6 million
(2014: chF 7 million) under the share-based compensation
6.10 employees
6.11 capital expenditure
the capital expenditure (excluding other intangible assets and
property, plant and equipment from acquisitions) from January
to march 2015 was chF 44 million (2014: chF 44 million).
6.12 legal claims
the status of proceedings, disclosed in notes 41 and 45 to the
consolidated Financial Statements for the year ended December
31, 2014, has not changed materially.
plans. the company also purchased 154,500 treasury shares
for chF 18 million (2014: 196,660 treasury shares for chF
24 million).
6.13 post Balance sheet events
these unaudited condensed consolidated Interim Financial
Statements of Kuehne + nagel International AG were authorised
for issue by the Audit committee of the Group on April 13, 2015.
there have been no material events between march 31, 2015,
and the date of authorisation that would require adjustments
of the condensed consolidated Interim Financial Statements or
disclosure.
number march 31, 2015 march 31, 2014
emeA 47,557 46,927
Americas 9,061 9,070
Asia-Pacific 6,960 6,766
total employees 63,578 62,763
full-time equivalent 74,638 71,510

Condensed Consolidated Interim Financial Statements 2015 FInAncIAl cAlenDAR 14
7. f inancial c alendar
may 5, 2015 Annual General meeting
may 12, 2015 Dividend Payment for 2014
July 14, 2015 half-year 2015 results
october 13, 2015 nine-months 2015 results

Kuehne + nagel international ag
Kuehne + nagel house
P.o. Box 67
ch-8834 Schindellegi
telephone +41 (0) 44 786 95 11
Fax +41 (0) 44 786 95 95
www.kuehne-nagel.com