Consistent Structural Integrity in Preliminary Design...
30
1 American Institute of Aeronautics and Astronautics Consistent Structural Integrity in Preliminary Design Using Experimentally Validated Analysis Craig Collier 1 and Phil Yarrington 2 [email protected] Collier Research Corp., Hampton, VA 23669 Coupling analytical methods to experimental results forms the basis of consistent structural integrity by analysis. By establishing repeatable statistical variance from building block test data for unique failure modes, it is possible to identify correlation factors (CFs) that account not only for analysis inaccuracy, but also observed scatter in test results. Industry accepted failure analysis predictions then can be used to design more robustly and to avoid unanticipated design flaws discovered in final design, or worse yet lead to part failure. The CFs can be used to adjust the individual margins-of-safety to produce more consistent structural integrity in the design and dependability in weight predictions of an aerospace vehicle. Such a capability is most useful during preliminary design where 80% of the design decisions carry forward, including the uninformed ones that bring with them undesirable difficulties of meeting weight goals, passing structural testing on the first try, and costly certification. The presented approach has been implemented in the HyperSizer® automated design tool that results in significant design cycle time reduction with the ability to analyze orders of magnitude more design configurations. Substantial risk reduction in final design is achieved from the integration and use of correlated, higher fidelity tools earlier in the design process. Presented are summary results from a recent Long Range Strike Aircraft preliminary design that compares the traditional, zero-margin for all failure modes approach, vs. the presented approach that achieves the same % reliability for all potential failure modes. Included are identified areas of the vehicle sized the traditional zero-margin method that results in an unexpected and unacceptable low reliability even though it is 9% heavier then reliability based sizing. 1 Introduction Full scale airframe testing costs and schedule delays prohibit experimental validation of all but a few potential failure modes for a limited number of load cases. For this reason industry relies more on analysis for cost effectively identifying potential failure modes for all load cases. As a result, most structural integrity supporting evidence is provided not by test data, but rather by extensive “strength calculation”, or “stress analysis,” terms that are synonymous with analytical modeling. Analytical modeling of structures means the capability to predict 1) internal load distributions 2) the resulting detail stresses and strains, and 3) failure. Qualification of structural integrity requires all three of these analytical capabilities. However, this paper maintains that current aircraft designs are suffering from inconsistent structural integrity that is prevalent throughout a project’s analysis maturity. Four primary inconsistencies © 2005 Collier Research Corporation. Published by the American Institute of Aeronautics and Astronautics, Inc., with permission. 1 Senior Research Engineer, 2 Eaton St., Suite 504, Hampton, VA 23669, AIAA Senior Member. 2 Senior Research Engineer, 2 Eaton St., Suite 504, Hampton, VA 23669, AIAA Member.
Transcript of Consistent Structural Integrity in Preliminary Design...
1 American Institute of Aeronautics and Astronautics
Consistent Structural Integrity in Preliminary Design Using Experimentally Validated Analysis
Craig Collier1and Phil Yarrington2 [email protected]
Collier Research Corp., Hampton, VA 23669
Coupling analytical methods to experimental results forms the basis of consistent structural integrity by analysis. By establishing repeatable statistical variance from building block test data for unique failure modes, it is possible to identify correlation factors (CFs) that account not only for analysis inaccuracy, but also observed scatter in test results. Industry accepted failure analysis predictions then can be used to design more robustly and to avoid unanticipated design flaws discovered in final design, or worse yet lead to part failure. The CFs can be used to adjust the individual margins-of-safety to produce more consistent structural integrity in the design and dependability in weight predictions of an aerospace vehicle. Such a capability is most useful during preliminary design where 80% of the design decisions carry forward, including the uninformed ones that bring with them undesirable difficulties of meeting weight goals, passing structural testing on the first try, and costly certification. The presented approach has been implemented in the HyperSizer® automated design tool that results in significant design cycle time reduction with the ability to analyze orders of magnitude more design configurations. Substantial risk reduction in final design is achieved from the integration and use of correlated, higher fidelity tools earlier in the design process. Presented are summary results from a recent Long Range Strike Aircraft preliminary design that compares the traditional, zero-margin for all failure modes approach, vs. the presented approach that achieves the same % reliability for all potential failure modes. Included are identified areas of the vehicle sized the traditional zero-margin method that results in an unexpected and unacceptable low reliability even though it is 9% heavier then reliability based sizing.
1 Introduction Full scale airframe testing costs and schedule delays prohibit experimental validation of all but a few potential failure modes for a limited number of load cases. For this reason industry relies more on analysis for cost effectively identifying potential failure modes for all load cases. As a result, most structural integrity supporting evidence is provided not by test data, but rather by extensive “strength calculation”, or “stress analysis,” terms that are synonymous with analytical modeling. Analytical modeling of structures means the capability to predict 1) internal load distributions 2) the resulting detail stresses and strains, and 3) failure. Qualification of structural integrity requires all three of these analytical capabilities. However, this paper maintains that current aircraft designs are suffering from inconsistent structural integrity that is prevalent throughout a project’s analysis maturity. Four primary inconsistencies
© 2005 Collier Research Corporation. Published by the American Institute of Aeronautics and Astronautics, Inc., with permission. 1 Senior Research Engineer, 2 Eaton St., Suite 504, Hampton, VA 23669, AIAA Senior Member. 2 Senior Research Engineer, 2 Eaton St., Suite 504, Hampton, VA 23669, AIAA Member.

2 American Institute of Aeronautics and Astronautics
practiced in aerospace structural analysis are identified. Presented are proposed solutions for these inconsistencies and results from software implementation and application to a real world example. In contrast to full scale production airframe testing, tests of individual airframe features are more cost effective, particularly when their costs can be shared by reuse of the resulting non-restricted data for many aircraft programs. In fact, the data found to be most useful is indeed for small structural components such as material coupons, panels, and joints that are tested individually in well controlled environments of precise loadings and boundary conditions and that are setup to investigate a particular failure response. Additionally, these types of tests can be affordably repeated to generate multiple, statistical relevant test data and produce valuable “building-block” data. By establishing repeatability from building-block test data for unique failure modes, it is possible to identify correlation factors (CFs) that account not only for analysis inaccuracy, but also observed scatter in test results. Correlating analytical methods to experimental building block test data forms the basis of consistent structural integrity by analysis. Therefore, industry accepted failure analysis methods then can be used to design more robustly and to avoid unanticipated design flaws discovered in final design, or worse yet lead to in-service part failure. The CFs can be used to adjust individual margins-of-safety to produce more consistent structural integrity in the design and dependability in analysis of an aerospace vehicle. Such a capability is most useful during preliminary design where 80% of the design decisions carry forward, including the uninformed ones that bring with them undesirable difficulties of meeting weight goals, passing structural testing on the first try, and costly certification. The presented test data CF approach has been implemented in the HyperSizer® commercial automated analysis and design tool that results in significant design cycle time reduction with the ability to analyze orders of magnitude more design configurations. Substantial risk reduction in final design is achieved from the integration and use of correlated, higher fidelity analyses earlier in the design process. Correlation factors are established based on available, non-proprietary test data, from sources such as NASA. Presented are summary results from a recent Air Force, Long Range Strike Aircraft preliminary design that compares the traditional, zero margin-of-safety for all failure modes approach, vs. the presented ‘test data driven’ approach that achieves higher reliability for all potential failure modes. Included are identified areas of the vehicle sized using the traditional zero-margin method that results in an unexpected and unacceptable low reliability, even though it is 9% heavier than the new reliability sized design. The presented ‘test data driven’ reliability approach as implemented in HyperSizer conclusively provides: 1) substantial weight savings, 2) consistent structural integrity, 3) higher reliability/safety, and 4) convincing rational to certification authorities of airframe structural airworthiness.
2 Consistent Structural Integrity
2.1 Problem: More test failures in last 25 years than in previous 50 years Fig. 1 provides a relative score of how well aerospace is doing at predicting structural integrity [1]. The blue curve represents test predictions performed with modern analytical modeling approaches such as FEA. As compared to the red line, which represents pre 1976 aircraft test failures, this implies more erroneous predictions than in the past. Added to the original plot are green and purple curves. The green vertical line at 150% represents a perceived desired result. But considering statistics, we know this is not obtainable. Therefore, if failures are not to occur before 150%, then the necessary percent failures would follow a statistical distribution similar to that represented with the purple dotted curve.

3 American Institute of Aeronautics and Astronautics
The obvious question Fig. 1 poses is why structural integrity has not improved in modern times since computing hardware and analytical modeling techniques have improved and are available and applied on a production basis. There are several plausible reasons for this increase in aircraft failure before reaching required ultimate load. The first may appear due to FEA in general in that the FEM is not more accurately capturing structural response of airframe structures. However, though improvements are necessary and will occur over time, it is held that state of the art FEA used in industry is accurately computing running “load paths” throughout the skin panels and internal substructure of airframes. The cause for less accurate pretest predictions may be attributed to three reasons. The first is improperly applied failure analysis predictions. The observed analytical modeling downfall is likely due to over reliance on FEA modeling for detail analysis where specialized analysis tools are more robustly suited for failure prediction. Specialized analysis tools perform better than detailed FEA for failure prediction because they are designed specifically to represent a given phenomena including its innate boundary conditions and also because they are correlated to extensive testing to achieve required validation. A second possible reason more test failures have occurred in the last quarter century is because the FEA computed internal loads though far more accurate, are also less conservative in their magnitudes. As a result, there is less room for error in failure predictions in a test environment where the applied load is explicitly known, and therefore the internal loads predicted are very accurately quantified without built-in conservatism. It is statistically meaningful to note that with the more accurate internal load predictionss of the last quarter century, there are 50% failures at the ultimate design load of 150% limit load, noted with the orange circle in Fig. 1. This is expected when industry designs to 150% limit load (DLL), which is analogous to a 50/50 chance of a coin flip. If our goal is to avoid test failure at 150% DLL then we must design considering a statistical distribution as indicated with the purple curve of Fig. 1. The application of validated tools by the aerospace engineering community is based on the traditional zero-margin-of-safety analysis approach, which relies on the use of an historical 1.5 ultimate load factor for necessary conservatism and confidence. In other words, airframe structure is designed to fictitious ultimate loads which are simply the actual worse case expected loads (called limit loads) increased by
Fig. 1, Red and Blue curves are percent test failures of wing, fuselage, vertical tail, horizontal tail, landing gear and unique major components before reaching required ultimate load of 1.5 Design Limit Load. The green vertical line at 150% represents a perceived desired result, but the purple curve represents the expected statistical distribution.

4 American Institute of Aeronautics and Astronautics
50%. The third and most important reason test failures occur is that one constant load factor, applied to all potential failure modes, is not possible to raise all deterministic failure analyses to the same level of safety. Though providing substantial margin for analysis error, some failures to certain load combinations are not predictable to within 50%. Meaning that 150% DLL is not sufficient for some failure modes, and too conservative for others. Described in this paper is a design sizing and analysis process, based on building-block test data that brings all applied failure mode analyses to the same reliability. Incorporating this recommended approach, as implemented in HyperSizer, will lead to more consistent structural integrity in airframes and thus contribute to more successful test programs in the future.
2.1.1 Inconsistency of deterministic failure analyses An aerospace stress analyst spends more time and effort in predicting failure and writing the margin-of-safety stress report than any other activity. This is because failure prediction is the area of most uncertainty and much effort is expended in trying to definitively quantify it. The problem is: failure cannot be deterministically predicted, because failure is not deterministic. The issue is how to handle scatter in experimental testing of observed failure while assigning a deterministic margin to it.
As an example, Fig. 2 illustrates scatter for test results from the World Wide Failure Exercises (WWFE) Case #2 [2,3]. The test is for a composite laminate material subjected to a combination of tension/compression membrane and in-plane shear loads. Only the top half of the composite material
Fig. 2, Top half of a composite material failure envelope from the World Wide Failure Exercises (WWFE) Case #2. The vertical axis of pure shear shows approximately a 90% difference in test data scatter for failure stress. Analysis inaccuracy is worst for quadratic failure theory Tsai-Wu for the ply tension quadrant, and worse for max strain, max stress, and LaRC03 for ply compression failure quadrant. All failure criteria are calibrated to the three anchor points (noted as green diamond symbol) of pure tension, shear, and compression.
Test Data Scatter
Analysis Inaccuracy
0
2000
4000
6000
8000
10000
12000
14000
16000
-200000 -150000 -100000 -50000 0 50000 100000 150000 200000 250000Sig11
Sig1
2
LaRC03Max StrainMax StressHashinTsai-HillTsai-HahnTsai-WuTest Data

5 American Institute of Aeronautics and Astronautics
failure envelope is shown, meaning tests were assumed not necessary for negative values of shear. This laminate is unidirectional exhibiting no progressive post 1st ply failure strength. The computed failure envelopes of seven composite failure theories are superimposed on the test data. All seven failure criteria are calibrated to the three anchor points of pure fiber tension, fiber compression, and ply shear. Even still, for combined bi-axial loads, large variations in predicted strengths are computed with the different theories, with none of them matching all test data. And the test data itself exhibits substantial scatter at all three anchor points, particularly for pure shear (σ12), where approximately a 90% difference is reported. The typical way to address analysis inaccuracy and test failure scatter is to define a knockdown to theoretical load. However, the knockdown is a single value that does not provide insight into each failure theories’ intrinsic level of uncertainty, as illustrated again for buckling shown next.
2.1.2 Inconsistency of the typical one knockdown approach Fig. 3 shows cylindrical panel buckling test data as points. Each test data point is normalized against its theoretical value (vertical axis). The horizontal axis represents decreasing theoretical accuracy as the radius/shell thickness (r/t) ratio increases. Fig. 3 is related to the NASA SP8007 report [4]. Note the large discrepancy between theory (red line) and test results, i.e. inaccuracy of theoretical. The design recommendation is an established knockdown defined as an equation that includes the r/t ratio. So regardless if the knockdown is expressed as a single value or as a curve fit equation, the NASA one knockdown approach defines a once-and–for-all acceptable limit of risk. Other curve fit equations, such as the blue and green curves can be defined based on a function of selected parameters. Even though the knockdown (black curve) is somewhat dynamic based on changing variables, in this case the r/t ratio, the first shortcoming with this traditional approach is that the acceptable level of risk (black curve) is “cast-in-stone” when first defined, and for the most part unchanging as more test data becomes available. In fact, the actual comparison is rarely known by the practicing engineer. A second shortcoming is the acceptable level of risk defined originally may not meet the reliability requirement of your particular design (shown as green
Fig. 3, Traditional one knockdown approach to cylindrical panel buckling, noted as a design recommendation. The black curve is the original NASA SP-8007 knockdown, the green curve, a possible more conservative knockdown, and the blue curve, the average (typical) failure. The original, one constant knockdown equation doesn’t give insight into the average test data, nor does it allow the engineer to choose his level of reliability, such as the green curve.
r/t

6 American Institute of Aeronautics and Astronautics
dashed-curve). A program manager should be able to choose required knockdown/reliability for each design project. Furthermore, insight and flexibility should be provided to bring each analysis failure mode to a consistent value. The third shortcoming, which also relates directly to the goal of efficient structural certification using analysis, is that with a single knockdown that takes the theoretical value (shown as red line) down to an allowable design-to value, does not provide nor expose any knowledge of an average or expected typical failure load, represented with a blue curve. So unlike being able to use “typical” material properties for test predictions, the user is left to perform test correlations using a “design-to” failure analysis allowable, which should for almost all cases significantly under predict, and be very conservative to test results. As a note, the NASA knockdown, black curve, is approximately a 90% reliability against failure and is combined with a 1.5 ultimate load factor to achieve considerable conservatism (safety).
2.1.3 Inconsistency of the zero margin-of-safety approach It is not possible to achieve consistent structural integrity simply by requiring all failure modes to have a positive (but close to zero) margin-of-safety as in the current industry process of design and analysis. This is because there are different levels of inaccuracy for different failure modes. Additionally, different failure modes exhibit different levels of measured scatter in test results. For example, Classical Lamination Theory (CLT) is very reliable in predicting in-plane strains, but less reliable for predicting failure for off axis laminates. Predicting the post-buckled response of a large shear web and the internal strains is a bit less accurate. If one then extracts edge forces to compute bolted joint margins then the reliability is further eroded. Finally, if one desires to predict the post-impact damage response, the confidence in the prediction is almost zero. Clearly if each of these analysis types quantify a zero margin, then there is a veritable safety inconsistency of the structural integrity. For this reason, each failure mode should be targeted to a different required margin based on its unique uncertainty. Such an approach is the first phase of implementing consistency in analysis accuracy. Industry movement in this direction, which has been slow, can be acknowledged with just a few examples. For instance, it is customary for aircraft programs to specify a required MS=.25 for joint strength analysis, especially when the joint is bonded composite [5, 6]. Fig. 4 portrays this concept graphically. If we performed many analyses with high fidelity analysis codes, we would expect some analyses to closely match test results, in terms of this analogy, the analysis predictions fall tightly within the target circle. However, even high fidelity analyses are likely to miss the target all together for some cases, and perhaps even outside the larger diameter dashed circle which represents the safety of an additional 1.5 ultimate load factor. By including probabilistic methods (PM), analysis predictions can reliably be centered together. By the use of correlation factors (CF) these predictions can then be accurately calibrated to test results. Such an approach would neither target a zero margin-of-safety nor use a 1.5 ultimate load factor.
2.1.4 Inconsistency of the 1.5 ultimate load approach to safety It is not possible to achieve consistent structural integrity simply by using a constant load amplification factor to all of the failure mode analyses. The misconception is that all failure analyses are raised to the same level of safety. Each failure mode has its own unique uncertainty, so that by designing to a 50% higher load, 1.5 Design Limit Load (1.5 DLL), many failure predictions are extremely conservative while others don’t meet the level of safety required. This line of reasoning suggests that since the design-to load is 1.5 DLL (a 1.5 ultimate load factor), test articles, statistically speaking, should rarely fail at loads close to 1.5 DLL. If they did, then contrary to expectation, it should indicate less confidence in the analysis.

7 American Institute of Aeronautics and Astronautics
Over the years industry has adopted in a limited way, the use of other load factors for particular strength checks. It has been a long standing requirement that pressure vessels be designed to a burst proof pressure test load of 2.0 times the operating in-service pressure. [5] The solution to the first four inconsistencies is addressed with a new “test data driven reliability” approach. [7,8,9] covers this subject in detail. As depicted in Fig. 4, essentially two correlation factors are defined to first bring the analysis predictions within a circle, and second to calibrate them to test values.
2.2 Specific Recommendation: Implement higher fidelity analysis tools and reliability in preliminary design
Over the years as vehicle performance expectations and mission demands increase, aircraft designs tend to be lighter and do more with less material. Additionally, due to economic drivers, the industry attempts to accomplish more analyses per engineer, perhaps causing important details to be overlooked. To better prepare for these possibilities, this recommendation is to implement the use of more accurate and comprehensive analyses during the conceptual and preliminary design (PD) phases [9]. The purpose of which is to design-in reliability and robustness, instead of trying to analyze-in margin with extremely advanced analyses after the design is set. Fig. 5 illustrates a cause and effect diagram which identifies a way this could be accomplished in three areas. These areas are described next. Reliability Determined Statistically for FEA Computed Design-To Loads. Red items in Fig. 5 address the generation of FEA computed internal loads. The issue is related to what are the “design-to” loads? The answer is to adopt a statistically based approach for determining their values from the thousands of load cases. Reliability Designed-In Using Robust Optimization. Yellow items address sizing optimization of the structure. A primary concept is to use nearly all of the available analyses during sizing optimization so
Fig. 4, High fidelity analyses provide precision, defined as an ability to hit a bull’s eye but not ensuring that all results fall within the target. Therefore, even with a 1.5 ultimate load factor, which in essence expands the circle to a dashed circle, some analyses for structure designed to a zero margin may still fall outside. Conversely, probabilistic methods reliably bring the scatter into a circle, and physical test calibration then accurately moves the circle onto the target, and a larger diameter target (1.5 load factor) is not necessary.
Accuracy
(provided bytest calibration)
Precision
(Provided by highfidelity analysis)
Reliability
(provided by probabilistic methods)

8 American Institute of Aeronautics and Astronautics
that no new failure mode surprises will occur when going to the final analysis. Another primary concept is to minimize design variable sensitivities and find commonality in optimum design variables from multiple optimized solutions. Reliability Quantified Using Probabilistic Methods. Blue items cover the final analysis and margin-of-safety reporting. A key objective is achieving a building block validation and verification (V&V) documented process for analytical modeling. Without such documentation the product customer will not have the basis available for certifying the methods used. To address human error, checks would be applied to each input value that would define an envelope of applicable lower and upper bounds for given analysis methods. Such checks would also catch and filter out inappropriate variable combinations generated by automated optimization.
Fig. 5, Cause and effect of using building-block, test data correlated analyses early in design. An important concept of this process is consistent structural integrity starts with design-by-analysis, where reliability is designed-in, and not attempted to be analyzed-in.
Certificationby Analysis
Reliability quantified usingProbabilistic Analysis Methods
Reliability designed-in usingrobust optimization
Reliabilty determined statisticallyfor FEA computed Design-to loads
Goodmodeling
techniques
Balancedload sets
Appropriate groupingof elements for eachstructural component
Uncertainty PDF foreach design variable
Input variablebound checks
High reliability withlittle weight growth
Fewer Tests
Reliability assigned to eachanalysis method
Design robustness
All analysis methodsused during the
sizing optimization
No failuremode surprises
Commonality in optimumdesign variables found from
multiple optimization solutions
Less designvariable sensitivity
FEAcomputed
internal loads
Statisticalpost process
Software certifiedby building-block
approach
Starting with robustoptimization
Consistent Structural Integrity

9 American Institute of Aeronautics and Astronautics
3 Use two correlation factors for each failure mode to analyze to the same level of reliability
Test data can be presented in the form of an histogram, Fig. 6, where the height of the vertical bars quantify the frequency of occurrence of test scatter. This histogram is normalized by the mean of the test data collection. The horizontal distance of a vertical bar from the mean is noted in terms of the statistical standard deviation, σ. Therefore, a normal distribution has the highest frequency near the mean with the left and right halves dropping off into tails forming a “bell shaped curve.” Such a curve is also known statistically as a probability density function (PDF). The equation for the graph of a normal distribution is:
πσ
σµ
2)(
)2/()( 22−−
=xexf (9.1)
where the equation is defined with two inputs, the mean (µ) and the standard deviation, (σ). This equation is used by HyperSizer to superimpose the curve on top of interactive histogram plots that follow. The benefit of representing test results as a histogram, or PDF, is that it provides a universal way to compare the relative accuracies of different failure analyses and associated test results that are graphed using various parameters.
A PDF signature derived from test data can be used for accurate prediction of mean (µ) failure load, and choosing the level of risk. This is accomplished with two factors. The first factor mentioned above, γµ
(abbreviated to µ) for analysis uncertainties is used to calibrate theoretical solutions to typical measured test values. The calibration is usually a reduction of the theoretical as indicated by the arrow moving to the left. The second factor, coefficient of experimental failure load variation, γη (abbreviated to η) for
Mean
γη µγ⋅=
⎟⎠⎞
⎜⎝⎛=
lTheoreticaPredicted
PredictedExperimentMean Avg
σ 2σ 3σ
Fig. 6, The frequency of failure from test data, illustrated as a histogram with a statistical normal distribution (dotted curve on top of vertical bars) used to quantify load carrying confidence. The solid curve represents a statistical PDF. The histogram is normalized to the mean (average test result).

10 American Institute of Aeronautics and Astronautics
specific failure mode test data scatter repeatability is a measure of the variance (statistical deviation) of the test results. The coefficient of variation, η, is defined as
µση =
which is a normalized standard deviation. As shown in Fig. 6, the theoretical value (red line) can be scaled by γµ, to establish a predicted failure load (blue dashed line), then the user selects a desired level of reliability. The “K” value, from Table 4, represents a specific reliability percentage (i.e. 99.9%) and is used to scale γη, the coefficient of experimental failure load variation to define an appropriate design-to allowable load (green line). Thus, a specific PDF signature for a given structure and loading type permits more reliable prediction of both expected failure load and allowable load.
There are many specific benefits derived from implementing two correlation factors per failure mode. • Each failure mode, after individually being correlated to test data, can now be adjusted “on-the-
fly” to provide across the board consistent reliability and safety • Predicted failure load can be distinguished from design allowable load at any given time and
made available to the engineering community at large • The PDF is a universal way to be able to represent all failure mode test correlations • Comparison to test data is widely available or known by the practicing engineer • As more data becomes available, there is a readily available means to reevaluate correlations and
to assign risk appropriately to meet missions and customers preferences
0.6 0.7 0.8 0.9 1 1.1 1.2 1.3 1.4
Failure Load
Dens
ity
Allowable
(1-Kγη)·Predicted
Predicted
γµ ·Theoretical
Theoretical
Computed
Failure Load / µ
Distinct γµ and γη
γµ for analysis uncertainties
γη for specific failure mode test data scatter
Fig. 6, Application of the probability density function (PDF) for determining desired reliability (allowable load).

11 American Institute of Aeronautics and Astronautics
4 An Example Failure Analysis represented with correlation factors
4.1 WWFE Case 1 with 19 test data A typical failure envelope for a composite material has four quadrants representing the four possibilities of compression-tension biaxial loading. As a way of introduction, however, we start with Case 1 of the WWFE that only shows two quadrants of the failure envelope - meaning no distinction between positive/negative shear. The calculated failure envelopes generated for that material system and loading is illustrated in Fig. 7, along with test data shown as blue circles. The discrepancy between the test data and the failure envelopes shows the analysis inaccuracies of many leading composite failure theories. We see that the Max Strain and Max Stress failure theories do not appear to be capturing the measured biaxial loading strength behavior. Both Tsai-Hahn and LaRC03 appear to do quite well, particularly in the first
quadrant of tension transverse stress combined with in-plane shear stress. LaRC03 failure theory seems to be tracking well an apparent linear relationship in the compressive/in-plane shear quadrant. However, by doing so, it appears to be overshooting failures that are best captured with Tsai-Hahn interaction criteria. However the one data point not being predicted by Tsai-Hahn is captured by LaRC03. While some criteria match test data better than others, all failure theories exhibit inaccuracies, as illustrated by their calculated failure envelopes. Even if there was a perfect criterion, there always exists natural scatter in observed strengths. Referring back to Figs 2 and 7, as indicated with the blue filled circles, there exists large variations in test measured strengths for pristine laminates. All of the reported test cases of WWFE and those collected by the authors show a great amount of test data scatter in
Fig. 7, HyperSizer generated failure envelopes for WWFE Case 1, biaxial σy-τxy of 0o E-glass/LY556 lamina. 19 Test data shown as filled blue circles. These plots use unidirectional strengths based on test results.
0
2000
4000
6000
8000
10000
12000
14000
16000
-25000 -20000 -15000 -10000 -5000 0 5000 10000
Sig22
Tau1
2
LaRC03Max StrainMax StressHashinTsai-HillTsai-Hahn"Tsai-Wu"Test Data
cτxy (psi)
σy (psi)

12 American Institute of Aeronautics and Astronautics
measured strengths. It is for this reason that the CF approach provides significant benefit to establishing consistent structural integrity and the means to move toward more consistent structural integrity. Test data entered, and histograms and PDFs generated Fig. 8 and Fig. 9 show histograms for the 19 test values of WWFE Case 1. Three different failure theories are included: Tsai-Hahn, LaRC03, and Max Strain since it is the most frequently used in industry. Tsai-Hahn and LaRC03 show the 19 values in one histogram, where as for Max Strain, two histograms are shown: one for the condition where strain 2 (transverse to the fiber) controls and one for the condition where max strain 12 (in-plane shear) controls. For these combinations of stresses, a matrix cracking criteria controls for LaRC03 in all 19 tests. Failure theories compared for case 1 The four histograms, displayed side-by-side, give a statistical indication of the relative accuracy of the different failure theories. In general we see that Tsai-Hahn and LaRC03 do considerably better than Max Strain. Also note that Tsai-Hahn does exceptionally well for Case 1, as it also did for the entire collection of test data. Again, its histogram illustrates the ratio of failure load to failure prediction =1.012 which is very close to 1.0 and its standard deviation is small (1.012-0.933 = 0.079) meaning the test data is relatively tight without much scatter. Each dashed vertical bar, starting from left to right represents 3σ, 2σ, and 1σ standard deviations. In contrast to the accuracy of Tsai-Hahn, Max Strain is less accurate. For instance, Max Strain 12 shows a ratio of failure load to failure prediction =1.072 which is not that bad, however more importantly, its standard deviation is quite large (1.072-0.829 = 0.243). This will cause this failure theory’s theoretical prediction to be heavily knocked down to achieve equal reliability as other failure theories. Finally, since the ratio of failure load to failure prediction, and standard deviation are slightly smaller for Tsai-Hahn, the histograms quantify what is observed in the graphical failure envelopes of Fig. 7, and that is it matches test data slightly better than LaRC03. Two step process for defining correlations factors After statistically quantifying analysis inaccuracy and scatter in measured tests, the next step is to establish proper CFs for a particular correlation category. The entire process is performed in two steps. The first step is to collect test data and make comparisons directly between theoretical and test data. In-fact, Fig. 8 and Fig. 9 are histograms of this first step. They are untouched theoretical failure predictions against experimentally measured failure loads. The second step is to define the CFs and then rerun HyperSizer (using the new reliability analysis) for all the components that comprise the 19 test data points. The CFs are established by using the inaccuracy of the theoretical and standard deviation of the test scatter. Using max strain 2 as an example, from Fig. 9 we see that T=P=0.9422. The horizontal axis (failure load/HyperSizer predicted) means that HyperSizer is theoretically over predicting failure. We need to knockdown the theoretical by 0.9422. This value is placed into the user input box for µ, Fig. 11. The CF η is entered into the user input box as well. η is calculated as:
115.09422.01
3)616.09422.0(
=⎟⎠⎞
⎜⎝⎛−
==µση
Fig. 10 and Fig. 11 are histograms made after the second step. They show us how well HyperSizer is now predicting average failure. After running HyperSizer with the CFs for the 19 tests, the histograms of Figs. 10 and 11 should show P=1.0, or very close due to round off. A P=1.0 means that we can now predict average failure load. Fig. 11 for Max Strain 2 now shows theoretical to be 1.061 higher than the calibrated predicted failure load (T=1.061=1/0.942). Since this is one material system, the material characterization and calibration of correlation factors is based on in-situ properties from the tests. One of the more important in-situ data is for the shear allowable, Fsu. These issues are covered in detail in [9, Volume III].

13 American Institute of Aeronautics and Astronautics
Fig. 8, For WWFE Case 1, biaxial σy-τxy failure envelopes of 0o E-glass/LY556 lamina. Composite Failure Theories: Tsai-Hahn on the left, LaRC03 Matrix Cracking on the right.
Fig. 9, For WWFE Case 1, biaxial σy-τxy failure envelopes. Max Strain Failure Theory: Max strain 2 direction on the left, Max strain 12 direction on the right.
Tsai-Hahn LaRC03 Matrix Cracking
Max Strain 12Max Strain 2

14 American Institute of Aeronautics and Astronautics
Fig. 10, After applying correlation factors for WWFE Case 1, biaxial σy-τxy failure envelopes of 0o E-glass/LY556 lamina. Tsai-Hahn on the left, LaRC03 Matrix Cracking on the right.
Fig. 11, After applying correlation factors for WWFE Case 1, biaxial σy-τxy failure envelopes. Max Strain Failure Theory: Max strain 2 direction on the left, Max strain 12 direction on the right.
Tsai-Hahn LaRC03 Matrix Cracking
Max Strain 2 Max Strain 12

15 American Institute of Aeronautics and Astronautics
4.2 As an example, actual Tsai-Hahn correlations to 130 tests Above we described the process for inputting test data and displaying it as a histogram. Here we continue discussion of that process by giving more detail into the source of the data and by showing the final histogram generated after running HyperSizer on all 130 applicable tests with the Tsai-Hahn specific CFs. Included in the 130 test correlations for composite laminate strength are all of the unidirectional and [±θ] failure envelope test cases (cases 1, 2, and 3) from the World Wide Failure Exercises (WWFE), two additional failure envelope unidirectional cases (cases 8 and 9) from other publications, and case 10, a ± θ layup case of AS4/3502 material reported by [10,11]. Failure of a laminate comprised of unidirectional or [±θ] layups occurs at first ply failure. Strength allowables presented here are based on damage initiation and not ultimate laminate strength which can be predicted using progressive failure techniques. The cases not included from WWFE involve progressive failure. Correlations to these progressive failure test data will come later. As a final point, the composite strengths are for pristine laminates, that is without damage. For an airframe design, damage tolerance and survivability allowables would be established and used as additional limiting strength requirements.
Shown in Fig. 12 is a histogram generated by HyperSizer that plots the statistical distribution of the 130 test failures normalized by predicted failures. The histogram is used to determine the proper correlation factors (CFs) for a given correlation category: in this case “Composite Strength, Tsai-Hahn.” The height of the vertical bars indicates frequency of occurrence and to some degree a normal distribution. More importantly, the histogram illustrates the ratio of failure load to failure prediction is very close to 1.0 for the Tsai-Hahn failure theory and the standard deviation is small meaning the data is relatively tight without much scatter.
5 Two correlation factor values established from test for each failure analysis mode The previous sections introduced concepts that form the basis of test data driven reliability. This section defines the actual PDF’s and CF’s defined from all available test data for the following general failure
Fig. 12, A HyperSizer representative histogram plot of 130 test data points, before correlation. These are untouched, theoretical comparisons to tests. Tsai-Hahn theory matches test very well.

16 American Institute of Aeronautics and Astronautics
modes: composite material strength, composite panel buckling, composite bonded linear and non-linear joint strength, and honeycomb sandwich composite facesheet wrinkling.
Fig. 14, Normalization to predicted. The PDF signatures of the five different specific failure modes. Only the relative shape (flat vs. narrow) of the PDF curve will change results when using different % reliabilities.
Probability Density Functions
0 0.2 0.4 0.6 0.8 1 1.2 1.4 1.6
Experimental / Predicted
Freq
uenc
y
Panel BucklingHoneycomb WrinklingBonded Joint: Delamination (Linear)Bonded Joint: Fracture, Fiber (Linear)Composite Strength: Tsai-HahnComposite Strength: LaRC03 Matrix CrackingComposite Strength: LaRC03 Fiber Failure
η =0.099
η =0.1107η =0.157
η =0.102η =0.136
η =0.0819η =0.1318
0 0.5 1 1.5 2Experimental / Theoretical
Freq
uenc
yPanel BucklingHoneycomb WrinklingBonded Joint: Delamination (Linear)Bonded Joint: Fracture, Fiber (Linear)Composite Strength: Tsai-HahnComposite Strength: LaRC03 Matrix CrackingComposite Strength: LaRC03 Fiber Failureη =0.1107; µ =.9388
η =0.157; µ =1.001η =0.099; µ =1.013
η =0.102; µ =0.59η =0.136; µ =0.768
η =0.0819; µ =1.32η =0.1318; µ =1.28
Fig. 13, Normalizing to theoretical. The relative inaccuracies of the theoretical analysis and their relative scatter from experimental measurements. Wrinkling has the worst inaccuracy and Tsai-Hahn the best accuracy. Tsai-Hahn and surprisingly Bonded Joint Delamination can be more confidently used due to its narrower PDF and therefore will have less knockdown for a given reliability.

17 American Institute of Aeronautics and Astronautics
Fig. 13 graphically depicts the PDF curves and their relative inaccuracies and test data scatter normalized by (experiment data/theoretical calculation) which is depicted as a dashed (experimental/theoretical) line. Analysis PDFs that fall left of the dashed line unconservatively predict failure loads higher than experiments. These methods include panel buckling (blue curve) and honeycomb wrinkling (green curve). These theoretical analysis predictions need to be knocked downed before using as design allowables. Wrinkling, shown in green has the worst inaccuracy (noted with the smallest µ value) as it is the farthest away from the vertical dashed line. Since the wrinkling PDF is left of the vertical dashed line, it over predicts strength by a ratio of 1/.59 = 1.695. Fig. 14 graphically depicts the same PDF curves but normalized this time by (experiment data/predicted) by use of the analysis inaccuracy correlation factor, µ. Once the analysis inaccuracy is accounted, then the natural scatter in failure load is quantified with the correlation factor, η. Failure modes that fall within a tighter, narrower band can be more confidently used with a smaller knockdown to obtain the same given reliability. For bonded composite joints, there are two primary strength failures: delamination and fracture. For both of these failures, two types of analyses are performed: linear and non-linear, Fig 15.
Figs 16 and 17 display all PDFs for all failure analyses that are derived from test data.
Fig. 15, Application of the (PDF) for determining desired reliability for composite bonded joints (allowable load). As expected, the theoretical predictions are more accurate when non-linear analyses are used, as indicated by the PDF’s being closer centered to the test mean.
Probability Density Functions
0 0.5 1 1.5 2Experimental / Theoretical
Freq
uenc
y
Bonded Joint: Delamination (Linear)Bonded Joint: Fracture, Fiber (Linear)Bonded Joint: Delamination (Non-Linear)Bonded Joint: Fracture, Fiber (Non-Linear)
η =0.0819; µ =1.32η =0.1318; µ =1.28
η =0.0821; µ =1.16η =0.1011; µ =1.22

18 American Institute of Aeronautics and Astronautics
Fig. 16, HyperSizer current analysis PDFs that have test data. (normalized to predicted)
0 0.2 0.4 0.6 0.8 1 1.2 1.4 1.6 1.8 2Experimental / Predicted
Freq
uenc
y
Isotropic Core WrinklingBonded Joint: Delamination (Linear)Bonded Joint: Delamination (Non-Linear)Composite Strength: Max Strain 1Composite Strength: Tsai-HahnBonded Joint: Fracture, Fiber (Non-Linear)Honeycomb WrinklingComposite Strength: Max Stress 1Composite Strength: LaRC Fiber FailureComposite Strength: HoffmanComposite Strength: Tsai-WuBonded Joint: Fracture, Fiber (Linear)Panel Buckling, CurvedComposite Strength: Max Stress 2Composite Strength: Hashin Fiber FailureComposite Strength: LaRC Matrix CrackingComposite Strength: Tsai-HillComposite Strength: Max Strain 2Composite Strength: Hashin Matrix CrackingComposite Strength: Max Strain 12Composite Strength: Max Stress 12
0 0.2 0.4 0.6 0.8 1 1.2 1.4 1.6 1.8 2
Experimental / Theoretical
Freq
uenc
y
Composite Strength: LaRC Matrix CrackingComposite Strength: HoffmanComposite Strength: Tsai-WuComposite Strength: Tsai-HahnComposite Strength: Max Strain 2Composite Strength: Hashin Matrix CrackingComposite Strength: Max Stress 12Composite Strength: Tsai-HillComposite Strength: LaRC Fiber FailureComposite Strength: Hashin Fiber FailureComposite Strength: Max Stress 2Composite Strength: Max Strain 1Composite Strength: Max Strain 12Composite Strength: Max Stress 1Isotropic Core WrinklingBonded Joint: Delamination (Non-Linear)Bonded Joint: Fracture, Fiber (Non-Linear)Panel Buckling, CurvedBonded Joint: Fracture, Fiber (Linear)Bonded Joint: Delamination (Linear)Honeycomb Wrinkling
Fig. 17, HyperSizer current analysis PDFs that have test data. (normalized to theoretical)

19 American Institute of Aeronautics and Astronautics
6 Airframe Preliminary Design Example; Air Force Long Range Strike Aircraft (LRSA)
In this example of an actual preliminary design performed in 2003, [9], the relative difference in predicted weights and controlling failure modes is quantified between two approaches: the traditional zero-margin approach, and the % reliability approach. Thus this full vehicle example is presented to bridge the traditional approach to the new. The traditional approach is based on a limit load factor of 1.0, an ultimate load factor of 1.5, and with all of the failure modes being analyzed deterministically to the same 0.0 margin-of-safety. To be considered passing, the new approach assigns, in effect, a different required margin-of-safety for each failure mode. Each failure mode’s required margin is based on achieving the same % reliability against failure. In this way, consistency is achieved in that all failure modes are targeted to the same chosen level of structural integrity. First, a study is presented that shows the weight increase as the chosen % reliability goes up from 1σ (84.1%), 2σ (97.7%), 3σ (99.9%). Second, a study is presented that identifies areas of the vehicle sized the traditional zero-margin method that results in an unexpected and unacceptable low reliability. In this study, it is also shown that the traditional zero-margin approach sizes the vehicle weight to be 11% heavier than the reliability approach using 2σ (97.7%), and 8% heavier at 99.0%.
6.1 An Automated Analysis and Sizing Tool The HyperSizer automated structural analysis and sizing optimization commercial software was used to perform the analysis and preliminary design. There are four primary steps followed in this process.
1. Couple to FEA for Internal Loads 2. Generate Well Defined Equivalent Stiffness Terms for FEM Update 3. Perform Traditional Closed Form and Modern Numerical Analyses 4. Size for Optimum Light Weight Stucture Based on Positive Margins for all Failure Modes
6.1.1 Failure Analyses Performed For this airframe example, the four failure modes are used: 1) composite stiffened and sandwich panel buckling, 2) honeycomb sandwich composite facesheet wrinkling, and 3) composite laminate strength, and 4) composite bonded joint strength. For composite strength, three failure criteria are toggled on: Tsai-Hahn, LaRC03 fiber failure, and LaRC03 matrix cracking. Two CFs per each analyses are used, Table 1.
Table 1, Correlation Factors per Analysis Failure mode η µ1 µ2 µ3 µ
Cylindrical Panel Buckling .136 .3956 -.1144 .8751 .768* Wrinkling .102 .59 1,000,000 Tsai-Hahn .099 1.013
LaRC03 Fiber Failure .1107 .9388 LaRC03 Matrix Cracking .157 1.001
Bonded Joint Delamination, Linear 0.0819 1.32 Bonded Joint Fracture, Linear 0.132 1.28
* an average value
6.2 Vehicle Description The vehicle chosen as an example application is a Mach 3.5 long range strike aircraft designed by LM Aero in Fort Worth and sponsored by Air Force Research Lab (AFRL) Air Vehicles Directorate. A subset of the FEM, defined as an assembly, consisting of external surface panels is analyzed. This assembly includes 4 groups and 84 components. For these groups, honeycomb sandwich panels and thick laminate

20 American Institute of Aeronautics and Astronautics
skins are used. The AS4/3502 graphite epoxy facesheets have 42 different layups to choose from and the Nomex honeycomb core considers 27 different thicknesses ranging from .05” to 2”. The optimization used AS4/3502 graphite epoxy (typical properties) with 29 different layups.Stiffened panels along with bonded composite joint analysis are also included.
6.2.1 Load Cases Seven different load cases are defined, as shown in Table 2. For each external load case, the airframe loads were balanced with the integrated flight pressures equal to and opposite to the resulting loads from inertial accelerations of its mass. Internal fuel pressures were applied on the relatively flat panels and their resulting secondary panel bending moments, out-of-plane shears, and deflection were computed by HyperSizer offline from FEA. These secondary panel loads are then superimposed with the global FEA computed internal running loads. Heating was mapped to the exterior skin with 1D thermal analysis performed to produce structural temperatures resulting in proper temperature dependent material properties and thermally induced stresses.
Table 2, Vehicle Load Cases Load Set Description
#1 3G Begin Cruise #2 3G Before Weapon Drop #3 3G End Cruise #4 2G Begin Cruise
#5 -1G TOGW #6 Taxi Bump #7 Vertical Tail Loads
6.2.2 FEM A coarse NASTRAN FEM was constructed with shell and beam elements: CQUAD4, CSHEAR, and CBAR. Of particular modeling significance is only one element spans the internal substructure.
Fig. 18, HyperSizer used for weight estimation, analysis and sizing trade studies of external skin panel structure and internal rib and spar substructure displayed in this transparent view of the AFRL Long Range Strike (LRS).

21 American Institute of Aeronautics and Astronautics
6.3 Comparison to 85.1%, 97.7% and 99.86% Reliability Sizing Fig. 19 illustrates an interesting result. As the reliability criteria is increased, the controlling failure modes change. Failure modes which have the highest observed scatter in test results (a higher statistical standard deviation) will control more as reliability is increased. Therefore the relative width of the PDF as shown in Fig. 14, and quantified with the CF γη (also noted simply as η), has a larger affect for higher reliabilities because of their greater uncertainty (less confidence). As shown in Table 1, wrinkling, Tsai Hahn, and LaRC03 fiber failure criteria all have η values close to 0.1. Panel buckling has a η = 0.136 and LaRC03 matrix cracking composite strength has a η = 0.157. Therefore, as depicted in Fig. 19, as the reliability increases, the controlling failure mode goes toward panel buckling (blue) and LaRC03 matrix cracking (red) which have higher η factors and away from honeycomb facesheet wrinkling (green), Tsai-Hahn interaction (yellow), and LaRC03 fiber breakage (brown) failures.
Fig. 19, Effect of varying reliability on controlling failure mode. As the specified reliability increases, the controlling failure modes change. At the lowest reliability (1σ or 85.1%), all activated failure modes are controlling some location of the vehicle, with most of the bottom surface controlled by honeycomb wrinkling. The gray areas represent structure not sized in this study such as the main landing gear doors.
Green = Honeycomb facesheet wrinkling Blue = Cylindrical panel buckling Red = LaRC03 matrix cracking Brown = LaRC03 fiber breakage Yellow = Tsai Hahn
a) 1σ (85.1%) Sizing 1σ FEA loads
b) 2σ (97.7%) Sizing 2σ FEA loads
c) 3σ (99.86%) Sizing 2σ FEA loads

22 American Institute of Aeronautics and Astronautics
The test data driven reliability is integrated into the fundamental HyperSizer strength analysis, and as such is automatically influencing the sizing optimizations. Results for several different reliability percentages show not only the weight going up, but also another interesting transition in the optimum layup design, Fig. 20. As the optimization attempts to use layups that are dominated by failure modes that exhibit more test data scatter, say for material matrix cracking strength, they will effectively be penalized more and not chosen at higher reliabilities. Therefore, for different required reliabilities the optimization finds different materials and design variables. Each unique combination of variables provides different levels of reliability. Fig. 20a shows a [60/90/-60]s is suitable for 85% reliability, but Fig 20c shows [45/-45/0/90]s is selected for 99.9% reliability.
Fig. 20, Effect of varying reliability on controlling optimum layup. As the specified reliability increases, the best suited layup varies as indicated by the change in color pattern. Certain layups for a given load of a vehicle location are more efficient and selected by HyperSizer as optimum. However some of those layups may be less confidently used because of their measured variability in strength and as a result not optimum at higher reliabilities.
a) 1σ (85.1%) Sizing 1σ FEA loads b) 2σ (97.7%) Sizing 2σ FEA loads c) 3σ (99.86%) Sizing 2σ FEA loads
[60/90/-60]s
[45/-45/0/90]s
Higher D13; D23 terms, more matrix cracking

23 American Institute of Aeronautics and Astronautics
6.4 Comparing Analysis Approaches: Traditional Zero Margin-of-Safety vs. New Test Data Driven Reliability
6.4.1 Comparison of load factors and material allowables. The traditional zero-margin sizing is based on the author’s experience of current industry practice with structural analysis margin-of-safety reporting. Essentially, the key aspects in contrast to the new reliability approach are summarized in Table 3.
Table 3, Contrasting Approaches for the LRS Airframe Analysis.
Issue Traditional Zero-Margin Analysis New Reliability Analysis
Load Factor 1.0 limit* 1.5 ultimate**
1.0 limit* only
FEA Computed Design-to
Loads
2 Sigma statistical loading method
2 Sigma statistical loading method
Material Allowable
A or B basis “Design-to” from Mil Handbook 5 or 17
“Typical test” properties (average) from Mil Handbook 5 or 17. Two Correlation Factors that dynamically change with layup optimization.
Panel Buckling
Constant knockdown of 0.85 for all panels and laminates
All panels and laminates have two Correlation Factors that dynamically change with panel spans, radius of curvature, and with thickness and layup sequence.
Sandwich Wrinkling
A required MS of 0.695 was used that is equivalent to the test average knockdown of .59 as described in section 4.
All panels and laminates have two Correlation Factors that dynamically change with core thickness and facesheet layup sequence.
* Limit loads are load values that are estimated to occur only once in five vehicle lifetimes. ** 1.5 ultimate loads are limit loads increased by 50%. They have no physical basis.
6.4.2 Panel Buckling Both sandwich panels and solid “plank” laminates are used in the airframe. The vast majority of the sized assembly is honeycomb sandwich. For the ‘stiffened’ sandwich panels, the industry practice is to use a constant knockdown factor of anywhere between 0.75 and 0.9 as is recommended in [4]. The authors experience is that a 0.85 knockdown is more frequently used during Preliminary Design. So for the traditional zero MS analysis of the sandwich panels, a constant 0.85 is used, and for the reliability analysis, the knockdown of the sandwich is a dynamic function of the panels core thickness, facesheet layups, panel span lengths, and radius of curvature.
6.4.3 Sandwich Wrinkling The traditional analysis is not based on theoretically wrinkling allowables, but instead on the same knocked-down allowable (predicted failure loads) as used in the reliability analysis. This provides a more realistic comparison. An average knockdown of 0.59 equals an equivalent required MS = 0.695. Refer to [9, Vol 2, Ch 2] that summarizes the test data collected and derivation for the relevant CFs.
24 American Institute of Aeronautics and Astronautics
6.4.4 Material Strength For the traditional analysis, Mil Handbook 17 data was used for the AS4/3502 “B” basis design-to allowables. The design-to allowables were used for the traditional zero margin analysis and the typical material properties used with the reliability analysis.
6.5 Process for calculating reliability for traditional analysis The process used to reveal the reliability of the traditional zero-margin design is: 1) Perform traditional sizing optimization, 2) send that design (optimum variables) to the reliability project, 3) perform a reliability analysis with those optimization variables frozen. This process is defined in five steps.
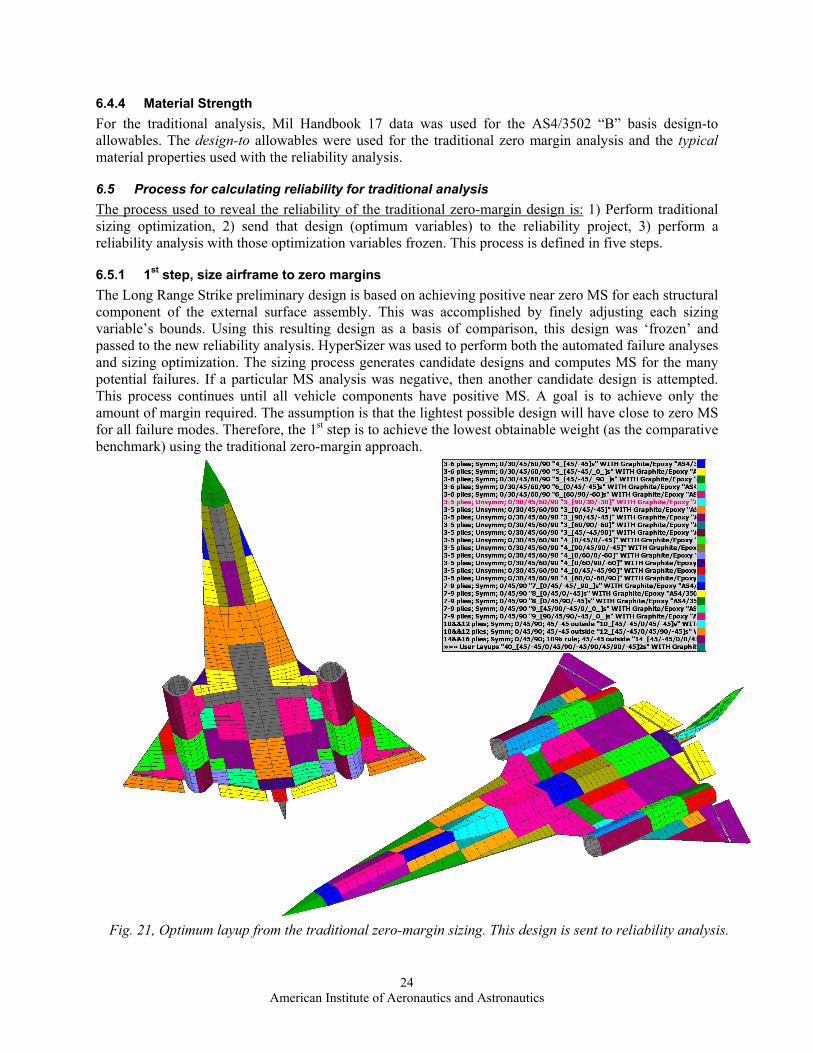
6.5.1 1st step, size airframe to zero margins The Long Range Strike preliminary design is based on achieving positive near zero MS for each structural component of the external surface assembly. This was accomplished by finely adjusting each sizing variable’s bounds. Using this resulting design as a basis of comparison, this design was ‘frozen’ and passed to the new reliability analysis. HyperSizer was used to perform both the automated failure analyses and sizing optimization. The sizing process generates candidate designs and computes MS for the many potential failures. If a particular MS analysis was negative, then another candidate design is attempted. This process continues until all vehicle components have positive MS. A goal is to achieve only the amount of margin required. The assumption is that the lightest possible design will have close to zero MS for all failure modes. Therefore, the 1st step is to achieve the lowest obtainable weight (as the comparative benchmark) using the traditional zero-margin approach.
Fig. 21, Optimum layup from the traditional zero-margin sizing. This design is sent to reliability analysis.

25 American Institute of Aeronautics and Astronautics
6.5.2 2nd step, pass the traditional optimum variables to the reliability analysis Once the optimum LRS preliminary design has been established, the next step is to pass the state of the design to the reliability analysis. In essence, the sizing variable optimum values are sent to the reliability analysis and the reliability analyses treats them as “frozen”, where no further sizing optimization is performed. Fig. 21 illustrates the optimum layups that are frozen.
6.5.3 3rd step, perform reliability analysis on the traditional design and compute true margins After the traditional design is passed into the reliability analysis, the next step is to compute true MS. In this definition, true MS are those that are based on specific test data derived CF’s. Even though the same variables from the traditional design were used in the reliability analysis, including the same FEA computed internal loads, different MS are established.
6.5.4 4th step, back out reliability for each airframe component This section presents the reliability of each structural component. Identified are areas of the vehicle sized the traditional way that result in an unexpected and unacceptable low reliability. The margins of the traditional design were consistently near the desired value of zero but were determined by the developed
Fig. 22, The traditional zero-margin sizing approach cannot produce consistent structural integrity. The major concern is the areas of the vehicle identified in orange. These two structural components have less than 99% reliability.
∞
98.48%
One failurein:
217
500
1000
2000
5000

26 American Institute of Aeronautics and Astronautics
reliability analysis to be inconsistent. Fig. 22 identifies the reliability of each structural component to the seven loadcases. The inconsistency of the traditional design is obvious. 65 out of 82 structural components have a reliability > 99.9% causing the weight of the airframe to be heavier than necessary. Using the lowest margin of any failure mode, for any component, the airframe reliability was backed out of the HyperSizer analysis to equal 98.5%. This equates to (1 / (1-.985)) = 66.6, which implies 1 in 66.6 vehicles will fail due to the design limit loading. However, DLL is statistically predicted to occur once in five (1 in 5) vehicle lifetimes. Therefore, the probability of failure for this approach is 1 in 333, (5*66.6) = 333. (See Table 4). Based on the few known actual in-service structural failures, this appears to be low. We postulate that the magnitudes of the limit loads are also likely conservative, meaning airframes likely experience limit loads less than predicted by the loads group. Therefore, in-service operation loads using the traditional zero-margin approach likely provides more than 1 in 333 lifetime airframe failures. As a summary, shown in Fig. 23 are four LRSA images where red color identifies areas of the airframe that have unacceptable safety based on two different lifetime criteria. As the criteria goes from 1 in 1000 failures to 1 in 2000 failures, as expected, more area shows up red.
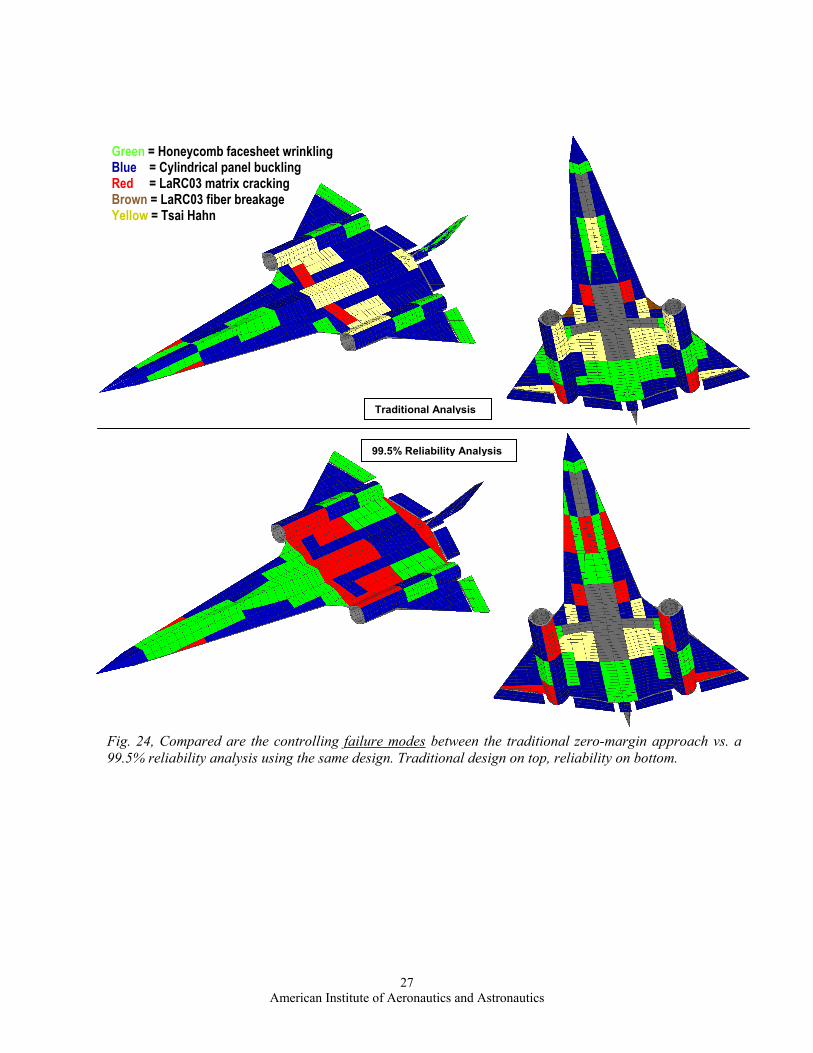
6.5.5 5th step, compare controlling failure analyses and load cases The last step is informational and useful for a more in-depth understanding. Fig. 24 shows how the controlling failure analyses differ between the traditional and reliability analyses. Even though the same variables from the traditional design were used in the reliability analysis, including the same FEA computed internal loads, a different set of controlling failure modes are identified. Note primarily how the composite strength criteria for matrix cracking (an analysis with relatively high uncertainty) controls for the reliability analysis while Tsia-Hahn and fiber breakage (analyses with relatively high confidence) controls for the traditional.
Fig. 23, The traditional zero-margin sizing approach cannot produce consistent structural integrity. The major concern is the areas of the vehicle identified in red. These are panel components that have less than 99.5% (1 in 1000) reliability top images and 99.75% (1 in 2000) reliability bottom images. The left images are the top of the LRS aircraft and the right images are the bottom. Gray color are unsized areas.
1 in 1000 reliability
1 in 2000 reliability
27 American Institute of Aeronautics and Astronautics
Fig. 24, Compared are the controlling failure modes between the traditional zero-margin approach vs. a 99.5% reliability analysis using the same design. Traditional design on top, reliability on bottom.
Green = Honeycomb facesheet wrinkling Blue = Cylindrical panel buckling Red = LaRC03 matrix cracking Brown = LaRC03 fiber breakage Yellow = Tsai Hahn
Traditional Analysis
99.5% Reliability Analysis

28 American Institute of Aeronautics and Astronautics
In this preliminary design example, it is shown that the traditional zero-margin approach sizes the vehicle weight to be about 9% heavier than the reliability approach if the lifetime airframe failures are the same. By allowing airframe weight to increase, but still be less than the traditional approach, 10 times more airframe lifetimes is achievable. This relationship is depicted in Fig. 25 where the blue diamond is the lowest weight achievable using the current aerospace industry structural analysis approach of attempting to bring all failure modes to a zero margin-of-safety and by obtaining conservatism with a uniformly applied 1.5 ultimate load factor to all potential failure modes. Table 4 lists data normalized against the traditional zero-margin result.
Table 4, The New Test Data Driven Reliability Provides Less Airframe Weight and More Structural Integrity
PDF Standard Deviation (K value)
Reliability
Lifetime Airframe Failures
Normalized Weight
Weight Savings
1 σ 85.1% 1 in 34 .773 22.7% 2 σ 97.7% 1 in 217 .887 11.3%
2.33 σ 99.0% 1 in 500 .912 8.8% 2.58 σ 99.5% 1 in 1000 .932 6.8% 2.81 σ 99.75% 1 in 2000 .947 5.3%
3 σ 99.86% 1 in 3571 .969 3.1% Traditional 98.5% 1 in 333 1 0%
3330.70
0.80
0.90
1.00
1.10
0 1000 2000 3000 4000
Airframe Lifetimes without Failure
Normalized Weight
% Reliability ApproachZero-margin Approach
Fig. 25, An example airframe structural weight vs. lifetime failures. Note that significant reliability can be achieved with moderate weight growth. Note also that the traditional zero-margin analysis (blue diamond) currently practiced in aerospace provides neither acceptable structural integrity nor minimum weight. This data is normalized to the traditional analysis.
10 times fewer failures
9% less weight

29 American Institute of Aeronautics and Astronautics
7 Conclusions The new reliability analysis approach is grounded on building block test data and will produce robust designs that are less susceptible to problems that get revealed in final design phases. The uniform reliability approach to all failure analyses was made possible by implementation in existing sizing automation software. This makes it practical to bring into PD many higher fidelity analyses that are performed for all identified external load cases and for all airframe locations (no spot checking of parts). This capability resolves the most important reason for inconsistent structural integrity which is one constant load factor, applied to all potential failure modes, is not possible to raise all deterministic failure analyses to the same level of safety. Some failures, under certain load combinations are not predictable to within 50%. Meaning that aerospace industry’s use of designing to 150% Design Limit Load, DLL, (a 1.5 load safety factor) is not sufficient for some failure modes, and far too conservative for others. With the test data driven reliability approach, all potential failure modes can be accurately assessed at the same level of confidence in a rapid manner that will not delay schedule nor require increase project funding. Achieving consistent structural integrity was demonstrated in a practical way on a complete airframe PD. The reliability of material strength (both metallic and composite damage initiation) is very high. The use of ‘A’ or ‘B’ Basis allowables from MIL HNBK 5 and 17 provide substantial conservatism, especially when combined with the 1.5 ultimate load factor. So a material strength failure is not likely to occur in-service, at least not for pristine (undamaged) material. The concern to structural integrity is achieving consistency, and contrast to material strength, other failures such as instability and honeycomb wrinkling, or more likely to occur. The same level of conservatism is not built-in to the analysis process for all failure modes. Achieving consistent structural integrity was demonstrated in a practical way on a complete airframe PD of a recent AFRL Long Range Strike aircraft. Presented are summary results that compare the traditional, zero margin-of-safety for all failure modes approach, vs. the presented approach that achieves consistent reliability for all potential failure modes. Included are identified areas of the vehicle sized using the traditional zero-margin method that results in an unexpected and unacceptable low reliability, even though it is 9% heavier than ‘test data driven’ reliability analysis and design. Alternatively, for the same weight as that provided by the traditional sizing, the vehicle can be sized to provide 10 additional lifetimes of reliability, Fig. 25. Test data driven reliability provides: 1) substantial weight savings, 2) consistent structural integrity, and 3) rationale to certification authorities of airframe structural airworthiness.
8 Acknowledgments This material is based upon work supported by the United States Air Force under Contract.
1. AFRL VA SBIR Phase I contract # F33615-01-M-3125 2. AFRL VA SBIR Phase II contract # F33615-02-C-3216 3. LM Aero LRSA Contract/PO # 7067581 4.
9 References 1. Jennewine, Tim, (Air Force ASC/ENFS, Dayton, OH) “Uninhabited Air Vehicle (UAV)
Certification,” ASIP 2002, Special Session on Certification, Savannah GA, 11 Dec 2002
2. Soden, P.D., Hinton, M.J., and Kaddour, A.S., "A Comparison of the Predictive Capabilities of Current Failure Theories for Composite Laminates," Composites Science and Technology, Vol. 58, No. 7, 1998, pp.1225-1254.

30 American Institute of Aeronautics and Astronautics
3. Hinton, M.J., Kaddour, A.S., and Soden, P.D., "A Comparison of the Predictive Capabilities of Current Failure Theories for Composite Laminates, Judged against Experimental Evidence," Composites Science and Technology, Vol. 62, No. 12-13, 2002, pp. 1725-1797.
4. NASA SP-8007, Buckling of Thin-Walled Circular Cylinders, NASA Space Vehicle Design Criteria (Structures), August 1968
5. NASA SP-8108, Advanced Composite Structures, NASA Space Vehicle Design Criteria (Structures), December 1974 (of particular interest pp 74-81))
6. Niu, M. C. Y., Airframe stress analysis and sizing, 1997, Hong Kong Conmilit Press Limited.
7. Phase I Final Report for Air Force Research Lab (AFRL) SBIR AF01-239, Certification of Aerospace Structures by Analysis, Collier Research Corporation December 2001
8. Collier, Craig, Veley, Duane, and Owens, Steve, “Virtual Testing with Validated Analysis Tools,” NATO AVT symposium in Paris, France, April 2002
9. Collier Research Corporation, SBIR Final Report: Consistent Structural Integrity and Efficient Certification with Analysis, Air Force Research Lab (AFRL) SBIR Phase II contract # F33615-02-C-3216 Volumes 1, 2, and 3, October 2004
10. Shuart, M.J., "Failure of Compression-Loaded Multidirectional Composite Laminates," AIAA
Journal, Vol.27, No. 9, 1989, pp. 1274-1279.
11. Davila, C. G. and Camanho, P. P., “Failure criteria for FRP laminates in plane stress,” NASA/TM-2003-212663.