
Consistent Scale-Up of the Freeze-Drying Process...freeze-drying of particulate material in open...
153
General rights Copyright and moral rights for the publications made accessible in the public portal are retained by the authors and/or other copyright owners and it is a condition of accessing publications that users recognise and abide by the legal requirements associated with these rights. Users may download and print one copy of any publication from the public portal for the purpose of private study or research. You may not further distribute the material or use it for any profit-making activity or commercial gain You may freely distribute the URL identifying the publication in the public portal If you believe that this document breaches copyright please contact us providing details, and we will remove access to the work immediately and investigate your claim. Downloaded from orbit.dtu.dk on: Apr 11, 2020 Consistent Scale-Up of the Freeze-Drying Process Carvalho, Teresa de Melo Publication date: 2018 Document Version Publisher's PDF, also known as Version of record Link back to DTU Orbit Citation (APA): Carvalho, T. D. M. (2018). Consistent Scale-Up of the Freeze-Drying Process. Kgs. Lyngby: Tecnical University of Denmark.
Transcript of Consistent Scale-Up of the Freeze-Drying Process...freeze-drying of particulate material in open...

General rights Copyright and moral rights for the publications made accessible in the public portal are retained by the authors and/or other copyright owners and it is a condition of accessing publications that users recognise and abide by the legal requirements associated with these rights.
Users may download and print one copy of any publication from the public portal for the purpose of private study or research.
You may not further distribute the material or use it for any profit-making activity or commercial gain
You may freely distribute the URL identifying the publication in the public portal If you believe that this document breaches copyright please contact us providing details, and we will remove access to the work immediately and investigate your claim.
Downloaded from orbit.dtu.dk on: Apr 11, 2020
Consistent Scale-Up of the Freeze-Drying Process
Carvalho, Teresa de Melo
Publication date:2018
Document VersionPublisher's PDF, also known as Version of record
Link back to DTU Orbit
Citation (APA):Carvalho, T. D. M. (2018). Consistent Scale-Up of the Freeze-Drying Process. Kgs. Lyngby: Tecnical Universityof Denmark.

CONSISTENT SCALE-UP OF THE
FREEZE-DRYING PROCESS
PhD Thesis
Teresa Melo de Carvalho
Department of Chemical and Biochemical Engineering
Technical University of Denmark
October 2018
Supervisors
Krist V. Gernaey
Ulrich Krühne
Michelle Madsen
Anders Clausen


Preface
This thesis describes the work carried out at the Process and Systems Engineering Center (PROSYS),
Department of Chemical and Biochemical Engineering, Technical University of Denmark. The thesis was
written in partial fulfilment of the requirements for a Ph.D. degree in Engineering. The work conducted
and presented in this thesis was performed in the period between August 2015 and October 2018, under
the supervision of Professor Krist Gernaey and Associate Professor Ulrich Krühne from the Technical
University of Denmark and by Department Manager Anders Clausen and Senior Principal Scientist
Michelle Madsen from Chr.Hansen. This project is part of the BioRapid project which has received
funding from the People Programme 8Marie Curie Actions, Multi-ITN) of the European Union’s Seventh
Framework Programme and Horizon 2020 fro research, tehcnologicla development and demonstration
under grand agreements number 643056.
I would like to thank my supervisors Kris Gernaey, Ulrich Krühne, Anders Clausen and Michelle Madsen
for the constant support and feedback. It has been a true pleasure working with them. A special thank
goes to Christian Fridberg for the guidance and constructive discussions throughout the project. I would
also like to thank Tina Iversen and Esben Ulrich Vulff for all the support performing experiments at
laboratory/pilot scale. Additionally, I would like to thank Per Poulsen for his insight on industrial scale and
invaluable process knowledge. And, I would like to thank Petra Foerst for the academic discussions and
the opportunity of collaborating with the Technical University of Munich.
Thank you to all my colleagues at Chr.Hansen. It has been a great pleasure to work at Process during the
past three years. Special thanks to Catarina, Christophe, Karen, Neda, Karen, Kim, Jimi, Hans and
Susanne for all the support during the last three years.
I would also like to thank my friends and colleagues at PROSYS (Mafalda, Ricardo, Tannaz, Christian,
Frederico, Robert, Leander, Mark) for all the collaborations and fun.
A special thank you goes for all the 14 ESRs involved in the BioRapid project (Ana, Andre, Angel,
Emmanuel, Klaus, Viktor, Arathi, Patricia; Judite, Johannes, Tannaz, Robert, Micael and Lorenz). Thank
you for all the collaborations and dinners during the last three years. Thank you also to all the SICs for the
nice discussions throughout the project.
Finally, I would like to thank my family and Morten for all the support and encouragement.
Kgs.Lyngby, October 10th, 2018
Teresa Melo de Carvalho


Abstract
Lactic acid bacteria, are one of the most common examples of starter cultures due to their broad
application for the production of fermented food products. After the fermentation and the concentration
steps, starter cultures can be supplied in the frozen or in the dried state. Nowadays, dried products are
preferred since they allow easier handling, transport, storage and application.
Freeze-drying or lyophilization is a drying process in which water is removed through a sublimation and a
desorption step. It results in products with increased shelf stability, without losing its structural and shape
characteristics. However, it is an expensive and time-consuming process frequently not operated in a
robust and efficient way. Overly conservative freeze-drying cycles and scale-up based on empirical
knowledge result in drawbacks not just from an economic standpoint but also from a product point of
view. Thus, process development in this area has been focused on minimizing drying times while
maintaining product quality.
This process is both dependent on the physical form of the material being dried and on the physical
parameters and characteristics of the freeze-drying apparatus. The majority of the studies found in the
scientific literature are applied to the pharmaceutical industry, therefore the available information for the
freeze-drying of particulate material in open trays, mainly used in the food industry, is limited.
Freeze-drying of frozen particulate matter is characterized by a bimodal pore size distribution based on
the intra-particle and inter-particle void space. Pore size distribution of the particle bed is determined by
the particle size and how the particles are packed, while pore size distribution inside particles is
dependent on the initial solid concentration and on the freezing rate. The ratio between the two pore size
distributions plays has an important role for the dynamics of the freeze-drying process.
Local temperature and moisture content in the product are essential for the design of efficient freeze-
drying cycles. Consequently, a fundamental understanding of water vapor flows during drying in a freeze-
dryer is essential for the construction of an accurate model. In this thesis, the primary drying step during
freeze-drying of Streptococcus thermophilus was investigated based on Computational Fluid Dynamics
(CFD) techniques. A scale-up approach, going from the small scale of a single particle where only
product characteristics are addressed, to the laboratory/pilot scale where both product and equipment
characteristics are taken into account, was implemented.
The established model represents a good strategy to determine the effect of different operating conditions
during the freeze-drying of pellets in open trays. Additionally, it opens the possibility to better understand
scale-up issues and to develop robust freeze-drying cycles that facilitate the transfer between apparatus.


Resumé
Mælkesyrebakterier er én af de mest benyttede starterkulturer grundet det store applikationsområde.
Produktion af disse starterkulturer involverer gæring, opkoncentrering og nedfrysning. Efter nedfrysning
kan produktet sælges. Alternativt kan produktet gennemgå en tørringsproces og derefter salg. Disse
produkter er at foretrække, da håndtering, transport, opbevaring og anvendelse er nemmere. Forskellige
tørreprocesser kan benyttes afhængig af applikationsområde. Generelt anses frysetørring for at være en
mere skånsom tørreproces med højere produktkvalitet.
Frysetørring, eller lyofilisering, er en tørreproces hvorved vand fjernes fra et produkt gennem et
sublimerings- og desorptionstrin. Sammenlignet med andre tørreprocesser er denne mere skånsom.
Stabiliteten af produktet forøges uden ændring af strukturelkarakteristika og form. Processen er dog dyr
og tidskrævende, og bliver jævnligt drevet på en ikke robust og effektiv måde. Meget konservative
frysetørrecykler og opskalering på baggrund af empirisk data kan have store negative konsekvenser.
Disse er ikke bare økonomiske, men også produktkvaliteten kan påvirkes negativt. Derfor har
procesoptimering og udvikling hovedsageligt været fokuseret på minimering af tørretid uden at gå på
kompromis med produktkvalitet.
Frysetørreprocessen er både afhængig af den fysiske form på materialet som tørres, men også afhængig
af fysiske parametre og karakteristika på frysetørreudstyret. Da størstedelen af studier indenfor dette
område beskæftiger sig med frysetørring i den farmaceutiske industri, er data indenfor frysetørring af
partikelformet materiale i åbne bakker til fødevareindustrien begrænset.
Frysetørring af frosset partikelformet materiale er karakteriseret ved en bimodal porestørrelsesfordeling,
afhængig af det intrapartikulære- og interpartikulærefrirum. Porestørrelsesfordelingen i partikelbedden
bestemt på baggrund af partikelstørrelse og hvordan disse partikler pakker sig i bedden, mens
porestørrelsesfordelingen i partiklerne er afhængig af tørstofindholdet og hastigheden hvorved partiklerne
nedfryses.
Lokale temperaturer og vandindhold i produktet er essentielle i forbindelse med design af effektive
frysetørrecykler. Fundamental forståelse af flow af vanddamp under frysetørreprocessen er essentielt for
udviklingen af en nøjagtig model. I denne afhandling er det primære trin under frysetørring af
Streptococcus thermophilus undersøgt ved brug af Computational Fluid Dynamics (CFD). En ”Scale-up”-
tilgang er benyttet, hvor produktkarakteristika blev undersøgt gennem forsøg med enkelte partikler,
efterfulgt af laboratorie-/pilotskala undersøgelser, hvor der både blev taget hensyn til udstyrskarakteristika
og produktkarakteristika.

Den udviklede model repræsenterer en god strategi til bestemmelse af virkningen af forskellige
driftsbetingelser under frysetørring af partikler i åbne bakker. Derudover åbner den mulighed for bedre og
mere effektiv forståelse af opskalingsproblemer, samt udvikling af mere robuste frysetørringscykler, der
letter overførslen mellem udstyr.

Nomenclature
Roman Letters
A Area [m2]
aw Water Activity [-]
CFD Computational Fluid Dynamics [-]
CIP Cleaning-in_Place [-]
Dbulk,eff,bed Effective Bulk Diffusion in the Bed [m2/s]
Deff,bed Effective Diffusion in the Bed [m2/s]
Deff,chamber Effective Diffusion in the Chamber [m2/s]
Deff,particle Effective Diffusion in the Particle [m2/s]
Deff,porous Effective Diffusion in the Porous Material [m2/s]
Dice Diffusion of the Ice [m2/s]
Dkn,eff,bed Effective Knudsen Diffusion in the Bed [m2/s]
dbed,pore Pore Diameter of the Bed of Particles [mm]
dparticle Diameter of the Particle [mm]
dpore Diameter of the Pore [µm]
dsph Diameter of the Sphere [mm]
Effbed Bed Effectivity [%]
Effparticle Particle Effectivity [%]
F2-1 View Factor between Two Bodies [-]
FD Freeze-Drying [-]
FDM Freeze-drying microscope [-]
HTC Heat Transfer Coefficient [W m-2 K-1]
L Thickness / Characteristic Length Scale [m]
LAB Lactic Acid Bacteria [-]
∆Hsubl Enthalpy [J mol-1]
K Heat Conductivity of the Gas [W m-1 K-1]
kd Desorption Rate Constant of Bound Water [s-1]
Kn Knudsen Number [-]
Knbed Knudsen Number in the Bed of Particles [m2/s]
ks Solid Film Mass Transfer Coefficient [s-1]
m Mass [kg]
MW Molecular Weight [kg mol-1]

Packbed Packing Factor of the Bed of Particles [-]
PCA Principal Component Analysis [-]
pc Vapour Pressure Chamber [Pa]
pice Vapour Pressure Ice [Pa]
psubl Vapour Pressure Sublimation [Pa]
ptr Triple Point Vapor Pressure [Pa]
pw Vapour Pressure Water [Pa]
qrad Heat Flux Transferred through Radiation [W m-2]
Qproduct Energy Transferred to the Product [J]
qFourier Heat Flux Transferred through Conduction [W m-2]
Rgas Gas Constant [J mol-1 K-1]
Rp Product Resistance [m s]
SEM Scanning Electron Microscopy [-]
SIP Sterilization-in-Place [-]
ST Streptococcus thermophilus [-]
T Temperature [-]
Ta Acidification Time [h]
Tg Glass Temperature [K]
Tg’ Glass Temperature for Maximally Freeze-
Concentrated Solution
[K]
Tm Melting Temperature [K]
Tm’ Melting Temperature for Maximally Freeze-
Concentrated Solution
[K]
Tsubl Temperature Sublimation [K]
Ttr Triple Point Temperature [K]
t Time [s]
ucreep Thermal Creep Velocity [m s-1]
Vpellets Volume of Pellets [m3]
Vtray Volume of Tray [m3]
X Mass Fraction of Absorbed Water in Solid [-]
yW Gas fraction [-]

Greek Letters
α Accommodation Coefficient [-]
ε Emissivity of the Surface [-]
𝜃𝑏𝑒𝑑 Porosity of the Bed of Particles [-]
𝜃𝑝𝑎𝑟𝑡𝑖𝑐𝑙𝑒 Porosity of the Particle [-]
λ Molecular Mean Free Path [m]
µ Viscosity of the Gas [Pa s]
ρ Density [kg m-3]
σ Stefan-Boltzmann Constant [W m-2 K-4]
σT Thermal Slip Coefficient [-]
𝜏𝑝𝑎𝑟𝑡𝑖𝑐𝑙𝑒 Tortuosity of the Particle [-]


Contents
Preface ----------------------------------------------------------------------------------------------------------------------------- IV
Abstract ---------------------------------------------------------------------------------------------------------------------------- VI
Resumé --------------------------------------------------------------------------------------------------------------------------- VIII
Nomenclature ---------------------------------------------------------------------------------------------------------------------- X
Roman Letters ------------------------------------------------------------------------------------------------------------------ X
Greek Letters ----------------------------------------------------------------------------------------------------------------- XII
Contents -------------------------------------------------------------------------------------------------------------------------- XV
--------------------------------------------------------------------------------------------------------------------------- 1
Introduction ------------------------------------------------------------------------------------------------------------------------- 1
1.1 Background ---------------------------------------------------------------------------------------------------------------- 1
1.2 Scope ------------------------------------------------------------------------------------------------------------------------ 3
1.3 Thesis Structure ---------------------------------------------------------------------------------------------------------- 3
--------------------------------------------------------------------------------------------------------------------------- 5
Freeze-Drying of Lactic Acid Bacteria as Starter Cultures ------------------------------------------------------------- 5
2.1 Fundamentals of Freeze-Drying -------------------------------------------------------------------------------------- 6
2.2 Equipment Design ------------------------------------------------------------------------------------------------------- 11
2.3 Protection Strategies---------------------------------------------------------------------------------------------------- 11
2.4 Modelling of the freeze-drying process ----------------------------------------------------------------------------- 13
2.5 Conclusions --------------------------------------------------------------------------------------------------------------- 32
-------------------------------------------------------------------------------------------------------------------------- 33
Scale-up Investigation – Streptococcus thermophilus at Chr. Hansen --------------------------------------------- 33
3.1 Principal Component Analysis (PCA) ------------------------------------------------------------------------------- 33
3.2 Product Characterization ---------------------------------------------------------------------------------------------- 38
3.3 Equipment Characterization ------------------------------------------------------------------------------------------ 46
3.4 Conclusions --------------------------------------------------------------------------------------------------------------- 48

-------------------------------------------------------------------------------------------------------------------------- 51
Drying of a Single Particle ----------------------------------------------------------------------------------------------------- 51
4.1 Mechanisms of Mass Transport in Porous Material ------------------------------------------------------------- 52
4.2 Experimental Work ------------------------------------------------------------------------------------------------------ 55
4.3 Model ----------------------------------------------------------------------------------------------------------------------- 66
4.4 Conclusions --------------------------------------------------------------------------------------------------------------- 73
-------------------------------------------------------------------------------------------------------------------------- 75
The effect of product morphology, particle size and particle distribution on the drying process ------------- 75
5.1 Single particle ------------------------------------------------------------------------------------------------------------ 76
5.2 Multiple Particles --------------------------------------------------------------------------------------------------------- 79
5.3 Strategies for identifying the effect of particle size and packing on the drying process ---------------- 86
5.4 Conclusions --------------------------------------------------------------------------------------------------------------- 87
-------------------------------------------------------------------------------------------------------------------------- 89
CFD Model for a Laboratory/Pilot Scale Freeze-Dryer ----------------------------------------------------------------- 89
6.1 Mechanisms of Heat Transport in Porous Material -------------------------------------------------------------- 90
6.2 Materials and Methods ------------------------------------------------------------------------------------------------- 92
6.3 Results --------------------------------------------------------------------------------------------------------------------- 97
6.4 Conclusions ------------------------------------------------------------------------------------------------------------- 103
------------------------------------------------------------------------------------------------------------------------ 105
Conclusions and Future Perspectives ------------------------------------------------------------------------------------ 105
7.1 Investigation of the Drying Behaviour of Starter Cultures ---------------------------------------------------- 105
7.2 Model Development and Implementation ------------------------------------------------------------------------ 106
------------------------------------------------------------------------------------------------------------------------ 109
References ---------------------------------------------------------------------------------------------------------------------- 109
Appendix A ---------------------------------------------------------------------------------------------------------------------- 133
Appendix B ---------------------------------------------------------------------------------------------------------------------- 135

Introduction
1.1 Background
Starter cultures are nowadays used for the production of fermented foods, since they allow standardized
industrial processes and therefore improved products [1]. The production of starter cultures allows the
reproduction of a selected strain or mixed population of microbes to a density that is likely to survive and
be metabolically active in the process.
At the end of the production, starter cultures are often dried since it increases their viability and long-term
preservation. Additionally, dried products allow easy and inexpensive handling, transport, storage and
application. Different drying techniques are employed regarding their suitability, e.g. freeze-drying,
vacuum drying, spray drying, drum drying, fluidized bed and air drying [2]–[4]. Compared with other
conventional drying techniques, freeze-drying is generally considered to produce the dried products with
the highest quality. Since the process operates at low temperature, thermal damage of the products is
minimized, and the structural and shape characteristics are preserved.
Freeze-drying or lyophilization was for the first time described in 1906 by Bordas and d’Arsonval in an
article for the Académie des Sciences in Paris [5]. However, it was not until during the Second World War
that it started to be used at industrial scale for human plasma production [6]. Today the use of this
technology has expanded for several different applications: high value foods, pharmaceuticals and
sensitive biological material.
Freeze-drying consists in the removal of water from a frozen product through sublimation and desorption
at high vacuum conditions. The target of the process is to get the desired value of residual moisture in the
final product. Large amounts of energy are required during the process which makes it an expensive
process when compared with other drying technologies [7]. Furthermore, the long production times also
contribute to the increase of production costs. Therefore, process development in this area has been
focused on minimizing drying times while maintaining product quality [8], [9].
The successful design of a freeze-drying cycle – identification of the optimal values of shelf temperature,
chamber pressure and process duration – requires true understanding of the interrelation between
product composition, process parameters and equipment capabilities. In order to maximize plant
productivity and reduce the cost of the products, the rate of solvent removal should be maximized [10].
The problem arises when the increased sublimation rate causes damages in the product or increase of
the pressure in the drying chamber due to lack of condenser capacity or choked flow on the duct. This

2 | Chapter 1
means that the successful design of a freeze-drying cycle starts with the characterization of both the
product (identify the limit temperature and product morphology) and the apparatus (evaluate the duct and
condenser capacity), followed by the monitoring of the residual amount of ice in the product, its
temperature, and the sublimation flow rate.
The identification of the optimal values for the design of freeze-drying cycles is frequently obtained
through an extensive amount of experimental work. This is an expensive and time consuming approach
which does not guarantee the achievement of an optimal solution. Furthermore, the in-line measuring
technologies for the important parameters involved in the optimization and control of freeze-drying cycles,
present several challenges and inaccuracies [10].
Alternatively, model-based systems give tools for process design and optimization and have been
increasingly developed in the last years. A particularly relevant application of mathematical modelling is
the scale-up of the process. After the optimization of the process in laboratory scale, this needs to be
transferred to production scale. Although, in freeze-drying the scale-up of a process is relatively simple
since the product characteristics do not change drastically between scales (especially when the freezing
step is performed outside of the freeze-dryer), there are still several challenges. Figure 1.1 summarizes
the main challenges when scaling up a freeze-drying process of starter cultures.
Figure 1.1 – Causes for scale-up issues of the freeze-drying process of starter cultures.
One of the biggest challenges when scaling-up a freeze-drying process is the variation in the apparatus
characteristics. Therefore, understanding how the sublimation rate and the vapor flow are affected by the
equipment design is essential in order to avoid problems during scale-up. A mathematical model coupling
the product characteristics and the freeze-dryer design can be a useful tool in order to increase process
knowledge by comparing a hypothesis with experimental findings. In this thesis, a mathematical model
will be developed using Computational Fluid Dynamics (CFD) as a tool to reach a more fundamental
understanding of the drying process during freeze-drying.

Introduction | 3
1.2 Scope
The overall focus of this project has been to address the main challenges of modelling the drying
behaviour during freeze-drying of particulate material using computational fluid dynamics. The main focus
has been on the development of modelling strategies based on scale-up approaches – going from the
small scale of a single particle where only product characteristics are addressed, to the laboratory/pilot
scale where both product and equipment characteristics are taken into account. The learnings at each
step of the model development were considered in the subsequent steps increasing the complexity of the
model. Furthermore, this project focused on the freeze-drying of lactic acid bacteria as a case study and
aimed to predict its drying behaviour at a laboratory/pilot scale. A comprehensive investigation of product
morphological characteristics and drying behaviour at different scales was performed at the start of the
project.
1.3 Thesis Structure
The general outline of the thesis is presented in Figure 1.2and below as a brief overview:
Chapter 1 introduces freeze-drying and the challenges related to process transfer and scale-up.
Furthermore, it introduces the scope and outline of the thesis.
Chapter 2 covers the theory associated with the freeze-drying process and its application to starter
cultures. Furthermore, the chapter presents an extensive review of the mathematical models present in
the scientific literature that describe the drying process during freeze-drying.
Chapter 3 investigates the freeze-drying process at Chr. Hansen. Four different production strains were
investigated in detail in relation to their drying performance and morphological characteristics.
Chapter 4 illustrates the importance of the freezing step, product concentration and annealing on the
drying behavior and on the final product morphology through experiments on a freeze-drying microscope
(FDM). A mathematical model is developed using computational fluid dynamics techniques in order to
simulate the drying process on the FDM.
Chapter 5 presents a theoretical study on the influence of the packing factor on the drying of particulate
material. The study is made through numerical simulations.
Chapter 6 implements the developed CFD model for the prediction of the drying behavior during freeze-
drying at laboratory/pilot scale. The simulations are compared with the measured values from the
laboratory/pilot scale.
Chapter 7 provides the major conclusions and perspectives for future work.

4 | Chapter 1
Figure 1.2 – General outline of the thesis.
Freeze-Drying of Lactic Acid Bacteria as Starter Cultures
The production of fermented foods is nowadays based on the use of starter cultures which contribute to
product characteristics, sensorial and safety attributes. The great advantage of starter cultures is that they
can provide controllable and predictable fermentations, leading to improved products and standardized
industrial processes [1].
Lactic acid bacteria (LAB) are the main microorganisms responsible for fermentation of fermented food
products, and therefore also one of the most common starter cultures used in the production of fermented
food products, e.g. dairy, meat, vegetables, wine, sourdough and fish [4], [11]. Lactococcus,
Leuconostoc, Lactobacillus, Streptococcus and Pediococcus are members of the LAB [12]. LAB starter
cultures are primarily used because of their ability to produce lactic acid from lactose and consequent pH
reduction, leading to important effects like inhibition of growth of undesirable organisms (due to low pH),
improvement of sensorial and textural properties, as well as contribution to health benefits [1].
The production of starter cultures allows the reproduction of a selected strain or mixed population of
microbes to a density that is likely to survive and be metabolically active in the process. The main phases
of industrial starter culture production are: (1) fermentation, (2) centrifugation, (3) addition of cryo- and
lyo- additives, (4) freezing, (5) freeze-drying and (6) packing. Nowadays concentrated starter cultures are
supplied in frozen (skipping step 5) and dried forms for direct incorporation into a food formulation. Frozen
starter cultures must be transported and stored at very low temperatures, and therefore drying is
nowadays the dominant preservation technique. Different drying techniques are employed in food
production, e.g. freeze-drying, vacuum drying, spray drying, drum drying, fluidized bed and air drying [2]–
[4]. Each of these drying techniques can be useful for a range of applications. This thesis will focus on
freeze-drying since this is the conventional and preferred method used for drying starter cultures and the
method used at Chr. Hansen.

6 | Chapter 2
2.1 Fundamentals of Freeze-Drying
Freeze-drying or lyophilization is a drying process in which water is removed at low pressures providing a
product with increased shelf stability and that it is quickly and completely rehydrated upon addition of a
solvent. The process requires three different steps: freezing, primary drying (sublimation step) and
secondary drying (desorption step).
Freeze-drying of starter cultures allows their easy and inexpensive handling, storage and application,
coupled with long-term preservation. However, different factors can influence the viability of lyophilized
starter cultures during production and storage: the composition of the growth medium during
fermentation, freezing rate, drying temperature and pressure, presence of lyo- and cryo-additives, water
activity, oxygen content, pH, storage temperature, headspace composition above the product, light
exposure, relative humidity and packaging material [13]. Therefore it is important from a technological and
economical point of view to increase the survival to a level that is as high as possible during freezing,
drying and storage steps [14].
The next sections describe the three different freeze-drying steps and their role in the production of viable
and stable final products.
2.1.1 Freezing
Freezing is the phenomenon in which the water present in the concentrated cell suspension is frozen
under atmospheric pressure. This step will determine the porosity, specific surface area and dissolution
behaviour of the final product formed during the removal of ice crystals [15]. Thus, the freezing process
plays a significant role on the later drying behaviour of the sample.
The freezing process starts above the freezing line by cooling a liquid sample from room temperature to
below its freezing temperature (Figure 2.1). Usually, ice formation starts several degrees below the
freezing line due to nucleation. The temperature interval between the freezing line and the moment ice
starts forming is called the degree of supercooling and depends on several factors like cooling velocity,
sample formulation, sample purity, sample size and the type of freezing container [15], [16].
Depending on the final temperature and cooling velocity required, freezing can be performed inside or
outside the freeze-drying equipment. Fast freezing rates, meaning a high-degree of supercooling, lead to
small ice crystals and can induce lethal ice formation inside the cells [17], [18]. On the other hand, slow
freezing rates, meaning a low-degree of supercooling, lead to large ice crystals which are preferable to
ensure rapid drying and facilitate the movement of the vapour during drying. However, large crystals can
induce cell damage due to mechanical stress, eutectic crystallization of buffer salt components and
osmotic stress by solute concentration [19].
Freeze-Drying of Lactic Acid Bacteria as Starter Cultures | 7
The response to different cooling regimes depends on the cell type, where small cells such as bacteria
are more resistant to freezing than larger yeast and mammalian cells [20], [21]. Therefore, optimum
freezing rates are strain dependent and result from the strain’s ability to release water, which is
dependent on the presence/absence of a cell wall, cell size and shape, and the permeability to water of
the cell membrane [20]–[23]. Optimum freezing conditions involve a compromise between the
requirements of the bacteria and the drying performance.
The maximum amount of water that can be frozen is usually 70% to 90% of the amount present in
solution [24], [25]. The remaining water is called unfreezable water. Between the melting transition
temperature (Tm) and the glass transition temperature (Tg), the freeze-concentrated solution is in a
rubbery state, characterized as being highly viscous, visco-elastic and unstable. Further decrease in
temperature will lead to a transition from the rubbery state to a glassy state. This phenomenon happens
at the glass transition temperature (Tg or Tg’ for a maximally freeze-concentrated solution) [26], [27]. The
glassy state is an amorphous metastable state that resembles a solid but without a long-range lattice
order [17]. An amorphous glass has extremely high viscosity (typically ≥ 1012 Pa.s) which can inhibit
diffusion and slow down deterioration reactions because water is immobilized and unavailable. Therefore,
it is common practice to freeze at temperatures below Tg’ since the frozen solution will be characterized
for long-term stability in the frozen state, with maximum ice formation and structure stability during
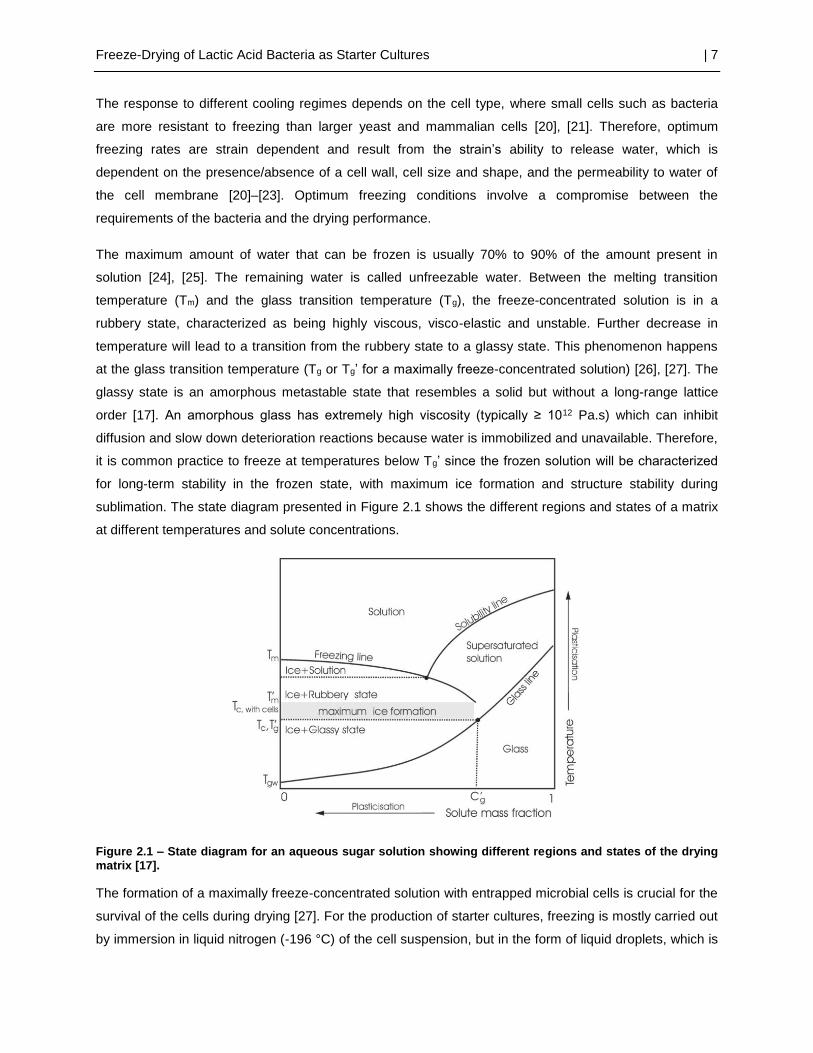
sublimation. The state diagram presented in Figure 2.1 shows the different regions and states of a matrix
at different temperatures and solute concentrations.
Figure 2.1 – State diagram for an aqueous sugar solution showing different regions and states of the drying
matrix [17].
The formation of a maximally freeze-concentrated solution with entrapped microbial cells is crucial for the
survival of the cells during drying [27]. For the production of starter cultures, freezing is mostly carried out
by immersion in liquid nitrogen (-196 °C) of the cell suspension, but in the form of liquid droplets, which is

8 | Chapter 2
a process characterized by high cooling rates (300°C/min) [28]. Given the Tg’ of the most common
components of the medium in the production of starter cultures - skim milk (-50 °C), sucrose (-46 °C),
trehalose (-40 °C) – and of pure water (-135 °C), the formation of a maximally freeze-concentrated matrix
should be achieved by this freezing method [27].
2.1.2 Primary Drying
During primary drying the frozen water, which constitutes 70 to 95 % of the sample, is removed through
sublimation [29]. By decreasing the partial pressure below the triple point (Tr), water can directly change
from solid to gas state, which avoids undesired melting, foaming or softening of the product (Figure 2.2).
This step requires very low pressures; therefore, it is always performed inside a drying chamber. The heat
source, condenser and vacuum pump will assure the correct pressure and temperature that allow the
chamber to be below the triple point (Section 2.2 will focus more on equipment design).
Figure 2.2 – Water state diagram showing the different aggregate states dependent on temperature and
pressure. The arrow represents a typical freeze-drying process [30].
The difference in water vapour pressure between the sublimation front and the chamber is the driving
force for the sublimation process (Equation (2.1)) [31]. The condenser plays an essential role during the
drying process since it continuously removes the water vapour from the drying chamber, thereby
increasing the partial pressure difference between the sublimation front and the drying chamber. Low
condenser temperatures result in water condensation and immediate freezing at the condenser surface.
Therefore, a low condenser temperature and a large surface area result in a more efficient process.
𝑑𝑚
𝑑𝑡=
𝑝𝑖𝑐𝑒 − 𝑝𝑐
𝑅𝑝
(2.1)

Freeze-Drying of Lactic Acid Bacteria as Starter Cultures | 9
The vapour pressure at the sublimation front is dependent on the product temperature (Equation (2.2)).
Low product temperatures during primary drying result in low partial pressures at the ice front. Thus,
higher product temperatures guarantee a higher sublimation rate since the vapour pressure difference is
higher between the sublimation front and the chamber. However, the target product temperature during
freeze-drying cannot be established by only considering process efficiency but should also consider the
desired product characteristics. In order not to suffer structural changes due to a drop in viscosity, the
product temperature should not exceed the collapse temperature (Tc) which is located between Tg’ and
Tm’, usually just some degrees above Tg’. The effect of collapse in terms of product quality is not
consistent. It has been reported that the loss of product structure may have beneficial as well as
detrimental effects [31]–[34].
𝑙𝑛𝑝𝑠𝑢𝑏𝑙
𝑝𝑡𝑟
= −∆𝐻𝑠𝑢𝑏
𝑅[
1
𝑇𝑠𝑢𝑏𝑙
−1
𝑇𝑡𝑟
] (2.2)
The rate of sublimation is not only influenced by the vapour pressure difference but also by the cake
thickness, total solid content, ice crystal distribution and surface area [35]. During drying, the sublimation
front will move inwards the product leaving a porous matrix, which is dependent on the solid
concentration, the solids composition and on the cooling rate. The formation of a dry porous matrix will
increase the resistance to vapour movement over time.
Coupled to mass transfer, there are also heat transfer phenomena to be considered. An additional heat
source is essential since the product temperature decreases with the start of sublimation. The amount of
heat transferred to the product comes from different sources: radiation, conduction (solid/solid interfaces)
and convection (solid/gas, liquid/gas, liquid/liquid) [26], [28], [35]. During drying the heat is mostly
transferred through radiation from heated surfaces and conduction from heated plates/trays. Due to the
coupled heat and mass transport, the product temperature (Tp) changes throughout the entire sublimation
process. The heat transfer mechanisms are strongly dependent on the chosen drying profile (temperature
and pressure), the loading of the dryer and the design of the dryer equipment.
2.1.3 Secondary Drying
As mentioned in Section 2.1.1, not all the water shifts to the solid state during the freezing step. Between
5 to 30% of non-freezable water is still present at the end of primary drying [36]. To achieve high storage
stability the water activity of the sample has to be further reduced. A moisture content of 2-5% is
considered optimal for storage stability [37], [38]. However, it is still debatable which is the optimal water
content, yet there is a general agreement that it is dependent on the substance being freeze-dried and on
the storage conditions [37], [39]. Over-drying might be harmful to bacterial survival or activity due to
removal of free and unfreezable/structural water from the cellular components [15].

10 | Chapter 2
Water activity is defined as the vapour pressure of the substance (p) divided by the vapour pressure of
water (pw) at the same temperature [40].
𝑎𝑤 =𝑝
𝑝𝑤
(2.3)
Residual water can be bound as hydrate water in crystalline form, adsorbed on surfaces, or bound in the
amorphous matrix. Water removal during the secondary drying step involves diffusion of the water in the
amorphous glass, evaporation of the water at the solid/vapour boundary, and water vapour flow through
the pore structure of the dry product [15].
Contrary to the sublimation step which is highly dependent on the chamber pressure, the main influencing
parameter for the desorption process is the temperature of the product [41]. Once again not only the
product temperature will influence the rate of secondary drying but also the product structure. Indeed, the
higher the specific surface area of the sample, the shorter is the secondary step [32], [35]. Tg’ stays
constant during primary drying, yet during secondary drying it continuously increases due to desorption
(Figure 2.3). The shelf temperature can be adapted throughout secondary drying since the stability of the
amorphous sugar matrix increases with time [30].
Figure 2.3 – State diagram representing the glass transition curve dependent on solid concentration and temperature. The dashed lines show three different stepwise drying profiles [30].

Freeze-Drying of Lactic Acid Bacteria as Starter Cultures | 11
2.2 Equipment Design
Typical freeze-drying equipment consists of three main components: a freeze-drying chamber, a
condenser and a vacuum pump [26], [42]. Depending on the size and on the application, freeze-dryers
have different designs. The main differences are the location of the condenser, the design of product
containers and the heat source.
The freeze-drying chamber provides the necessary temperature and pressure to conduct freezing
(optional), primary and secondary drying. The product is loaded in this section either in vials, trays,
syringes or in other types of containers [43], [44]. The product can be loaded directly on top of the heating
shelf (contact freeze-dryer) or suspended between drying shelves (radiation drying).
The vacuum pump evacuates the chamber in the beginning of the process and eliminates air that may
leak into the dryer during operation. However vacuum pumps are not able to continuously remove water
vapour from the chamber, so there is the need of a condenser.
The main function of the condenser is to remove the water vapour from the drying chamber, thereby
assuring a vapour pressure difference between the sublimation front and the chamber. It can be placed in
the drying chamber (internal condenser) or located in a separate chamber between the chamber and
pump (external condenser). In the case of external condensers there will also be a duct that will connect
the chamber and the condenser, allowing the transport of the water vapour between the two sections.
The temperature of the condenser and its surface area can greatly influence its efficiency.
2.3 Protection Strategies
During freeze-drying cells are exposed to various stresses, especially dehydration, compromising the cell
survival. The formation of ice crystals during freezing and the removal of water during drying is
detrimental since water plays an important role in cell integrity and stability. When water crystallizes, the
solutes in the remaining unfrozen fraction concentrate, which can lead to chemical and osmotic damage.
Furthermore, the removal of water from the cells can cause damages to surface proteins, cell wall and
cell membrane, decreasing the cell viability after drying.
Many protection strategies have been developed to enhance the bacterial viability during freeze-drying:
addition of excipients to the drying medium, control of process parameters, pre-stressing prior to freeze-
drying and change of fermentation conditions [45]. This section focuses on the addition of protective
agents. The efficiency of these strategies is strain dependent, since the tolerance to freezing and drying
processes depend also on the studied strain.

12 | Chapter 2
2.3.1 Protective agents
The addition of suitable protective agents during growth, or prior to freezing, is necessary to successfully
preserve cells from freeze-drying [46], [47]. The choice of suitable protective agents is organism
dependent but there are some which seem to work with many species: mono- and disaccharides
(trehalose, sucrose, glucose, lactose), sugar alcohols (glycerol, sorbitol), skim milk, peptones, polymers
(polyethylene glycol, polyvinylpyrrolidone, dextrane), and different amino acids and derivatives [14], [48],
[49]. Cryoprotectants are used for stabilization during freezing and lyoprotectants for stabilization during
drying. The molecular protection mechanisms differ depending on the nature of the solute and the
available amount of water. A specific solute might be able to act as cryoprotectant and lyoprotectant
dependent on the mode of action.
Cryoprotectants are water soluble substances that lower the melting point of water and increase the
unfrozen part of the sample. Consequently, the cell will be less damaged due to mechanical or osmotic
stress when a cryoprotectant is added before freezing. All non-toxic, low-molecular weight solutes can be
used as protection for cells by minimising, via colligative effects, the percentage of water converted into
extracellular ice and the extent of cell volume reduction. Furthermore, some viscous cryoprotectants
(glycerol, sugars and polymers) increase the viscosity of the freeze-concentrated solutions or cytoplasm,
and consequently the glassy state can be reached at lower cooling rates and higher freezing
temperatures [17], [50].
Oxidation of membrane lipids, changes in cell wall and, DNA and protein damage are some of the factors
reported to be the cause of cell death during drying and storage [51]. Therefore, it is crucial to maintain
the fluidity and structure of the cell membrane. Lyoprotectants (especially disaccharides) are added to
form an amorphous sugar matrix around the individual bacterial cells. The excellent performance of
sugars in lyoprotection has been proposed to be a combination of two mechanisms: 1) the ability to form
a glassy structure where biomolecules are embedded; and, 2) the ability to form hydrogen bonds between
sugars and biomolecules to replace water bonds (water replacement hypothesis) [17], [52]–[54]. Both the
intracellular and extracellular concentrations of lyoprotective agents are important for achieving optimal
desiccation tolerance [55], [56]. It has been shown that complex mixtures of lyoprotective agents can
stabilise better than one agent alone [39].
Freeze-Drying of Lactic Acid Bacteria as Starter Cultures | 13
2.4 Modelling of the freeze-drying process
In the last years, an increase in the development of mathematical models describing the freezing and the
drying steps during freeze-drying has been observed in order to support the development of optimal
freeze-drying cycles that produce quality products in a robust process. Suitable mathematical models for
the design and scale-up of freeze-drying cycles should reliably describe the dynamics of the process,
have short calculation times, have few model parameters and be easy to validate with experimental data
[57].
A mathematical model is an abstract and simplified representation of reality that summarizes available
process knowledge and attempts to increase the fundamental scientific understanding of a process; it is
therefore suited to explore available knowledge in order to improve or design a process [58]. There are
two main categories of mathematical models: white-box and black-box models. A white-box model, also
called “mechanistic” or “deterministic” model, is derived from first principles, like mass balances, energy
balances, etc. Black-box models offer an empirical representation of the system’s behaviour, since
measurement data of system inputs and outputs is used to build a process model. However, in most
cases, some a priori knowledge is incorporated into the black-box model (for example a mass balance) or
some black-box elements are incorporated in the white-box model, resulting in semi-mechanistic models
or grey-box models [58], [59]. Nowadays, the term ‘hybrid model’ is also frequently used to indicate this
type of models [60].
2.4.1 Physics-Based Models
Most attention in the literature is devoted to optimization of primary drying [43], [61]–[67], though
secondary drying also occupies a significant fraction of the process time [39], [61], [68]–[70]. Modelling at
the scale of the product being freeze-dried can be the starting point for a detailed model that can predict
the freeze-drying sublimation rate and the product temperature profile. In the development of first
principles models for the drying process during freeze-drying it is essential to understand the mass and
heat transfer associated with the mechanisms of sublimation and desorption during primary and
secondary drying, respectively.
During drying the thickness of the frozen product (Lprod) is reduced while the depth of the dried layer
increases. Throughout primary drying the crystallized water is removed by sublimation. The sublimation
rate is mainly dependent on the chamber pressure, shelf temperature, product thickness, product
container surface available for heat transfer and product area and temperature [71]. Fundamental mass
and energy conservation equations, Equation (2.4) and (2.5) respectively, describe the sublimation
phenomena at the sublimation front.

14 | Chapter 2
𝑑𝑚
𝑑𝑡= 𝐴 ∙ √
𝑀𝑤
2𝜋 ∙ 𝑅 ∙ 𝑇𝑠𝑢𝑏
∙ [𝑝𝑡𝑟 − 𝑝] (2.4)
𝑑𝑄𝑠𝑢𝑏
𝑑𝑡=
∆𝐻𝑠𝑢𝑏
𝑀𝑤
∙𝑑𝑚
𝑑𝑡 (2.5)
During secondary drying residual water molecules tightly bound to the solid matrix through hydrogen
bonds (forming a monolayer) and loosely bound water (forming a multilayer) are eliminated. The energy
balance during desorption is described by Equation (2.6).
𝑑𝑄𝑠𝑢𝑏
𝑑𝑡= 𝑚 ∙
∆𝐻𝑑𝑒𝑠
𝑀𝑤
∙𝑑𝑋
𝑑𝑡 (2.6)
Here X is the mass fraction of absorbed water in the solid and can be described through two different rate
mechanisms described by Equation (2.7) and (2.8), respectively.
𝑑𝑋
𝑑𝑡= 𝑘𝑠 ∙ (𝑋𝑒𝑞𝑢 − 𝑋) (2.7)
𝑑𝑋
𝑑𝑡= −𝑘𝑑 ∙ 𝑋 (2.8)
In Equation (2.7) the variable Xequ represents the weight fraction of absorbed water in the solid which is in
local equilibrium with the partial pressure of water vapor. A large number of physical models are proposed
in the literature to describe moisture sorption isotherms [72]. The most frequently used ones are the
Brunauer-Emmett-Teller (BET) model and the Guggenheim-Anderson-Boer (GAB) model, given,
respectively, by Equation (2.9) and (2.10). In most cases, the BET equation is appropriate for lower
ranges of water activity (0.10< aw< 0.40) and the GAB equation is applicable for a wider range of water
activity values (0.10 < aw < 0.90).
𝑋𝑒𝑞𝑢 =𝑋𝑀𝐶𝑎𝑤
(1 − 𝑎𝑤)(1 + 𝑎𝑤(𝐶 − 1)) (2.9)
𝑋𝑒𝑞𝑢 =𝑋𝑀𝐺𝐾𝐺𝐶𝐺𝑎𝑤
(1 − 𝐾𝐺𝑎𝑤)(1 + 𝐾𝐺𝑎𝑤(𝐶𝐺 − 1)) (2.10)
Here Xequ is the moisture content adsorbed per dry weight, aw is water activity, XM is a constant
representing the amount of water needed to surround the material surface with just one layer of water
molecules, and C is a constant related to the heat liberated in the monolayer sorption process.
Furthermore, in Equation (2.10), XMG is a constant representing the monolayer moisture content, and CG
and KG relate to the interaction between the first layer and further layers of water molecules at the
sorption sites [73].
Freeze-Drying of Lactic Acid Bacteria as Starter Cultures | 15
2.4.1.1 Steady State Approach
Primary Drying
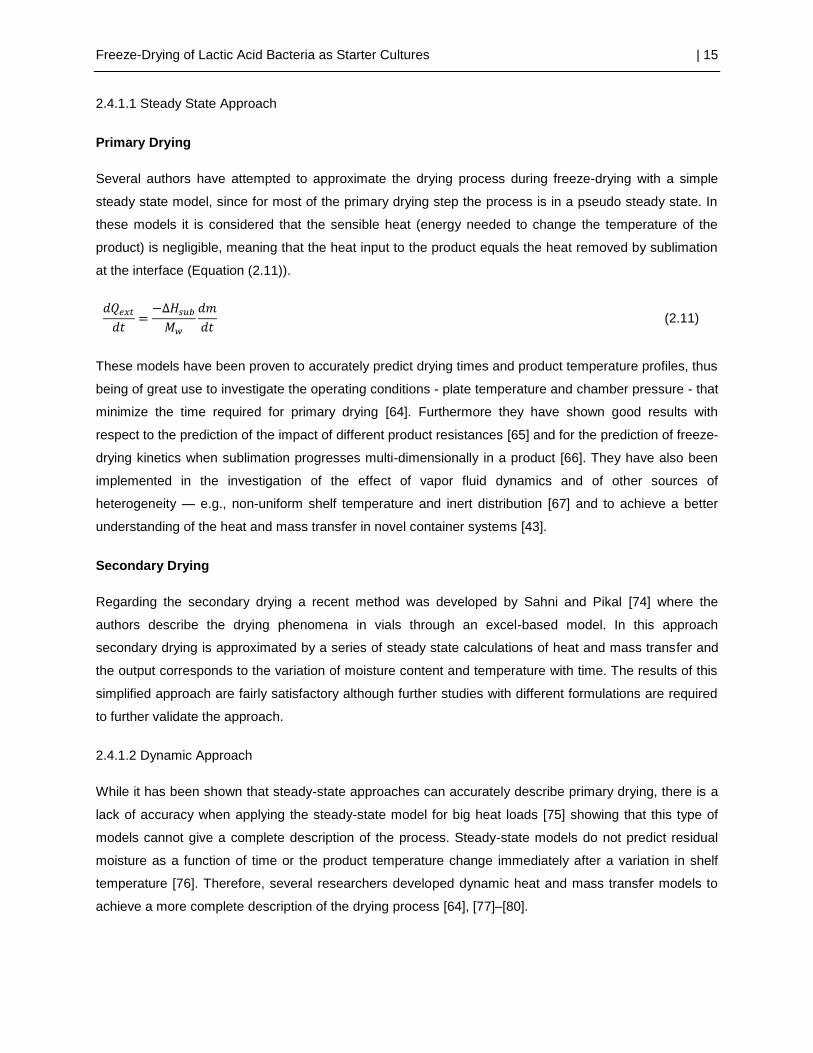
Several authors have attempted to approximate the drying process during freeze-drying with a simple
steady state model, since for most of the primary drying step the process is in a pseudo steady state. In
these models it is considered that the sensible heat (energy needed to change the temperature of the
product) is negligible, meaning that the heat input to the product equals the heat removed by sublimation
at the interface (Equation (2.11)).
𝑑𝑄𝑒𝑥𝑡
𝑑𝑡=
−∆𝐻𝑠𝑢𝑏
𝑀𝑤
𝑑𝑚
𝑑𝑡 (2.11)
These models have been proven to accurately predict drying times and product temperature profiles, thus
being of great use to investigate the operating conditions - plate temperature and chamber pressure - that
minimize the time required for primary drying [64]. Furthermore they have shown good results with
respect to the prediction of the impact of different product resistances [65] and for the prediction of freeze-
drying kinetics when sublimation progresses multi-dimensionally in a product [66]. They have also been
implemented in the investigation of the effect of vapor fluid dynamics and of other sources of
heterogeneity — e.g., non-uniform shelf temperature and inert distribution [67] and to achieve a better
understanding of the heat and mass transfer in novel container systems [43].
Secondary Drying
Regarding the secondary drying a recent method was developed by Sahni and Pikal [74] where the
authors describe the drying phenomena in vials through an excel-based model. In this approach
secondary drying is approximated by a series of steady state calculations of heat and mass transfer and
the output corresponds to the variation of moisture content and temperature with time. The results of this
simplified approach are fairly satisfactory although further studies with different formulations are required
to further validate the approach.
2.4.1.2 Dynamic Approach
While it has been shown that steady-state approaches can accurately describe primary drying, there is a
lack of accuracy when applying the steady-state model for big heat loads [75] showing that this type of
models cannot give a complete description of the process. Steady-state models do not predict residual
moisture as a function of time or the product temperature change immediately after a variation in shelf
temperature [76]. Therefore, several researchers developed dynamic heat and mass transfer models to
achieve a more complete description of the drying process [64], [77]–[80].

16 | Chapter 2
Primary Drying
Velardi and Barresi [64] developed a one-dimensional dynamic model for primary drying that introduces a
dynamic energy balance to describe the heat transfer in a glass vial. Through a comparison with
experimental data they concluded that shorter drying times and higher product temperature were
obtained when considering the heat exchange with the environment due to radiation and heat transfer
with the sidewall, and therefore this contribution should not be neglected. Later, the same research group
proposed a control system based on dynamic parameter estimation using a mathematical model that
allows in-line optimization and control of the freeze-drying process of pharmaceuticals in vials [8]. The
proposed control strategies based on feedback and a simplified dynamic model, indicated efficiency for a
wide range of operating conditions.
Secondary-Drying
Mechanisms of moisture desorption for amorphous and crystalline solutions, with specific solid-gas
contact areas, have been discussed in the scientific literature [41], [81]. Liapis and Bruttini concluded that
simultaneous adsorption and desorption at the interface between the solid and gas, convective transport
and gas diffusion in pores were the three mechanisms that were rate limiting in the considered
amorphous system [81]. In previous models the adsorption of bound water during primary drying was
considered, which added increased complexity to the models. Therefore, Sadikoglu and Liapis [9]
investigated the possibility of neglecting this term based on comparison of model predictions with
experimental data. They verified an equally good measure of the residual moisture kinetics.
Most proposed models of the desorption step assume a single desorption stage [82]–[85], although it was
demonstrated [41] that this step in reality consists of two different stages due to the different states of
water molecules (mono-layer and multi-layer) and the corresponding limiting mass transfer mechanisms.
Pikal et al. [41] showed that a fast desorption is observed in the first hours and a slower one when the
residual moisture content becomes very low, which can lead to cake shrinkage and collapse, resulting in
an increase of desorption time when approaching the mono-layer state is ignored in the setup of the
model.
Trelea and co-workers [86] developed a dynamic model that considers different desorption kinetics and is
able to accurately describe the temperature dependence during desorption. Although this dependence
has been proven, most of the models in the scientific literature do not consider it which represents a
model simplification and therefore a limitation [9], [62], [64], [82], [87], [88].

Freeze-Drying of Lactic Acid Bacteria as Starter Cultures | 17
Primary & Secondary Drying
One of the first works where a dynamic model was designed in order to describe both primary and
secondary drying was made by Litchfield and Liapis [89]. An extension of this model was made by
Millman and co-workers [90] where heat transfer from both top and bottom was considered, and a one-
dimensional moving sublimation interface and a top-down variation of temperature as well as moisture in
the porous product layer was assumed. Different heat transfer modes and operating conditions (chamber
pressure and shelf temperature) were tested in order to study moisture content profiles [90]–[92]. Based
on a previously developed model [9], Sadikoglu et al. [92] studied the effect of a dynamic optimization
considering the maximum allowable product temperature. Dynamic shelf temperature and chamber
pressure profiles showed decreased process times and lower product moisture content. Jafar and Farid
[93] studied the drying profile when both plate heating and radiation heating are applied and concluded
that drying occurs from the material surface close to the heating source irrespective of the heating
method.
Liapis and Bruttini [94] developed an extension of the one-dimensional model [90] for vials where both
axial and radial movement was considered for the sublimation interface. Sadikoglu [95] repeated the
study of the effect of a dynamic optimization [92] but considered a multi-dimensional system, arriving to
the same conclusions as previously. An optimization study of the vial position and geometric arrangement
was elaborated by Gan et al. [96] showing the number and location of vials that should be monitored in
real time. Mascarenhas and Pikal [82] also designed a three-dimensional model using a 2D approach
with axis symmetry where both sublimation and desorption were accounted for. Later, the same group
performed a study that provides a validation of the model with experimental data providing a physical set
of boundaries closer to reality [76].
2.4.2 Computational Fluid Dynamics
Computational Fluid Dynamics (CFD) is a branch of fluid mechanics that applies numerical methods for
the modelling of physical problems involving fluid flows. A CFD model consists of mathematical
expressions that describe the conservation laws for momentum, mass and energy. Partial differential
equations (PDEs) are derived and simplified using a discretization technique, which transforms the
continuous equations into discrete formulations. CFD models are thoroughly explored for single-phase
flow, however for multi-phase flow or complex geometries they are more difficult to handle. In the specific
case of freeze-drying, the application of CFD is limited by the description of the sublimating gas as a
continuum flow, due to a pressure close to vacuum during process operation [97].
CFD models are useful tools for freeze-drying process investigations since they can give an accurate
quantitative description of all variables involved in the process. The drawback is that assumptions must

18 | Chapter 2
be made in order to allow a mathematical description of the complex investigated processes, and stability
problems may arise in numerical simulations.
CFD can be used to simulate pseudo-stationary conditions at a certain time or for the entire freeze-drying
cycle, and the analysis can be done for specific parts of the equipment (i.e. chamber, condenser, duct
and valve) or for the entire apparatus.
2.4.2.1 Flow Regime
Three types of flow are mainly encountered in vacuum technology: viscous or continuous flow, molecular
flow and – at the transition between these two – the so-called Knudsen flow. The continuum fluid
hypothesis states that fluid flow properties such as density and velocity can be defined as averages over
volume elements large enough in comparison to the microscopic structure of the fluid, but small enough
in comparison to the scale of the macroscopic flow phenomena. Due to the very low pressure in freeze-
drying chambers it is possible that this assumption of continuity is no longer applicable and the choice of
the numerical modelling approach for heat and mass transfer in freeze-drying will be governed by the
significant rarefied flow effects.
The dimensionless parameter Knudsen number (Kn) is equal to the ratio of molecular mean free path (λ)
to the characteristic length scale (L) and it characterizes the influence of rarefied effects in a gas flow
(Equation (2.12)) [57].
𝐾𝑛 =𝜆
𝐿 (2.12)
In the transitional regime (0.01 < Kn < 0.1) CFD can still be used with specific boundary conditions
imposing gas velocity at the wall (i.e., partial-slip boundary condition). In the so-called molecular regime
(Kn>1), the flow is no longer dominated by collisions between gas molecules, and non-equilibrium effects
gain importance, resulting in velocity distributions far away from the Maxwellian distribution. In these
cases, it is necessary to resort to alternative simulation frameworks, such as the Lattice-Boltzmann
scheme [56]. In conclusion, flows under continuum gas conditions can be analyzed using the solution of
the Navier-Stokes equations whereas the rarefied flow solutions can be obtained by the direct simulation
Monte Carlo (DSMC) method for the Boltzmann equation [58].
2.4.2.2 Modelling at the Product Scale - Condensation Phenomenon
The majority of freeze-dried products are porous materials where condensation occurs frequently. In the
models presented in Section 3 the saturation change of the frozen region caused by recondensation was
not considered which leads to model uncertainty. Thus, studies were made to investigate the
condensation phenomenon of unsaturated capillary porous media [98]–[103]. Ghajar and Hashemabadi

Freeze-Drying of Lactic Acid Bacteria as Starter Cultures | 19
[104] investigated the condensation in an idealized porous medium using a cavitation model with a two-
phase mixture multi-phase flow. They developed CFD methods where slip flow, buoyancy, and capillary
forces in micropores were analysed with adequate boundary conditions. From this study it was concluded
that porosity and vapor flow rates are the main parameters that influence condensation kinetics. When
vacuum pressure is greater than saturated vapor pressure the condensation rate will increase, and
condensate in the porous material will block the pores. However, the influence of non-homogeneous
porous media has not been investigated in this study.
2.4.2.3 Modelling at Equipment Scale
In the past, the role played by vapor fluid dynamics once the vapor leaves the product was assumed to be
negligible due to the difficulty to identify and isolate its effects in the experimental results. Batch
heterogeneity problems and issues to evacuate the requested water vapor flow are frequent during a
freeze-drying process, and therefore, when designing a freeze-dryer critical features dependent on
equipment design and water vapor flow must be addressed. Typical design parameters that affect the
overall performance of a freeze-dryer are the geometry of the condenser and, for freeze-dryers with
condensers separated from the freeze-drying chamber, the size of the duct and of the isolating valve. The
experimental investigation of these issues is costly and time consuming, and therefore it is interesting to
explore them through a computational approach like Computational Fluid Dynamics (CFD).
2.4.2.4 Duct
Studies were carried out with focus on the resistances to vapor flow from the chamber to the condenser
pathway when the condenser is placed outside the drying chamber [105], [106]. A primary cause of loss
of pressure control is a phenomenon described as “choked flow”. This phenomenon happens under
aggressive operating conditions where the required mass transfer through the duct connecting the drying
chamber and the condenser cannot be maintained at the controlled pressure. The water vapor flow rate
increases as the condenser pressure decreases until the velocity of the water vapor reaches the speed of
sound at the duct exit. From that moment any further increase in water vapor flow rate results in an
increase in chamber pressure. This problem does not happen frequently in more conservative processes
where slow and suboptimal freeze-drying cycles are employed. However, since the need for increased
capacity has driven the design of new freeze-drying systems, it is essential to find the conditions
(combinations of dryer load, dryer capacity, shelf temperature and chamber pressure) under which
choked flow occurs. Studies were carried out to identify the critical parameters responsible for the
discrepancy when scaling up from laboratory to industrial freeze-dryers [106]. It was found that the
presence of a Cleaning-in-Place (CIP) and Sterilization-in-Place (SIP) piping in the duct lead to significant
changes in the mass flow rate predictions and the velocity profile in the duct (Figure 2.4). Thus, the fluid
dynamics of vapor and non-condensable gas in a low-pressure environment forms an important factor
affecting the energy and time costs of a freeze-drying unit operation.

20 | Chapter 2
Figure 2.4 – Comparison of velocity profile along the TDLAS optical path (OP) in the duct with and without
the presence of a CIP/SIP piping. [54]
2.4.2.5 Condenser
Models were also developed in order to improve condenser efficiency. These models describe the fluid
dynamics, the process and patterns of ice deposition in freeze-dryer condensers. Studies revealed that
the presence of a duct connecting the product chamber and condenser increased non-uniformity on ice
growth, and that the presence of non-condensable gases increased the effective resistance in the
condenser, preventing the vapor from condensing on the coils away from the duct exit [107], [108].
Ganguly and Alexeenko [107] have also shown that the location and topology of the condensing coils
significantly alter the ice growth and uniformity. They concluded that the hardware and the design of the
dryer and of the condenser could significantly alter the flow structure and vapor path (Figure 2.5).
Figure 2.5 – Left: Mass flux contours in the condenser for Case 1 with a duct extending by 9.5 cm into the condenser reservoir. Right: Mass flux contours in the condenser for Case 2 with a duct extending by 28.5 cm into the condenser reservoir. [55]

Freeze-Drying of Lactic Acid Bacteria as Starter Cultures | 21
2.4.2.6 Dual-Scale Model – Coupling Product and Equipment Attributes
In the previous sections, models describing the effect of the product characteristics on product
temperature and sublimation rate on the one hand, and the effect of the equipment capabilities on flow
dynamics on the other hand, were considered in separate models. However, it is critical to build a
framework that couples both equipment design and product attributes in a single model. Including first-
principles models for heat and mass transport as well as models for vapor transport in the drying chamber
and for ice deposition in the condenser, it is possible to develop, implement and validate a simulation
framework that describes the freeze-drying process. Ganguly and co-workers [71] presented a framework
where a system-level coupled sublimation-condensation model was used to determine the effect of
equipment design on the dynamic process/product characteristics and the effect of dryer hardware and
restrictions in the duct on the onset of choking. Similarly Rasetto et al. [109] introduced an important
model in process scale-up and transfer which allowed evaluating quantitatively the influence of the size of
the equipment, of the geometric characteristics of the chamber, and of the operating parameters.
2.4.3 Black-box Models
In the previous sections the application of mechanistic models to both optimize and monitor the process
was highlighted. However, first-principles based models are time consuming to develop, which can make
the in-line optimization unfeasible and/or increase significantly the required time for the off-line
optimization. Therefore, advantages could be obtained by using black-box models. As mentioned before,
black-box models are models where no physical insight is needed but where inputs and outputs can be
measured. These models can be either linear (e.g. linear input-output models, linear state-space models),
or non-linear (e.g. artificial neural networks, wavelets, fuzzy models) [110].
2.4.3.1 Artificial Neural Networks and Fuzzy Models
An artificial neural network (ANN) is a mathematical model which mimics the behavior of the brain, and is
composed of neurons organized into layers. This type of model is frequently used to estimate or
approximate functions that can depend on a large number of inputs. Fuzzy models are able to represent
process uncertainty and imprecision. In these models there are two fundamental functional components:
input and output interfaces and the processing core [111]. Fuzzy models are an approach to form a
system model using a description language based on fuzzy logic with fuzzy predicates. Fuzzy modelling
is a qualitative modelling scheme by which system behaviours are qualitatively described through a
natural language [112].
Based on a truncated Fuzzy-Neural Volterra Model, Todorov and Tsvetkon [113] presented a method for
designing a non-linear model predictive controller for the control of product temperature in a lyophilization
plant. The controller is based on a Volterra Fuzzy-Neural predictive model and а simplified gradient

22 | Chapter 2
optimization algorithm. Dragoi and co-workers [114] investigated a method for process modelling and
monitoring using a new methodology for optimal neural network design. They developed a self-adaptive
differential algorithm that allowed the simultaneous structural and parametric optimization of the network.
2.4.4 Novel Applications in Freeze-Drying
Different model strategies were highlighted in this chapter, leading to the conclusion that regardless of the
modelling approach, it is essential to have a fundamental understanding of the heat and mass transfer
phenomena for the selection of the correct freeze-drying conditions and the construction of an accurate
model [20]. Additionally, in the scientific literature a particular focus on studies regarding applications
using vials is notable since freeze-drying is primarily used in the pharmaceutical industry. Yet in the past
few years lyophilization has received a growing interest for food and biotechnology applications.
Therefore, in the future, freeze-drying can be expected to be performed in all different types of containers
and new equipment designs are likely to be implemented at both small and large scale [43], [44], [115].
Although the physical phenomena behind the process are basically the same – a sublimation and a
desorption phenomenon – there will be differences in the shape of the material being freeze-dried, in the
different resistances affecting the sublimation rate and in the vapor flow dynamics due to the different
equipment designs. Studies on the freeze-drying of food and of frozen pellets have shown how
challenging it is to model such systems since they are not very well known [66], [116]. For instance
studies for the drying of frozen pellets have been made where steady-state approaches have been
described both for primary and secondary drying of frozen particles [85], [117], [118]; however it seems
that different studies report different approaches for the way that particles dry in a freeze-drying process
dependent on the size of the particle. It is important to highlight the presence of two different porosities on
a bed of frozen particles – the inner porosity of each particle (changes with time) and the outer porosity of
the bed (constant if no collapse is considered). Liapis and Bruttini [85] studied the drying of small frozen
micro-particles (5-15 microns) and proposed a model where there is a sublimation front situated inside
the slab, where all the pellets above the front are dry and the ones below are frozen. Trelea et al. [117]
instead studied bigger particles (2000 microns) and proposed a model approach where sublimation
occurs simultaneously at different rates in all the pellets present in the tray; therefore there will be a dry
part situated at the periphery of the pellet and a frozen part at its core.
2.4.5 Measurement Techniques for Model Calibration & Validation
As described before mechanistic models have been successfully applied for freeze-drying cycle
development and optimization. However, to ensure constant product quality, the development of a design
space and a control strategy are essential. Based on the available potential combinations of shelf
temperature and chamber pressure the Design Space can be constructed for a specific formulation [119].
The Design Space is defined in ICH Q8 [120] as the multi-dimensional combination and interaction of

Freeze-Drying of Lactic Acid Bacteria as Starter Cultures | 23
input variables and process parameters leading to the acceptable product quality with a controlled
probability [121]. The limits of this Design Space are determined by the efficiency of drying, the
equipment limitations and the Critical Quality Attributes (CQAs) identified for the specific product (e.g. the
dried cake appearance) [122]. Thus Quality by Design can be incorporated into formulation and process
development, and also in process scale-up [57], [119], [123].
Before model predictions are useful to draw conclusions or decide on a Design Space, the model should
be a reliable representation of the reality. Therefore, an uncertainty analysis [124] and a verification of the
models using experimental data are essential. The literature reveals an extensive variety of measurement
techniques that have been applied in order to measure and understand the variables that are being
modelled. An overview of the most frequently used measurement techniques is presented in Table 2.1.
Furthermore, this table also highlights the disadvantages of each method.
Physical characterization of different formulations in both frozen and dried solid states provides relevant
information for formulation and process development. Table 2.1 shows an overview of different
techniques for measuring different physical characteristics of materials in both states. Porosity, density
and specific surface area will greatly influence the sublimation rate and are mostly influenced by the solid
concentration and composition, the freezing rate and size of the particles (when applied to bulk freeze-
drying). Glass and collapse temperature are critical product parameters in the determination of process
temperature and pressure since the product should be kept below these values in order to prevent
modifications in its structure.
In order to follow and control the process variables such as chamber pressure and shelf temperature,
these variables are normally measured during the course of the freeze-drying process. In addition, when
developing or improving a process it is relevant to measure the product temperature and the vapor flow,
yet these variables are not standard measurements since they are not accurate and reliable. It is
challenging to set the correct position for both probes since measurements will considerably differ with
the position selected, and furthermore the placement of the probes can disturb the process. Table 2.1
summarizes different on-line techniques for the measurement of these variables.
The performance of drying technologies is mainly evaluated by the reduction of water activity in the
freeze-dried products. Water activity and residual moisture content are variables used to control the
quality of the products being freeze-dried. Table 2.1 presents different methods used for the
measurement of these variables.
In summary, process methods can be divided in two groups where the first group comprises
measurements related to the product which include both on-line and off-line measurements, and the
second comprises measurements related to the entire batch. The application of developing technologies
for process monitoring (e.g. wireless product temperature monitoring, tuneable diode laser absorption

24 | Chapter 2
spectroscopy at manufacturing scale, heat flux measurement, and mass spectrometry) is a very important
step towards reaching a better understanding of the process and a way to optimize freeze-drying cycles
[125].

Freeze-Drying of Lactic Acid Bacteria as Starter Cultures | 25
Table 2.1 – State variables in freeze-drying and their measurement basis.
State Variable Measurement Basis Mode Ref. Description Disadvantages
Mate
rial
Porosity
Mercury Intrusion Porosimetry Off-line [126]
Determination of pore size distribution by mercury intrusion. Pressure is applied to force mercury into the pores. By measuring the intrusion volume and the applied pressure it is possible to calculate the pore size distribution
Scanning Electron Microscopy (SEM)
Off-line [126]
–[128]
Method where images of a sample are produced by scanning with a focused beam of electrons. Image analysis is used in order to estimate the pore size distribution.
• It can damage the sample;
• Sample preparation can modify the sample structure;
Bulk Density vs True Density Off-line [59] 𝜖 = 1 −𝜌𝑏𝑢𝑙𝑘
𝜌𝑡𝑟𝑢𝑒
X-ray micro-CT Off-line [129]
, [130]
Micro-focus X-ray source illuminates the object and a planar X-ray detector collects magnified projection images. The structure is analyzed by interpolating different sections.
• Lower resolution than SEM;
• It can damage the sample;
Density
Gas Pycnometer Off-line [127] Technique that uses gas displacement method to measure volume
Bulk Density Off-line [127]
Dry weight of a material related to a specific volume. Considers both the volume of the material and the air trapped between particles
Specific Surface Area
BET surface area analysis Off-line [41]
Specific area evaluation of materials by nitrogen multilayer adsorption measured as a function of relative pressure using a fully automated analyser
• Not accurate for pore size analysis;
• Not applicable to all types of isotherms;

26 | Chapter 2
State Variable Measurement Basis Mode Ref. Description Disadvantages
Glass Temperature
Differential thermal analysis (DTA) Off-line [61] Compares the difference in thermal properties of the product with a reference substance
• Low accuracy;
• Difficult to determine the conversion factors from temperature difference to enthalpy change;
Differential Scanning Calorimetry (DSC)
Off-line [26], [131]
Compares the difference in heat flow between the sample and the reference temperatures
• Low accuracy;
• Difficult to choose the right temperature scanning rate;
• Low sample mass that can lead to contaminations;
Modulated Temperature DSC Off-line [132] Recently developed extension of DSC in which sine wave modulation is applied to the standard linear temperature program
• Difficult to evaluate the data;
• Great number of experimental variables needed;
DTA – Electrical Impedance Off-line [64] Based on conventional electrical resistance analysis adding the use of derivative impedance analysis (Zsinφ)
Collapse Temperature
Freeze-Drying Microscope Off-line [34], [133]
Microscope where the freeze-drying of a small sample can be observed. Increasing/decreasing the temperature of the sample allows the visualization of structure collapse
• Not accurate;
Pro
cess
Product Temperature
Infrared Thermography On-line [134] Monitors spatial temperature distribution on materials or between vials placed inside the freeze dryer
• Change in the apparatus.
• Wrong temperature readouts when the material has low emissivity

Freeze-Drying of Lactic Acid Bacteria as Starter Cultures | 27
State Variable Measurement Basis Mode Ref. Description Disadvantages
Thermocouple On-line
[28], [125]
, [135]
Monitors temperature at a specific position of the sample and tray. Temperature measurement principle based on the Seebeck effect
• Invasive temperature measurement;
• Difficult to sterilize;
• Cannot be used in automatic loading systems;
• Not representative of the average batch temperature;
Resistance Thermal Detector On-line [28], [125]
Monitors temperature at a specific position of the sample and tray. Temperature measurement principle based on the temperature dependence of the electrical resistance of metals
• Invasive temperature measurement
• Difficult measurements at one point of the sample due to large thermo-sensitive region
• Requires power source
• Produces heat
• Not representative of the average batch temperature;
Manometric Temperature Measurement (MTM)
On-line [136]
, [137]
Records the pressure versus time data and analyses the data to calculate the temperature at the sublimation interface
• Does not consider temperature heterogeneity, just yields one temperature value.
Temperature Remote Interrogation System (TEMPRIS)
On-line [125]
, [138]
Wireless and battery free probes. Temperature monitored in real-time and displayed and recorded in a computer
• Invasive temperature measurement (possible differences of the freezing behaviour)
TrackSense Pro sensor On-line [139] Temperature is measured and transmitted on the ISM band to a data collector
• Invasive temperature measurement
• Dependent on the battery life time
• Data not available in real-time
Chamber Pressure
Pirani Gauge On-line [140] Measures the pressure in the drying chamber, measurements are highly influenced by gas composition
• Low accuracy
Capacitance Manometer On-line [125]
, [140]
Measure the absolute pressure in the drying chamber
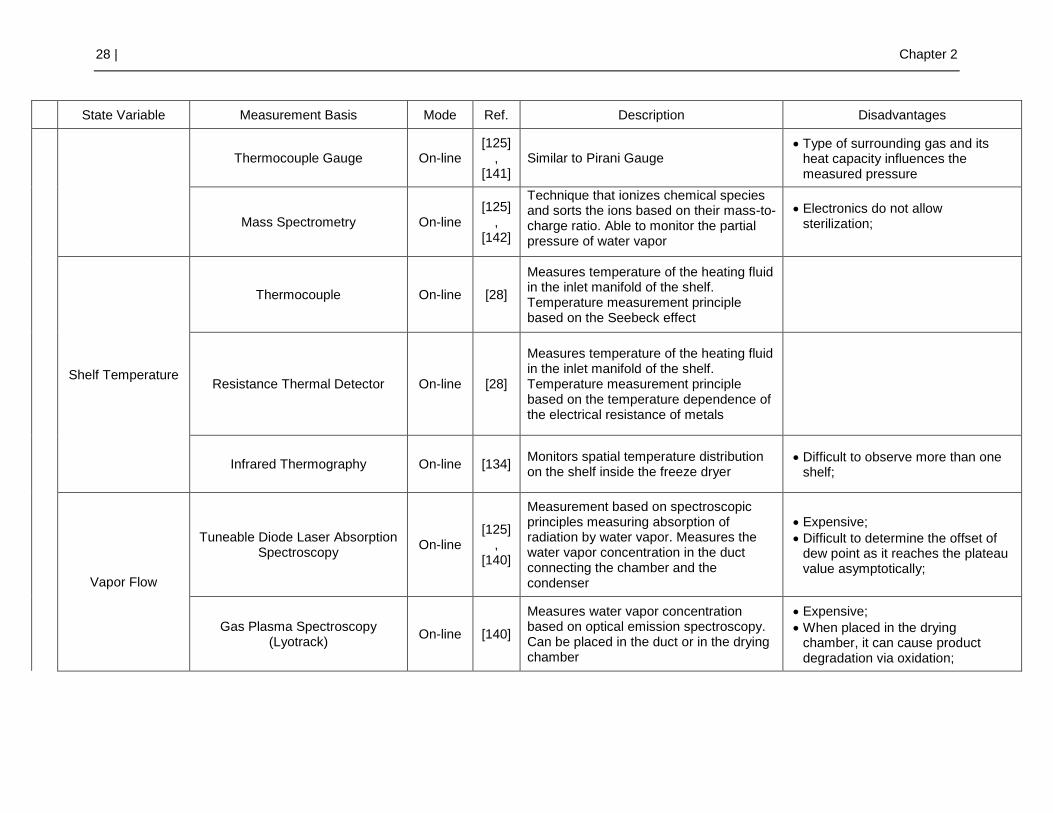
28 | Chapter 2
State Variable Measurement Basis Mode Ref. Description Disadvantages
Thermocouple Gauge On-line [125]
, [141]
Similar to Pirani Gauge • Type of surrounding gas and its
heat capacity influences the measured pressure
Mass Spectrometry On-line [125]
, [142]
Technique that ionizes chemical species and sorts the ions based on their mass-to-charge ratio. Able to monitor the partial pressure of water vapor
• Electronics do not allow sterilization;
Shelf Temperature
Thermocouple On-line [28]
Measures temperature of the heating fluid in the inlet manifold of the shelf. Temperature measurement principle based on the Seebeck effect
Resistance Thermal Detector On-line [28]
Measures temperature of the heating fluid in the inlet manifold of the shelf. Temperature measurement principle based on the temperature dependence of the electrical resistance of metals
Infrared Thermography On-line [134] Monitors spatial temperature distribution on the shelf inside the freeze dryer
• Difficult to observe more than one shelf;
Vapor Flow
Tuneable Diode Laser Absorption Spectroscopy
On-line [125]
, [140]
Measurement based on spectroscopic principles measuring absorption of radiation by water vapor. Measures the water vapor concentration in the duct connecting the chamber and the condenser
• Expensive;
• Difficult to determine the offset of dew point as it reaches the plateau value asymptotically;
Gas Plasma Spectroscopy (Lyotrack)
On-line [140]
Measures water vapor concentration based on optical emission spectroscopy. Can be placed in the duct or in the drying chamber
• Expensive;
• When placed in the drying chamber, it can cause product degradation via oxidation;

Freeze-Drying of Lactic Acid Bacteria as Starter Cultures | 29
State Variable Measurement Basis Mode Ref. Description Disadvantages
Heat Flux Heat Flux Sensor On-line [125]
, [143]
Heat transfer can be measured in discrete locations. Thin-film differential thermopile that generates an electrical signal proportional to the total heat applied to the surface of the sensor.
• Not suitable for secondary drying. Desorption heat is below the limit of detection of the sensor;
Qualit
y
Water Activity
Chilled Mirror Dewpoint Off-line [144]
Water activity is measured by equilibrating the liquid phase water in the sample with the vapor phase water in the headspace of a closed chamber and measuring the relative humidity of the headspace
Electric Hygrometers Off-line [144] Uses resistance or capacitance sensors to measure relative humidity
• Needs calibration;
• For accurate measurements a good temperature control or measurement is needed;
Residual Moisture Content
Gravimetric Method Off-line [28], [145]
Measures the maximum loss in weight of a sample equilibrated to constant weight over anhydrous P2O5 at a pressure below 1 mm Hg and a temperature between 20-30 °C
Karl-Fisher Method Off-line [28], [145]
Weighted product is dissolved in methanol and titrated with Karl-Fisher solution until the colour changes from brown to yellow
• Cannot be used if the product reacts with iodine;
• Cannot be used if the product dissolves in methanol;
Thermogravimetry Off-line [28], [145]
Weight loss of the product is measured at constant temperature or at a temperature-time profile

30 | Chapter 2
State Variable Measurement Basis Mode Ref. Description Disadvantages
Near-Infrared (NIR) Spectroscopy On-line [146]
NIR spectra are measured noninvasively with the assistance of a hyperspectral camera, a multichannel fiber-optic light source and fiber-optic noncontact diffusion reflectance probes
• Needs a reference method;
• Probes interfere with the tray disposition;

Freeze-Drying of Lactic Acid Bacteria as Starter Cultures | 31
2.4.6 Summary
This review provides an overview of the current state of mathematical modelling of the drying step during
a freeze-drying process. In this chapter the following key points have been identified:
• Freeze-drying is an expensive and very time-consuming process with high investment, operating
and maintenance costs. Modelling can be helpful for achieving a better overview and
understanding of the process and for the development of a Design Space;
• Steady state and dynamic state models to describe primary and secondary drying are reviewed.
Dynamic models are necessary for a more complete description of the drying considering both
sublimation and desorption;
• The use of CFD to simulate and study the water vapor flow in the duct and in the condenser was
reviewed. These models assess critical issues like batch heterogeneity problems or the capability
of the freeze-dryer to evacuate the requested water vapor flow;
• Dual-scale models describe frameworks that couple both equipment design and product
attributes. Including first-principles models for heat and mass transport as well as models for
water vapor flow it is possible to develop, implement and validate a simulation framework that
describes the freeze-drying process;
• Black-box models are based on empirical observations of the system’s behaviour; therefore,
measurement data of the inputs and outputs is used to build a process model. In industry this
type of models can be very useful due to the large amount of data available, yet it is necessary to
assure data validation to avoid potential errors;
• First-principles and data-driven modelling approaches can play an important role in process
design, optimization and control of critical quality parameters in freeze-drying: however they still
require a high degree of development for novel types of containers due to an increased use of
freeze-drying in different applications;
• Model validation is essential to ascertain whether the assumptions made are reasonable with
respect to the real system;
• In order to increase process knowledge that can lead to improvements in equipment design,
process control and processing efficiency a compromise between an experimental and a model-
based approach should be chosen.
The future requirements and developments in modelling and measurement techniques that should be
prioritized for the freeze-drying process are as follows:
• Further studies on fundamental understanding of heat and mass transfer phenomena on novel
containers and new equipment designs;
• Better understanding of the secondary drying phenomena through the introduction of PAT tools
for the monitoring of these phenomena (e.g. mass spectrometry);

32 | Chapter 2
• More detailed understanding of vapor flow in a freeze-dryer both through PAT tools and though
modelling;
• One of the main challenges of this area is the development of new measurement techniques,
which are able to measure the product temperature without interfering with the drying process.
2.5 Conclusions
The above description of the different steps of the process leads to the conclusion that freeze-drying is a
complex process that involves both heat and mass transfer to remove water from a frozen product. The
removal of water through sublimation at low pressures increases the stability of products during storage
and preserves their physical structure. However, it is an expensive and very time-consuming process with
high investment, operation and maintenance costs. Therefore, process development in this area is
focused on minimizing drying times while maintaining product quality. The successful development of a
freeze-drying cycle requires the combined knowledge of product properties and equipment design.
Enhanced process understanding can result in improvements of the equipment design, process control,
process efficiency, and potentially also the quality of the final product. To improve process performance
and get an increased knowledge and understanding of the phenomena happening during freeze-drying,
the development of mathematical models is an important tool. Mathematical models describing the
freezing and the drying steps are available in literature mainly for pharmaceutical applications where the
product is loaded into vials and frozen and dried inside the freeze-drying equipment. Nowadays, different
types of containers and new equipment designs have been implemented at both small and large scale
due to the implementation of this process in new applications. Although the physics involved in the
process are basically the same – a sublimation and a desorption phenomenon – there will be differences
in the shape of the material being freeze-dried, in the resistances affecting the sublimation rate and in the
vapor flow dynamics.
A combined simulation that allows quantifying the effect of dryer design on the freeze-drying rate and
product attributes requires advanced models that describe the dynamics of the fluid in the drying
chamber. CFD allows predicting dynamic process conditions that take into consideration the design of the
dryer. The combination of product attributes and equipment capabilities in the same model has great
potential in both optimization of the current processes and introduction of new processes.

Scale-up Investigation – Streptococcus thermophilus at Chr. Hansen
Chr. Hansen develops and produces starter cultures, enzymes, probiotics and natural colours for several
different applications. Different species of lactic acid bacteria are produced at Chr. Hansen for later
application in the production of fermented dairy products, yet this chapter will focus on Streptococcus
thermophilus as the model organism. Streptococcus thermophilus, is one of the most important species at
Chr. Hansen since it is used for the manufacture of several important fermented dairy foods, like yoghurt
and cheese [147].
A detailed understanding of the principal characteristics of the products being freeze-dried and of the
freeze-drying equipment itself, is a prerequisite for a rational development of a mathematical model.
Therefore, this chapter focuses on the application of different methods for achieving a better and deeper
understanding of the main characteristics of the product and the equipment that might affect the drying
process.
3.1 Principal Component Analysis (PCA)
Multivariate Data Analysis (MVDA) is a strong and relatively easy to use tool to analyse large amounts of
data, enabling analysis of all associated variables at once.
MVDA finds the typical data pattern for one or more classes of observations. Principal component
analysis (PCA) is a multivariate technique that reduces the dimensionality of large datasets but at the
same time increases its interpretability and minimizes the loss of information [148]. PCA can reveal
groups of observations, trends and outliers.
This thesis focuses on the scale-up of the freeze-drying process. However, not only the scale has an
effect on the process, but also different physical properties of the product and the design of the
equipment. Therefore, through an exploratory analysis, this section intends to investigate the effect of the
product and the equipment on the end properties of the product.

34 | Chapter 3
3.1.1 Production Data at Chr. Hansen
Data from six years of production was collected (2012-2017). Eight different production strains of
Streptococcus thermophilus were selected. The selected production strains originated from different Chr.
Hansen sites, and are either freeze-dried in the same or in a different site from where the fermentation
step took place. Since this work focuses on the freeze-drying step, data from before and after freeze-
drying was used in the PCA analysis. All the selected bulk production runs are dried under the same
process conditions (temperature and pressure), yet the drying time is dependent on the site where freeze-
drying takes place.
The quality and performance of each produced batch of bulk culture is evaluated through different steps
before it is released. Each production strain has its own minimum and maximum specification. If the batch
meets the specifications, the culture is internally approved, and immediately released for further
processing. The different tests are described below and Table 3.1 indicates the different parameters used
for the PCA analysis.
• Ta, ph–4h, ph-6h and ph-12h - measured using a CINAC (Alliance Instruments) equipment and
software. The method consists in the inoculation of the culture in milk, and the continuous
measurement of the pH in milk for 24 hours. Acidification curves are obtained which can be used
to determine pH after 4, 6, and 12 hours of fermentation and the time of acidification;
• Active Cells, Total Cells – measured through flow cytometry;
• Yield - is calculated by measuring the mass of product that comes out of the process;
• aw - water activity is measured with a chilled mirror dewpoint equipment.
Table 3.1 – Parameters used to evaluate the starter cultures before freeze-drying (PFD) and after freeze-drying (FD).
Parameters Description Application
Site Site where a certain batch was fermented and/or freeze-dried. PFD, FD
Equipment Fermenter or freeze-dryer chamber where the process took place. PFD, FD
Type of FD Type of heat transfer in the freeze-dryer (Radiation, Contact) FD
Yield Mass of product that goes out of the process PFD, FD
Active Cells Number of active cells PFD, FD
Total Cells Number of total cells, including dead and active cells PFD, FD
pH-6h pH measurement after 6 hours of fermentation PFD, FD
Ta The initial time required to reach an acidification of the medium of
0.1 pH units PFD, FD
aw Is the partial vapour pressure of water in the product after FD
divided by the standard state partial vapor pressure of water FD

Scale-up Investigation – Streptococcus thermophilus at Chr. Hansen | 35
3.1.2 PCA of Streptococcus thermophilus at Chr. Hansen
A PCA was performed to 1804 batches of the eight different strains in order to choose strains for further
investigation. An exploratory analysis of the data was intended. Raw data was inspected in order to
remove batches where data was inserted wrongly or had missing values. Since the different variables
have different scales it is necessary to pre-process the data as a first step. Autoscaling subtracts the
mean value from each sample and then the variable is divided by its standard deviation [149].
Four components were chosen for the PCA model since their eigenvalues exceed one (Kaisers’ rule).
Outliers were detected through Hotelling’s T2 statistic, and were removed after further investigation.
Figure 3.1 shows the scatter plot of principal components 1 and 2, which explain 46.38 % of the variation
in the data. Groupings of the data were observed and four strains representative of each group were
chosen for further investigation – ST-B, ST-C, ST-D and ST-H.
Figure 3.1 – PCA score plot of the first and second principal components of production data of Streptococcus thermophilus. The first and second principal components explain 46.38 % of the variation in the dataset.
3.1.3 PCA of the selected Streptococcus thermophilus
The same process as described before was applied to the four chosen strains. Once again autoscaling
was performed for pre-processing of the data but only 3 components were chosen instead. In addition to
the previously studied parameters, the composition of the fermentation media and of the eluate post-
centrifugation were now also included in the analysis.
Figure 3.2 shows the bi-plot of principal components 1 and 2, which describe 56.78% of the variation in
the dataset. Strains close to each other have similar properties, whereas the ones far from each other

36 | Chapter 3
have dissimilar properties. Furthermore, when looking at the loadings, it is known that variables are
inversely correlated if they are positioned on opposite sides of the plot origin. For example, it is possible
to see that the concentration of lactose in the fermentation broth and of glucose and galactose in the
eluate is inversely proportional to the number of active cells before and after freeze-drying. It is also
observable that strains with the same lyo- and cryo- additives (ST-B and ST-C) have the tendency to
group. However, further investigation is needed in order to understand if there is any correlation between
these factors.
Figure 3.2 – PCA bi-plot of the first and second principal components of production data of the selected strains of Streptococcus thermophilus. The first and second principal components explain 56.78 % of the variation in the dataset.
3.1.4 Freeze-drying the same strain at different Chr. Hansen sites
The same process described before was applied to the four chosen samples. Once again autoscaling
was performed for pre-processing with 3 components. In addition to the previously studied parameters,
the composition of the fermentation media and of the eluate post-centrifugation were also included in the
analysis.
As it was previously mentioned, the fermentation step of a certain strain can be performed on one
production site and the same batch can be freeze-dried on a different site or even be freeze-dried on
several different sites. Therefore, it is relevant to study the effect of different sites on the freeze-drying
process. Figure 3.3 shows data from the same strain, ST-H, being freeze-dried in different sites. A

Scale-up Investigation – Streptococcus thermophilus at Chr. Hansen | 37
grouping of the data by freeze-drying site is not observed, leading to the conclusion that the freeze-drying
site is not affecting the end characteristics of the product. Figure 3.3 shows the principal components 1
and 2, which explain 43% of the variation in the data set.
Figure 3.3 – PCA score plot of the first and second principal components of ST-H data on different sites. The first and second principal component explain 43 % of the variation in the dataset.
Furthermore, it is also important to investigate the influence of different types of heat transport during
freeze-drying (contact, radiation) on the end product. Once again, from Figure 3.4 it can be observed that
there is no grouping of the data for the same strain according to the type of heat transport that was
applied.

38 | Chapter 3
Figure 3.4 - PCA score plot of the first and second principal components of ST-H data on freeze-dryers with different heat transfer methods (radiation/contact). The first and second principal components explain 43 % of the variation in the dataset.
3.2 Product Characterization
Through PCA it was observed that strains with the same cryo-additive have the tendency to group in the
scatter plot. Furthermore, it was shown that there exists a correlation between the product composition
and the number of active cells. The fermentation medium, the non-consumed substrate and the formed
products during fermentation and the added cryo-addictive differ from product to product and will affect
the final characteristics of the product. The next section intends to study the physical state of the freeze-
dried matrix and its effect on the drying behaviour of the different products. The composition of the growth
media in the beginning and at the end of the fermentation step, the composition of the cryo-additives
added to the media, the percentage of drying matter present in the product, the glass temperature before
and after the addition of cryo-additives, the particle size distribution and the visual morphology of the
product will be some of the characteristics analysed in this section.
3.2.1 Methodology
Freeze-drying
The four chosen strains were produced and pelletized in the production site Chr. Hansen in Avedøre. The
freeze-drying experiments were carried out in a lab scale freeze-dryer (LyoBeta-15, TELSTAR). The
product after pelletizing was stored at -55 °C. The freeze-drying chamber and the metal trays used for
freeze-drying experiments were cooled down to -55 °C approximately 2 hours before a freeze-drying
Scale-up Investigation – Streptococcus thermophilus at Chr. Hansen | 39
experiment. The pellets were loaded onto the metal trays as quick as possible to prevent melting. Only
one tray was loaded to the freeze-dyer, which corresponds to approximately 600-700 grams of product.
The chamber pressure was set to 0.5 mBar and the shelf temperature to 32 °C.
During all freeze-drying cycles the on-line measurements are the fluid-inlet temperature, the temperature
at the condenser, the chamber pressure and total weight. In some experiments the temperature of the
product was also measured at different heights with TrackSense Pro data logger (Ellab).
Composition of the fermentation broth and eluate
The composition of the fermentation broth and eluate was measured through HPLC analysis with an in-
house method developed at Chr.Hansen.
Differential Scanning Calorimetry (DSC)
Glass transition temperatures (Tg’) were determined through differential scanning calorimetry (DSC,
Mettler Toledo DSC822). 40 µl of sample were loaded into an aluminium cup and heated from -100 °C to
0 °C at 7 °C/min.
Scanning Electron Microscopy (SEM)
Freeze-dried samples were cut and observed with a scanning electron microscope (SEM, FEI Inspect S).
Samples were cut, and applied on an inert carbon adhesive tab and coated with 20 µg of gold for 15 s.
The images were produced with an electron beam under vacuum.
Dry matter content
The percentage of dry matter present in samples after the addition of lyo- and cryo- additives was
measured with a moisture analyser (Sartorius Model MA35). Around 4.8 to 5.2 g of each sample were
distributed evenly on a filter paper and the temperature was set to 120 °C. This method removes moisture
using heat and it can therefore be applied to measure the amount of dry matter present in the sample.
Ice Sublimation tests
Sublimation tests were performed in a laboratory/pilot freeze-dryer (Telstar LyoBeta-15) and a production
freeze-dryer (RAY 2, GEA). The trays were filled with ice pellets and inserted in the freeze-dryer. The
laboratory/pilot freeze-dryer was loaded with 6 trays, which corresponds to the maximum loading. The
production freeze-dryer was loaded with 26 trays, which does not correspond to the maximum loading.
Sublimation rates were determined gravimetrically by an on-line scale.
On the laboratory/pilot freeze-dryer, drying was performed at different shelf temperatures (30, 50 and 75
°C) and different pressures (0.2, 0.35 and 0.5 mBar). The freeze-dryer was loaded before each cycle. On
the production freeze-dryer drying was performed at different shelf temperatures (30, 50 and 75 °C) and a
pressure of 0.5 mBar. Between the cycles at 30 °C and 50 °C the freeze-dryer was not loaded with a new
batch of pellets, being at 30 °C for 2 hours and afterwards the shelf temperature was increased to 50 °C.

40 | Chapter 3
3.2.2 Results
The first step in the production of lactic acid bacteria cultures is to generate a large number of cells by
fermentation. Lactic acid bacteria require complex substrates for growth. Figure 3.5 shows the sugars and
acids present in the growth medium of ST-B, ST-C, ST-D and ST-H, confirming that the composition of
the growth media is strain dependent.
Figure 3.5 – Sugar and acids composition in the fermentation broth of different strains of Streptococcus thermophilus. Only relative differences between media are shown for proprietary reasons.
The majority of lactic acid bacteria convert over 50% of the sugar carbon to lactic acid and can be either
homo- or heterofermentative [150]. Figure 3.6 shows which components were left in the eluate after
centrifugation, where both non-consumed components and components formed during the fermentation
step are present. Bacteria do not need to metabolize the carbohydrates in order for them to act as
protective agents during drying, therefore it can be relevant to analyse the composition of the eluate since
the survival rate can also be influenced by these compounds [14], [39].

Scale-up Investigation – Streptococcus thermophilus at Chr. Hansen | 41
Figure 3.6 – Composition of the eluate after centrifugation of different strains of Streptococcus thermophilus. Only relative differences between media are shown for proprietary reasons.
Freeze-drying survival is dependent on fermentation process conditions, such as growth medium and
time of harvest [151]–[153]. It is frequently assumed that the optimum growth conditions for the
production of biomass also prepare the cell to survive the freeze-drying process, but this is not always the
case. Further studies are needed to better understand the effect of growth media, temperature, redox
potential, pH, and type of alkali on the survival of the cells in the different strains [154].
The last step before freezing and drying of the product it is the addition of cryo- and lyo- protectants to the
media. As it was already discussed in Chapter 2, different components will have different mechanisms of
protection. Furthermore, the protection mechanism is also strain dependent. ST-B and ST-C have the
same protection additives which are mainly sucrose and maltodextrin. To ST-D mainly skim milk powder
is added, and to ST-H sodium caseinate and ascorbate.
Skim milk has been extensively used when freeze-drying lactic acid bacteria since it is easy to dry. The
whey and lactose contained in the milk increase the survival of lactic acid bacteria to freeze-drying and
the proteins which are also present provide a protective coating for the cells. Lactose, sucrose and
maltodextrin have also shown to improve the survival by inhibiting free radical production, forming
hydrogen bonds with the protein and increasing the collapse temperature. Ascorbic acid helps to increase
recovery rates although it has also been proved to be toxic to the cells in some cases. Through Figure 3.5
and Figure 3.6 and knowing the composition of cryo- and lyo- protectors added, it is possible to know the
final composition of the product being dried. However, further studies are needed in order to know the
exact effect of each component on the protection of the bacterial viability and on the product structure.
Furthermore, the protection mechanism is not only dependent on the components present but also on
their concentration [34].

42 | Chapter 3
Chapter 2 mentioned the importance and relevance of glass temperature. For aqueous solutions, it has
been shown that glass and collapse temperatures have approximately the same value, with less than 3
°C of difference. When observing the thermograms of the different strains it can be seen that it is difficult
to identify the step change in the heat flow curve that corresponds to the glass transition temperature.
Instead the heat curve decreases over time until it reaches the melting temperature. Table 3.2 shows the
approximated measured values of glass temperature of the different strains before and after the addition
of cryo- and lyo-protectors. As expected, the addition of cryo- and lyo-protectors increases the glass
temperature of the different strains. Nevertheless, Fonseca et al. (2004) have shown that lactic acid
bacteria cells give robustness to the freeze-dried product, resulting in increased collapse temperatures
and allowing the use of higher sublimation temperatures during primary drying [34]. Therefore, the gap
between glass and collapse temperature becomes much higher (about 10 °C) and the use of glass
temperature as a first approximation to collapse temperature becomes obsolete. Collapse temperatures
can be determined by freeze-drying microscopy. The accuracy of the measurements for bacterial
suspensions is quite low and due to time limitations they have not been performed.
Table 3.2 – Glass temperature (Tg’) of different frozen samples of Streptococcus thermophilus before and after the addition of cryo- and lyo-protectors.
Tg’ without cryo- & lyo- protectors [°C] Tg’ with cryo- & lyo- protectors [°C]
ST-B - 47.54 - 45.04
ST-C - 53.87 - 50.01
ST-D - 57.20 - 52.32
ST-H - 49.63 - 45.88
Solid-state characterization was carried out by scanning electron microscopy (SEM) and ocular inspection
to detect melting, collapse or any change in the product morphology that can explain a change in the
drying behaviour. A wide pore size distribution was observable in all the samples, which leads to
inaccurate measurements and estimations of average pore size. Nevertheless, SEM analysis revealed
that after freeze-drying ST-C, ST-D and ST-H present a less porous layer on the surface (Figure 3.7). The
formation of this layer could be due to a micro-collapse of the product, meaning that the surface of the
product was exposed to temperatures above its collapse temperature. On the contrary, ST-B presents a
porous surface which leads to a facilitated transport of the water vapour.

Scale-up Investigation – Streptococcus thermophilus at Chr. Hansen | 43
Inside Outside
a) b)
c) d)
e) f)
ST-B ST-B
ST-C ST-C
ST-D ST-D

44 | Chapter 3
Figure 3.7 – SEM images of the inside and outside of freeze-dried samples of ST-B, ST-C, ST-D and ST-H.
Freezing was done by quenching in liquid nitrogen.
Figure 3.8 shows the percentage of dry matter present in the frozen product. It is observed that ST-C is
the strain with the highest percentage of dry matter and ST-D the one with the lowest. A higher
percentage of dry matter in the product leads to a higher final weight fraction. Additionally, a higher
amount of trapped water that cannot be dried will also lead to a higher final weight fraction. However, it
cannot be stated that a higher percentage of dry matter results in faster drying since the physical
morphology of the product will also influence the drying rate.
Figure 3.8 – Dry matter percentage of frozen samples of ST-B, ST-C, ST-D and ST-H.
Figure 3.9 shows how the weight fraction of the different strains evolves over time. Throughout this thesis
it has been highlighted that drying time can be influenced by cooling rate, existence/absence of
annealing, solid concentration, product composition, size and distribution of the pellets and selected
process parameters (pressure and temperature). At Chr. Hansen the freezing step is done outside the
freeze-drying equipment by dropping the product in liquid nitrogen, and therefore the cooling rate is
g) h)
ST-H ST-H

Scale-up Investigation – Streptococcus thermophilus at Chr. Hansen | 45
mostly constant for the different strains. Furthermore, the annealing process is not applied. Hence,
cooling rate and annealing were not considered as influencing factors on the final physical state of the
freeze-drying matrix of the different strains considered in this study. Comparing the drying behaviour of
ST-C and ST-D, which correspond respectively to the strain with higher percentage of dry matter and the
strain with lower percentage, it is possible to conclude that ST-C has a slower drying rate although it
contains a lower amount of water. This observation follows the conclusions by Quast and Karel (1962)
who showed that higher solute concentration leads to greater resistance of the dry layer to gas flow [155].
Figure 3.9 shows also that ST-B is the strain with the faster drying rate. ST-B and ST-H have an identical
amount of dry matter in their composition. However, when comparing the drying profiles, it is observable
that the drying rates are very different. Figure 3.7 shows a different morphology of the dried products,
where ST-B presents a more porous outer layer and ST-H smaller pores and a melted outer layer. Since
the drying conditions (pressure and temperature) were the same, the differences in their behaviour are
most probably due to differences in their composition. It is well-known that the composition of the product
will strongly influence the physical state of the freeze-dried matrix and the viability of dried lactic acid
bacteria, yet further studies are needed to understand to which extent they are affected. Table 3.2
concludes that both strains have approximately the same Tg’, however in starter cultures the robustness
is increased due to the presence of lactic acid bacteria, and therefore it is the collapse temperature (Tc’)
that determines the occurrence/absence of melting/collapse.
Figure 3.9 – Fraction of product weight per drying time. Measurements of one single tray of product loaded in a laboratory/pilot freeze-dryer. Different strains of Streptococcus thermophilus were investigated (ST-B, ST-C, ST-D, ST-H).
Therefore, it is possible to conclude from Figure 3.9 and through the different methods for product
characterization that further studies are needed in order to better understand the drying behaviour of the
different strains.

46 | Chapter 3
3.3 Equipment Characterization
Through PCA analysis it was shown that the same strain freeze-dried in different Chr. Hansen sites does
not present considerable differences in terms of product quality. However, it is known that each site has a
different freeze-drying equipment, and therefore the drying profiles had to be adapted to the
characteristics of each freeze-dryer. Freeze-dryers can mainly differ in drying chamber size, condenser
capacity and location (outside or inside the drying chamber) and heating method (contact or radiation).
This section intends to characterize a laboratory/pilot scale freeze-dryer and a production freeze-dryer.
3.3.1 Design Characteristics
Heat and mass transfer are determinant success factors of a freeze-drying cycle. In order to account for
scale-up factors related to freeze-drying equipment design and capacity, the equipment must be
thoroughly characterized. The relevant performance components include shelves, chamber and
condenser design.
The two characterized freeze-dryers are the laboratory/pilot freeze-dryer located at Chr.Hansen Hørsholm
and the production freeze-dryer located at Chr.Hansen Avedøre. Table 3.3 summarizes some of the
freeze-dryers’ basic characteristics. The trapping rate of the condenser is an important parameter and is
related to the design of the condenser (size and shape). The ratio between the condenser and the shelf
surface shows the capacity of the condenser. From Table 3.3 both condensers seem to have similar
capacity. However, it has been shown by Ganguly et al. [2012] that it is also important to consider the
design of the condenser since it will influence the way that ice accumulates on the coils [71], [107].
Furthermore, also the position of the condenser might influence the sublimation rate. The temperature of
the condenser is not as important as its design. However, it is essential to ensure that the temperature of
the condenser is below the temperature of the chamber. The trapping rate might decrease as the ice
builds up since the temperature of the ice surface is not as cold as the condenser surface.
Furthermore, it has been studied that in the case of vial freeze-drying the vials closer to the door and the
walls have a higher drying rate due to additional radiation heat. In the case of bulk freeze-drying the same
phenomena will happen [31]. Additionally, Table 3.3 shows that the laboratory/pilot scale freeze-dryer has
a door made of transparent acrylic which can also lead to increased radiation heat since this material has
a higher emissivity [115].

Scale-up Investigation – Streptococcus thermophilus at Chr. Hansen | 47
Table 3.3 – Properties of a laboratory/pilot freeze-dryer (Telstar) and a production freeze dryer (RAY).
Telstar RAY
Type of heating Radiation Radiation
Door Transparent acrylic Stainless steel
Surface area of shelves [m2] 0.363 114
Maximum capacity of condenser [kg] 30 2200
Surface area of condenser [m2] 0.171 57.64
Ratio between condenser and shelf surface area 0.471 0.506
Condenser temperature [°C] - 80 - 47
Condenser partial pressure [mbar] 0.000547 0.055
3.3.2 Shelf heat transfer coefficient
Heat transfer into the product occurs through different mechanisms: radiation, conduction and convection.
Sublimation tests were performed in order to calculate the shelf heat transfer coefficient. Pelletized
deionized water was loaded into trays and Equation (3.1) was used to calculate the heat transfer
coefficient.
𝐻𝑇𝐶 =∆𝐻𝑠𝑢𝑏 ∙ 𝑑𝑚 𝑑𝑡⁄
𝐴𝑠ℎ𝑒𝑙𝑓 ∙ (𝑇ℎ𝑒𝑎𝑡𝑖𝑛𝑔 𝑝𝑙𝑎𝑡𝑒 − 𝑇𝑏𝑜𝑡𝑡𝑜𝑚 𝑡𝑟𝑎𝑦) (3.1)
Figure 3.10 shows the estimated values of heat transfer coefficient for a laboratory/pilot freeze-dryer and
a production freeze-dryer. It is concluded that, in the studied range, the heat transfer coefficient for the
laboratory/pilot scale is not pressure dependent but temperature dependent. For the production
equipment a constant heat transfer coefficient was observed which is not dependent on temperature and
pressure. It was also observed that the production equipment has a six times lower heat transfer
coefficient, which will result in a slower process.

48 | Chapter 3
Figure 3.10 – Heat transfer coefficient for different temperatures and pressures for a laboratory/pilot freeze-dryer (Telstar) and a production freeze-dryer (RAY).
3.4 Conclusions
This chapter gave a general overview of the freeze-drying process and of the product and equipment
characteristics at Chr. Hansen. Important considerations for the development of a mathematical model
that describes the freeze-drying process were investigated and discussed. When modelling, it is not
possible to fully represent all details of the real system, and some assumptions and approximations must
be made.
Section 3.3 described different methods for product characterization and investigated some of the
differences between different products dried under the same process conditions (temperature and
pressure) and on the same freeze-drying equipment. The challenges to characterize freeze-dried lactic
acid bacteria were discussed. A summary of the characteristics of freeze-dried lactic acid bacteria
required to better describe the process can be found below.
• The average porosity and pore size diameter is not constant inside a single particle;
• The porosity between particles is dependent on the way that the trays are filled and on the
average size of the particles;
• The matrix of the freeze-dried products and the absence /occurrence of melting and collapse is
dependent on the product composition and process parameters;
• The survival of the bacteria during freeze-drying is dependent on protection mechanisms that are
strain dependent and also composition dependent. The survival of the bacteria is also dependent
on the process parameters.

Scale-up Investigation – Streptococcus thermophilus at Chr. Hansen | 49
However, it will not be possible to fully describe these characteristics in the mathematical model
developed. An average pore size distribution and porosity inside the pellet and between pellets will be
assumed for model development. Furthermore, the collapse of the pellet will change the morphology of
the product which will lead to changes in vapour flow and consequently will influence drying rates. Since it
is very difficult to quantify and predict these changes, the collapse phenomenon will be disregarded in the
model. The model will only be able to predict physical properties of the process; therefore, it will also not
be possible to predict the survival of the bacteria.
Section 3.4 described the main differences between a lab/pilot freeze-dryer and a production freeze-
dryer. A summary of the main characteristics of the different scales that are relevant for the model
development are described below.
• The position, design and capacity of the condenser might affect the freeze-dryer performance;
• The material of the freeze-dryer can influence the way that heat is transferred to the product;
• The transferred heat to the shelves and the sublimation rate will depend on their position;
• The heat transfer coefficient in the studied range is mainly affected by temperature. This effect is
mainly observed in the lab/pilot freeze-dryer. The heat transfer coefficient decreases with the
increase of temperature;
• The heat transfer coefficient is lower in the production freeze-dryer.
A simplified geometry of the equipment will be considered when developing the mathematical model.
Furthermore, a constant heat transfer from the shelves will be considered throughout all the equipment.
Summarizing, this chapter gives an overview of different methods to characterize different products and
equipment in order to better understand the assumptions and approximations made for the later
development of the mathematical model.

50 | Chapter 3

Drying of a Single Particle
Freeze-drying is both dependent on the physical form of the material to be dried and on the physical
parameters and characteristics of the freeze-dryer itself. Different types of product containers (vials, trays,
syringes, etc.) are used dependent on the physical characteristics of the product, and depending on its
final application. As mentioned in the previous chapters, this work focuses on bulk freeze-drying where
particles have irregular shapes and are randomly distributed in the trays.
Drying of frozen particulate matter is characterized by a bimodal pore size distribution: 1) Pore size
distribution of the bed of particles which is determined by the particle size and packing, and 2) Pore size
distribution inside each particle which is dependent on the initial solid concentration and on the freezing
rate. The ratio between the two pore size distributions will influence primary drying rates.
Figure 4.1 – Drying of a bulk tray characterized by a bimodal pore size distribution. 1) pore size distribution of the bed of particles; and, 2) pore size distribution inside each particle. Black represents frozen material and white dried material. X1 and X2 represent two moving sublimation fronts.
This chapter focuses on mass transfer processes occurring in a single particle during primary drying. A
greater and more comprehensive understanding of the phenomena occurring at the product scale is the
starting point for the development of a detailed model able to predict drying rates, product temperature
and pressure profiles of a complete process.
Fundamental knowledge of the mass transfer process during primary drying of lyophilization was obtained
using freeze-drying microscopy (FDM) and a micro-computed tomography (µ-CT) imaging system
followed by image analysis. Total mass transfer is mainly determined by two types of flow: viscous flow
which is driven by a total pressure gradient and described by Darcy’s law, and molecular flow which is
driven by a concentration gradient. In this study it will be assumed that the saturation pressure at the

52 | Chapter 4
sublimation front is equal to the chamber pressure, and therefore the contribution of the viscous flow is
assumed to be negligible [156].
A model based on computational fluid dynamics (CFD) tools for the prediction of drying times of a single
particle being freeze-dried will be developed. The developed model will be validated with experimental
data obtained by use of a freeze-drying microscope (FDM).
4.1 Mechanisms of Mass Transport in Porous Material
Throughout primary drying the mass transfer is dominated by three different steps: 1) ice sublimation, 2)
water vapour transfer from the interface between the frozen mass and the dried cake to the outer edge of
the product, and 3) water vapour transfer from the edge of the product to the chamber and to the
condenser [157]. The next sections will describe in detail the mass transport phenomena connected to
each step.
4.1.1 Ice Sublimation
Sublimation is the process in which a substance transitions from the solid phase to the gas phase, without
passing through a liquid phase. It is an endothermic phase change, meaning that heat is absorbed by the
system. This phenomenon is given by Equation (3.1) developed by Heinrich Hertz and Martin Knudsen,
typically known as the Hertz-Knudsen equation [158]. It is derived from the kinetic theory of gases
assuming an equilibrium distribution of molecular velocity, and in its original form the dimensionless
coefficient α is equal to 1.
𝑑𝑚𝑖𝑐𝑒
𝑑𝑡= 𝛼 𝐴𝑠𝑢𝑟𝑓𝑎𝑐𝑒 √
𝑀𝑊
2𝜋𝑅𝑇(𝑝𝑠𝑎𝑡 − 𝑝) (4.1)
The difference of pressure between the vapour pressure (p) above the sublimation surface and the
pressure (psat) corresponding to the phase equilibrium at the product temperature (T), will determine the
sublimation/condensation rate. Sublimation takes place when ∆p < 0 and condensation when ∆p > 0. The
saturation pressure will be determined by the Clausius-Clapeyron equation and it will be dependent on
the product temperature.
𝑙𝑛𝑝𝑠𝑎𝑡
𝑝𝑡𝑟
= −∆𝐻𝑠𝑢𝑏𝑙
𝑅(
1
𝑇𝑝𝑟𝑜𝑑
−1
𝑇𝑡𝑟
) (4.2)

Drying of a Single Particle | 53
4.1.2 Water Vapour Transport
Three different types of flow are generally encountered in vacuum technology: bulk or continuous flow,
molecular flow and Knudsen flow. The Knudsen number (Kn) is the dimensionless parameter that defines
the type of flow studied. This parameter is defined by Equation (2.1) as the ratio between the molecular
mean free path (λ) and the characteristic length (de) of the channel through which the gas is flowing.
Equation (4.4) defines the molecular mean free path and it is estimated from the kinetic theory of gases.
𝐾𝑛 =𝜆
𝑑𝑒
(4.3)
𝜆 = 3.2𝜇
𝑃(
𝑅𝑇
2𝜋𝑀𝑤
)0.5
(4.4)
During primary drying four different mass transfer mechanisms are involved: 1) Darcy diffusion, 2) bulk
flow, 3) Knudsen flow, and 4) slip flow [159]. Darcy flow occurs due to the existence of a gradient in total
pressure. Bulk and Knudsen flow occur due to a partial water vapour pressure gradient. The value of Kn
determines if the flow is defined by bulk or Knudsen flow. The mass transport due to slip flow is
characterized by non-equilibrium effects (slip velocity and temperature jump) near the walls but
continuum within the fluid bulk [160]. This phenomenon is relatively small when compared to the other
three mechanisms, and therefore it will be disregarded in this study.
4.1.2.1 Mass transfer under normal molar motion
When the mean free path is much smaller than the characteristic dimension of the channel (Kn < 0.01),
the flow is viscous. This will occur mainly in the high-pressure range of the lyophilisation process since
the collision among gas molecules occurs more frequently than collisions between gas molecules and the
channel walls.
Fick’s law determines the mass flux through the dried cake due to gradients in the molar fractions. The
mass flux will only depend on bulk diffusion.
𝑁𝑤𝐷 = −
𝐷𝑏𝑢𝑙𝑘
𝑅∇ (
𝑝𝑤
𝑇) ≈ −
𝐷𝑏𝑢𝑙𝑘
𝑅∇𝑝𝑤 (4.5)
The bulk diffusion coefficient Dbulk can be described by Equation (4.6) [159].
𝐷𝑏𝑢𝑙𝑘 = 1.882 × 10⁻²²𝑇3/2 [
𝑀𝑊 + 𝑀𝐴𝑖𝑟
𝑀𝑊𝑀𝐴𝑖𝑟]
1/2
𝑃𝜎𝑊,𝐴𝑖𝑟2 𝛺𝐷
(4.6)
ΩD denotes the “collision integral”, a dimensionless function of kBT/εW,Air, where εW,Air is the characteristic
energy of interaction between the molecules and kB is the Boltzmann constant.

54 | Chapter 4
The Hagen-Poiseuille law or Darcy’s law determines the mass flux caused by viscous flow due to the
existence of a pressure gradient.
𝑁𝑤𝑣 = −
𝑟𝑒2
8𝜇𝜌𝑤∇𝑃 = −
𝑟𝑒2
8𝜇
𝑝𝑤
𝑅𝑇∇𝑃 = −
𝑐0
𝑅𝑇𝑝𝑤∇𝑃 (4.7)
When a total pressure gradient exists, the overall mass flux under normal molar motion includes both the
contributions from diffusion due to a molar fraction gradient and from viscous flow due to the total
pressure gradient.
𝑁𝑤 = 𝑁𝑤𝐷 + 𝑁𝑤
𝑣 = −𝐷𝑏𝑢𝑙𝑘
𝑅𝑇∇𝑝𝑤 −
𝑐0
𝑅𝑇𝑝𝑤∇𝑃 (4.8)
4.1.2.2 Mass transfer under molecular motion
At low pressures the mean free path is larger in comparison to the characteristic dimension de (Kn>1),
therefore mass transfer is limited by molecular collisions with the channel walls. Flow at large Knudsen
numbers is therefore called free-molecule flow, or Knudsen flow. In this regime the gas moves only under
the influence of the thermal motion of the molecules and neither laminar nor turbulent flows can be
formed. The total flux is controlled by Knudsen diffusion.
𝑁𝑤𝐾 = −
8
3√
1
2𝜋𝑅𝑀𝑤𝑇𝑟𝑒∇𝑝𝑤 = −
𝐷𝐾𝑛
𝑅𝑇∇𝑝𝑤 (4.9)
DKn is the Knudsen diffusivity and can be determined by the following equation if the particle sizes are
known [161].
𝐷𝐾𝑛 =2
3× 𝑟𝑒 × (
8𝑅𝑇
𝜋𝑀𝑊
)1/2
(4.10)
4.1.2.3 Mass transfer in the transition range
The transition from viscous flow to Knudsen flow occurs at intermediate values of the Knudsen number
(0.01 < Kn < 1). Both collisions between the gas molecules and the channel walls and among gas
molecules influence the flow characteristics [162]. Therefore, in this range the overall mass transfer
coefficient is given by the sum of both molar and molecular mass transfer coefficients [163].The overall
diffusivity can be approximated by the Bonsaquet’s formula given in Equation (4.11).
𝐷 = (𝐷𝑏𝑢𝑙𝑘−1 + 𝐷𝐾𝑛
−1)−1 (4.11)

Drying of a Single Particle | 55
𝐷𝑏𝑢𝑙𝑘 =1
3∙ 𝜆 ∙ �̅� (4.12)
𝐷𝐾𝑛 =1
3∙ 𝑙 ∙ �̅� (4.13)
where 𝜆 is the mean free path and 𝑙 is the characteristic length of the porous medium, typically the pore
diameter. �̅� is the mean thermal velocity of a gas and it is given by Equation (4.14).
�̅� = √8𝑅𝑇
𝜋𝑀𝑤
(4.14)
4.2 Experimental Work
Freeze-drying microscopy (FDM) or lyomicroscopy is a common method for characterization of
formulations at laboratory scale. The most common use of FDM is the estimation of collapse temperature,
however, recently, different applications can be found in literature. Zhai et al. (2003) have developed a
method for the description of mass transfer during primary drying through FDM studies [156]. Measured
drying rates were modelled by an effective diffusion coefficient (DK,eff). Borgognoni et al. (2012) studied
the sublimation rate of bovine pericardium by determining the velocity of the moving sublimation front
[164]. Raman (2015) investigated the sublimation kinetics of lactose and coffee samples [165].
X-ray microcomputed tomography (µ-CT) is a non-destructive and non-invasive technique that has, in the
past years, become a common method for the evaluation of the physical structure of products. Its main
applications are microstructural characterization and quantification and visualization of pore structure and
size distribution [129], [166], [167]. Furthermore, Pisano et al. (2017) coupled 3D X-ray microcomputed
tomography with mathematical modelling in order to estimate the resistance of the dried layer to water
vapour mass transfer [168].
This section describes the developed experimental work to study the effect of solid content, freezing rate
and annealing on product morphology. Annealing is an optional process step during freezing where the
temperature of the substance is raised to a sub-freezing point for a defined period of time and then
returns to the freezing temperature. This process intends to decrease the drying time by increasing the
size of the ice crystals.

56 | Chapter 4
4.2.1 Methodology
4.2.1.1 Sample Preparation
Maltodextrin solution (DE 10-14 from medesign I.C. GmbH) was used as a model system. Maltodextrin
solutions (5, 10 and 20% w/w) were prepared by using bi-distilled water. A sample of 10 μl was loaded on
a silver block. Four different cooling profiles (slow cooling, fast cooling, Annealing I, Annealing II) were
investigated which resulted in 6 different samples. The characteristics of the different samples are shown
in Table 4.1.
Table 4.1 – Experimental conditions for sample preparation (concentration, cooling rate and annealing).
Concentration [%] Cooling Rate [°C/min] Annealing
Sample 1 5 0.5
Sample 2 10 0.5
Sample 3 10 20
Sample 4 10 20 Annealing I:
- 5 °C for 180 min
Sample 5 10 20 Annealing II:
- 10 °C for 90 min
Sample 6 20 0.5
4.2.1.2 Freeze-Drying Microscope
Experiments were conducted in a freeze-drying microscope in order to study sublimation kinetics of a
single particle. The experimental arrangement consists of an Olympus BX51 polarized light microscope
(Olympus Microscopy, Essex, UK) with a Linkam FDCS196 freeze-drying cryostage (Linkam Instruments,
Tadworth, UK) coupled to a Pixelink PL-A662 camera (Pixelink, Rochester, USA) and it is shown in
Figure 4.2. The used vacuum pump was an Edwards rotary vane pump E2M1.5 (Edwards, Burgess Hill,
UK). The pressure was measured by a Pirani gauge controlled via a mechanically adjustable fine-
regulating needle valve.

Drying of a Single Particle | 57
Figure 4.2 – Freeze-drying microscope setup. (a) 1. Olympus BX51 microscope, 2. Linkam FDCS196 variable temperature cryostage, 3. Pixelink PL-A662 camera, 4. Liquid nitrogen container, 5. Vacuum pump, 6. Pirani gauge, 7. Liquid nitrogen pump, 8. Temperature controller. (b) Graphic representation of the sample loader
on the freeze-drying microscope.
A cylindrical sample was prepared by placing a 15 mm diameter quartz glass crucible covered with a
glass coverslip (13 mm diameter, 0.17 mm thickness) onto a temperature-controlled silver block in the
stage. A shim spacer (690 μm) was placed in between the coverslip and the crucible to achieve a uniform
thickness. 10 μl of sample were loaded, forming a cylindrical disk with a diameter of 4.3 mm and a height
of 690 μm. Silicone oil was used to reach good thermal contact between the silver block and the bottom
of the lower coverslip.
The temperature of the silver block was controlled by a combination of liquid nitrogen cooling and
electrical heating within the block. The temperature profile was set via the software Linksys 32 (Linkam
Instruments, Tadworth, UK). Liquid nitrogen was drawn from the thermos container into the stage by
means of a pump integrated in the cooling control unit. Temperature was measured using a Pt100
temperature sensor from Linkam Instruments (accuracy ± 0.1 °C). The nitrogen vapour supply also
functioned as a condenser within the drying chamber.
After placing the liquid sample onto the quartz crucible of the cryostage, the stage was sealed and all
samples were cooled to -50°C at a defined cooling rate. Two different cooling rates were investigated:
0.5 °C/min and 20 °C/min (Table 4.2). Furthermore, two annealing treatments were investigated: in
Annealing I the sample was heated to -5 °C after freezing for 180 min and cooled back to -50 °C, and in
Annealing II the sample was heated to -10 °C for 90 min after freezing and cooled back to -50 °C (Table
4.2). The subsequent drying step was carried out with constant drying conditions with a shelf temperature
of -18 °C and a pressure of 10 Pa. To evaluate the drying front, a picture was taken every 10 s during
primary drying. As soon as primary drying was finished, which was determined by the disappearance of
the drying front, the silver block was heated to 30 °C and the secondary drying was carried out overnight
until a final water content of approximately 2% was achieved. The secondary drying was carried out to get
a stable sample that can be used for further investigations. The samples were then carefully taken out of
the cryostage and stored in a desiccator until further evaluation of the dry pore structure by µ-CT.
(a) (b)

58 | Chapter 4
The drying front was observed by a change in brightness as shown in Figure 4.3. The dry part appears
much darker than the frozen part due to stronger light scattering. The evaluation of the drying rate is
described in Section 4.2.1.4.
Figure 4.3 – Picture of the drying process performed on a lyomicroscope.. The dark colour corresponds to the dry part of the product and the light colour to the frozen product.
4.2.1.3 X-ray µ-computed tomography measurements & Image analysis
Three-dimensional X-ray μ-CT scans were performed using the XCT1600 system from Nordson Matrix
Technologies GmbH (Feldkirchen, Germany). The cylindrical freeze-dried cakes from the FDM were cut
with a razor knife to prepare cuboid pieces (2 x 2 x 2 mm). The samples were scanned in at atmospheric
conditions and the imaging system was adjusted to operate at a tube voltage of 60 kV and current
intensity of 20 μA. X-ray shadow images were acquired with a pixel resolution of 1 μm and 2000
projections with an exposure time of 4487 ms resulting in a total scanning of 160 min. The obtained
images were reconstructed into a series of 2-D images using the CERA Xplorer software (Siemens
Healthcare GmbH, Erlangen). The resulting 3-D images consisted of more than 2000 slices encoded in
16-bit precision.
For quantitative evaluation of pore size, image processing and analysis were done with the software
Modular Algorithms for Volume Images (MAVI) from Fraunhofer ITWM (Fraunhofer Institute for Industrial
Mathematics, Kaiserslautern, Germany) and GeoDict (Math2Market GmbH, Kaiserslautern, Germany).
Figure 4.4 shows part of the image analysis steps performed with MAVI. First, the original data set was
cropped into three cubic sub-volumes of 400x400x400 voxels equivalent to 400x400x400 μm3 ( Figure 4.4
a)). Afterwards, a global threshold was defined to separate pores and solid. For simplicity, the global
threshold was adjusted to the water content in the solutions; i.e. 0.8 for the 20% solution, 0.9 for the 10%
solution and 0.95 for the 5% solution. After transformation of the greyscale into binary images (Figure 4.4
b)), a Euclidean distance transformation was carried out, which created a distance map by assigning
each background voxel a grey value based on the distance to the closest foreground voxel (Figure 4.4
c)). Thereby, local minima were identified. To avoid over-segmentation of pore structure, h-minima
transformation was then performed with a global value of h = 10. This value was chosen by comparison of

Drying of a Single Particle | 59
the results with the two-dimensional ice-crystal structure (results not showed in this thesis). Subsequently,
the individual pores were segmented using the watershed segmentation method. All remaining regional
minima served as water sources for the flooding. The lines where water from different basins met were
identified as the watershed lines. Separated cells were produced from the logical difference between the
watershed lines and the initial binary image (Figure 4.4 d)). Finally, the object features tool of MAVI was
used to obtain the volume of the individual pores. The equivalent pore diameter values were determined
by calculating the diameters of spheres corresponding to the pore volumes. Therefore the equivalent
diameter xv of a sphere with the same volume was determined.
Figure 4.4 – Performed steps for image analysis with MAVI: a) 3D image of cubic sub-volumes of 400x400x400 voxels, b) binarized image, c) distance map after Euclidean distance transform, and d) watershed image.
4.2.1.4 Evaluation of drying rate from lyomicroscopic measurements
After holding the sample at -50°C for 15 min the pressure was decreased to 10 Pa by a rotary vane
pump. Then the samples were heated to -18 °C at a rate of 3 °C/min. Due to the discoidal geometry of the
sample, the drying proceeded in the radial direction. As the dried part of the sample appears much darker
than the frozen part, the radial drying front can be easily visualized (Figure 4.3). The drying front was
measured at three positions for each time step with the help of Linksys 32 (Linkam Instruments,
Tadworth, UK). Figure 4.5 shows the measuring method. The distance between the edge of the sample
(R0) and the drying front over time r(t) was measured at three positions every minute. From the movement
of the drying front r the drying rate was calculated according to Equation (4.15). The primary drying time
(t) was determined from lyomicroscopic measurements for r = R0.
𝑑𝑚
𝑑𝑡=
𝜌𝑖𝑐𝑒 ∙ 2𝜋𝑟(𝑡) ∙ ℎ ∙ 𝜃 ∙ ∆𝑟
∆𝑡 (4.15)

60 | Chapter 4
Figure 4.5 – (a) Freeze-dried sample on a lyomicroscope. Measurements of ∆r and R0-r are represented. (b) Schematic representation of the primary drying process on a lyomicroscope. ∆r is the incremental thickness of the dried cake over a small interval ∆t, r is the radius of the frozen mass and R0 is the radius of the original sample.
4.2.2 Results and Discussion
4.2.2.1 Morphology of dried cake
The composition of the product and the freezing step will determine the morphology of the product which
will have a great effect on the drying behaviour. Therefore, it is of major importance to investigate and
establish the relation between product morphology and drying behaviour. Parameters like porosity,
average pore size, pore size distribution and tortuosity have a high impact on the effective diffusivity and
consequently on the drying time.
Porosity is the volume of void or gas to the total volume (Vvoid/Vtotal), meaning that higher values of
porosity correspond to dried products with low density, which facilitates the movement of vapour [169].
Pore size and pore size distribution determine the pattern of internal water transport over the course of
the drying process. Therefore, larger pores will ease the mass transport across the porous media [169].
Tortuosity is the ratio between the straight distance connecting two points and the actual path length
inside the porous medium, hence lower values of tortuosity are preferable in order to have higher
diffusivity.
In the present study the product morphology of maltodextrin samples freeze-dried on a FDM have been
analysed by µ-CT scans. Table 4.2 shows the estimated values of average porosity, pore size diameter
and tortuosity.
It was found that solid concentration has a large impact on ice crystal size, which is in agreement with the
study made by Flores and Goff (1999) which showed decreasing ice crystals with increasing solid
concentration for ice cream [170]. The smallest pores were observed for a solid concentration of 20%
(Sample 6) and the largest pores for 5% solid concentration (Sample 1).
(a) (b)
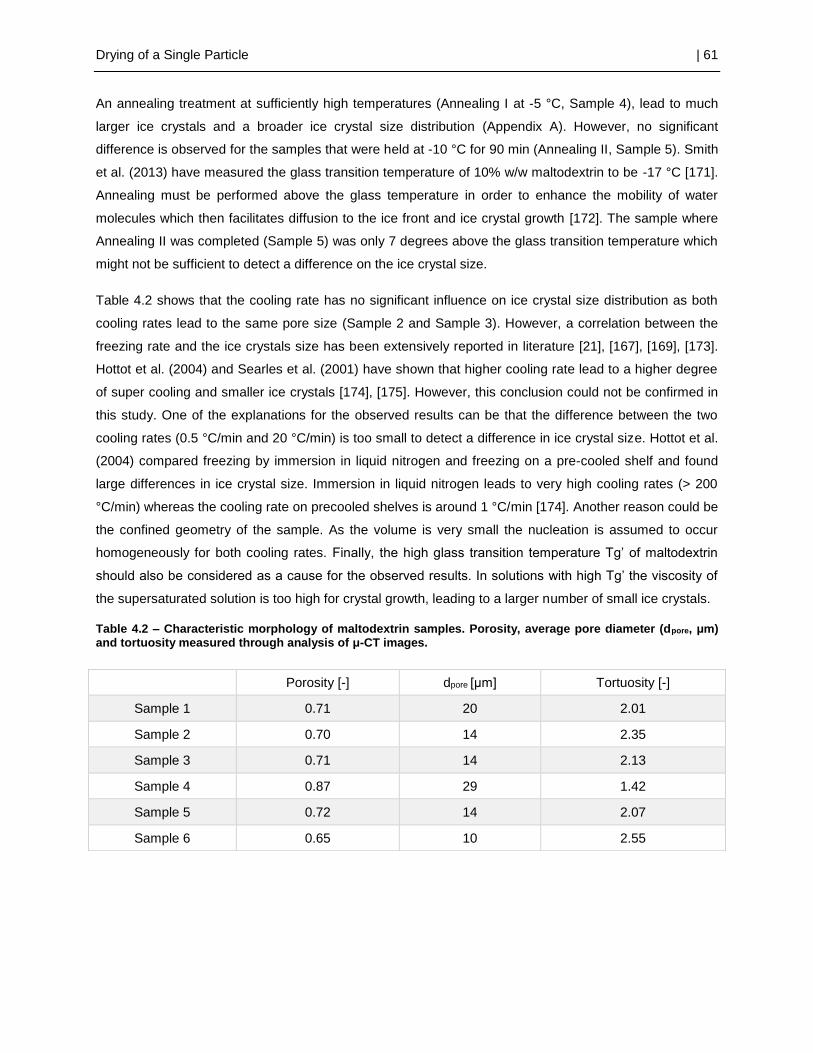
Drying of a Single Particle | 61
An annealing treatment at sufficiently high temperatures (Annealing I at -5 °C, Sample 4), lead to much
larger ice crystals and a broader ice crystal size distribution (Appendix A). However, no significant
difference is observed for the samples that were held at -10 °C for 90 min (Annealing II, Sample 5). Smith
et al. (2013) have measured the glass transition temperature of 10% w/w maltodextrin to be -17 °C [171].
Annealing must be performed above the glass temperature in order to enhance the mobility of water
molecules which then facilitates diffusion to the ice front and ice crystal growth [172]. The sample where
Annealing II was completed (Sample 5) was only 7 degrees above the glass transition temperature which
might not be sufficient to detect a difference on the ice crystal size.
Table 4.2 shows that the cooling rate has no significant influence on ice crystal size distribution as both
cooling rates lead to the same pore size (Sample 2 and Sample 3). However, a correlation between the
freezing rate and the ice crystals size has been extensively reported in literature [21], [167], [169], [173].
Hottot et al. (2004) and Searles et al. (2001) have shown that higher cooling rate lead to a higher degree
of super cooling and smaller ice crystals [174], [175]. However, this conclusion could not be confirmed in
this study. One of the explanations for the observed results can be that the difference between the two
cooling rates (0.5 °C/min and 20 °C/min) is too small to detect a difference in ice crystal size. Hottot et al.
(2004) compared freezing by immersion in liquid nitrogen and freezing on a pre-cooled shelf and found
large differences in ice crystal size. Immersion in liquid nitrogen leads to very high cooling rates (> 200
°C/min) whereas the cooling rate on precooled shelves is around 1 °C/min [174]. Another reason could be
the confined geometry of the sample. As the volume is very small the nucleation is assumed to occur
homogeneously for both cooling rates. Finally, the high glass transition temperature Tg’ of maltodextrin
should also be considered as a cause for the observed results. In solutions with high Tg’ the viscosity of
the supersaturated solution is too high for crystal growth, leading to a larger number of small ice crystals.
Table 4.2 – Characteristic morphology of maltodextrin samples. Porosity, average pore diameter (dpore, μm) and tortuosity measured through analysis of μ-CT images.
Porosity [-] dpore [μm] Tortuosity [-]
Sample 1 0.71 20 2.01
Sample 2 0.70 14 2.35
Sample 3 0.71 14 2.13
Sample 4 0.87 29 1.42
Sample 5 0.72 14 2.07
Sample 6 0.65 10 2.55

62 | Chapter 4
4.2.2.2 Drying Rates and Drying Time
For all samples, the drying rate during primary drying was measured for constant process conditions.
Figure 4.6 shows that the drying rate is increasing up to a maximum value and then steadily decreases
up to the end of the drying process. The samples that show the highest maximum drying rate also exhibit
the shortest primary drying times. The observed drying curves are characteristic for freeze drying. They
are characterized by an increase in drying rate for the first 10 minutes followed by a steady decrease until
the end of primary drying. The initial increase is due to heating of the system, and the decrease is caused
by an increase in mass transfer resistance due to the increasing dry layer thickness.
Comparing the drying rates with the average pore size presented in the previous section (Table 4.2), it is
shown that the samples with the smallest pore size (20% solid concentration and 20 °C/min cooling rate)
lead to the lowest maximum drying rate and the highest drying time and vice versa. This relationship is
shown in Figure 4.6. The shortest drying time was 18.5 min for the sample with Annealing I, the largest
drying time was 165.3 min for the sample with 20 % solid concentration. The variation in drying time for a
fixed composition and solid concentration of 10% was between 18.5 min for Annealing I and 76.7 min for
a cooling rate of 20 °C/min. This means that the drying time can be reduced by a factor of four with an
adequate annealing treatment.

Drying of a Single Particle | 63
Figure 4.6 – Sublimation rate per drying time for different maltodextrin samples. (a) Samples with different maltodextrin concentrations: 5% w/w (Sample 1), 10% w/w (Sample 2) and 20% w/w (Sample 6). (b) 10% w/w maltodextrin samples frozen with different cooling rates: 0.5 °C/min (Sample 2) and 20.0 °C/min (Sample 3). (c) 10% w/w maltodextrin solution with different annealing conditions: without Annealing (Sample 3), Annealing I (Sample 4) and Annealing II (Sample 5). The error bars indicate the standard deviation obtained
from triplicate experiments.
4.2.2.3 Estimation of Effective Diffusivity (Deff)
Diffusion mechanisms are present at different stages of drying, and their relevance depends on drying
conditions, pore geometry, pore topology and the composition of the sample [169]. Section 4.1 described
the different mass transfer phenomena in porous materials.
Freeze-drying processes take place at low working pressures, characterized by few intermolecular
collisions. The molecular free path of water vapour is inversely proportional to pressure, resulting in
higher values when the working pressure is lower. In the previous section of the thesis average pore
diameters of the different samples were calculated (Table 4.2). Small average pore diameters combined
with high values of molecular free path result in large Knudsen numbers, meaning that the flow inside a
particle is characterized by Knudsen flow.
(a) (b)
(c)
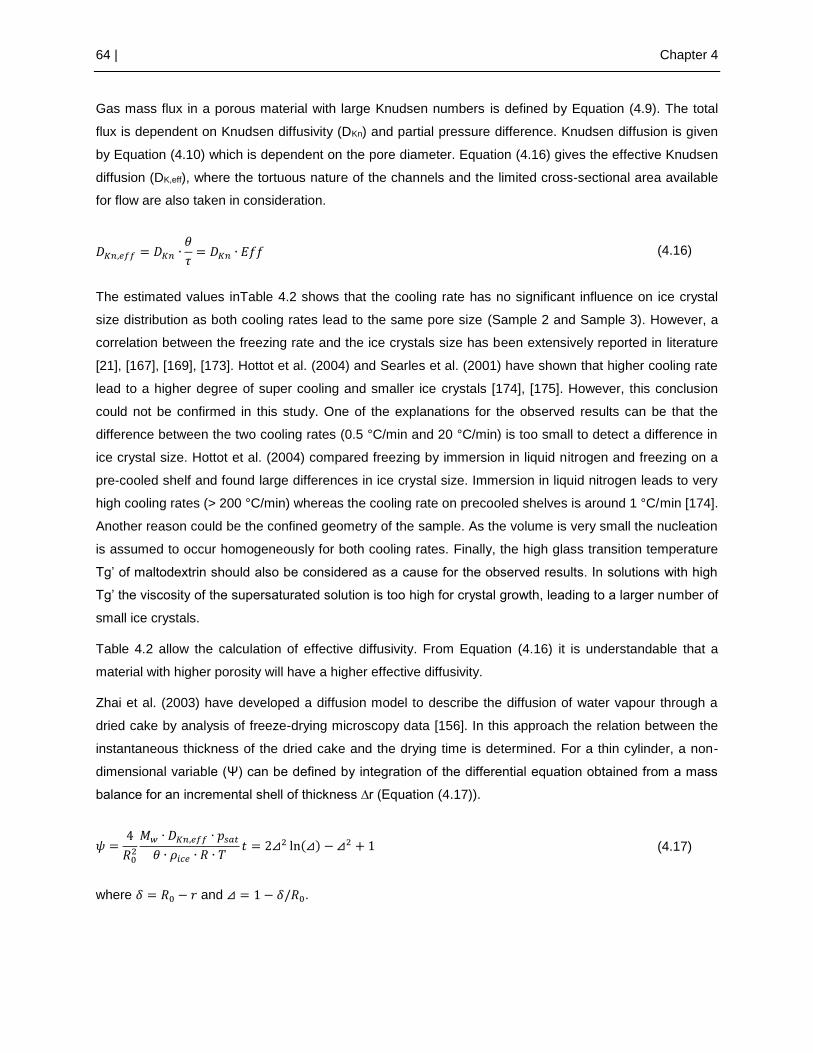
64 | Chapter 4
Gas mass flux in a porous material with large Knudsen numbers is defined by Equation (4.9). The total
flux is dependent on Knudsen diffusivity (DKn) and partial pressure difference. Knudsen diffusion is given
by Equation (4.10) which is dependent on the pore diameter. Equation (4.16) gives the effective Knudsen
diffusion (DK,eff), where the tortuous nature of the channels and the limited cross-sectional area available
for flow are also taken in consideration.
The estimated values inTable 4.2 shows that the cooling rate has no significant influence on ice crystal
size distribution as both cooling rates lead to the same pore size (Sample 2 and Sample 3). However, a
correlation between the freezing rate and the ice crystals size has been extensively reported in literature
[21], [167], [169], [173]. Hottot et al. (2004) and Searles et al. (2001) have shown that higher cooling rate
lead to a higher degree of super cooling and smaller ice crystals [174], [175]. However, this conclusion
could not be confirmed in this study. One of the explanations for the observed results can be that the
difference between the two cooling rates (0.5 °C/min and 20 °C/min) is too small to detect a difference in
ice crystal size. Hottot et al. (2004) compared freezing by immersion in liquid nitrogen and freezing on a
pre-cooled shelf and found large differences in ice crystal size. Immersion in liquid nitrogen leads to very
high cooling rates (> 200 °C/min) whereas the cooling rate on precooled shelves is around 1 °C/min [174].
Another reason could be the confined geometry of the sample. As the volume is very small the nucleation
is assumed to occur homogeneously for both cooling rates. Finally, the high glass transition temperature
Tg’ of maltodextrin should also be considered as a cause for the observed results. In solutions with high
Tg’ the viscosity of the supersaturated solution is too high for crystal growth, leading to a larger number of
small ice crystals.
Table 4.2 allow the calculation of effective diffusivity. From Equation (4.16) it is understandable that a
material with higher porosity will have a higher effective diffusivity.
Zhai et al. (2003) have developed a diffusion model to describe the diffusion of water vapour through a
dried cake by analysis of freeze-drying microscopy data [156]. In this approach the relation between the
instantaneous thickness of the dried cake and the drying time is determined. For a thin cylinder, a non-
dimensional variable (Ψ) can be defined by integration of the differential equation obtained from a mass
balance for an incremental shell of thickness ∆r (Equation (4.17)).
where 𝛿 = 𝑅0 − 𝑟 and ⊿ = 1 − 𝛿/𝑅0.
𝐷𝐾𝑛,𝑒𝑓𝑓 = 𝐷𝐾𝑛 ∙𝜃
𝜏= 𝐷𝐾𝑛 ∙ 𝐸𝑓𝑓 (4.16)
𝜓 =4
𝑅02
𝑀𝑤 ∙ 𝐷𝐾𝑛,𝑒𝑓𝑓 ∙ 𝑝𝑠𝑎𝑡
𝜃 ∙ 𝜌𝑖𝑐𝑒 ∙ 𝑅 ∙ 𝑇𝑡 = 2⊿2 ln(⊿) − ⊿2 + 1 (4.17)

Drying of a Single Particle | 65
Furthermore, the drying time for primary drying can be calculated through Equation (4.18) which is based
on the stationary diffusion equation for cylindrical geometry according to Zhai et al. (2003) [156].
Figure 4.7 shows the relationship between the effective diffusion coefficient and the average pore
diameter. The two different methods to calculate DKn,eff explained previously are represented in Figure
4.7: 1) the method developed by Zhai et al. (2003) [156]; and, 2) the method that uses the morphological
characteristics of the product (Table 4.2) and Equation (4.16), which will from now be denominated Dry
Matter Characterization Method. The effective moisture diffusivity is greatly influenced by the
microstructure and porosity of the material as proven by other authors [169], [176]–[178]. Figure 4.7
follows studies from Baik and Marcotte (2003) showing that an increase in porosity, along with more open
pore structure, increases the effective moisture diffusion [179]. Furthermore, a good agreement between
the two methods is observed. A higher discrepancy between values obtained with both methods is
observed when the average pore diameter increases. After further investigation it was noticed that when
the average pore size increases, also the pore size distribution becomes broader [180]. Therefore, when
the average pore diameter increases it becomes less accurate to use the average pore diameter as an
approximation for calculating the Dk,eff. This observation is in agreement with the study made by
Prachayawarakorn et al. (2008) showing the effect of pore size distribution on transport properties [177].
This study concluded that the effective diffusivity decreases when σ/µ increases, where σ is the standard
deviation and µ is the normal size distribution.
Figure 4.7 – Effective Knudsen diffusion (DKn,eff) vs pore diameter. The squares represent the effective Knudsen diffusion calculated through the method developed by Zhai et al. (2003) [156] and the inverted triangles represent the effective Knudsen diffusion calculated through Equation (4.16) (DKn,eff = DKn.(θ/τ))
where the morphological parameters are estimated through analysis of µ-CT images.
𝑡 = 𝑅0
2 ∙ 𝜃 ∙ 𝜌𝑖𝑐𝑒 ∙ 𝑅 ∙ 𝑇
4 ∙ 𝑀𝑤 ∙ 𝐷𝐾𝑛,𝑒𝑓𝑓 ∙ 𝑝𝑠𝑎𝑡
(4.18)

66 | Chapter 4
4.3 Model
The application of models based on computational fluid dynamics (CFD) to the chemical engineering field
has increased significantly in the past years since it leads to improved equipment design. The use of CFD
models for the freeze-drying process has been reported in the scientific literature for the characterization
of freeze-drying equipment and for the prediction of its performance [67], [105]–[109].
In this section a CFD model is presented to describe the sublimation phenomenon during the drying step
of freeze-drying. The model shows the application of CFD for the prediction of drying times of a sample
on a freeze-drying microscope. Furthermore, the model was validated with experimental data.
4.3.1 Methodology
Figure 4.8 shows the methodology developed for the setup of the CFD model. Process data like
sublimation temperature, saturation pressure, pellet size and ice fraction are model inputs. Furthermore,
effective diffusivity is also a model input. Porosity and tortuosity can either be determined through
experimental methods or be calculated through correlations developed specifically for each formulation.
Figure 4.8 – Methodology for the setup of the CFD model. DKn is the Knudsen diffusion that can be calculated through Equation (4.10). DKn,eff is the effective Knudsen diffusion which can be calculated through Equation (4.16). φ is a variable that captures the morphology of the sample (porosity, tortuosity and pore size diameter).
Equation (4.19) and Equation (4.20) correlate the pore diameter with effectivity, porosity and tortuosity.
The correlations were developed considering the morphology analysis performed on a µ-CT for
maltodextrin samples. The developed correlations for effectivity and porosity should be considered as a
mathematical parameter rather than an accurate prediction of effectivity and porosity. Furthermore, the

Drying of a Single Particle | 67
correlations are expected to be only applicable for maltodextrin and in operational conditions similar to the
investigated settings in terms of particle size and drying conditions.
4.3.2 Model Setup
The full volume of the dried cylindrical samples was simulated with the help of a 3-D mesh. Two
computational domains were allocated, a fluid domain and a porous domain respectively for the freeze-
drying microscope chamber and the sample volume. Figure 4.9 shows the simulated geometry.
Figure 4.9 – Three-dimensional drawing of the investigated geometry representing a slab on a freeze-drying
microscope. The structured hexahedral mesh is shown for both the porous region and the fluid region.
A structured hexahedral mesh for both domains was established using ANSYS ICEM CFD 17.1. The CFD
simulations were performed using a full porous model in ANSYS CFX 17.1. This model is a generalization
of the Navier-Stokes equations and of Darcy’s law, which is commonly used for flows in porous regions.
Porosity was simulated assuming that the volume porosity (γ) at a certain location is given by the ratio
between volume V’ available to fluid flow in an infinitesimal control cell surrounding the point and the
physical volume V of the cell.
Dynamic simulations were carried out for the determination of drying times. A time-varying porosity is
simulated since the porosity term is dependent on the ice fraction present in the sample. The ice fraction
was simulated as an additional scalar variable with a very low diffusion (1.10-10 m2 s-1).
𝐸𝑓𝑓 = 0.7966 − 6.5611/𝑑𝑝𝑜𝑟𝑒 (4.19)
𝜃 = 0.5862 ∙ 𝐸𝑓𝑓 + 0.5119 (4.20)
𝑉′ = 𝛾 ∙ 𝑉 (4.21)

68 | Chapter 4
The sublimation phenomenon was simulated in a subdomain in the porous domain. Mass source terms
were introduced for the water gas and the ice with opposite signs in order to simulate the sublimation
phenomenon.
4.3.3 Assumptions
For the development of the model several assumptions were considered:
1) The resistance from the edge of the slide to the chamber is negligible;
2) Isothermal conditions were assumed since the full length of the thin frozen mass is in direct
contact with the temperature controlled copper stage, thus it was assumed that the latent heat of
sublimation required by the sublimation process was balanced by the rapid heat conduction;
3) The product is assumed to be isotropic and homogenous. Furthermore, it is assumed that the
product does not change shape during sublimation;
4) The ice front is assumed to be parallel to the surface of the product and does not suffer any
deformation during the sublimation process;
5) Constant pore diameter is assumed throughout the sample.
4.3.4 Results
4.3.4.1 Validation
The model was validated against six independent experimental data sets, which were already discussed
in Section 4.2. The model is able to predict drying time, measured sublimation rate and maximum
sublimation rate. The model predicts the total drying time to be within 15% of the experimental value for 5
of the 6 evaluated conditions (Figure 4.10). Compared with the other two methods presented previously in
this work, the CFD model achieves similar accuracy. The variation in the data of both parity plots can be
attributed to uncertainty of the experimental estimation of total drying time, initial fraction ice, average
pore diameter and/or tortuosity. It is noticeable that there is an increased lack of accuracy on samples
with longer drying times and with higher sublimation rates. Samples with longer drying times are
characterized as having smaller pores, decreased values of porosity and higher values of tortuosity. It
was found by Foerst et al. (2018) that there is a high discrepancy between the measured pore diameter
𝑑𝑚𝑤𝑎𝑡𝑒𝑟 𝑣𝑎𝑝𝑜𝑢𝑟
𝑑𝑡=
𝐴𝑠𝑢𝑟𝑓𝑎𝑐𝑒
𝑉𝑠𝑢𝑟𝑓𝑎𝑐𝑒
∙ √𝑀𝑊
2 ∙ 𝜋 ∙ 𝑅𝑔𝑎𝑠 ∙ 𝑇(𝑝
𝑠𝑎𝑡− 𝑝) (4.22)
𝑑𝑚𝑖𝑐𝑒
𝑑𝑡= −
𝐴𝑠𝑢𝑟𝑓𝑎𝑐𝑒
𝑉𝑠𝑢𝑟𝑓𝑎𝑐𝑒
∙ √𝑀𝑊
2 ∙ 𝜋 ∙ 𝑅𝑔𝑎𝑠 ∙ 𝑇(𝑝
𝑠𝑎𝑡− 𝑝) (4.23)

Drying of a Single Particle | 69
values for these samples dependent on the measurement method used (2D or a 3D method) [180].
Although the authors consider that further studies are needed, they anticipate that the shape of pores is
dependent on size and that small pores are less spherical, leading to less accuracy on the measurement
of the pore size. On the other hand, samples with higher sublimation rate are characterized by having
larger pores, increased values of porosity and lower values of tortuosity. The same authors have also
shown that for samples that have undergone annealing (leading to decreased drying time) there is a
broader distribution of pore size. Therefore, in both cases, it is inaccurate to consider the average pore
diameter as constant to the entire sample which leads to a higher discrepancy between the model and
the experimental data.
Figure 4.10 – Parity plot of experimentally obtained and calculated/simulated (a) drying time and (b) maximum sublimation rate. The dashed lines indicate the ± 15 % and ± 30 % deviation.
The variation of sublimation rate with time is also predicted by the model. When compared with the
experimental data it is observed that the model overestimates the sublimation rate after the maximum
sublimation rate has been reached (Figure 4.11). Once more, this might be due to the assumption of
constant porosity, pore diameter, pore size distribution and tortuosity along the sample. Through further
investigation of the morphology of the sample it was possible to verify that this assumption is not correct.
The sample will have smaller pores in the inner part which will increase the resistance to drying over time.
Furthermore, the measurements were done in the upper part of the samples, meaning that the average
morphology parameters used in the model are based on local measurements.
(a) (b)

70 | Chapter 4
Figure 4.11 - Sublimation rate per drying time for different maltodextrin samples. The points relate to the experimental data and the lines to the data simulated by the CFD model. (a) Samples with different maltodextrin concentrations: 5% w/w (Sample 1), 10% w/w (Sample 2) and 20% w/w (Sample 6). (b) 10% w/w maltodextrin samples frozen with different cooling rates: 0.5 °C/min (Sample 2) and 20.0 °C/min (Sample 3). (c) 10% w/w maltodextrin solution with different annealing conditions: without Annealing (Sample 3),
Annealing I (Sample 4) and Annealing II (Sample 5).
4.3.4.2 Drying Time and Sublimation Rate
A correlation exists between the drying time and the sublimation rate of a sample and its morphology. A
variable (Φ) was created that captures the morphological characteristics of a sample (tortuosity, porosity
and pore diameter) that have an effect on the effective diffusivity and therefore might change the drying
behaviour of the sample. The variable Φ represents the product between the effectivity and pore size
(Equation (4.24)). Previous studies [177], [180], [181] have correlated drying time with pore diameter.
However, in this study it has been observed that the porosity and tortuosity play an important role since
the samples were exposed to different freezing treatments, and consequently there is no correlation
between tortuosity, porosity and pore diameter.
(a) (b)
(c)

Drying of a Single Particle | 71
Figure 4.12 shows the variation of drying time and maximum sublimation rate over Φ. As expected, longer
drying times correspond to lower sublimation rates which also correspond to smaller Φ. The simulated
curves follow the methodology described in Figure 4.8 and have used the correlations described in
Equation (4.19) and Equation (4.20) since it is intended to depend the least possible on experimental
data. The accuracy of the use of these correlations could be discussed since these were based on a
small dataset and are product specific. However, when compared with the experimental results
represented in Figure 4.12 it is observed that the CFD simulations provide a good prediction, which gives
confidence in the developed model.
Figure 4.12 – Total drying time and Maximum Sublimation Rate vs Φ (dpore.(θ/τ)). The symbols represent the
experimental results and the lines the simulated results from the CFD model.
4.3.4.3 Dynamic Regime
Since the system is dynamic, the model was set up as a transient regime. Table 4.3 shows the variation
of porosity, ice fraction, water vapour and pressure for four different points in time. In the beginning the
pellet is frozen and the porosity is approximately 0 and in the end of the drying process (t ≈ 50 min) the
ice fraction will be equal to 0.
During the drying process there is an ongoing formation of pores due to the sublimation of frozen water.
Therefore, the porosity of the sample increases with time from the outside of the pellet to the inside.
Porosity will inversely increase with the decrease of the ice fraction. Frozen water will sublimate and form
water vapour at the same rate. However, as presented in Table 4.3, water vapour takes longer to leave
the pellet. The process is mainly driven by diffusion, and therefore the rate of transfer of the water vapour
from the pellet to the chamber is dependent on the effective diffusivity value. Furthermore, it is possible to
Φ = 𝑑𝑝𝑜𝑟𝑒 ∙𝜃
𝜏= 𝑑𝑝𝑜𝑟𝑒 ∙ 𝐸𝑓𝑓 (4.24)

72 | Chapter 4
observe that the pressure inside the pellet will also increase with the formation of water vapour. At the
end of the process the initial pressure will be re-established.
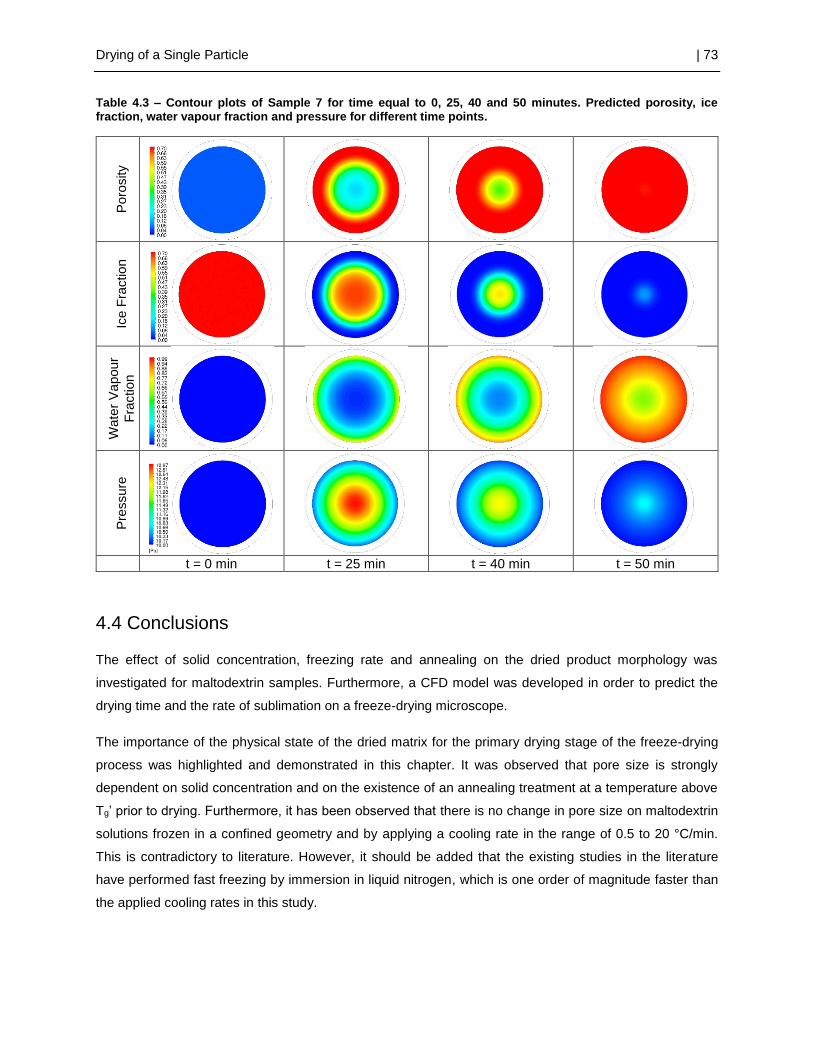
Drying of a Single Particle | 73
Table 4.3 – Contour plots of Sample 7 for time equal to 0, 25, 40 and 50 minutes. Predicted porosity, ice fraction, water vapour fraction and pressure for different time points.
Poro
sity
Ice F
ractio
n
Wate
r V
apour
Fra
ction
Pre
ssure
t = 0 min t = 25 min t = 40 min t = 50 min
4.4 Conclusions
The effect of solid concentration, freezing rate and annealing on the dried product morphology was
investigated for maltodextrin samples. Furthermore, a CFD model was developed in order to predict the
drying time and the rate of sublimation on a freeze-drying microscope.
The importance of the physical state of the dried matrix for the primary drying stage of the freeze-drying
process was highlighted and demonstrated in this chapter. It was observed that pore size is strongly
dependent on solid concentration and on the existence of an annealing treatment at a temperature above
Tg’ prior to drying. Furthermore, it has been observed that there is no change in pore size on maltodextrin
solutions frozen in a confined geometry and by applying a cooling rate in the range of 0.5 to 20 °C/min.
This is contradictory to literature. However, it should be added that the existing studies in the literature
have performed fast freezing by immersion in liquid nitrogen, which is one order of magnitude faster than
the applied cooling rates in this study.

74 | Chapter 4
Porosity, tortuosity and pore diameter were the morphological parameters studied through µ-CT image
analysis showing the applicability and the advantages of this method for predicting and better
understanding the mass transfer phenomena during primary drying. However, it has been observed that
the shape of the pores and their connectivity can probably also contribute to changes of the sublimation
rate.
The effective diffusivity was calculated through two different methods. FDM provided a rapid and visual
method for the determination of DKn,eff and the analysis of µ-CT images of dry matter provided a method
that can be applied to different kinds of samples freeze-dried in a standard freeze-drying equipment.
Larger discrepancies between the two methods were observed for larger pores since the pore size
distribution becomes broader for larger pores. DKn,eff is a critical parameter for the development of a
mathematical model describing the drying process of a frozen sample.
The developed CFD model is able to successfully predict the sublimation phenomena during drying on a
freeze-drying microscope. The model was compared with the measurements of drying time and
sublimation rate for different loadings and process conditions. It was found that while the model was able
to accurately predict the drying time and maximum sublimation rate for the majority of the samples, the
prediction of these parameters for samples with very low or very high porosities was not very accurate.
Model assumptions like constant average pore diameter might lead to these inaccuracies.
With the use of CFD calculations for a simplified setup, like a lyomicroscope, it is possible to obtain a
better and improved understanding of the phenomena occurring at the product scale. The approximation
to isothermal conditions allowed ignoring heat transfer phenomena which results in a simplified model.
Regardless of the already mentioned approximations, and in spite of the fact that the lyophilization
process takes place in a Knudsen flow regime, the simulated results are satisfactory. The assembled
model is the starting point for the development of a detailed model that couples equipment capability and
product characteristics and is able to predict drying rates, product temperature and pressure profiles of a
complete freeze-drying process.

The effect of product morphology, particle size and particle distribution on the drying process
Chapter 4 discussed the importance and influence of product morphology on the drying time behaviour
during freeze-drying. It focused largely on factors that affect the porosity (θparticle) of samples being dried,
concluding that θparticle is largely dependent on the solid concentration, the freezing rate and the
presence/absence of annealing. However, bulk freeze-drying is characterized by a bimodal pore size
distribution, meaning that both the pore size distribution inside the product (θparticle) and the pore size
distribution of the bed of particles (θbed) will have an influence on the drying behaviour. The pore structure
formed by the packed frozen particles will provide transport channels for the movement of water vapour
on the frozen region of the material being dried. Therefore, the porosity of the bed of particles (θbed)
together with the porosity of each particle (θparticle) when dried will define the space available for
movement of the water vapour. The porosity of the bed of particles (θbed) is given by Equation (3.1) and
will be dependent on the particle volume. Furthermore, it will also depend on particle shape, packing and
size distribution [182].
𝜃𝑏𝑒𝑑 = 1 −𝑉𝑝𝑒𝑙𝑙𝑒𝑡𝑠
𝑉𝑡𝑟𝑎𝑦
(5.1)
Liapis and Bruttini (2009) and Trelea et al. (2009) developed models to describe the drying process
during bulk freeze-drying [85], [117]. The main difference between the two models developed is the
studied average size of the particles, which leads to involvement of different flow regimes. Liapis and
Bruttini (2009) studied particles with a diameter in the range of 10-20 µm, assuming a sublimation front in
the slab parallel to the bottom of the tray, where all pellets situated above the front are dry and below it
they are frozen [85]. Trelea et al. (2009) studied particles with an average size of 2 mm leading to a
drying front in each particle that will move in the direction of its core. In this section, it is attempted to
show how the particle size in a stack of pellets can influence the drying profile over time [117].
Advanced approaches, like Computational Fluid Dynamics (CFD), can assist in understanding the
relationship between the morphological characteristics of a porous material and its drying behaviour, and
therefore to highlight which is the best configuration for an efficient drying process. This chapter will study
the effect of the morphological characteristics of the dried matrix of a single spherical particle and of two
case studies where single pellets are organized in larger agglomerations with different packing factors.
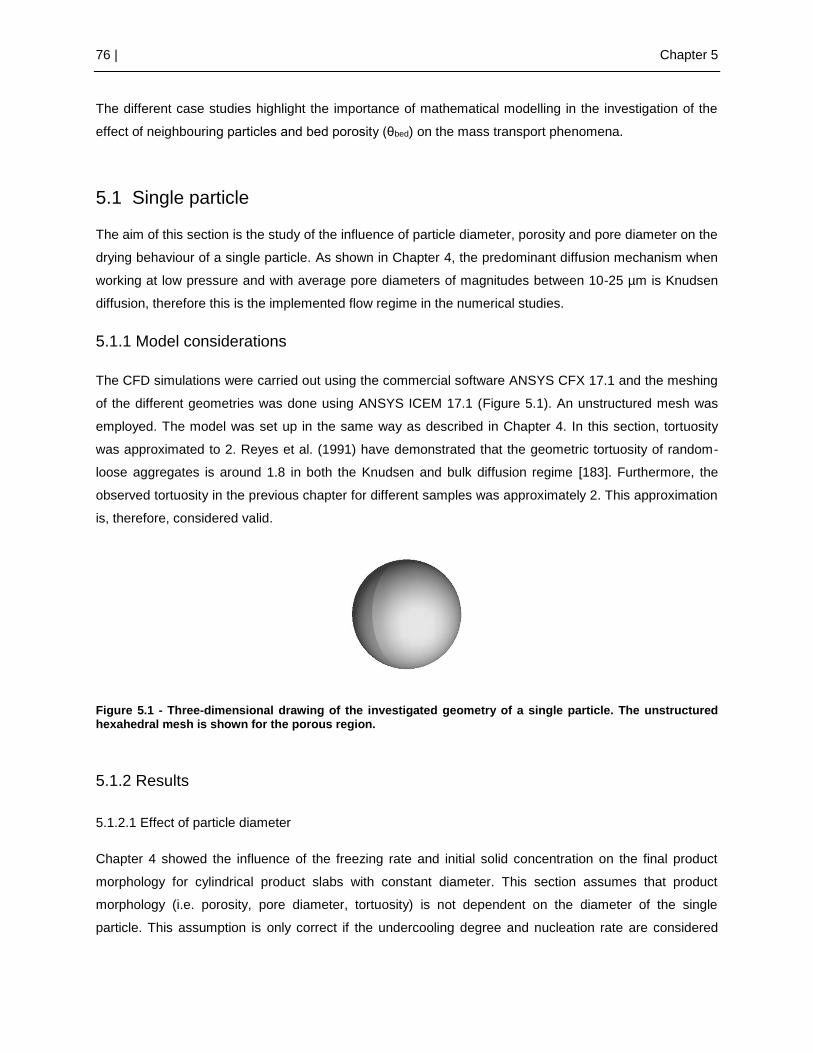
76 | Chapter 5
The different case studies highlight the importance of mathematical modelling in the investigation of the
effect of neighbouring particles and bed porosity (θbed) on the mass transport phenomena.
5.1 Single particle
The aim of this section is the study of the influence of particle diameter, porosity and pore diameter on the
drying behaviour of a single particle. As shown in Chapter 4, the predominant diffusion mechanism when
working at low pressure and with average pore diameters of magnitudes between 10-25 µm is Knudsen
diffusion, therefore this is the implemented flow regime in the numerical studies.
5.1.1 Model considerations
The CFD simulations were carried out using the commercial software ANSYS CFX 17.1 and the meshing
of the different geometries was done using ANSYS ICEM 17.1 (Figure 5.1). An unstructured mesh was
employed. The model was set up in the same way as described in Chapter 4. In this section, tortuosity
was approximated to 2. Reyes et al. (1991) have demonstrated that the geometric tortuosity of random-
loose aggregates is around 1.8 in both the Knudsen and bulk diffusion regime [183]. Furthermore, the
observed tortuosity in the previous chapter for different samples was approximately 2. This approximation
is, therefore, considered valid.
Figure 5.1 - Three-dimensional drawing of the investigated geometry of a single particle. The unstructured hexahedral mesh is shown for the porous region.
5.1.2 Results
5.1.2.1 Effect of particle diameter
Chapter 4 showed the influence of the freezing rate and initial solid concentration on the final product
morphology for cylindrical product slabs with constant diameter. This section assumes that product
morphology (i.e. porosity, pore diameter, tortuosity) is not dependent on the diameter of the single
particle. This assumption is only correct if the undercooling degree and nucleation rate are considered

The effect of product morphology, particle size and particle distribution on the drying process | 77
constant throughout the particle and independent of the particle diameter [184]. O’Brien et al. (2004) have
concluded in their studies that slower cooling rates and smaller freezing surfaces generate samples with
more homogeneous pore size distributions [185]. Therefore, the approximation represents better the
reality for particles frozen at slow cooling rates and with small diameters.
The simulated effect of particle diameter on the drying behaviour of a single spherical particle is shown in
Figure 5.2. The particle diameter does not have an influence on the effective diffusion inside the particle
since the effective diffusion is only dependent on pore size, porosity and tortuosity, which were kept
constant. However, the flux of water that sublimates over time is highly dependent on the sublimation
surface area and volume, and therefore dependent on the particle diameter. Figure 5.2 b) shows the
dependency between the sublimation rate and the particle diameter. An exponential growth of the
sublimation rate is observed when the diameter of the sphere decreases, which by other words means
that spheres with smaller diameters will dry faster.
Figure 5.2 – Simulation of the primary drying of single spherical particles with θparticle = 0.60, 𝝉𝒑𝒂𝒓𝒕𝒊𝒄𝒍𝒆= 2 and
dpore = 17 µm as a function of particle diameter (dsph). a) Shows the predicted ice fraction changing over time and b) the predicted sublimation rate.
5.1.2.2 Effect of porosity
The characteristic porosity of the dried product highly depends on the initial fraction of ice, as porosity
relates to the volume left by the ice when sublimated. Therefore, porosity of the product changes over
time during the drying process. Figure 5.3 shows the simulated effect of particle porosity on the drying
behaviour of a single spherical particle. A constant pore and particle diameter were assumed.
From Figure 5.3 a) it is possible to conclude that although samples with lower porosity have a lower
amount of ice to be sublimated they take longer to dry. Furthermore, Figure 5.3 b) shows a linear
behavior between porosity and drying time. Effective diffusion changes linearly with porosity since a
higher percentage of voids leads to an easier diffusion of the water vapour through the sample.
a) b)

78 | Chapter 5
Figure 5.3 – Simulation of the primary drying of single spherical particles with dparticle = 4.3 mm, 𝝉𝒑𝒂𝒓𝒕𝒊𝒄𝒍𝒆 = 2
and dpore = 17 µm as a function of particle porosity (θparticle). a) Shows the predicted ice fraction changing over time, and b) the predicted sublimation rate.
5.1.2.3 Effect of pore diameter
Figure 5.4 shows the simulated effect of the pore diameter on the drying behaviour of a single sphere with
constant diameter, porosity and tortuosity. As expected, in the Knudsen diffusion regime, larger pores
lead to lower drying times. Figure 5.4 b) shows a linear relation between the sublimation rate and the pore
diameter, due to the also linear relation between the pore diameter and the effective diffusion (Equation
(4.10) and (4.16)). To have a more realistic prediction of the drying profile it would be relevant to also
study the importance of the pore connectivity and pore shape (cylindrical pores are assumed in the
developed model).
Figure 5.4 – Simulation of the primary drying of single spherical particles with dparticle = 4.3 mm,τparticle= 2 and
θparticle = 0.60 as a function of pore diameter (dpore). a) Shows the predicted ice fraction changing over time and b) the predicted sublimation rate.
a) b)
a) b)

The effect of product morphology, particle size and particle distribution on the drying process | 79
5.2 Multiple Particles
The previous cases only considered the mass transport inside a single particle. In this section, it is
intended to study the effect of neighbouring particles and bed porosity on the drying behaviour. This is
illustrated in two different case studies with distinct packing factors of the bed of particles. Once again,
the importance of advanced flow dynamic models, such as CFD methods, is highlighted in this section for
achieving a better understanding of the drying behaviour during freeze-drying.
As mentioned previously, frozen particulate matter is characterized by a bimodal pore size distribution
based on the pore sizes of the inter particle and inner particle void space. Pore size distribution of the
particle bed is dependent on the particle volume, shape, packing factor and size distribution [182]. The
mean pore diameter formed by the packing of particles can be estimated from the hydraulic diameter
(Equation (5.2)) [85], [159].
𝑑𝑏𝑒𝑑,𝑝𝑜𝑟𝑒 = (1
3) (
𝜃𝑏𝑒𝑑
1 − 𝜃𝑏𝑒𝑑
) 𝑑𝑠𝑝ℎ (5.2)
Dependent on the mean pore diameter formed, the mass transport is generally characterized by a
Knudsen flow regime or a transient regime, leading to different diffusion coefficients (Figure 5.5). In the
transient regime both bulk and Knudsen diffusion mechanisms contribute, and therefore the overall
diffusivity can be approximated by the Bonsaquet’s formula given in Equation (4.16)
Figure 5.5 – Representation of an agglomerate of multiple particles with different sizes. Black represents frozen water and white the solid material. The effective diffusion will assume different values inside the particles (Deff,particle) and between the particles (Deff,bed) due to the different characteristic length.

80 | Chapter 5
5.2.1 Model considerations
Once again, the CFD simulations were carried out using the commercial software ANSYS CFX 17.1 and
the meshing of the different geometries was done using ANSYS ICEM 17.1. An unstructured mesh was
employed. Figure 5.6 shows the two different geometries from different perspectives. This study intends
to investigate the effect of the neighbouring particles and of bed porosity (θbed) on the mass transport and
on the dynamics of the fluid exiting each particle and the bed of particles.
Different packing factors were achieved by different levels of overlapping of the particles. Figure 5.6
shows that in Case B the pores between the particles are smaller due to an increased overlapping of the
particles.
Case A
Case B
Figure 5.6 - Three-dimensional mesh of the investigated geometries of multiple particles in a stack. The unstructured hexahedral meshes are shown for the porous region. Case A – Particles studied as spheres and with low packing factor. Case B - Particles studied as cylinders and with high packing factor.

The effect of product morphology, particle size and particle distribution on the drying process | 81
The model was set up considering the different diffusion mechanisms in the different porous media. The
working pressure was 10 Pa and the sublimation temperature was -42 °C. Therefore, the local diffusion
will be given by Equation (5.3).
{
Dice, for ice in the particleDeff,particle, for water vapour in the particle
Deff,bed, for water vapour between particles (5.3)
As in the previous cases the ice fraction was simulated as an additional scalar variable with a very low
diffusion (Dice = 1.10-10 m2 s-1) in comparison to the Deff,particle or Deff,bed (range). The morphology inside the
particle was considered to be equal in all particles, which leads to a constant Deff,particle. Table 5.1 shows
the characteristics of the particles considered in this study.
Table 5.1 – Morphological characteristics of the particles in the stack (dparticle, hparticle, θparticle, dpore, 𝝉𝒑𝒂𝒓𝒕𝒊𝒄𝒍𝒆,
Effparticle). The particle diameter of the particle is the only parameter that is variable. Deff,particle was calculated considering the measured characteristics of the particles.
dparticle [mm] θparticle [-] dpore [μm] τparticle [-] Effparticle [%] Deff,particle [m2/s]
4.3; 3.0; 2.0; 1.0 0.60 17.0 2.0 0.3 1.86 x 10⁻³
Dbed will depend on the diameter of the particles, bed porosity and the mean pore diameter formed from
the packing of the particles. Table 5.2 shows the morphological characteristics of the bed. The tortuosity
was assumed to be √2 as described by Liapis and Bruttini (2009) since it provides a reasonable
approximation for random porous structures whose pores have good pore connectivity [85].
Table 5.2 – Morphological characteristics of the bed (θbed, dbed,pore, 𝝉𝒃𝒆𝒅, Effbed, Deff,particle) dependent on Vparticles
and Vbed.
Case Vparticles [m3] Vbed [m3] θbed [-] dbed,pore [mm] τbed [-] Effbed [%]
A
7.45 x 10⁻⁶ 1.53 x 10⁻⁵ 0.51 1.50 √2 0.36
2.53 x 10⁻⁶ 5.18 x 10⁻⁶ 0.51 1.05 √2 0.36
7.49 x 10⁻⁷ 1.54 x 10⁻⁶ 0.51 0.70 √2 0.36
9.37 x 10⁻⁸ 1.92 x 10⁻⁷ 0.51 0.35 √2 0.36
B
8.94 x 10⁻⁶ 1.12 x 10⁻⁵ 0.20 0.36 √2 0.14
3.04 x 10⁻⁶ 3.81 x 10⁻⁶ 0.20 0.25 √2 0.14
9.00 x 10⁻⁷ 1.13 x 10⁻⁶ 0.20 0.17 √2 0.14
1.13 x 10⁻⁷ 1.41 x 10⁻⁷ 0.20 0.08 √2 0.14
The diffusion mechanism is in the transition regime if 0.01 < Kn < 1 and in the Knudsen regime if Kn > 1.
In this study it was considered that the diffusion mechanism was in the transition regime when 0.01 < Kn
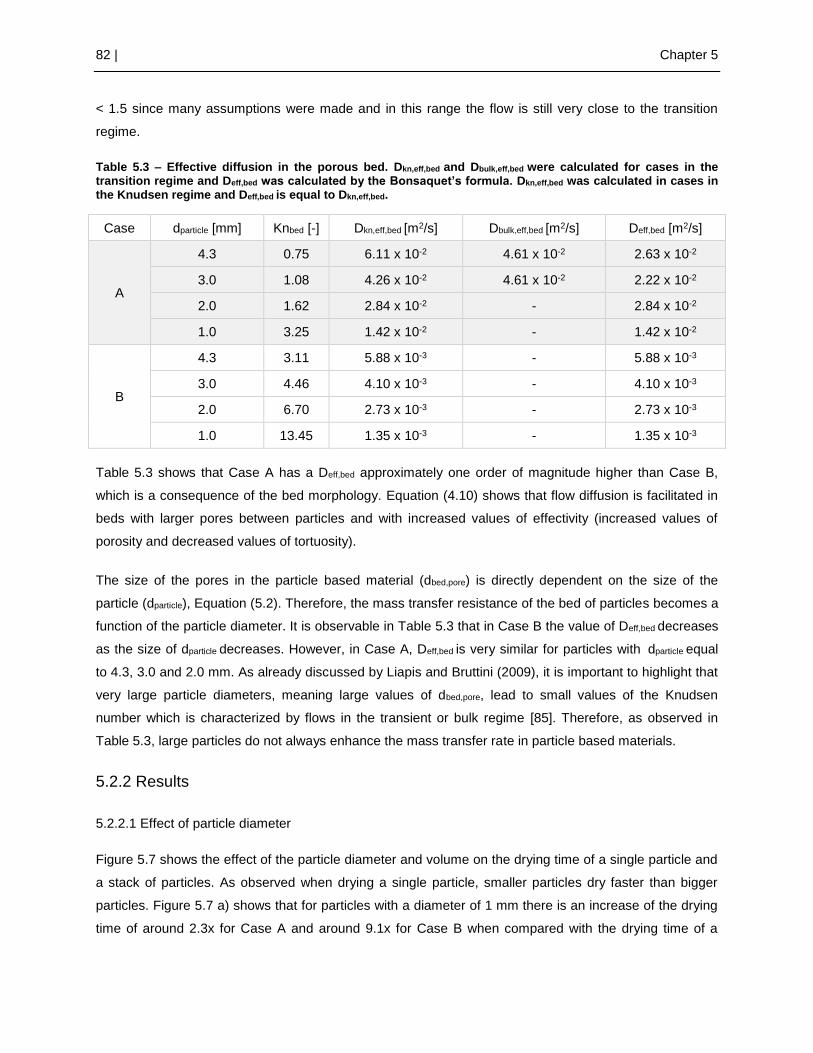
82 | Chapter 5
< 1.5 since many assumptions were made and in this range the flow is still very close to the transition
regime.
Table 5.3 – Effective diffusion in the porous bed. Dkn,eff,bed and Dbulk,eff,bed were calculated for cases in the transition regime and Deff,bed was calculated by the Bonsaquet’s formula. Dkn,eff,bed was calculated in cases in the Knudsen regime and Deff,bed is equal to Dkn,eff,bed.
Case dparticle [mm] Knbed [-] Dkn,eff,bed [m2/s] Dbulk,eff,bed [m2/s] Deff,bed [m2/s]
A
4.3 0.75 6.11 x 10⁻² 4.61 x 10⁻² 2.63 x 10⁻²
3.0 1.08 4.26 x 10⁻² 4.61 x 10⁻² 2.22 x 10⁻²
2.0 1.62 2.84 x 10⁻² - 2.84 x 10⁻²
1.0 3.25 1.42 x 10⁻² - 1.42 x 10⁻²
B
4.3 3.11 5.88 x 10⁻³ - 5.88 x 10⁻³
3.0 4.46 4.10 x 10⁻³ - 4.10 x 10⁻³
2.0 6.70 2.73 x 10⁻³ - 2.73 x 10⁻³
1.0 13.45 1.35 x 10⁻³ - 1.35 x 10⁻³
Table 5.3 shows that Case A has a Deff,bed approximately one order of magnitude higher than Case B,
which is a consequence of the bed morphology. Equation (4.10) shows that flow diffusion is facilitated in
beds with larger pores between particles and with increased values of effectivity (increased values of
porosity and decreased values of tortuosity).
The size of the pores in the particle based material (dbed,pore) is directly dependent on the size of the
particle (dparticle), Equation (5.2). Therefore, the mass transfer resistance of the bed of particles becomes a
function of the particle diameter. It is observable in Table 5.3 that in Case B the value of Deff,bed decreases
as the size of dparticle decreases. However, in Case A, Deff,bed is very similar for particles with dparticle equal
to 4.3, 3.0 and 2.0 mm. As already discussed by Liapis and Bruttini (2009), it is important to highlight that
very large particle diameters, meaning large values of dbed,pore, lead to small values of the Knudsen
number which is characterized by flows in the transient or bulk regime [85]. Therefore, as observed in
Table 5.3, large particles do not always enhance the mass transfer rate in particle based materials.
5.2.2 Results
5.2.2.1 Effect of particle diameter
Figure 5.7 shows the effect of the particle diameter and volume on the drying time of a single particle and
a stack of particles. As observed when drying a single particle, smaller particles dry faster than bigger
particles. Figure 5.7 a) shows that for particles with a diameter of 1 mm there is an increase of the drying
time of around 2.3x for Case A and around 9.1x for Case B when compared with the drying time of a

The effect of product morphology, particle size and particle distribution on the drying process | 83
single particle. Moreover, it shows that for particles with a diameter of 4.3 mm there is an increase of 1.8x
for Case A and around 6.4x for Case B. It is therefore possible to observe an increase of the drying time
due to the surrounding particles which gets steeper with the decrease of bed porosity (θbed) and the
decrease of particle diameter. Furthermore, for a single particle, when the particle size decreases from
4.3 to 3 mm, the drying time is reduced by 48%, and when the particle size decreases from 2 to 1 mm the
drying time is reduced by 68%. For the multiple particle cases, when the particle size reduces from 4.3 to
3 mm the drying time is reduced by 42% and 41%, respectively for Case A and Case B, and when the
particle size decreases from 2 to 1 mm the drying time is reduced by 57% and 64% respectively. It is
observed that Case B has a more similar drying behaviour to a single particle drying, which will be further
discussed in this section.
Figure 5.7 b) shows that for the same volume of particles an increased value of the bed porosity (θbed)
leads to increased sublimation rates. This is in good agreement with the observations made by Liapis and
Bruttini (2009) [85]. The increase of bed porosity (θbed) leads to lower mass transfer resistance which
justifies the increase of the drying rate. Thus, both Figure 5.7 a) and Figure 5.7 b) indicate that as the
value of θbed increases the value of drying time decreases, which is mainly due to the lower amount of
available frozen free water and the increase of the available free space for flow movement.
Figure 5.7 – a)Simulation of the total primary drying time as a function of particle diameter (dparticle) for a single particle, Case A and Case B. The morphological characteristics of the particles are θparticle = 0.60,
τparticle = 2 and dpore = 17 µm. b) Effect of bed porosity (θbed) on sublimation rate over total volume of particles
(Vparticles) for a stack of particles when θparticle = 0.60, τparticle = 2, dpore = 17 µm, θbed = 0.48 and τparticle=√2.
Figure 5.8 shows the existing ice fraction during the drying process of a stack of particles with a diameter
of 4.3 mm. Figure 5.8 a) and c) show a plane cut in the middle of the top layer of particles and Figure 5.8
b) and d) show a plane cut in the middle of the central layer of particles.
It is observable in Figure 5.8 a) and b) that in Case A the sublimation occurs simultaneously in all
particles and the sublimation front evolves from the exterior of the pellet to its core, which is in agreement
a) b)

84 | Chapter 5
with the observations made by Trelea et al. (2009) [117]. In Figure 5.8 c) and d) it is possible to observe a
unique sublimation front from the outside pellets to the central pellets, similar to the one observed by
Liapis and Bruttini (2009) [85]. Since dbed,pore is much smaller, the vapour pressure created by the vapour
accumulated in the pores of the bed decreases the sublimation rate. Therefore, in this case the drying
behaviour of the stack of pellets can be approximated to the drying of a single pellet as it was also
concluded through Figure 5.7.
Furthermore, in the centre of the stack (Figure 5.8 b) and d)) it is observed that the drying is slower since
there is a higher resistance to vapour transport, which creates an increase of pressure and consequently
a decrease of the sublimation rate.
Exterior Centre
a) b)

The effect of product morphology, particle size and particle distribution on the drying process | 85
Figure 5.8 – Contour plots representing the fraction of ice present in a stack of particles with a diameter of 4.3 mm after 45 min (a) and b)) and 2.9 h (c) and d)). a) and b) correspond to a stack of particles with θbed = 0.51 (Case A) and c) and d) correspond to a stack of particles with θbed = 0.20 (Case B). a) and c) correspond to the exterior layer and b) and d) to the center layer of the stack.
Figure 5.9 shows the partial pressure in Case A and in Case B. The partial pressure was measured along
a line placed in the middle of the centre layer of particles that crosses both the particles and the fluid
domain between them. In Case A, it is observed that the vapour pressure increases inside the particles
and it decreases in the free space between them. This effect is explained by Table 5.2 and Table 5.3
where it is shown that the effective diffusion in the space between the particles (Deff,bed) increases about
one order of magnitude when compared with the effective diffusion in the particles (Deff,particle), meaning
that the movement of the flow is facilitated in this location. On the contrary, in Case B, there is no
variation in the vapour pressure, which is again explained by Table 5.2 and Table 5.3. This observation
leads once more to the conclusion that stacks of particles with low bed porosity (θbed) tend to have a
behaviour similar to one single pellet.
c) d)
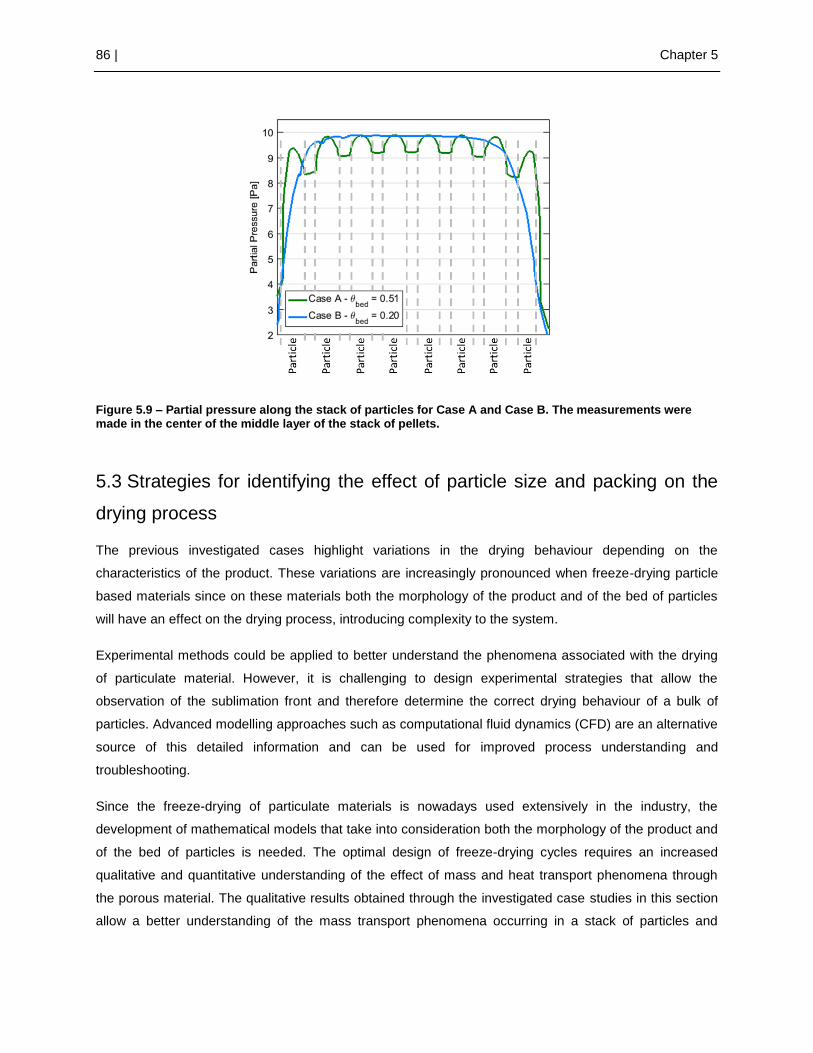
86 | Chapter 5
Figure 5.9 – Partial pressure along the stack of particles for Case A and Case B. The measurements were made in the center of the middle layer of the stack of pellets.
5.3 Strategies for identifying the effect of particle size and packing on the
drying process
The previous investigated cases highlight variations in the drying behaviour depending on the
characteristics of the product. These variations are increasingly pronounced when freeze-drying particle
based materials since on these materials both the morphology of the product and of the bed of particles
will have an effect on the drying process, introducing complexity to the system.
Experimental methods could be applied to better understand the phenomena associated with the drying
of particulate material. However, it is challenging to design experimental strategies that allow the
observation of the sublimation front and therefore determine the correct drying behaviour of a bulk of
particles. Advanced modelling approaches such as computational fluid dynamics (CFD) are an alternative
source of this detailed information and can be used for improved process understanding and
troubleshooting.
Since the freeze-drying of particulate materials is nowadays used extensively in the industry, the
development of mathematical models that take into consideration both the morphology of the product and
of the bed of particles is needed. The optimal design of freeze-drying cycles requires an increased
qualitative and quantitative understanding of the effect of mass and heat transport phenomena through
the porous material. The qualitative results obtained through the investigated case studies in this section
allow a better understanding of the mass transport phenomena occurring in a stack of particles and

The effect of product morphology, particle size and particle distribution on the drying process | 87
ensure further development of models with higher complexity. The possibility to visualize the effect of
particle diameter and packing factor is a very useful tool for process development.
5.4 Conclusions
Bulk freeze-drying is characterized by a bimodal pore size distribution, meaning that both the size of the
pores inside the product and the size of the pores that characterize the bed of particles will influence the
drying behaviour and the diffusion of vapour during sublimation. The mass transfer phenomena during
primary drying of single frozen spherical particles and of a stack of spherical particles has been
investigated using the computational fluid dynamics model developed in Chapter 4. The model has shown
the ability to satisfactorily predict the mass fluid transport inside particles with different configurations
(porosity, pore diameter and particle diameter) and in between particles.
The simulated results show that smaller average pore size, lower particle porosity and increased particle
diameter lead to decreased drying time and sublimation rates, which is in agreement with the results
found in the scientific literature.
The two different configurations of particle stacks display how bed porosity plays a key role in primary
drying. Furthermore, the dependency of the drying process on the diameter of the particles is highlighted,
since particle size has a direct influence on the mass transfer rates in particle based materials.
Although a validation with experimental data was not possible, suitable and expected drying profiles were
achieved leading to the conclusion that CFD is a viable tool for the characterization of the fluid behaviour
during primary drying of frozen samples. CFD is able to account for geometrical features and fluid
properties both inside the particles and between them. Coupling the developed model with a heat transfer
source has extensive potential for increased understanding and optimization of the freeze-drying process.


CFD Model for a Laboratory/Pilot Scale Freeze-Dryer
Freeze-drying is a process where a product is dried by removal of the present frozen water through
sublimation at low pressure and temperature [29]. Lyophilization aims at obtaining a final product with low
residual moisture without losing its structure, viability and activity. In order to maximize plant productivity
and reduce product cost, the rate of solvent removal should be maximized. Strategies to decrease the
drying time of a freeze-drying process go from changes in the process parameters (e.g. increase in
temperature) or as discussed in Chapter 4 and Chapter 5 changes in product formulation or in the
freezing process. Furthermore, the design of the equipment will also have an effect on the sublimation
rate since for example in order to avoid vapor accumulation and subsequent pressure increase in the
drying chamber, the rate of vapor production in the drying chamber has to be compatible with the
condenser capacity [10]. Moreover, when developing freeze-drying cycles for new products it is not only
important to focus on the development of the drying time but also in keeping the activity, viability and
structure of the product [186]. Therefore, a combination of equipment and product characterization with
monitoring technologies to control the residual amount of ice in the product, its temperature and
sublimation rate throughout the process, will lead to more efficient and more controlled freeze-drying
cycles [10], [125].
In the traditional approach, the design and optimization of freeze-drying cycles is usually obtained through
an extensive amount of experimental work. Alternatively, predictive models can be developed in order to
mechanistically understand scale-up issues and to develop robust freeze-drying cycles that facilitate the
transfer between equipment. Robust theoretical models which can predict product temperature and drying
time have been developed mainly for the pharmaceutical industry [74], [76], [81], [187]. However, these
models must be adapted and modified if to be used in other applications, since the accuracy of the model
is dependent on the product container. Chapter 6 intends to consider both the product and the equipment
characteristics in order to describe the drying behavior of frozen particulate matter dried in a
laboratory/pilot scale freeze-dryer. The drying flow rate has been described for particulate materials
through mathematical models for different bed porosities, packing factors and particle diameters [85],
[117]. However, it is known that the efficiency of the drying process will also be highly affected by the
chamber size and configuration and by the condenser capacity, which is not accounted in the previously
mentioned studies.
Chapter 4 and Chapter 5 focused mainly on the development of mathematical models for the mass
transport of the water vapour from the sublimation front to the drying chamber, considering isothermal

90 | Chapter 6
conditions. Chapter 6 intends to describe both the heat and mass transfer during freeze-drying at
laboratory/pilot scale by coupling the fluid dynamics in the chamber with the heat and mass transfer
phenomena in a tray. In order to analyse the flow behaviour in a pilot scale dryer, a model based on
computational fluid dynamics (CFD) will be developed. The CFD model will consider the tray geometry,
surface temperatures, fluid properties and pressure boundary conditions at the drying chamber and it will
be validated with experimental data collected on a pilot scale freeze-dryer.
6.1 Mechanisms of Heat Transport in Porous Material
Freeze-drying is a complex process that couples heat and multi-phase mass transfer in a vacuum
environment. Drying is mainly governed by two transport mechanisms: (i) the energy transport to
transform frozen water into water vapour; and (ii) the transport of the water vapour from the sublimation
surface through the dried layer of the product and the open spaces between particles, into the drying
chamber to the condenser [188]. The mechanisms involved during mass transport in porous material
have been described in detail in Section 4.2. Section 6.1 intends to explain the heat transport
mechanisms involved during primary drying.
The necessary amount of energy for the sublimation depends on the sublimation temperature, which
depends on the partial pressure at the sublimation front. The necessary energy can be transported by
different mechanisms: (i) by radiation of heated surfaces, (ii) by conduction from heated plates, gases and
neighbouring particles, and (iii) by gas convection [28]. Radiative and contact conduction mechanisms are
independent of pressure; however, gas phase conduction and convective mechanisms are pressure
dependent. When the mean free path of gaseous molecules is significantly smaller than the characteristic
size of gas flows, meaning small Knudsen numbers, non-slip velocity and non-jump temperature are
assumed on solid surfaces. However, very often the mean-free path is comparable to the characteristic
size. In these cases, if the rarefaction is moderate, the velocity slip and temperature jump boundary
conditions can be considered. In cases where the rarefaction is not moderate, the kinetic Boltzmann
equation or the Monte Carlo method must be employed. However, these approaches are not easy to
implement since no commercial software tool is available based on these methods.
The heating mechanism that contributes most during the process depends on the equipment and product
container designs. For cycles in which the product container is in direct contact with the heated shelves,
contact conduction serves as a primary source of heat of drying. However, when direct contact is
eliminated, radiation is expected to play a larger role in the heat exchange. In laboratory and pilot scale
freeze-dryers, the front plexiglass door plays a significant role in contributing to the radiation, which leads
to position-dependent drying rates.

CFD Model for a Laboratory/Pilot Scale Freeze-Dryer | 91
6.1.1 Ice Sublimation
As mentioned previously, sublimation is an endothermic process, meaning that heat is absorbed by the
system when phase change occurs. The rate of heat transfer during the sublimation process is given by
Equation (3.1).
𝑑𝑄𝑝𝑟𝑜𝑑𝑢𝑐𝑡
𝑑𝑡= − ∆𝐻𝑠𝑢𝑏𝑙 ∙
𝑑𝑚𝑖𝑐𝑒
𝑑𝑡= − 𝛼 𝐴𝑠𝑢𝑟𝑓𝑎𝑐𝑒 ∆𝐻𝑠 √
𝑀𝑊
2𝜋𝑅𝑇(𝑝𝑠𝑎𝑡 − 𝑝) (6.1)
The enthalpy of sublimation (∆Hsubl) is the energy necessary to change one mole of a substance from the
solid state to the gaseous state at a given pressure and temperature. The specific sublimation enthalpy
will vary with temperature. However, this variation is not significant for the range of temperatures applied
in the freeze-drying process [189].
6.1.2 Radiation
Radiative heat transfer is independent of pressure and it does not require the presence of an intervening
medium. The radiative heat flow between two surfaces depends on the difference between the absolute
temperatures of the surfaces to the power four, the emissivity of the surface and the area exposed, and it
is governed by the Stefan-Boltzmann relation as shown in Equation (6.2).
𝑞𝑟𝑎𝑑 = 𝜎 휀 𝐹2−1(𝑇24 − 𝑇1
4) (6.2)
6.1.3 Conduction
Conduction results from the interaction between particles and involves the transfer of energy from the
more energetic particles of a substance to the less energetic ones. It can take place in solids, liquids and
gases. In the specific case of bulk freeze-drying, conduction occurs in the vapour phase surrounding the
particles and between the particles and the tray that contains the product.
The contact conduction contribution is generally independent of pressure. However, the vapour phase
conduction can depend on pressure, all depending on the flow regime: (i) continuum flow regime, (ii)
transitional or temperature-jump regime, and (iii) free molecular regime.
For flows with Kn < 0.01 the flow is in the continuum regime and it is given by Equation (6.3), which is the
Fourier’s law of heat conduction.
𝑞𝐹𝑜𝑢𝑟𝑖𝑒𝑟 =𝐾
𝑙(𝑇𝑠ℎ − 𝑇𝑝) (6.3)

92 | Chapter 6
For flows with 0.01 < Kn < 0.1 the flow is in the transient regime and the heat flux can be approximated by
the first order temperature jump equation (Equation (6.4)).
𝑞𝑗𝑢𝑚𝑝 =𝑇𝑠ℎ − 𝑇𝑝
𝑙𝐾
+2𝑃
(𝛾 − 1𝛾 + 1
) √𝜋
2𝑅(√𝑇𝑠ℎ + √𝑇𝑝)
(6.4)
For flows with Kn > 10 the flow is in free molecular regime and it is given by Equation (6.5).
𝑞𝑓𝑚 =𝑇𝑠ℎ − 𝑇𝑝
2𝑃
(𝛾 − 1𝛾 + 1
) √𝜋
2𝑅(√𝑇𝑠ℎ + √𝑇𝑝)
(6.5)
Thus, heat transfer is linearly dependent on pressure in the free molecular regime and it is independent of
pressure in the continuum regime.
6.1.4 Convection
The contribution of convective heat to heat transfer is difficult to describe analytically. This is a pressure
dependent contribution, and it differs as a function of the temperature difference between the surface and
the bulk fluid. Since freeze-drying requires low working pressures, rarefied flow will have an increased
effect on the fluid dynamics and it will be mainly dependent on the temperature and pressure of the
process. The thermal creep velocity is given by Equation (6.6).
𝑢𝑐𝑟𝑒𝑒𝑝 = 𝜎𝑇
𝜇
𝜌𝑇𝑊
𝜕𝑇𝑤
𝜕𝑥 (6.6)
6.2 Materials and Methods
6.2.1 Experimental Work
6.2.1.1 Freeze-drying
The batch freeze-drying experiments were carried in a laboratory/pilot scale freeze-dryer (LyoBeta-15,
TELSTAR), which was cooled before the start of the drying cycle (Figure 6.1). The different batch freeze-
drying operational parameters – i.e. chamber pressure, shelf temperature, drying rate, product and
condenser temperature – were studied on a laboratory/pilot scale freeze-dryer.

CFD Model for a Laboratory/Pilot Scale Freeze-Dryer | 93
Figure 6.1 – a) Illustration of the drying chamber of the laboratory/pilot freeze-dryer LyoBeta-15, Telstar. b) Temperature probes TrackSense Pro data loggers, Ellab inserted on a plastic block in order to keep the desired height. c) Tray filled with frozen pelletized Maltodextrine solution 10% w/w.
A 10% w/w maltodextrine solution (DE 10-14 from medesign I.C. GmbH) was prepared using bi-distilled
water and serves as a model system. The solution was pelletized by quenching on liquid nitrogen. The
product obtained after pelletization was loaded onto the metal tray which was cooled down to
approximately -55 °C before a freeze-drying cycle. Only one tray was loaded to the freeze-dryer, which
corresponds to approximately 700 g of product. Drying was performed at two different chamber pressures
30 Pa and 50 Pa. The shelf temperature was set to 32 °C in both experiments.
The on-line measurements of fluid-inlet the temperature, the temperature at the condenser and the
chamber pressure were measured with probe systems incorporated into the freeze-dryer equipment. The
freeze-dryer equipment has a scale in-place which can measure the weight loss of the trays.
The temperature of the product was measured at 0.5, 1.0 and 2.0 mm of depth in the product layer with
TrackSense Pro data loggers (Ellab) which were inserted in a plastic block in order to keep the desired
height (Figure 6.1 b)). The temperature sensors should be positioned such that the tip is as far as
possible from the block in order to minimize its effect on heat transfer.
6.2.1.2 Particle Size Distribution
b)
c)
Laboratory/ Pilot Scale Freeze – Dryer
a) Temperature Probes
Product Tray

94 | Chapter 6
Particle size distribution experiments were done using a simple sieve test. The granulated product was
loaded into an analytical sieve shaker (AS 200, Retsch) in order to determine the particle size of the
individual product. Sieves of 5.0, 4.0, 3.15, 2.5, 1.8, 1.0 and 0.6 mm were used, and the separation was
performed during 10 min with a throwing motion with an amplitude of 2.00 mm every 10 s. The particle
size distribution study details are available in the supplementary material.
6.2.2 Model Development
The numerical work is based on a case that resembles the laboratory/pilot scale freeze-dryer and a case
that intends to study the effect of the chamber design on the drying process (Figure 6.2).
Table 6.1 presents the geometrical features of the freeze-dryer for Case A and Case B.
Figure 6.2 – Three-dimensional drawing of the investigated geometry representing the drying chamber. The structured hexahedral mesh is shown for both the tray and the chamber domain. The two cases differ in the distance between the product tray and the top heating shelf a) 0.015 m and b) 0.050 m.
Table 6.1 – Geometrical features of Case A and Case B.
Tray
Height (m) 0.037
Width (m) 0.120
Length (m) 0.310
Chamber
Distance between tray and heating shelf (m) Case A 0.015
Case B 0.050
Diameter of the condenser (m) 0.100
The CFD simulations and the implementation of the structured mesh were performed using the
commercial software ANSYS CFX 17.1 and ANSYS ICEM 17.1, respectively. Transient simulations were
a) b) Case B
Case A

CFD Model for a Laboratory/Pilot Scale Freeze-Dryer | 95
performed, and the domain was divided into a fluid and a porous domain. The flow was set to laminar
Stokes flow, where turbulence and inertial effects are not considered.
In the investigated cases in this chapter the working pressure was set to 30 Pa and the temperature of
the heating shelf to 32 °C. The sublimation phenomenon was simulated in a subdomain of the porous
domain. Mass and energy terms were introduced as described by Equations (6.7), (6.8) and (6.9).
Where psat is the saturation pressure and it is given by Equation (6.10).
𝑙𝑛𝑝𝑠𝑎𝑡
𝑝𝑡𝑟
= −∆𝐻𝑠𝑢𝑏𝑙
𝑅(
1
𝑇𝑝𝑟𝑜𝑑
−1
𝑇𝑡𝑟
) (6.10)
The model was set up considering different diffusion coefficients depending on the flow regime
characteristic of each domain. The local diffusion for each domain is given by Equation (5.3).
{
Dice, for ice in the particleDeff,porous, for water vapour in the porous domain
Deff,chamber , for water vapour in the chamber (6.11)
The ice fraction was simulated as an additional scalar variable with a very low diffusion (Dice = 1.10-10 m2
s-1) in comparison to Deff,porous and Deff,chamber (range). As discussed in the previous chapter, the vapour
diffusion in the porous domain (Deff,porous) is both influenced by the morphological characteristics of the
particles present in the tray and the free space between them. In this chapter, the bimodal porous domain
will be approximated by a unimodal porous domain, meaning that Deff,porous will be approximated by the
weighted average between Deff,particle and Deff,bed, given by Equation (6.12).
𝐷𝑒𝑓𝑓,𝑝𝑜𝑟𝑜𝑢𝑠 = (1 − 𝜃𝑏𝑒𝑑) ∙ 𝐷𝑒𝑓𝑓,𝑝𝑎𝑟𝑡𝑖𝑐𝑙𝑒 + 𝜃𝑏𝑒𝑑 ∙ 𝐷𝑒𝑓𝑓,𝑏𝑒𝑑 (6.12)
As previously mentioned, two different geometries were investigated, Case A and Case B. Experimental
data acquired in laboratory/pilot scale was used for validation and verification studies. The validation
𝑑𝑚𝑤𝑎𝑡𝑒𝑟 𝑣𝑎𝑝𝑜𝑢𝑟
𝑑𝑡=
𝐴𝑇𝑟𝑎𝑦
𝑉𝑇𝑟𝑎𝑦
∙ √𝑀𝑊
2 ∙ 𝜋 ∙ 𝑅𝑔𝑎𝑠 ∙ 𝑇𝑝𝑟𝑜𝑑
(𝑝𝑠𝑎𝑡
− 𝑦𝑊
∙ 𝑃) (6.7)
𝑑𝑚𝑖𝑐𝑒
𝑑𝑡= −
𝐴𝑇𝑟𝑎𝑦
𝑉𝑇𝑟𝑎𝑦
∙ √𝑀𝑊
2 ∙ 𝜋 ∙ 𝑅𝑔𝑎𝑠 ∙ 𝑇𝑝𝑟𝑜𝑑
(𝑝𝑠𝑎𝑡
− 𝑦𝑊
∙ 𝑃) (6.8)
𝑑𝑄𝑝𝑟𝑜𝑑𝑢𝑐𝑡
𝑑𝑡= −
𝐴𝑇𝑟𝑎𝑦
𝑉𝑇𝑟𝑎𝑦
∙ ∆𝐻𝑠𝑢𝑏𝑙 ∙ √𝑀𝑊
2 ∙ 𝜋 ∙ 𝑅𝑔𝑎𝑠 ∙ 𝑇𝑝𝑟𝑜𝑑
(𝑝𝑠𝑎𝑡
− 𝑦𝑊
∙ 𝑃) (6.9)

96 | Chapter 6
studies were performed in Case A since it resembles the laboratory/pilot scale freeze-dryer. As in the
previous chapters maltodextrin was used as a model system (Cases Maltodextrin 30 and Maltodextrin
50). Furthermore, the simulated drying behaviour was compared with the experimental data collected for
the freeze-drying of Streptococcus thermophilus (ST-B, ST-C, ST-D, ST-H; the experimental methodology
related to this data set can be found in Chapter 3).
Table 6.2 summarizes the morphological characteristics of each particle and of the free space between
particles in the bed. Table 6.3 presents the calculated diffusion coefficients for each location and the
diffusion coefficients implemented in the CFD simulations. Case A and Case B are given as examples in
Table 6.2 and Table 6.3, the other cases can be found in the supplementary material.
Table 6.2 - Morphological characteristics of each particle and of the free space between particles in the bed.
Particles
dparticle [mm] θparticle [-] dpore [μm] τparticle [-] Effparticle [%]
3,96 0.85 14 2 0.4
Free space between particles
Case Packbed [-] Vparticles [m3] Vbed [m3] θbed [-] dbed,pore [mm] τbed [-] Effbed [%]
A / B 0.52 7.28 x 10⁻³ 1.40 x 10⁻³ 0.48 1.22 √2 0.34
Table 6.3 - Calculated diffusion coefficients for each particle, for the free space between particles and the diffusion coefficients implemented in the CFD simulations.
Particles Free space between particles Unimodal Porous Domain
(CFD)
Case Deff,particle
[m2/s] Knbed
[-] Dkn,eff,bed
[m2/s] Dbulk,eff,bed
[m2/s] Deff,bed [m2/s]
Deff,porous
[m2/s] Deff,chamber
[m2/s]
A / B 2.11 x 10⁻³ 0.29 4.51 x 10⁻² 1.33 x 10⁻² 1.02 x 10⁻² 6.02 x 10⁻³ 3.91 x 10⁻²
6.2.2.1 Boundary Conditions
The walls of the chamber were modelled with a no-slip condition and with an isothermal temperature
equal to the one of the heating shelf. The wall of the tray was also modelled with a no-slip condition (this
assumption will later be discussed) and an isothermal temperature of 32 °C. The heat transfer from the
wall to the solid material was set to be a constant outside temperature corresponding to the heating shelf
temperature (32 °C) and the heat transfer coefficient, whose estimation was based on the calculations
already presented in Chapter 2 (0.3 W/(m2.K)). Furthermore, a radiation heat flux, given by Equation
(6.13), was set at the interface between the porous and the chamber domain. An opening boundary was
set in the bottom of the drying chamber that corresponds to the initial part of the duct that leads to the
condenser with a certain pressure and temperature (30 Pa, 32 °C).

CFD Model for a Laboratory/Pilot Scale Freeze-Dryer | 97
𝑞𝑟𝑎𝑑 =𝜎
𝑥𝑝𝑟𝑜𝑑
(𝑇𝑠ℎ𝑒𝑙𝑓4 − 𝑇𝑝𝑟𝑜𝑑
4 ) (6.13)
6.3 Results
6.3.1 Model Validation - Comparison of experimental and simulated drying behavior
The drying behaviour in freeze-drying processes is, besides the process conditions, affected by the
design of the apparatus, the product characteristics and the packing factor of the product in the tray.
A simplified geometry of the freeze-drying chamber, Case A, was developed to simulate the drying
behaviour of frozen particulate material in a laboratory/pilot scale freeze-dryer. The approximation to a
simplified geometry representing the drying chamber is considered valid since in the considered process
conditions there are no restrictions to fluid flow originating from limitations in the condenser capacity or
choked flow in the duct [10]. This was verified through ice sublimation tests performed in the
laboratory/pilot scale freeze-dryer used in this study (Chapter 3) [105].
While the product characteristics were incorporated into the simulation based on experimentally
estimated values, it was not possible to measure the packing factor of the particulate material
experimentally. Particulate material frozen by quenching in liquid nitrogen is characterized as having
irregular shapes and sizes, which will affect the packing structure in the tray [190]. Furthermore, the
shaking method used after loading the tray impacts also the degree of packing of the product. Hence, the
packing factor is an imprecise parameter, which is laborious and difficult to estimate through experimental
methods.
Random packing of granular materials is broadly present in nature and industry; therefore, it is
extensively reported in literature. Since experimental measuring methods are laborious and expensive,
many research groups focused on numerical simulations instead [190]–[198]. In the present model, the
packing factor was estimated through an iterative approach that identified the packing factor that leads to
the measured drying time. Each iteration is performed by changing the packing factor in the simulation,
and after the convergence of the simulation the predicted drying time is compared with the experimental
data. The packing factor is accepted when the difference between the simulated and experimental drying
time value is less than 10 %.
It was found for the case study using maltodextrin, that a packing factor of 0.64 is the one that gives a
better correlation between the experimental and the simulated drying time. For the production strains a
packing factor of 0.4 was found to match the simulation and experimental data reasonably.

98 | Chapter 6
The model was validated with the measured drying time from four different freeze-drying cycles of
products with identical characteristics to the products used for estimation of the packing factor in terms of
particle diameter, shape and porosity. Figure 6.3 presents the parity plot where the correlation between
the measured and the simulated values can be evaluated.
Figure 6.3 - Parity plot of experimentally obtained and simulated drying time. The dashed lines indicate the ± 15 % and ± 30 % deviation.
The simulated drying time is within 15% of the experimental value for three of the four measurements.
Therefore, the implemented strategy is assumed to be valid for the prediction of the drying time within
reasonable values, even if a large number of assumptions related to product morphology had to be
implemented. The variations in the parity plot can be associated with the assumptions made during model
development but also with product variations and uncertainties in the experimental determination of the
drying time. Furthermore, larger uncertainties were observed in the model when decreasing the pressure
of the drying chamber. The choice of the adequate numerical approach to describe heat and mass
transfer in freeze-drying is dependent on the significant rarefied flow effects due to the low operating
pressures. When the pressure is reduced, the flow behaviour is closer to the molecular regime, meaning
that it cannot be described anymore by the Navier-Stokes equation [107].
In order to validate the developed model both drying time and the fraction of ice over time present in the
tray are relevant. Therefore, the predicted fraction of ice over time was compared with the measurements
from the laboratory/pilot scale freeze-dryer. Figure 6.4 shows the fraction of ice over time for the four
different production strains. A good prediction of the fraction of ice present in the tray over time is verified.
When looking closely to Figure 6.4 a), an over prediction of the drying time and of the fraction of ice
present in the tray at the end of drying is verified for ST-B. As discussed in Chapter 2, this strain results in
final dried products with a higher porosity compared with maltodextrin or even with the other production
strains. This was not considered during the set up of the simulation, which leads to inaccuracies.
However, the developed model gives the possibility to change the considered characteristics of product

CFD Model for a Laboratory/Pilot Scale Freeze-Dryer | 99
morphology, and thus to improve the correlation between the simulated and the experimental values. The
previous observations show once more the importance of characterizing the product morphology in order
to obtain models that represent the reality better.
Figure 6.4 – Predicted and measured drying time changing over time during drying of production strains: a) ST-B, b) ST-C, c) ST-D and d) ST-H. The continuous line represents the measured fraction of ice and the dashed line represents the simulated fraction of ice.
When developing a freeze-drying cycle, it is critical to acquire knowledge on product temperature
throughout the process. It is essential to identify the appropriate conditions, based on product
characteristics, for primary drying. The product temperature should remain below the glass/collapse
temperature of the freeze-dried material without being unnecessarily low, resulting in prolonged freeze-
drying cycles [125]. Furthermore, the importance of monitoring product temperature during scale-up is
recognized in order to assure that the time course of product temperature during process development at
a smaller scale and a larger scale are consistent. However, several problems and sources of uncertainty
associated with the measurement of product temperature have been reported [125]. One of the sources
a) b)
c) d)

100 | Chapter 6
of uncertainty is the variation of the drying behavior connected to the presence of temperature probes in
contact with the product. Particularly for the freeze-drying of particulate material, problems arise to
determine the exact temperature of the product since the probes are only in contact with its surface.
Additionally, it is challenging to determine the exact location of the measurement. Figure 6.5 shows the
product temperature profile measured during the drying step of Maltodextrin 30. It is observable that the
temperature increases at a constant rate until it achieves the sublimation temperature. The sublimation
process is an endothermic process meaning that energy is absorbed by the system for the phase change.
Therefore, a decrease of the rate at which temperature increases at around -32 °C is noticeable in Figure
6.5, which corresponds to the sublimation temperature at the respective chamber pressure. Furthermore,
a steeper increase of the temperature is observed in the probe that is mounted closer to the heating
source (bottom of the tray).
Figure 6.5 helps also to evaluate the predicted product temperature by comparison with the performed
measurements at laboratory/pilot scale. It is observed that the simulated temperature increases at a much
slower rate than the temperature measured by the temperature probes placed in a laboratory/pilot freeze-
dryer. A commercial CFD software, ANSYS CFX 17.1, was used in the current work for the simulation of
the flow structure during the drying process. CFD calculations are based on continuum Navier-Stokes
equations for viscous flows. As mentioned throughout this work, the continuum hypothesis is only valid for
flows at small Knudsen numbers. For flows in the transition regime, the non-equilibrium rarefaction will
influence the flow near gas-solid interfaces and consequently these effects must be accounted for in the
boundary conditions[71]. From the product tray to the condenser, flow goes through several flow regimes.
For Maltodextrin 30, the flow in the product tray is in the transition regime (Table 6.3), and therefore a
finite slip wall was implemented that considers a temperature jump relation for the heat transfer. However,
this implementation was not successful leading to the conclusion that further studies are needed for the
correct implementation of heat transfer phenomena during freeze-drying in commercial CFD software.

CFD Model for a Laboratory/Pilot Scale Freeze-Dryer | 101
Figure 6.5 – (──) Measured product temperature as a function of time at 0.5 mm and 2 mm from the bottom of the tray. (----) Simulated product temperature as a function of time at 0.5 mm and 2 mm from the bottom of the tray.
6.3.2 Packing Factor Studies
The drying and flow patterns during freeze-drying are both dependent on the characteristics of the
product and the characteristics of the equipment. The investigation of the drying pattern allows the
development of optimized cycles since it helps to determine possible heterogeneities during drying due to
intrinsic heterogeneity of the product or of the drying chamber [199]. However, it is difficult to identify and
quantify such effects on the final experimental results. CFD modelling allows the efficient investigation of
these effects and the quantitative description of essential parameters that are difficult to obtain through
experimental approaches [108], [199]. To analyze the flow structure in a dryer, the developed model
considers the dryer geometry, surface temperature, fluid properties, and pressure boundary conditions at
the chamber and condenser end [71].
Error! Reference source not found. shows the distribution of ice at different stages of primary drying of
two cases with different packing factors, which allows observing the influence of heat transfer on the
drying process. In the studied cases heat is transferred through radiation from the top heating shelf and
through conduction from the tray where the product is loaded, which was heated through radiation by the
bottom heating shelf. Figure 6.6 shows that drying will occur faster in the areas closer to the tray (higher
heat transfer) and from the upper part of the tray (less resistance to fluid flow and heating source through
radiation). Furthermore, it is possible to observe the effect of different packing factors. When comparing
Figure 6.6 b) and d) it is observable that for lower packing factors, since the fluid motion is easier, the
drying of the porous material will depend on heat transfer, meaning that areas closer to the heating
sources will dry faster. On the contrary when the packing factor is higher, the drying behavior will be
similar to the drying of a vial, meaning that the sublimation front will progress from the top to the bottom of
the tray.

102 | Chapter 6
Figure 6.6 – Contour of ice fraction present in the tray and the water gas flow pattern in the chamber at different stages of primary drying and assuming different packing factors: a) 50 % of the ice has sublimated and the packing factor is 0.64, b) 90 % of the ice has sublimated and the packing factor is 0.64, c) 50 % of the ice has sublimated and the packing factor is 0.40, b) 90 % of the ice has sublimated and the packing factor is 0.40.
6.3.3 Chamber Design Studies
The vapor flow in freeze-drying systems is affected by the design of the apparatus as well as by the
operating temperature and pressure [106]. The analysis of complex, three-dimensional flow phenomena
can be aided by the application of CFD techniques, which have been recognized to be beneficial in the
analyses of various designs and process parameters. In this section, it was intended to study the effect of
the proximity of the top heating shelf to the product tray. Figure 6.7 a) shows that there is not a significant
change in the drying time as a result of an almost 3.5 times increase of the height of the top heating shelf.
However, a small decrease of the pressure in the product tray as a consequence of the increase of the
height of the shelf temperature is observed in Figure 6.7 b).
Figure 6.7 – a) Sublimation rate as a function of drying time for Case A and Case B. b) Pressure as a function of drying time in different planes of the tray for Case A and Case B. The top plane is at 3.2 mm, the middle plane at 1.75 mm and the bottom plane at 0.40 mm from the bottom of the tray.
a) b)
a) b)
c) d)
50 %
50 %
90 %
90 %
Packbed = 0.40 Packbed = 0.40
Packbed = 0.64 Packbed = 0.64

CFD Model for a Laboratory/Pilot Scale Freeze-Dryer | 103
Although, no significant changes were observed in the drying cycle due to the design changes applied in
the drying chamber, it is important to mention the possible effect of such changes on the product quality.
An increase or decrease of the pressure might lead to a shift of the sublimation temperature which can
cause the micro-collapse or even the collapse of the product. It is, therefore, relevant to highlight that
different drying rates and/or chamber pressures can produce different freeze-dried products, both in the
appearance and viability of the microorganisms present [19].
The potential of the use of computational fluid dynamics (CFD) tools for the investigation of the effect of
the equipment design during freeze-drying was illustrated in this section, although in the studied cases
there was no significant difference in the drying behaviour due to changes in the equipment design.
Computational fluid dynamics (CFD) offers a route to facilitate the design of more coherent freeze-drying
cycles with increased knowledge of the process.
6.4 Conclusions
The design of freeze-drying cycles is usually achieved through an extensive amount of experimental work
and it consists of the identification of the optimal values of shelf temperature, chamber pressure and
process duration. This is an expensive and time consuming approach which does not guarantee that an
optimal solution is achieved. Furthermore, the in-line measuring technologies for the important
parameters involved in the optimization and control of freeze-drying cycles present several challenges
and inaccuracies.
The development of mathematical models is increasingly important for process development in order to
satisfy the need for improved process understanding. The available information for the freeze-drying of
bulk material in open trays, mainly used in the biotechnology and food industry, is limited. Therefore, this
chapter has focused on the development of a model based on computational fluid dynamics (CFD), in
order to analyze the flow behavior during primary drying of particulate matter loaded on a tray in a pilot
scale dryer. The developed CFD model couples both the dryer hardware and the product characteristics.
The model showed good results in the prediction of drying times, to satisfactorily predict the drying times
for different porous materials. Furthermore, the model was able to successfully predict the fraction of ice
present in the tray over the time course of the drying process. The simulated results showed the
importance of characterizing the product morphology in order to have models that correlate satisfactorily
with the experimental measurements.
The model was not successful in the prediction of the product temperature. Gas phase conduction and
convective mechanisms are pressure dependent. Since freeze-drying occurs at very low pressures and
the flow on the investigated cases was found to be in the transient regime, the model must consider the
velocity slip and temperature jump boundary conditions. The implementation of a finite slip wall in the

104 | Chapter 6
boundary conditions was not successful. The correct prediction of product temperature is essential for the
design of optimal freeze-drying cycles, and therefore, additional studies of the correct implementation of
the boundary conditions are needed. A fundamental understanding of heat and mass transfer during
drying is essential for the construction of an accurate model.
The presented model can furthermore assist with developing increased process understanding regarding
the effect of packing and equipment design. CFD simulations allow further investigation of the possible
heterogeneities derived from different packing factors of the particles, which may lead to different drying
behaviour. Furthermore, the CFD model allows the study of the effect of the chamber, duct and
condenser design on the process and final product characteristics. The investigated cases present
differences regarding the distance between the product tray and the heating shelf. However, the
developed CFD model allows the study of other geometries as well.

Conclusions and Future Perspectives
The aim of this thesis was the development of a mathematical model using CFD tools in order to predict
and better understand the drying behaviour of lactic acid bacteria during freeze-drying. The main
conclusions from each chapter were already presented throughout this thesis. In this section, it is
intended to give a broader perspective of the main conclusions and future perspectives.
7.1 Investigation of the Drying Behaviour of Starter Cultures
Starter cultures are nowadays widely used for the production of fermented foods. This project focused on
lactic acid bacteria since they are the main microorganisms responsible for fermentation of fermented
food products, and therefore one of the most common starter cultures. Freeze-drying of starter cultures
allows its easier and less costly handling, transport, storage and application. Furthermore, since freeze-
drying operates at low temperature, thermal damage of the products is minimized, and the structural and
shape characteristics of the product are preserved. Four production strains from Streptococcus
thermophilus were used as model organisms.
Product drying behaviour at laboratory/pilot scale and production scale was investigated for the four
production strains chosen as model organisms. Differences in their performance were found after an
exploratory analysis of production data from the last six years, which motivated further studies with focus
on the characterization of the morphology of the product. The investigation led to the conclusion that the
composition of the medium after centrifugation and after the addition of cryo- and lyo- protectants
influences the final drying matrix (i.e. tortuosity, porosity, pore size distribution, particle diameter) which
consequently influences the drying behaviour. Furthermore, the choice of process parameters (pressure
and temperature) depends on the composition of the product being freeze-dried since the product
temperature should be at all times below the collapse temperature (Tc’) in order to keep the structure of
the product. Thus, both the composition of the product and the maximum temperature allowed by the
product should be considered when designing freeze-drying cycles for new products.
Furthermore, production data of the last six years of freeze-drying of the same strain on different Chr.
Hansen sites was also presented in this thesis. No differences were found in the drying behaviour and
product quality after the exploratory analysis. However, it was observed that different process parameters
(i.e. pressure, temperature and process duration) were applied on the different sites depending on the
design of the existent freeze-drying equipment. Which means that cycle optimization had to be performed

106 | Chapter 7
in order to transfer the production process of the same product between sites without changing the
product quality.
In the traditional approach, the design and optimization of freeze-drying cycles is usually obtained through
an extensive amount of experimental work, which has to be repeated every time a new product is
implemented or the process is transferred to a larger scale or an equipment with different characteristics.
This is an expensive and time consuming approach which does not guarantee the achievement of an
optimal solution. Furthermore, the in-line measuring technologies for the important parameters involved in
the optimization and control of freeze-drying cycles, present several challenges and inaccuracies. In this
thesis a mathematical model was developed in order to overcome these challenges.
7.2 Model Development and Implementation
This thesis has shown the potential of the use of computational fluid dynamics (CFD), as an advanced
modelling approach for the prediction of the drying behaviour of particulate material. When compared to
the experimental approach outlined above, CFD allows the design of freeze-drying cycles in a more
efficient and less expensive way that considers both the characteristics of the product and of the
equipment. Therefore, it can be used as a complementary tool in the design and optimization of freeze-
drying cycles for new products, for the scale-up of new processes and for process transfer between
equipment.
CFD tools support the investigation of the effect of product morphology on the sublimation rate when
designing new processes. This thesis focused on the freeze-drying of particulate material, which is
characterized by a bimodal pore size distribution, meaning that both the size of the pores inside the
product and the size of the pores that characterize the bed of particles influence the drying behaviour and
the diffusion of vapour during sublimation. The adopted strategy for model development was based on a
scale-up approach – going from the small scale of a single particle where only product characteristics are
addressed, to the laboratory/pilot scale where both product and equipment characteristics are taken into
account. This approach increased the confidence in modelling predictions and allowed the investigation of
the most relevant parameters at each step of the process.
The ability to successfully predict the sublimation phenomena of a porous product at isothermal
conditions was demonstrated by comparison with the results collected from a freeze-drying microscope
(FDM). The relevance of product characterization (porosity, tortuosity and pore size distribution) in order
to achieve an increased understanding of the mass transfer phenomena taking place during primary
drying was highlighted by the implementation of the CFD model. Furthermore, the effect of neighbouring
particles and bed porosity on the length of a freeze-drying batch was also investigated. The qualitative
results obtained in the case studies in this thesis allow a better understanding of the mass transport

Conclusions and Future Perspectives | 107
phenomena occurring in a stack of particles and ensure further understanding of the optimal particle size
that leads to more efficient processes.
The drying behaviour of particle based material is, besides the porous system and the operating
conditions, largely affected by the equipment design [71], [109]. The efficiency of the process is affected
by the chamber size and configuration, and by the condenser capacity, which is not accounted for in the
previously mentioned studies [85], [117]. Therefore, the last section of this thesis focused on the
development of a mathematical model where product and equipment characteristics are coupled, and
both mass and heat transfer phenomenon can be investigated. CFD simulations showed good results in
the investigation of possible heterogeneities in the drying behaviour and drying time derived from different
morphological characteristics of the porous product. However, throughout drying, water vapour is
produced and transported from the product tray to the condenser through different flow regimes. A
commercial CFD software, ANSYS CFX 17.1, was used for the simulation of the flow structure during the
drying process. CFD calculations are based on continuum Navier-Stokes equations for viscous flows. As
mentioned throughout this work, the continuum hypothesis is only valid for flows at small Knudsen
numbers. Since the gas phase conduction and convective mechanisms are pressure dependent and
freeze-drying is performed at low pressures, a fundamental understanding of heat and mass transfer
during drying is essential for the construction of an accurate model. The prediction of product temperature
was not successful leading to the conclusion that further studies are needed for the correct
implementation of heat transfer phenomena during freeze-drying in commercial CFD software.
Alternatively, kinetic Boltzmann equation or the Monte Carlo method could be employed since these are
valid for the different flow regimes. However, no commercial software tool is available based on these
methods, and therefore these approaches are not easy to implement since.
In order to leverage the time and computational effort associated with simulations of larger scales
processes, the bimodal porous material was simplified to a unimodal porous domain, meaning that the
diffusion coefficient and the morphological characteristics of the porous media were approximated by the
weighted average. This approximation leads to inaccuracies and lack of understanding of some of the
phenomena happening in the process, therefore a multi-scale fully coupled modelling approach could be
implemented. However, computational cost increases with the introduction of additional complexity and
therefore this compromise should be analysed for each individual case.
In summary, the successful transfer of lyophilization processes from the development laboratory to
production and commercial manufacturing sites requires the true understanding of the relations between
the formulation composition, the process parameters and the equipment capabilities. The use of
mathematical models for the investigation of optimal process conditions opens the possibility to
mechanistically understand scale-up issues and to develop robust freeze-drying cycles that facilitate the
transfer between different devices. Furthermore, it is important to keep a compromise between product
requirements (maximum temperature and pressure) and process parameters (chamber pressure, shelf
108 | Chapter 7
temperature and drying time) when developing freeze-drying cycles. Additionally, the survival to freezing
and drying will also depend on the strain being freeze-dried and its resistance to dehydration, low
pressures and temperature increase. Further studies are needed in order to better understand the
mechanisms happening inside the cell during freezing and drying and in order to understand the effect of
the final drying matrix on the survival of the bacteria. The combination of CFD and increased knowledge
on the protection mechanisms happening in the cell has massive potential in the optimization and
development of new freeze-drying processes.

References
[1] B. Speranza, A. Bevilacqua, M. R. Corbo, and M. Sinigaglia, Eds., Starter cultures in food
production. Wiley-VCH Verlag GmbH & Co. KGaA, Weinheim, Germany, 2017.
[2] P. Melin, S. Håkansson, and J. Schnürer, “Optimisation and comparison of liquid and dry
formulations of the biocontrol yeast Pichia anomala J121,” Appl. Microbiol. Biotechnol., vol. 73, no.
5, pp. 1008–1016, 2007.
[3] S. H. Peighambardoust, “Application of spray drying for preservation of lactic acid starter cultures :
a review,” Trends Food Sci. Technol., vol. 22, no. 5, pp. 215–224, 2011.
[4] C. Santivarangkna, U. Kulozik, and P. Foerst, “Alternative Drying Processes for the Industrial
Preservation of Lactic Acid Starter Cultures,” Biotechnol. Prog., vol. 23, no. 2, pp. 302–315, 2007.
[5] L. Rey, “Glimpses into the Realm of Freeze-Drying: Classical Issues and New Ventures,” in
Freeze Drying/ Lyophilization of Pharmaceutical and Biological Products, Third., L. Rey and J. C.
May, Eds. informa, 2010, pp. 1–28.
[6] F. Franks, “Freeze-drying of bioproducts: Putting principles into practice,” Eur. J. Pharm.
Biopharm., vol. 45, no. 3, pp. 221–229, 1998.
[7] B. Roser, “Trehalose , a new approach to premium dried foods,” Trends Food Sci. Technol., vol. 2,
pp. 166–169, 1991.
[8] A. A. Pisano, Roberto; Fissore, Davide; Velardi, Salvatore A.; Barresi, “In-Line Optimization and
Control of an Industrial Freeze-Drying Process for Pharmaceuticals,” J. Pharm. Sci., vol. 99, no.
11, pp. 4691–4709, 2010.

110 | Chapter 8
[9] H. Sadikoglu and a. I. Liapis, “Mathematical Modelling of the Primary and Secondary Drying
Stages of Bulk Solution Freeze-Drying in Trays: Parameter Estimation and Model Discrimination
by Comparison of Theoretical Results With Experimental Data,” Dry. Technol., vol. 15, no. March
2015, pp. 791–810, 1997.
[10] D. Fissore, R. Pisano, and A. A. Barresi, “Process analytical technology for monitoring
pharmaceuticals freeze-drying – A comprehensive review,” Dry. Technol., pp. 1–27, 2018.
[11] L. De Vuyst, “Lactic acid bacteria as functional starter cultures for the food fermentation industry,”
Trends Food Sci. Technol., vol. 15, no. 2, pp. 67–78, 2004.
[12] C. Daly, G. F. Fitzgerald, and R. Davis, “Biotechnology of lactic acid bacteria with special
reference to bacteriophage resistance,” Antonie van Leeuwenhoek, Int. J. Gen. Mol. Microbiol.,
vol. 70, no. 2–4, pp. 99–110, 1996.
[13] P. Capela, T. K. C. Hay, and N. P. Shah, “Effect of cryoprotectants, prebiotics and
microencapsulation on survival of probiotic organisms in yoghurt and freeze-dried yoghurt,” Food
Res. Int., vol. 39, no. 2, pp. 203–211, 2006.
[14] A. S. Carvalho, J. Silva, P. Ho, P. Teixeira, F. X. Malcata, and P. Gibbs, “Relevant factors for the
preparation of freeze-dried lactic acid bacteria,” Int. Dairy J., vol. 14, no. 10, pp. 835–847, 2004.
[15] M. Aschenbrenner, “Freeze-drying of Probiotics,” in Advances in Probiotic Technology, P. Foerst
and C. Santivarangkna, Eds. CRC Press, 2015, pp. 213–238.
[16] G. Blond and D. Simatos, “Optimized thermal treatments to obtain reproducible DSC thermograms
with sucrose+dextran frozen solutions,” Food Hydrocoll., vol. 12, no. 2, pp. 133–139, 1998.
[17] C. Santivarangkna, M. Aschenbrenner, U. Kulozik, and P. Foerst, “Role of Glassy State on
Stabilities of Freeze-Dried Probiotics,” J. Food Sci., vol. 76, no. 8, 2011.
References | 111
[18] T. Nei, “Growth of ice crystals in frozen specimens,” J. Microsc., vol. 99, no. 2, pp. 227–233, 1973.
[19] C. A. Morgan, N. Herman, P. A. White, and G. Vesey, “Preservation of micro-organisms by drying;
A review,” J. Microbiol. Methods, vol. 66, no. 2, pp. 183–193, 2006.
[20] F. Dumont, P.-A. Marechal, and P. Gervais, “Cell Size and Water Permeability as Determining
Factors for Cell Viability after Freezing at Different Cooling Rates,” Appl. Environ. Microbiol., vol.
70, no. 1, pp. 268–272, 2004.
[21] F. Fonseca, M. Marin, and G. J. Morris, “Stabilization of frozen Lactobacillus delbrueckii subsp.
bulgaricus in glycerol suspensions: Freezing kinetics and storage temperature effects,” Appl.
Environ. Microbiol., vol. 72, no. 10, pp. 6474–6482, 2006.
[22] L. Bâati, C. Fabre-Gea, D. Auriol, and P. J. Blanc, “Study of the cryotolerance of Lactobacillus
acidophilus: Effect of culture and freezing conditions on the viability and cellular protein levels,” Int.
J. Food Microbiol., vol. 59, no. 3, pp. 241–247, 2000.
[23] I. I. Morozov and V. G. Petin, “The influence of cyclic heating and cooling on Escherichia coli
survival,” Microbiology, vol. 76, no. 2, pp. 172–176, 2007.
[24] Y. H. Roos, “Frozen State Transitions in Relation to Freeze-Drying,” J. Therm. Anal., vol. 48, pp.
535–544, 1997.
[25] L. Slade et al., “Beyond water activity : Recent advances based on an alternative approach to the
assessment of food quality and safety Beyond Water Activity : Recent Advances Based on an
Alternative Approach to the Assessment of Food Quality and Safety,” Crit. Rev. Food Sci. Nutr.,
vol. 30, no. (2-3), pp. 115–360, 1991.
[26] T. A. Jennings, Lyophilization - Introduction and Basic Principles. informa healthcare, 1999.
[27] K. S. Pehkonen, Y. H. Roos, S. Miao, R. P. Ross, and C. Stanton, “State transitions and

112 | Chapter 8
physicochemical aspects of cryoprotection and stabilization in freeze-drying of Lactobacillus
rhamnosus GG (LGG),” J. Appl. Microbiol., vol. 104, no. 6, pp. 1732–1743, 2008.
[28] G.-W. Oetjen, Freeze Drying. Wiley-VCH Verlag GmbH & Co. KGaA, Weinheim, Germany, 1999.
[29] G. D. J. Adams, I. Cook, and K. R. Ward, “The Principles of Freeze-Drying,” in Cryopreservation
and Freeze-Drying Protocols, Third Edit., W. F. Wolkers and H. Oldenhof, Eds. 2015, pp. 121–
146.
[30] M. Aschenbrenner, P. Foerst, and U. Kulozik, “Freeze-drying of Probiotics,” in Advances in
Probiotic Technology, no. August, F. Petra and C. Santivarangkna, Eds. CRC Press, 2015, pp.
213–241.
[31] M. J. Pikal, “Design of freeze-drying processes for pharmaceuticals: practical advice,” Pharm.
Res., vol. 21, no. 2, pp. 191–200, 2004.
[32] P. Properties, “Effects of Annealing on Freeze- Dried Lactobacillus acidophilus,” Food Eng. Phys.
Prop., vol. 68, no. 8, pp. 2504–2511, 2003.
[33] S. Passot et al., “Effect of product temperature during primary drying on the long-term stability of
lyophilized proteins,” Pharm. Dev. Technol., vol. 12, no. 6, pp. 543–553, 2007.
[34] F. Fonseca, O. Cunin, and M. Marin, “Collapse Temperature of Freeze-Dried Lactobacillus
bulgaricus Suspensions and Protective Media,” Biotechnol. Pro, vol. 20, pp. 229–238, 2004.
[35] F. Franks and T. Auffret, Freeze-drying of Pharmaceuticals and Biopharmaceuticals. Cambridge:
RSC Publishing, 2007.
[36] P. Sheehan and A. I. Liapis, “Modeling of the primary and secondary drying stages of the freeze
drying of pharmaceutical products in vials: Numerical results obtained from the solution of a
dynamic and spatially multi-dimensional lyophilization model for different operational policies,”

References | 113
Biotechnol. Bioeng., vol. 60, no. 6, pp. 712–728, 1998.
[37] G. E. Gardiner et al., “Comparative Survival Rates of Human-Derived Probiotic Lactobacillus
paracasei and L . salivarius Strains during Heat Treatment and Spray Drying,” Appl. Environ.
Microbiol., vol. 66, no. 6, pp. 2605–2612, 2000.
[38] G. F. de Valdez, G. S. de Giori, A. P. de Ruiz Holgado, and G. Oliver, “Rehydration conditions and
viability of freeze-dried lactic acid bacteria,” Cryobiology, vol. 22, no. 6, pp. 574–577, 1985.
[39] G. Zayed and Y. H. Roos, “Influence of trehalose and moisture content on survival of Lactobacillus
salivarius subjected to freeze-drying and storage,” Process Biochem., vol. 39, no. 9, pp. 1081–
1086, 2004.
[40] O. F. Nielsen, M. Bilde, and M. Frosch, “Water Activity,” Spectrosc. An Int. J., vol. 27, no. 5, pp.
565–569, 2012.
[41] M. J. Pikal, S. Shah, M. L. Roy, and R. Putman, “The secondary drying stage of freeze drying:
drying kinetics as a function of temperature and chamber pressure,” Int. J. Pharm., vol. 60, no. 3,
pp. 203–207, 1990.
[42] G.-W. Oetjen and P. Haseley, “Installation and Equipment Technique: Sections 2.1 and 2.2,” in
Freeze-Drying, Second Edi., Wiley-VCH Verlag GmbH & Co. KGaA, Weinheim, Germany, 2003.
[43] S. M. Patel and M. J. Pikal, “Freeze-drying in novel container system: Characterization of heat and
mass transfer in glass syringes,” J. Pharm. Sci., vol. 99, no. 7, pp. 3188–3204, 2010.
[44] S. M. Patel and M. J. Pikal, “Emerging Freeze-Drying Process Development and Scale-up Issues,”
AAPS PharmSciTech, vol. 12, no. 1, pp. 372–378, 2011.
[45] G. Broeckx, D. Vandenheuvel, I. J. J. Claes, S. Lebeer, and F. Kiekens, “Drying techniques of
probiotic bacteria as an important step towards the development of novel pharmabiotics,” Int. J.
114 | Chapter 8
Pharm., vol. 505, no. 1–2, pp. 303–318, 2016.
[46] A. S. Carvalho, J. Silva, P. Ho, P. Teixeira, F. X. Malcata, and P. Gibbs, “Effects of Various Sugars
Added to Growth and Drying Media upon Thermotolerance and Survival throughout Storage of
Freeze-Dried lactobacillus delbrueckii ssp. bulgaricus,” Biotechnol. Prog., vol. 20, no. 1, pp. 248–
254, 2004.
[47] J. Palmfeldt, P. Rådström, and B. Hahn-Hägerdal, “Optimisation of initial cell concentration
enhances freeze-drying tolerance of Pseudomonas chlororaphis,” Cryobiology, vol. 47, no. 1, pp.
21–29, 2003.
[48] Z. Hubálek, “Protectants used in the cryopreservation of microorganisms,” Cryobiology, vol. 46,
no. 3, pp. 205–229, 2003.
[49] P. B. Conrad, D. P. Miller, P. R. Cielenski, and J. J. De Pablo, “Stabilization and preservation of
Lactobacillus acidophilus in saccharide matrices,” Cryobiology, vol. 41, no. 1, pp. 17–24, 2000.
[50] David E. Pegg, “Principles of Cryopreservations,” in Cryopreservationand Freeze-Drying
Protocols, Second., J. G. Day and G. N. Stacey, Eds. Totowa, New Jersey: Humana Press, 2007,
pp. 39–57.
[51] C. Santivarangkna, U. Kulozik, and P. Foerst, “Inactivation mechanisms of lactic acid starter
cultures preserved by drying processes,” J. Appl. Microbiol., vol. 105, no. 1, pp. 1–13, 2008.
[52] J. H. Crowe, J. F. Carpenter, and L. M. Crowe, “The Role of Vitrification in Anhydrobiosis,” Annu.
Rev. Physiol., vol. 60, no. 1, pp. 73–103, 1998.
[53] J. H. Crowe, F. a Hoekstra, and L. M. Crowe, “Anhydrobiosis,” Annu. Rev. Physiol., vol. 54, pp.
579–599, 1992.
[54] L. M. Crowe, “Lessons from nature: The role of sugars in anhydrobiosis,” Comp. Biochem. Physiol.

References | 115
- A Mol. Integr. Physiol., vol. 131, no. 3, pp. 505–513, 2002.
[55] D. T. Welsh and R. A. Herbert, “Osmotically induced intracellular trehalose, but not glycine betaine
accumulation promotes desiccation tolerance in Escherichia coli,” FEMS Microbiol. Lett., vol. 174,
no. 1, pp. 57–63, 1999.
[56] D. Billi and M. Potts, “Life and death of dried prokaryotes,” Res. Microbiol., vol. 153, no. 1, pp. 7–
12, 2002.
[57] R. Pisano, D. Fissore, A. A. Barresi, and M. Rastelli, “Quality by design: scale-up of freeze-drying
cycles in pharmaceutical industry.,” AAPS PharmSciTech, vol. 14, no. 3, pp. 1137–49, 2013.
[58] K. M. Hangos and I. T. Cameron, Process modelling and model analysis. Academic Press, 2001.
[59] H. A. B. te Braake, H. J. L. van Can, and H. B. Verbruggen, “Semi-mechanistic modeling of
chemical processes with neural networks,” Eng. Appl. Artif. Intell., vol. 11, no. 4, pp. 507–515,
1998.
[60] M. von Stosch, R. Oliveira, J. Peres, and S. Feyo de Azevedo, “Hybrid semi-parametric modeling
in process systems engineering: Past, present and future,” Comput. Chem. Eng., vol. 60, pp. 86–
101, 2014.
[61] S. Passot, I. C. Tréléa, M. Marin, M. Galan, G. J. Morris, and F. Fonseca, “Effect of controlled ice
nucleation on primary drying stage and protein recovery in vials cooled in a modified freeze-
dryer.,” J. Biomech. Eng., vol. 131, no. July 2009, p. 074511, 2009.
[62] H. Sadikoglu, “Optimal Control of the Primary Drying Stage of Freeze Drying of Solutions in Vials
Using Variational Calculus,” Dry. Technol., vol. 23, no. July 2014, pp. 33–57, 2005.
[63] P. Chouvenc, S. Vessot, J. Andrieu, and P. Vacus, “Optimization of the Freeze-Drying Cycle: A
New Model for Pressure Rise Analysis,” Dry. Technol., vol. 22, no. March 2015, pp. 1577–1601,

116 | Chapter 8
2004.
[64] S. A. Velardi and A. A. Barresi, “Development of simplified models for the freeze-drying process
and investigation of the optimal operating conditions,” Chem. Eng. Res. Des., vol. 86, no. 1 A, pp.
9–22, 2008.
[65] S. Rambhatla, R. Ramot, C. Bhugra, and M. J. Pikal, “Heat and mass transfer scale-up issues
during freeze drying: II. Control and characterization of the degree of supercooling.,” AAPS
PharmSciTech, vol. 5, no. 4, p. e58, 2004.
[66] K. Nakagawa and T. Ochiai, “A mathematical model of multi-dimensional freeze-drying for food
products,” J. Food Eng., vol. 161, pp. 55–67, 2015.
[67] A. a. Barresi, R. Pisano, V. Rasetto, D. Fissore, and D. L. Marchisio, “Model-Based Monitoring and
Control of Industrial Freeze-Drying Processes: Effect of Batch Nonuniformity,” Dry. Technol., vol.
28, no. February 2016, pp. 577–590, 2010.
[68] E. Y. Shalaev and G. Zografi, “How does residual water affect the solid-state degradation of drugs
in the amorphous state?,” J. Pharm. Sci., vol. 85, no. 11, pp. 1137–1141, 1996.
[69] C. Costantino, HR; Curley, JG; Hsu, “Determining the water sorption monolayer of lyophilized
pharmaceutical proteins,” J. Pharm. Sci., vol. 86, no. 12, pp. 1390–1393, 1997.
[70] S. Passot, S. Cenard, I. Douania, I. C. Tréléa, and F. Fonseca, “Critical water activity and
amorphous state for optimal preservation of lyophilised lactic acid bacteria,” Food Chem., vol. 132,
no. 4, pp. 1699–1705, 2012.
[71] A. Ganguly, A. A. Alexeenko, S. G. Schultz, and S. G. Kim, “Freeze-drying simulation framework
coupling product attributes and equipment capability: Toward accelerating process by equipment
modifications,” Eur. J. Pharm. Biopharm., vol. 85, no. 2, pp. 223–235, 2013.

References | 117
[72] S. Basu, U. S. Shivhare, A. S. Mujumdar, S. Basu, U. S. Shivhare, and A. S. Mujumdar, “Models
for Sorption Isotherms for Foods : A Review Models for Sorption Isotherms for Foods : A Review,”
Dry. Technol., vol. 24, no. 8, pp. 917–930, 2006.
[73] M. Xu, G. Chen, J. Fan, J. Liu, X. Xu, and S. Zhang, “Moisture sorption characteristics of freeze-
dried human platelets *,” J Zhejiang Univ-Sci B (Biomed Biotechnol., vol. 12, no. 3, pp. 210–218,
2011.
[74] E. K. Sahni and M. J. Pikal, “Modeling the Secondary Drying Stage of Freeze Drying :
Development and Validation of an Excel-Based Model,” J. Pharm. Sci., vol. 106, pp. 779–791,
2017.
[75] S. Adhami, A. Rahimi, and M. S. Hatamipour, “Comparison of quasi-steady-state and unsteady-
state formulations in a freeze dryer modeling,” Heat Mass Transf. und Stoffuebertragung, vol. 50,
no. 9, pp. 1291–1300, 2014.
[76] M. J. Pikal, S. Cardon, C. Bhugra, F. Jameel, and S. Rambhatla, “The Nonsteady State Modeling
of Freeze Drying : In-Process Product Temperature and Moisture Content Mapping and
Pharmaceutical Product The Nonsteady State Modeling of Freeze Drying : In-Process Product
Temperature and Moisture Content Mapping and Pharmace,” Pharm. Dev. Technol., vol. 7450, no.
778575344, 2005.
[77] W. K. Nastaj J, “Numerical model of freeze drying of random solids at two-region conductive–
radiative heating,” Inz. Chem. Proces., vol. 25, no. 1, pp. 109–121, 2004.
[78] H. Tu, WP; Chen, ML; Yang, ZR; Chen, “A mathematical model for freeze-drying,” Chinese J.
Chem. Eng., vol. 8, no. 2, pp. 118–122, 2000.
[79] R. Peczalski and J. Andrieu, “Freeze-Drying of Pharmaceutical Proteins in Vials: Modeling of
Freezing and Sublimation Steps,” Dry. Technol., vol. 24, no. 5, pp. 561–570, 2006.

118 | Chapter 8
[80] E. A. Boss, R. M. Filho, and E. C. Vasco De Toledo, “Freeze drying process: Real time model and
optimization,” Chem. Eng. Process. Process Intensif., vol. 43, no. 12, pp. 1475–1485, 2004.
[81] A. I. Liapis and R. Bruttini, “A theory for the primary and secondary drying stages of the freeze-
drying of pharmaceutical crystalline and amorphous solutes: comparison between experimental
data and theory,” Sep. Technol., vol. 4, no. 3, pp. 144–155, 1994.
[82] W. J. Mascarenhas, H. U. Akay, and M. J. Pikal, “A computational model for finite element
analysis of the freeze-drying process,” Comput. Methods Appl. Mech. Eng., vol. 148, no. 1–2, pp.
105–124, 1997.
[83] A. Sheehan, P; Liapis, “Modeling of the primary and secondary drying stages of the freeze drying
of pharmaceutical products in vials: Numerical results obtained from the solution of a dynamic and
spatially multi-dimensional lyophilization model for different operational policies,” Biotechnol.
Bioeng., vol. 60, no. 6, pp. 712–728, 1998.
[84] J. H. Nam and C. S. Song, “Numerical simulation of conjugate heat and mass transfer during
multi-dimensional freeze drying of slab-shaped food products,” Int. J. Heat Mass Transf., vol. 50,
no. 23–24, pp. 4891–4900, 2007.
[85] A. I. Liapis and R. Bruttini, “A mathematical model for the spray freeze drying process: The drying
of frozen particles in trays and in vials on trays,” Int. J. Heat Mass Transf., vol. 52, no. 1–2, pp.
100–111, 2009.
[86] I. C. Trelea, F. Fonseca, and S. Passot, “Dynamic Modelling of the Secondary Drying Stage of
Freeze-Drying Reveals Distinct Desorption Kinetics for Bound Water,” Dry. Technol., vol. 3937,
no. December, p. 150619113428004, 2015.
[87] I. C. Trelea, S. Passot, F. Fonseca, and M. Marin, “An Interactive Tool for the Optimization of
Freeze-Drying Cycles Based on Quality Criteria,” Dry. Technol., vol. 25, no. 5, pp. 741–751, 2007.

References | 119
[88] C. Sung, J. H. Nam, C. Kim, and S. T. Ro, “Temperature distribution in a vial during freeze-drying
of skim milk,” J. Food Eng., vol. 67, pp. 467–475, 2005.
[89] R. J. Litchfield and A. I. Liapis, “An adsorption-sublimation model for a freeze-dryer,” Chem. Eng.
Sci., vol. 34, pp. 1085–1090, 1979.
[90] M. J. Millman, a. I. Liapis, and J. M. Marchello, “An analysis of the lyophilization process using a
sorption-sublimation model and various operational policies,” AIChE J., vol. 31, no. 10, pp. 1594–
1604, 1985.
[91] M. J. Millman, A. I. Liapis, and J. M. Marchello, “Guidelines of the desirable operation of batch
freeze driers during the removal of free water,” J. Food Technol., vol. 19, pp. 725–738, 1984.
[92] H. Sadikoglu, A. I. Liapis, and O. K. Crosser, “Optimal Control of the Primary and Secondary
Drying Stages of Bulk Solution Freeze Drying in Trays,” Dry. Technol., vol. 16, no. 3–5, pp. 399–
431, 1998.
[93] F. Jafar and M. Farid, “Analysis of Heat and Mass Transfer in Freeze Drying,” Dry. Technol., vol.
21, no. July 2014, pp. 249–263, 2003.
[94] R. Liapis, A. I.; Bruttini, “Freeze-Drying of Pharmaceutical Crystalline and Amorphous Solutes in
Vials: Dynamic Multi-Dimensional Models of the Primary and Secondary Drying Stages and
Qualitative Features of the Moving Interface,” Dry. Technol., vol. 13, no. 1, pp. 43–72, 1995.
[95] H. Sadikoglu, “Optimal Control of the Secondary Drying Stage of Freeze Drying of Solutions in
Vials Using Variational Calculus Optimal Control of the Secondary Drying Stage,” Dry. Technol.,
vol. 23, no. 1–2, pp. 33–57, 2005.
[96] A. Gan, KH; Bruttini, R; Crosser, OK; Liapis, “Heating policies during the primary and secondary
drying stages of the lyophilization process in vials: Effects of the arrangement of vials in clusters of
square and hexagonal arrays on trays,” Dry. Technol., vol. 22, no. 7, pp. 1539–1575, 2004.

120 | Chapter 8
[97] A. A. Barresi, D. Fissore, and D. L. Marchisio, “Process Analytical Technology in Industrial Freeze-
Drying,” in Freeze Drying/ Lyophilization of Pharmaceutical and Biological Products, Informa,
2010, pp. 460–493.
[98] Z. H. Wang and M. H. Shi, “Numerical study on sublimation-condensation phenomena during
microwave freeze drying,” Chem. Eng. Sci., vol. 53, no. 18, pp. 3189–3197, 1998.
[99] P. I. Ravikovitch and A. V. Neimark, “Calculations of pore size distributions in nanoporous
materials from adsorption and desorption isotherms,” Stud. Surf. Sci. Catal., pp. 597–606, 2000.
[100] A. Grosman and C. Ortega, “Capillary condensation in porous materials. Hysteresis and
interaction mechanism without pore blocking/percolation process,” Langmuir, vol. 24, no. 8, pp.
3977–3986, 2008.
[101] C. M. Lastoskie and K. E. Gubbins, “Characterization of porous materials using density functional
theory and molecular simulation,” Stud. Surf. Sci. Catal., vol. 128, no. Characterisation of Porous
Solids V, pp. 41–50, 2000.
[102] M. K. Choudhary, K. C. Karki, and S. V. Patankar, “Mathematical modeling of heat transfer,
condensation, and capillary flow in porous insulation on a cold pipe,” Int. J. Heat Mass Transf., vol.
47, no. 26, pp. 5629–5638, 2004.
[103] G. A. Tompsett, L. Krogh, D. W. Griffin, and W. C. Conner, “Hysteresis and scanning behavior of
mesoporous molecular sieves,” Langmuir, vol. 21, no. 18, pp. 8214–8225, 2005.
[104] M. Hassan Ghajar and S. H. Hashemabadi, “CFD Simulation of Capillary Condensation during
Freeze Drying of Porous Material,” Chem. Eng. Technol., vol. 34, no. 7, pp. 1136–1142, 2011.
[105] S. M. Patel, S. Chaudhuri, and M. J. Pikal, “Choked flow and importance of Mach I in freeze-drying
process design,” Chem. Eng. Sci., vol. 65, no. 21, pp. 5716–5727, 2010.
References | 121
[106] A. A. Alexeenko, A. Ganguly, and S. L. Nail, “Computational analysis of fluid dynamics in
pharmaceutical freeze-drying,” J. Pharm. Sci., vol. 98, no. 9, pp. 3483–3494, 2009.
[107] A. Ganguly and A. A. Alexeenko, “Modeling and measurements of water-vapor flow and icing at
low pressures with application to pharmaceutical freeze-drying,” Int. J. Heat Mass Transf., vol. 55,
no. 21–22, pp. 5503–5513, 2012.
[108] M. Petitti, A. A. Barresi, and D. L. Marchisio, “CFD modelling of condensers for freeze-drying
processes,” Sadhana - Acad. Proc. Eng. Sci., vol. 38, no. 6, pp. 1219–1239, 2013.
[109] A. A. Rasetto, Valeria; Marchisio, Daniele L.; Fissore, Davide; Barresi, “On the Use of a Dual-
Scale Model to Improve Understanding of a Pharmaceutical Freeze-Drying Process,” J. Pharm.
Sci., vol. 99, no. 10, pp. 4337–4350, 2010.
[110] L. Ljung, “Black-box models from input-output measurements,” IMTC 2001. Proc. 18th IEEE
Instrum. Meas. Technol. Conf. Rediscovering Meas. Age Informatics (Cat. No.01CH 37188), vol.
1, no. 2, pp. 138–146, 2001.
[111] A. F. Gobi and W. Pedrycz, “Fuzzy modelling through logic optimization,” Int. J. Approx. Reason.,
vol. 45, no. 3, pp. 488–510, 2007.
[112] M. Sugeno and T. Yasukawa, “A Fuzzy-Logic-Based Approach to Qualitative Modeling,” IEEE
Trans. Fuzzy Syst., vol. I, no. I, pp. 7–31, 1993.
[113] Y. V. Todorov and T. D. Tsvetkov, “Volterra model predictive control of a lyophilization plant,” 2008
4th Int. IEEE Conf. Intell. Syst. IS 2008, vol. 2, pp. 2013–2018, 2008.
[114] E. N. Dragoi, S. Curteanu, and D. Fissore, “Freeze-drying modeling and monitoring using a new
neuro-evolutive technique,” Chem. Eng. Sci., vol. 72, pp. 195–204, 2012.
[115] P. Van Bockstal et al., “Mechanistic modelling of infrared mediated energy transfer during the

122 | Chapter 8
primary drying step of a continuous freeze-drying process,” Eur. J. Pharm. Biopharm., vol. 114, pp.
11–21, 2017.
[116] Ö. Cumhur, M. Şeker, and H. Sadıkoğlu, “Freeze drying of turkey breast meat : Mathematical
modeling and estimation of transport parameters,” Dry. Technol., vol. 34, no. 5, pp. 584–594,
2016.
[117] I. C. Trelea, S. Passot, M. Marin, and F. Fonseca, “Model for heat and mass transfer in freeze-
drying of pellets.,” J. Biomech. Eng., vol. 131, no. 7, p. 074501, 2009.
[118] T. Chitu, S. Vessot, R. Peczalski, J. Andrieu, B. Woinet, and A. Françon, “Influence of Operating
Conditions on the Freeze- Drying of Frozen Particles in a Fixed Bed and Modeling Data Influence
of Operating Conditions on the Freeze-Drying of Frozen Particles in a Fixed Bed and Modeling
Data,” Dry. Technol., vol. 33, no. 15–16, 2015.
[119] L. N. Mockus et al., “Quality by design in formulation and process development for a freeze-dried,
small molecule parenteral product: a case study,” Pharm. Dev. Technol., vol. 16, no. 6, pp. 549–
576, 2011.
[120] “International Conference on Harmonization (ICH). Guidance for industry: Q8 (R2) pharmaceutical
development,” 2009.
[121] L. X. Yu et al., “Understanding pharmaceutical quality by design.,” AAPS J., vol. 16, no. 4, pp.
771–83, 2014.
[122] J. A. Nail, Steven L.; Searles, “Elements of quality by design in development and scale-up of
freeze-dried parenterals,” Biopharm Int., vol. 21, no. 1, p. 44–+, 2008.
[123] R. Pisano, D. Fissore, and A. a. Barresi, “Quality by Design in the Secondary Drying Step of a
Freeze-Drying Process,” Dry. Technol., vol. 30, no. 11–12, pp. 1307–1316, 2012.

References | 123
[124] S. T. F. C. Mortier, P. J. Van Bockstal, J. Corver, I. Nopens, K. V. Gernaey, and T. De Beer,
“Uncertainty analysis as essential step in the establishment of the dynamic Design Space of
primary drying during freeze-drying,” Eur. J. Pharm. Biopharm., vol. 103, pp. 71–83, 2016.
[125] S. Nail et al., “Recommended Best Practices for Process Monitoring Instrumentation in
Pharmaceutical Freeze Drying — 2017,” AAPS PharmSciTech, vol. 18, no. 7, pp. 2379–2393,
2017.
[126] M. Yates, R. Moreno, M. Isabel, and C. Tallo, “Porosity of freeze-dried g -Al 2 O 3 powders,”
Ceram. Int., vol. 33, pp. 1165–1169, 2007.
[127] V. P. Oikonomopoulou, M. K. Krokida, and V. T. Karathanos, “The influence of freeze drying
conditions on microstructural changes of food products,” Procedia Food Sci., vol. 1, pp. 647–654,
2011.
[128] T. Jalanti, “Scanning Electron Microscopy: A Powerful Tool for Imaging Freeze-Dried Material,” in
Freeze Drying/Lyophilization of Pharmaceutical and Biological Products, 2010, pp. 372–382.
[129] R. Mousavi, T. Miri, P. W. Cox, and P. J. Fryer, “Imaging food freezing using X-ray
microtomography,” Int. J. Food Sci. Technol., vol. 42, no. 6, pp. 714–727, 2007.
[130] V. Vicent, P. Verboven, F. T. Ndoye, G. Alvarez, and B. Nicolaï, “A new method developed to
characterize the 3D microstructure of frozen apple using X-ray micro-CT,” J. Food Eng., vol. 212,
no. May, pp. 154–164, 2017.
[131] R. H. M. Hatley and F. Franks, “Applications of DSC in the development of improved freeze-drying
processes for labile biologicals,” J. Therm. Anal., vol. 37, pp. 1905–1914, 1991.
[132] I. Journal and D. Q. M. Craig, “Modulated temperature differential scanning calorimetry : a novel
approach to pharmaceutical thermal analysis,” Int. J. Pharm., vol. 135, pp. 13–29, 1996.
124 | Chapter 8
[133] I. Journal, “Optimization of Freeze Drying Cycle Protocol Using Real Time Microscopy and
Integrated Differential Thermal ...,” Int. Jpurnal Pharm. Technol., vol. 5, no. 7, 2012.
[134] H. Akan et al., “Infrared Thermography for Monitoring of Freeze-Drying Processes Instrumental
Developments and Preliminary Results,” Pharm. Drug Deliv. Pharm. Technol. Infrared, vol. 103,
pp. 2088–2097, 2014.
[135] Cameron P., Good Pharmaceutical Freeze-Drying Practice. Interpharm Press Inc., 1997.
[136] X. Tang, S. L. Nail, and M. J. Pikal, “Evaluation of Manometric Temperature Measurement, a
Process Analytical Technology Tool for Freeze-Drying: Part I, Product Temperature
Measurement,” AAPS PharmSciTech, vol. 7, no. 1, pp. 1–9, 2006.
[137] S. L. Milton, N; Pikal, M J; Roy, M L; Nail, “Evaluation of manometric temperature measurement as
a method of monitoring product temperature during lyophilization,” Pda J. Pharm. Sci. Technol.,
vol. 51, no. 1, pp. 7–16, 1997.
[138] S. Schneid and H. Gieseler, “Research Article Evaluation of a New Wireless Temperature Remote
Interrogation System (TEMPRIS) to Measure Product Temperature During Freeze Drying,” AAPS
PharmSciTech, vol. 9, no. 3, 2008.
[139] D. Nowak, P. Piechucka, D. Witrowa-rajchert, and A. Wiktor, “Impact of material structure on the
course of freezing and freeze-drying and on the properties of dried substance , as exempli fi ed by
celery,” J. Food Eng., vol. 180, pp. 22–28, 2016.
[140] S. M. Patel, T. Doen, and M. J. Pikal, “Determination of End Point of Primary Drying in Freeze-
Drying Process Control,” AA, vol. 11, no. 1, 2010.
[141] J. Grant Armstrong, “Use Of The Capacitance Manometer Gauge in Vacuum Freeze-Drying,” Pda
J. Pharm. Sci. Technol., vol. 34, no. 6, pp. 473–483, 1980.

References | 125
[142] A. Ganguly, J. Stewart, A. Rhoden, M. Volny, and N. Saad, “Mass spectrometry in freeze-drying:
Motivations for using a bespoke PAT for laboratory and production environment,” Eur. J. Pharm.
Biopharm., vol. 127, no. February, pp. 298–308, 2018.
[143] I. Vollrath, V. Pauli, W. Friess, A. Freitag, A. Hawe, and G. Winter, “Evaluation of heat flux
measurement as a new PAT monitoring tool in freeze drying,” J. Pharm. Sci., no. 96, pp. 1776–93,
2017.
[144] N. S. Rockland LB, “Fundamentals of Water Activity,” Food Tech, vol. 34, pp. 42–59, 1980.
[145] J. C. Nlay, E. Grim, M. Roscoe, and J. Westy, “Determination o f residual moisture in freeze ’ dried
viral vaccines : Karl Fischer , gravimetric and thermogravimetric methodologies *,” J. Biol. Stand.,
vol. 10, pp. 249–259, 1982.
[146] A. Kauppinen et al., “Validation of a multipoint near-infrared spectroscopy method for in-line
moisture content analysis during freeze-drying,” J. Pharm. Biomed. Anal., vol. 95, pp. 229–237,
2014.
[147] R. Iyer, S. K. Tomar, T. U. Maheswari, and R. Singh, “Streptococcus thermophilus strains :
Multifunctional lactic acid bacteria,” Int. Dairy J., vol. 20, no. 3, pp. 133–141, 2010.
[148] L. Eriksson, E. Johansson, N. Kettaneh-Wold, J. Trygg, C. Wikström, and S. Wold, Multi- and
Megavariate Data Analysis, 2nd ed. Umetrics Academy, 2006.
[149] R. Bro and A. K. Smilde, “Principal component analysis,” Anal. Methods, vol. 6, no. 9, pp. 2812–
2831, 2014.
[150] Salminen, Lactic Acid Bacteria. 2004.
[151] B. M. Corcoran, R. P. Ross, G. F. Fitzgerald, P. Dockery, and C. Stanton, “Enhanced survival of
GroESL-overproducing Lactobacillus paracasei NFBC 338 under stressful conditions induced by

126 | Chapter 8
drying,” Appl. Environ. Microbiol., vol. 72, no. 7, pp. 5104–5107, 2006.
[152] Y. Doleyres, I. Fliss, and C. Lacroix, “Increased stress tolerance of Bifidobacterium longum and
Lactococcus lactis produced during continuous mixed-strain immobilized-cell fermentation,” J.
Appl. Microbiol., vol. 97, no. 3, pp. 527–539, 2004.
[153] X. C. Meng, C. Stanton, G. F. Fitzgerald, C. Daly, and R. P. Ross, “Anhydrobiotics: The
challenges of drying probiotic cultures,” Food Chem., vol. 106, no. 4 SPEC. ISS., pp. 1406–1416,
2008.
[154] C. P. Champagne, N. Gardner, E. Brochu, and Y. Beaulieu, “The Freeze-Drying of Lactic Acid
Bacteria . A Review,” Can. Institue Food Sci. Technol., vol. 24, no. 3, pp. 118–128, 1991.
[155] Quast.D and Karel.M, “Dry Layer Permeability and Freeze-Drying Concentrated Rates in Fluid
Systems,” J. Food Sci., vol. 33, no. 1962, pp. 170–175, 1964.
[156] S. Zhai, R. Taylor, R. Sanches, and N. K. H. Slater, “Measurement of lyophilisation primary drying
rates by freeze-drying microscopy,” Chem. Eng. Sci., vol. 58, pp. 2313–2323, 2003.
[157] S. Zhai, “Model Based Studies of the Lyophilisation of Biological Materials,” University of
Cambridge, 2005.
[158] K. J. Kossacki and J. Leliwa-Kopystynski, “Temperature dependence of the sublimation rate of
water ice: Influence of impurities,” Icarus, vol. 233, pp. 101–105, 2014.
[159] R. Byron Bird, W. E. Stewart, and E. N. Lightfoot, Transport Phenomena, 2nd Editio. John Wiley &
Sons, 2002.
[160] R. N. Moghaddam and M. Jamiolahmady, “Slip flow in porous media,” Fuel, vol. 173, pp. 298–310,
2016.
References | 127
[161] A.V. Luikov, “Basic Properties of Capillary-Porous Bodies,” in Heat and Mass Transfer in Capillary-
Porous Bodies, Pergamon Press, 1966, pp. 189–232.
[162] R. E. Cunningham and R. J. J. Williams, Diffusion in Gases and Porous Media. New York, 1980.
[163] C.N. Satterfield, Mass Transfer in Heterogeneous Catalysis. M.I.T. Press., 1970.
[164] C. F. Borgognoni, J. da S. Bevilacqua, and R. N. de M. Pitombo, “Freeze-drying microscopy in
mathematical modeling of a biomaterial freeze-drying,” Brazilian J. Pharm. Sci., vol. 48, no. 2, pp.
203–210, 2012.
[165] P. Raman, “Freeze drying microscopy as a tool to study sublimation kinetics,” Loughborough
University, 2015.
[166] L. Schoeman, P. Williams, A. du Plessis, and M. Manley, “X-ray micro-computed tomography
(μCT) for non-destructive characterisation of food microstructure,” 2016.
[167] R. Mousavi, T. Miri, P. W. Cox, and P. J. Fryer, “A Novel Technique for Ice Crystal Visualization in
Frozen Solids Using X-Ray Micro-Computed Tomography,” Food Eng. Phys. Prop., vol. 70, no. 7,
pp. 223–229, 2005.
[168] R. Pisano, A. A. Barresi, L. C. Capozzi, G. Novajra, I. Oddone, and C. Vitale-Brovarone,
“Characterization of the mass transfer of lyophilized products based on X-ray micro-computed
tomography images,” Dry. Technol., vol. 35, no. 8, pp. 933–938, 2017.
[169] M. U. H. Joardder, A. Karim, C. Kumar, and R. J. Brown, Porosity: Establishing the Relationship
between Drying Parameters and Dried Food Quality. 2015.
[170] A. A. Flores and H. D. Goff, “Ice Crystal Size Distributions in Dynamically Frozen Model Solutions
and Ice Cream as Affected by Stabilizers,” J. Dairy Sci., vol. 82, no. 7, pp. 1399–1407, 1999.

128 | Chapter 8
[171] G. Smith, M. S. Arshad, E. Polygalov, and I. Ermolina, “An application for impedance spectroscopy
in the characterisation of the glass transition during the lyophilization cycle: The example of a 10%
w/v maltodextrin solution,” Eur. J. Pharm. Biopharm., vol. 85, no. 3 PART B, pp. 1130–1140, 2013.
[172] G. Smith, M. S. Arshad, E. Polygalov, and I. Ermolina, “Through-vial impedance spectroscopy of
the mechanisms of annealing in the freeze-drying of maltodextrin: The impact of annealing hold
time and temperature on the primary drying rate,” J. Pharm. Sci., vol. 103, no. 6, pp. 1799–1810,
2014.
[173] N. Harnkarnsujarit, K. Kawai, and T. Suzuki, “Impacts of freezing and molecular size on structure,
mechanical properties and recrystallization of freeze-thawed polysaccharide gels,” LWT - Food
Sci. Technol., vol. 68, pp. 190–201, 2016.
[174] A. Hottot, S. Vessot, and J. Andrieu, “A direct characterization method of the ice morphology.
Relationship between mean crystals size and primary drying times of freeze-drying processes,”
Dry. Technol., vol. 22, no. 8, pp. 2009–2021, 2004.
[175] J. A. Searles, J. F. Carpenter, and W. R. Theodore, “The ice nucleation temperature determines
the primary drying rate of lyophilisation for samples frozen on a temperature controlled shelf,” J.
Pharm. Sci., vol. 90, no. 7, pp. 860–871, 2001.
[176] F. A. N. Fernandes, M. I. Gallão, and S. Rodrigues, “Effect of osmotic dehydration and ultrasound
pre-treatment on cell structure: Melon dehydration,” LWT - Food Sci. Technol., vol. 41, no. 4, pp.
604–610, 2008.
[177] S. Prachayawarakorn, P. Prakotmak, and S. Soponronnarit, “Effects of pore size distribution and
pore-architecture assembly on drying characteristics of pore networks,” Int. J. Heat Mass Transf.,
vol. 51, no. 1–2, pp. 344–352, 2008.
[178] P. Prakotmak, S. Soponronnarit, and S. Prachayawarakorn, “Modelling of moisture diffusion in
pores of banana foam mat using a 2-D stochastic pore network: Determination of moisture
diffusion coefficient during adsorption process,” J. Food Eng., vol. 96, no. 1, pp. 119–126, 2010.

References | 129
[179] O. D. Baik and M. Marcotte, “Modeling the moisture diffusivity in a baking cake,” J. Food Eng., vol.
56, no. 1, pp. 27–36, 2003.
[180] P. Foerst, M. Vorhauer, N. Schuchmann, and E. Tsotsas, “Experimental investigation on pore size
distribution and drying kinetics during lyophilization of sugar solutions,” in 21st International Drying
Symposium, 2018.
[181] T. Metzger and E. Tsotsas, “Influence of pore size distribution on drying kinetics: A simple capillary
model,” Dry. Technol., vol. 23, no. 9–11, pp. 1797–1809, 2005.
[182] G. E. Mueller, “Radial porosity in packed beds of spheres,” Powder Technol., vol. 203, no. 3, pp.
626–633, 2010.
[183] S. C. Reyes and E. Iglesia, “Effective diffusivities in catalyst pellets: new model porous structures
and transport simulation techniques,” J. Catal., vol. 129, no. 2, pp. 457–472, 1991.
[184] A. Hottot, S. Vessot, and J. Andrieu, “Freeze drying of pharmaceuticals in vials: Influence of
freezing protocol and sample configuration on ice morphology and freeze-dried cake texture,”
Chem. Eng. Process. Process Intensif., vol. 46, no. 7, pp. 666–674, 2007.
[185] F. J. O’Brien, B. A. Harley, I. V. Yannas, and L. Gibson, “Influence of freezing rate on pore
structure in freeze-dried collagen-GAG scaffolds,” Biomaterials, vol. 25, no. 6, pp. 1077–1086,
2004.
[186] L. C. Capozzi, G. Boccardo, A. A. Barresi, and R. Pisano, “Computer-Aided Property Estimation of
Microparticles in Packed-Beds for Freeze-Drying Applications,” in The 20th International Drying
Symposium, 2016.
[187] V. Koganti, S. Luthra, and M. J. Pikal, “The Freeze-Drying Process: The Use of Mathematical
Modeling in Process Design, Understanding, and Scale-Up,” Chem. Eng. Pharm. Ind., 2011.
130 | Chapter 8
[188] G.-W. Oetjen and P. Haseley, Freeze-Drying. Wiley-VCH Verlag GmbH & Co. KGaA, Weinheim,
Germany, 2004.
[189] R. Feistel and W. Wagner, “Sublimation pressure and sublimation enthalpy of H2O ice Ih between
0 and 273.16 K,” Geochim. Cosmochim. Acta, vol. 71, no. 1, pp. 36–45, 2007.
[190] S. Zhao, N. Zhang, X. Zhou, and L. Zhang, “Particle shape effects on fabric of granular random
packing,” Powder Technol., vol. 310, pp. 175–186, 2017.
[191] C. R. A. Abreu, F. W. Tavares, and M. Castier, “Influence of particle shape on the packing and on
the segregation of spherocylinders via Monte Carlo simulations,” Powder Technol., vol. 134, no.
1–2, pp. 167–180, 2003.
[192] B. D. Lubachevsky and F. H. Stillinger, “Geometric properties of random disk packings,” J. Stat.
Phys., vol. 60, no. 5–6, pp. 561–583, 1990.
[193] L. K. Roth and H. M. Jaeger, “Optimizing packing fraction in granular media composed of
overlapping spheres,” Soft Matter, vol. 12, no. 4, pp. 1107–1115, 2016.
[194] A. Jaoshvili, A. Esakia, M. Porrati, and P. M. Chaikin, “Experiments on the Random Packing of
Tetrahedral Dice,” Phys. Rev. Lett., vol. 104, no. 18, pp. 1–4, 2010.
[195] J. D. Bernal, “A geometrical approach to the structure of liquids,” Nature, no. 4655, pp. 55–56,
1959.
[196] A. Donev et al., “Improving the Density of Jammed Disordered Packings Using Ellipsoids,”
Science (80-. )., vol. 303, no. 5660, pp. 990–993, 2004.
[197] J. Baker and A. Kudrolli, “Maximum and minimum stable random packings of Platonic solids,”
Phys. Rev. E - Stat. Nonlinear, Soft Matter Phys., vol. 82, no. 6, 2010.

References | 131
[198] H. P. Zhu, Z. Y. Zhou, R. Y. Yang, and A. B. Yu, “Discrete particle simulation of particulate
systems: A review of major applications and findings,” Chem. Eng. Sci., vol. 63, no. 23, pp. 5728–
5770, 2008.
[199] A. A. Barresi et al., “Model-Based Monitoring and Control of Industrial Freeze-Drying Processes :
Effect of Batch Nonuniformity Model-Based Monitoring and Control of Industrial Freeze-Drying
Processes : Effect of Batch Nonuniformity,” Dry. Te, vol. 28, no. 5, pp. 577–590, 2010.


Appendix A
Supplementary material to Chapter 4.
Figure 8.1.1 – 3D pore size distribution analyzed by µ-computed tomography.


Appendix B
Supplementary material to Chapter 6.
Figure B.1 – Maltodextrin 10 % w/w particle size distribution.
0%
5%
10%
15%
20%
25%
30%
35%
40%
45%
50%
0 -
60
0
60
0 -
10
00
10
00
- 1
80
0
18
00
- 2
50
0
25
00
- 3
15
0
31
50
- 4
00
0
40
00
- 5
00
0
+50
00
Particle diameter interval (µm)
Particle size distribution

Table B.1 - Morphological characteristics of each particle and of the free space between particles in the bed.
Particles
dparticle [mm] θparticle [-] dpore [μm] τparticle [-] Effparticle [%]
3,96 0.85 14 2 0.4
Free space between particles
Case Packbed [-] Vparticles [m3] Vbed [m3] θbed [-] dbed,pore [mm] τbed [-] Effbed [%]
Maltodextrin 30
0.64 8.96 x 10⁻⁴ 1.40 x 10⁻³ 0.36 0.74 √2 0.25
Maltodextrin 50
0.64 8.96 x 10⁻⁴ 1.40 x 10⁻³ 0.36 0.74 √2 0.25
ST-B 0.40 5.60 x 10⁻⁴ 1.40 x 10⁻³ 0.60 1.98 √2 0.42
ST-C 0.40 5.60 x 10⁻⁴ 1.40 x 10⁻³ 0.60 1.98 √2 0.42
ST-D 0.40 5.60 x 10⁻⁴ 1.40 x 10⁻³ 0.60 1.98 √2 0.42
ST-H 0.40 5.60 x 10⁻⁴ 1.40 x 10⁻³ 0.60 1.98 √2 0.42
Table B.2 - Calculated diffusion coefficients for each particle, for the free space between particles and the diffusion coefficients implemented in the CFD simulations.
Particles Free space between particles Unimodal Porous Domain
(CFD)
Case Deff,particle
[m2/s] Knbed
[-] Dkn,eff,bed
[m2/s] Dbulk,eff,bed
[m2/s] Deff,bed [m2/s]
Deff,porous
[m2/s] Deff,chamber
[m2/s]
Maltodextrin 30
2.13 x 10⁻³ 0.49 2.08 x 10⁻² 1.02 x 10⁻² 6.84 x 10⁻³ 3.83 x 10⁻³ 4.00 x 10⁻²
Maltodextrin 50
2.13 x 10⁻³ 0.29 2.08 x 10⁻² 6.12 x 10⁻³ 4.73 x 10⁻³ 3.06 x 10⁻³ 2.40 x 10⁻²
ST-B 2.14 x 10⁻³ 0.11 9.24 x 10⁻² 1.02 x 10⁻² 9.18 x 10⁻³ 6.36 x 10⁻³ 2.40 x 10⁻²
ST-C 2.09 x 10⁻³ 0.11 9.24 x 10⁻² 1.02 x 10⁻² 9.18 x 10⁻³ 6.35 x 10⁻³ 2.40 x 10⁻²
ST-D 2.16 x 10⁻³ 0.11 9.24 x 10⁻² 1.02 x 10⁻² 9.18 x 10⁻³ 6.37 x 10⁻³ 2.40 x 10⁻²
ST-H 2.15 x 10⁻³ 0.11 9.24 x 10⁻² 1.02 x 10⁻² 9.18 x 10⁻³ 6.37 x 10⁻³ 2.40 x 10⁻²