CONSENSUS FORECASTS - Liberty Utilities...Consensus Forecasts (ISSN: 0957-0950) is published by...
32
Contents Page Significant Changes in the Consensus ......................................... 2 Long-Term Forecasts (continued on page 28).....................3 Individual Country Forecasts United States ...................................... 4 Japan .................................................. 6 Germany ............................................. 8 France .............................................. 10 United Kingdom ................................ 12 Italy .................................................. 14 Canada ............................................. 16 Euro zone .......................................18 Netherlands ....................................... 20 Norway .............................................. 21 Spain ................................................ 22 Sweden ............................................. 23 Switzerland ....................................... 24 Austria, Belgium, Denmark, Egypt, Finland, Greece ................................ 25 Ireland, Israel, Nigeria, Portugal, Saudi Arabia, South Africa ................ 26 Foreign Exchange and Oil Price Forecasts ......................................... 27 Long-Term Forecasts (continued from page 3) ............ 28-29 World Economic Activity ................ 32 Survey Date April 12, 2010 Consensus Forecasts (ISSN: 0957-0950) is published by Consensus Economics Inc., 53 Upper Brook Street, London, W1K 2LT, United Kingdom Tel: (44 20) 7491 3211 Fax: (44 20) 7409 2331 Web: www.consensuseconomics.com Editor: Claire V. M. Hubbard Assistant Editor: Richard Potts Publisher: Philip M. Hubbard Every month, Consensus Economics surveys over 240 prominent financial and economic forecasters for their estimates of a range of variables including future growth, inflation, interest rates and exchange rates. More than 20 countries are covered and the reference data, together with analysis and polls on topical issues, is rushed to subscribers by express mail and e-mail. Survey Highlights © Copyright Consensus Economics Inc. 2010. All rights reserved. The contents of this publication, either in whole or in part, may not be reproduced, stored or transmitted in any form or by any means, electronic, photocopying, recording or otherwise without the prior written permission of the publisher. The Editor and Consensus Economics Inc., do not guarantee or take any responsibility for the information set forth herein, including the accuracy, completeness or timeliness of the forecasts or written analysis. This month's special survey is our regular compilation of Long- Term Forecasts (pages 2, 3, 28, and 29), with revised consen- sus expectations for the next 5-10 years. An unexpected bout of bad weather across Western Europe at the start of the year may have contributed to a slowdown in activity. Retail sales were particularly affected, with many countries posting large monthly declines in January. Nonethe- less, the OECD expects most of the G-7 economies to expand in Q1 2010, with the UK and Canada setting the pace. Germany, however, could be the exception and initially con- tract before bouncing back in Q2. The events in Greece have turned the spotlight on other high- deficit countries trying to get to grips with their finances. Spending cuts are being prepared with added urgency in Spain, while the deficit has been pushed to the forefront of the election campaign in the UK. The mixed start to the year for many economies, however, makes it unclear as to whether growth across Western Europe would be strong enough to survive the necessary withdrawal of government stimulus this year. Our next issue of Consensus Forecasts will be available by the end of the day on May 13 and will include forecasts for Corporate Profits and 10-Year Real Interest Rates. -6.0 -5.0 -4.0 -3.0 -2.0 -1.0 0.0 1.0 2.0 3.0 4.0 00 01 02 03 04 05 06 07 08 09 10 11 12 13 14 15 G-3 Long-Term GDP Growth Forecasts (see page 3) (% change over previous year) % change <Consensus Forecasts> Japan United States Germany CONSENSUS FORECASTS ® E-mail Edition: - © Consensus Economics Inc. All rights reserved. Under our agreement this publica- tion may not be reproduced (complete or partial), redistributed, stored in a public retrieval system or broadcast to persons other than the email subscriber without the prior written permission of Consensus Economics Inc.
Transcript of CONSENSUS FORECASTS - Liberty Utilities...Consensus Forecasts (ISSN: 0957-0950) is published by...

Contents
PageSignificant Changes in theConsensus ......................................... 2
Long-Term Forecasts(continued on page 28).....................3
Individual Country Forecasts
United States ...................................... 4Japan .................................................. 6Germany ............................................. 8France .............................................. 10United Kingdom ................................ 12Italy .................................................. 14Canada ............................................. 16
Euro zone .......................................18
Netherlands ....................................... 20Norway .............................................. 21Spain ................................................ 22Sweden ............................................. 23Switzerland ....................................... 24
Austria, Belgium, Denmark, Egypt,Finland, Greece ................................ 25Ireland, Israel, Nigeria, Portugal,Saudi Arabia, South Africa ................ 26
Foreign Exchange and Oil PriceForecasts ......................................... 27
Long-Term Forecasts(continued from page 3) ............ 28-29
World Economic Activity ................ 32
Survey DateApril 12, 2010
Consensus Forecasts (ISSN: 0957-0950) is published by Consensus Economics Inc.,53 Upper Brook Street, London, W1K 2LT, United KingdomTel: (44 20) 7491 3211 Fax: (44 20) 7409 2331 Web: www.consensuseconomics.com
Editor: Claire V. M. HubbardAssistant Editor: Richard PottsPublisher: Philip M. Hubbard
Every month, Consensus Economics surveys over 240 prominent financial and economicforecasters for their estimates of a range of variables including future growth, inflation, interestrates and exchange rates. More than 20 countries are covered and the reference data, togetherwith analysis and polls on topical issues, is rushed to subscribers by express mail and e-mail.
Survey Highlights
© Copyright Consensus Economics Inc. 2010. All rights reserved. The contents of this publication, either in whole or in part, may not be reproduced, stored or transmitted in any form or by any means,electronic, photocopying, recording or otherwise without the prior written permission of the publisher. The Editor and Consensus Economics Inc., do not guarantee or take any responsibility for theinformation set forth herein, including the accuracy, completeness or timeliness of the forecasts or written analysis.
This month's special survey is our regular compilation of Long-Term Forecasts (pages 2, 3, 28, and 29), with revised consen-sus expectations for the next 5-10 years.
An unexpected bout of bad weather across Western Europe atthe start of the year may have contributed to a slowdown inactivity. Retail sales were particularly affected, with manycountries posting large monthly declines in January. Nonethe-less, the OECD expects most of the G-7 economies to expandin Q1 2010, with the UK and Canada setting the pace.Germany, however, could be the exception and initially con-tract before bouncing back in Q2.
The events in Greece have turned the spotlight on other high-deficit countries trying to get to grips with their finances.Spending cuts are being prepared with added urgency in Spain,while the deficit has been pushed to the forefront of the electioncampaign in the UK. The mixed start to the year for manyeconomies, however, makes it unclear as to whether growthacross Western Europe would be strong enough to survive thenecessary withdrawal of government stimulus this year.
Our next issue of Consensus Forecasts will be available by
the end of the day on May 13 and will include forecasts for
Corporate Profits and 10-Year Real Interest Rates.
-6.0
-5.0
-4.0
-3.0
-2.0
-1.0
0.0
1.0
2.0
3.0
4.0
00 01 02 03 04 05 06 07 08 09 10 11 12 13 14 15
G-3 Long-Term GDP Growth Forecasts (see page 3)(% change over previous year)% change
<Consensus Forecasts>
Japan
UnitedStates
Germany
CONSENSUS FORECASTS®
E-mail Edition: - © Consensus Economics Inc. All rights reserved. Under our agreement this publica-tion may not be reproduced (complete or partial), redistributed, stored in a publicretrieval system or broadcast to persons other than the email subscriber without theprior written permission of Consensus Economics Inc.
© Copyright Consensus Economics Inc. 20102
SIGNIFICANT CHANGES IN THE LONG-TERM CONSENSUS APRIL 2010
1.0
1.2
1.4
1.6
1.8
2.0
2.2
2.4
2.6
2.8
3.0
3.2
3.4
Apr. '9
6
Oct. '9
6
Apr. '9
7
Oct. '9
7
Apr. '9
8
Oct. '9
8
Apr. '9
9
Oct. '9
9
Apr. '0
0
Oct. '0
0
Apr. '0
1
Oct. '0
1
Apr. '0
2
Oct. '0
2
Apr. '0
3
Oct. '0
3
Apr. '0
4
Oct. '0
4
Apr. '0
5
Oct. '0
5
Apr. '0
6
Oct. '0
6
Apr. '0
7
Oct. '0
7
Apr. '0
8
Oct. '0
8
Apr. '0
9
Oct. '0
9
Apr. '1
0
1.0
1.2
1.4
1.6
1.8
2.0
2.2
2.4
2.6
2.8
3.0
3.2
3.4
1.0
1.2
1.4
1.6
1.8
2.0
2.2
2.4
2.6
2.8
3.0
3.2
3.4
Apr. '9
6
Oct. '9
6
Apr. '9
7
Oct. '9
7
Apr. '9
8
Oct. '9
8
Apr. '9
9
Oct. '9
9
Apr. '0
0
Oct. '0
0
Apr. '0
1
Oct. '0
1
Apr. '0
2
Oct. '0
2
Apr. '0
3
Oct. '0
3
Apr. '0
4
Oct. '0
4
Apr. '0
5
Oct. '0
5
Apr. '0
6
Oct. '0
6
Apr. '0
7
Oct. '0
7
Apr. '0
8
Oct. '0
8
Apr. '0
9
Oct. '0
9
Apr. '1
0
1.0
1.2
1.4
1.6
1.8
2.0
2.2
2.4
2.6
2.8
3.0
3.2
3.4
0.0
0.2
0.4
0.6
0.8
1.0
1.2
1.4
1.6
1.8
2.0
2.2
2.4
2.6
2.8
3.0
3.2
3.4
Apr. '9
6
Oct. '9
6
Apr. '9
7
Oct. '9
7
Apr. '9
8
Oct. '9
8
Apr. '9
9
Oct. '9
9
Apr. '0
0
Oct. '0
0
Apr. '0
1
Oct. '0
1
Apr. '0
2
Oct. '0
2
Apr. '0
3
Oct. '0
3
Apr. '0
4
Oct. '0
4
Apr. '0
5
Oct. '0
5
Apr. '0
6
Oct. '0
6
Apr. '0
7
Oct. '0
7
Apr. '0
8
Oct. '0
8
Apr. '0
9
Oct. '0
9
Apr. '1
0
0.0
0.2
0.4
0.6
0.8
1.0
1.2
1.4
1.6
1.8
2.0
2.2
2.4
2.6
2.8
3.0
3.2
3.4
1.0
1.2
1.4
1.6
1.8
2.0
2.2
2.4
2.6
2.8
3.0
3.2
3.4
Apr. '9
6
Oct. '9
6
Apr. '9
7
Oct. '9
7
Apr. '9
8
Oct. '9
8
Apr. '9
9
Oct. '9
9
Apr. '0
0
Oct. '0
0
Apr. '0
1
Oct. '0
1
Apr. '0
2
Oct. '0
2
Apr. '0
3
Oct. '0
3
Apr. '0
4
Oct. '0
4
Apr. '0
5
Oct. '0
5
Apr. '0
6
Oct. '0
6
Apr. '0
7
Oct. '0
7
Apr. '0
8
Oct. '0
8
Apr. '0
9
Oct. '0
9
Apr. '1
0
1.0
1.2
1.4
1.6
1.8
2.0
2.2
2.4
2.6
2.8
3.0
3.2
3.4
See pages 3, 28 and 29 for data and page 30 for “Notes and Abbreviations.”
Germany – Long-Term 6-10 Year Forecasts(% change over previous year)% change
United Kingdom – Long-Term 6-10 Year Forecasts(% change over previous year)% change
United States – Long-Term 6-10 Year Forecasts(% change over previous year)% change
Japan – Long-Term 6-10 Year Forecasts(% change over previous year)% change
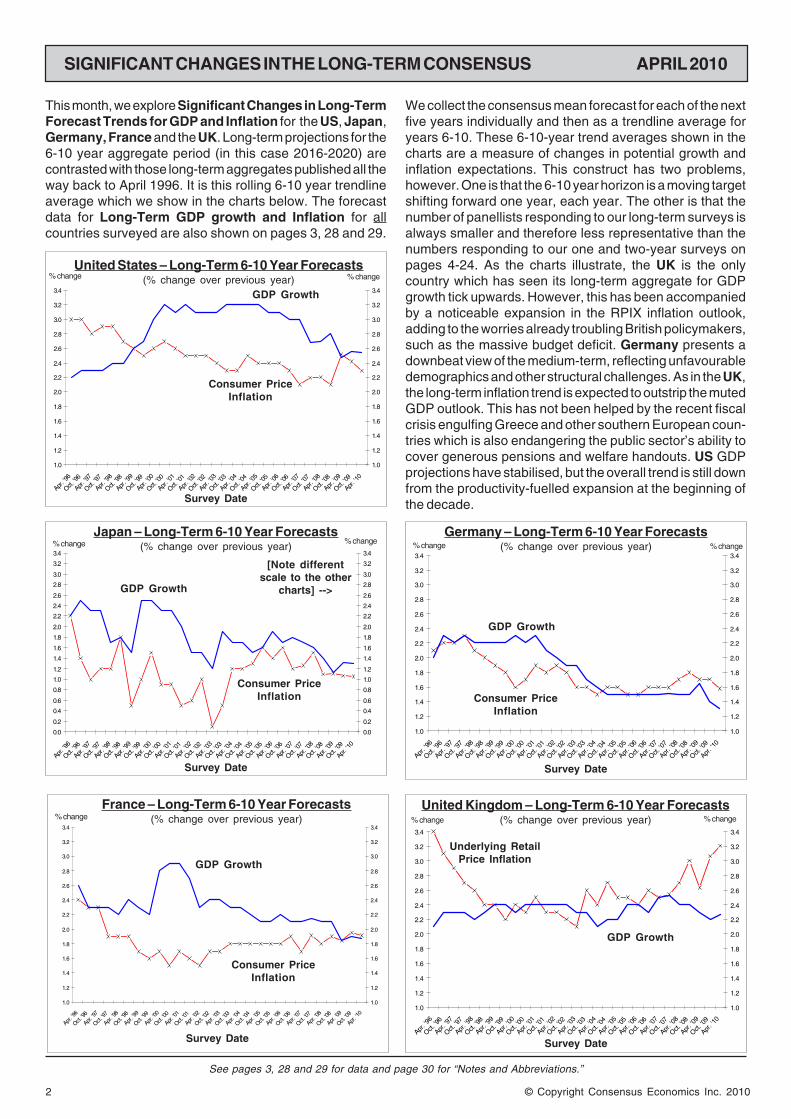
This month, we explore Significant Changes in Long-TermForecast Trends for GDP and Inflation for the US, Japan,Germany, France and the UK. Long-term projections for the6-10 year aggregate period (in this case 2016-2020) arecontrasted with those long-term aggregates published all theway back to April 1996. It is this rolling 6-10 year trendlineaverage which we show in the charts below. The forecastdata for Long-Term GDP growth and Inflation for allcountries surveyed are also shown on pages 3, 28 and 29.
Survey Date
GDP Growth
Consumer PriceInflation
Survey Date
GDP Growth
Consumer PriceInflation
Survey Date
GDP Growth
Consumer PriceInflation
Survey Date
GDP Growth
Underlying RetailPrice Inflation
We collect the consensus mean forecast for each of the nextfive years individually and then as a trendline average foryears 6-10. These 6-10-year trend averages shown in thecharts are a measure of changes in potential growth andinflation expectations. This construct has two problems,however. One is that the 6-10 year horizon is a moving targetshifting forward one year, each year. The other is that thenumber of panellists responding to our long-term surveys isalways smaller and therefore less representative than thenumbers responding to our one and two-year surveys onpages 4-24. As the charts illustrate, the UK is the onlycountry which has seen its long-term aggregate for GDPgrowth tick upwards. However, this has been accompaniedby a noticeable expansion in the RPIX inflation outlook,adding to the worries already troubling British policymakers,such as the massive budget deficit. Germany presents adownbeat view of the medium-term, reflecting unfavourabledemographics and other structural challenges. As in the UK,the long-term inflation trend is expected to outstrip the mutedGDP outlook. This has not been helped by the recent fiscalcrisis engulfing Greece and other southern European coun-tries which is also endangering the public sector’s ability tocover generous pensions and welfare handouts. US GDPprojections have stabilised, but the overall trend is still downfrom the productivity-fuelled expansion at the beginning ofthe decade.
[Note differentscale to the other
charts] -->
% change
% change
% change
% change
1.0
1.2
1.4
1.6
1.8
2.0
2.2
2.4
2.6
2.8
3.0
3.2
3.4
Apr. '9
6
Oct. '9
6
Apr. '9
7
Oct. '9
7
Apr. '9
8
Oct. '9
8
Apr. '9
9
Oct. '9
9
Apr. '0
0
Oct. '0
0
Apr. '0
1
Oct. '0
1
Apr. '0
2
Oct. '0
2
Apr. '0
3
Oct. '0
3
Apr. '0
4
Oct. '0
4
Apr. '0
5
Oct. '0
5
Apr. '0
6
Oct. '0
6
Apr. '0
7
Oct. '0
7
Apr. '0
8
Oct. '0
8
Apr. '0
9
Oct. '0
9
Apr. '1
0
1.0
1.2
1.4
1.6
1.8
2.0
2.2
2.4
2.6
2.8
3.0
3.2
3.4
France – Long-Term 6-10 Year Forecasts(% change over previous year)% change
Survey Date
GDP Growth
Consumer PriceInflation

© Copyright Consensus Economics Inc. 2010 3
APRIL 2010 LONG-TERM FORECASTS
2006 2007 2008 2009 2010 2011 2012 2013 2014 2015 2016-20201
Gross Domestic Product* 2.7 2.1 0.4 -2.4 3.2 3.1 3.4 3.2 3.0 2.8 2.5Personal Consumption* 2.9 2.7 -0.2 -0.6 2.2 2.5 2.7 2.6 2.7 2.6 2.4Business Investment* 7.9 6.2 1.6 -17.8 1.6 7.4 9.0 7.1 5.3 4.1 3.8Industrial Production* 2.3 1.5 -2.2 -9.7 4.9 4.9 4.3 3.8 3.2 2.9 2.9Consumer Prices* 3.2 2.9 3.8 -0.3 2.1 1.9 2.2 2.1 2.2 2.2 2.3Current Account Balance (USbn) -804 -727 -706 -420 -498 -545 -557 -553 -568 -598 -62410 Year Treasury Bond Yield, %2 4.7 4.2 2.4 3.8 4.0 3 4.5 4 5.1 5.2 5.4 5.5 5.4
Long-Term Forecasts for the G-7 and Western Europeindicate that it will take some time before some countriesreturn to pre-crisis rates of growth after last year’s traumaticrecession. The US and Canada are among the exceptions,with the US likely to see a 3.2% rebound in GDP this year andmaintain an optimum growth rate of +3.0% over the next fouryears. Individual sectors of the economy will take longer toextricate themselves from last year’s massive drop in output,however, and this is reflected in a noticeably more modestrebound in 2010 consumption and investment. A revival inproductivity on the back of the current cycle of job layoffsshould support the medium-term growth trend, although thelonger-term outlook has moderated. Of lingering concern isthe sizeable current account deficit, which shows little sign ofnarrowing through to 2020. This illustrates the country’sprivate debt burden which is, in turn, outstripped by anenormous Federal fiscal deficit. Both could take generationsto pay down and will act as an additional dampener on GDPfundamentals. Meanwhile, Canada’s resilience is reflected in (tables continued on pages 28-29)
Germany
In addition to their regular forecasts, country panellists were asked to provide longer-term forecasts covering the period until2020 for growth in real GDP, consumer spending, investment and industrial production, along with consumer price inflation,current account balances and long-term bond yields. All definitions correspond to those used in the individual country pages.
United StatesConsensus Forecasts
* % change over previous yearHistorical
JapanConsensus Forecasts* % change over previous year
Consensus Forecasts* % change over previous year
Historical
1Signifies average for period 2End period 3End July 2010 4End April 2011
2006 2007 2008 2009 2010 2011 2012 2013 2014 2015 2016-20201
Gross Domestic Product* 3.2 2.5 1.3 -5.0 1.6 1.7 1.6 1.4 1.5 1.3 1.3Private Consumption* 1.3 -0.3 0.4 0.2 -0.5 0.9 1.1 1.0 1.1 1.1 1.0Machinery & Eqpt Investment* 11.8 11.0 3.3 -20.5 1.4 4.1 4.9 4.0 3.5 2.3 2.2Industrial Production* 6.0 5.9 -0.1 -16.0 4.6 3.5 2.6 2.1 2.1 1.8 1.6Consumer Prices* 1.6 2.3 2.7 0.4 0.9 1.3 1.6 1.7 1.7 1.7 1.6Current Account Balance (Euro bn) 151 191 165 119 139 152 160 142 134 125 11210 Year Treasury Bond Yield, %2 4.0 4.3 3.0 3.4 3.4 3 3.8 4 4.3 4.3 4.3 4.3 4.2
2006 2007 2008 2009 2010 2011 2012 2013 2014 2015 2016-20201
Gross Domestic Product* 2.0 2.3 -1.2 -5.2 2.2 1.6 1.8 1.9 1.0 1.5 1.3
Private Consumption* 1.5 1.6 -0.6 -1.1 1.9 0.9 1.3 1.7 0.6 1.3 1.2
Business Investment* 2.4 2.3 -0.1 -19.3 0.4 5.0 4.5 4.2 2.7 2.9 2.5
Industrial Production* 4.2 2.9 -3.4 -22.3 15.3 5.0 4.0 3.0 1.1 1.5 1.9
Consumer Prices* 0.2 0.0 1.4 -1.4 -1.1 -0.2 0.2 0.5 1.4 0.7 1.1
Current Account Balance (¥tn) 19.8 24.8 16.4 13.3 16.6 17.6 19.3 20.0 20.6 19.8 17.9
10 Year Treasury Bond Yield, %2 1.7 1.5 1.2 1.3 1.4 3 1.5 4 1.9 2.1 2.2 2.2 2.3
1Signifies average for period 2End period 3End July 2010 4End April 2011
Historical
strong medium-term forecasts for spending, investment andproduction as well as GDP. Western European forecasts are,by contrast, muted, reflecting structural challenges such asthe aging workforce and widening pensions overhang. Spainis expected to suffer the weakest performance of all econo-mies surveyed over the next three years, contracting for asecond consecutive year in 2010 and averaging only 1.3%growth in 2011-2012. A worryingly large fiscal shortfall andlooming austerity measures are expected to rein in outputfurther. Italy has already posted a quarter of growth after GDPdeclined by 5.1% in 2009, but the economy is not expectedto hover far from the 1%-mark over the next 5-10 years. EvenGermany and France are not projected to touch 2% GDPgrowth over the current forecast horizon. Meanwhile, Japan– which suffered the deepest contraction last year of allcountries surveyed – is likely to see a 2.2% rebound this yearalthough that growth rate is unlikely to be maintained over therest of the forecast horizon.

APRIL 2010
© Copyright Consensus Economics Inc. 2010 4
3.9 4.4 2.7 3.4 1.0 9.0 na na 5.9 5.9 3.0 3.9 5.4 4.0 na na 12.3 15.1 0.70 1.023.6 3.1 2.1 2.1 3.0 8.6 20.0 9.0 5.8 4.3 2.0 2.5 4.0 1.5 1.6 1.8 11.8 13.6 0.70 1.003.5 3.2 2.2 2.6 4.3 8.6 19.3 6.0 6.1 6.0 2.0 1.7 4.0 2.2 na na 12.0 13.5 0.73 1.173.5 3.1 2.3 2.7 0.9 3.6 20.3 10.5 5.8 5.3 2.4 3.0 na na na na 11.0 11.5 0.70 0.903.5 3.5 2.4 2.8 2.5 8.8 na na 5.4 5.2 2.0 1.2 2.7 -1.2 na na na na 0.76 1.003.4 3.9 2.6 3.0 2.1 11.2 22.6 5.6 5.3 5.3 1.7 1.0 3.2 -0.3 na na 12.0 13.6 0.75 1.213.4 2.9 2.2 2.1 1.7 6.9 22.8 6.6 4.6 4.0 1.8 1.2 na na na na na na na na3.4 3.1 2.5 2.6 2.3 7.4 20.8 7.1 4.9 3.9 1.9 1.2 4.0 0.6 1.4 1.1 11.5 12.5 0.64 0.803.3 3.0 2.6 2.9 2.5 5.8 na na 5.1 5.8 1.6 1.5 2.8 2.3 2.2 2.3 na na 0.70 0.903.3 3.9 2.7 4.0 2.2 10.3 19.3 9.0 4.3 4.9 2.3 3.0 5.2 4.8 1.3 1.6 11.5 13.2 0.63 0.713.3 3.6 2.3 3.0 2.0 7.2 17.3 7.1 5.0 5.5 2.1 1.6 2.8 1.4 1.6 2.0 11.8 13.5 0.64 0.993.2 3.4 2.1 2.4 2.6 11.3 na na 5.1 6.8 2.1 1.5 na na na na 11.8 14.1 0.61 0.853.2 3.3 2.3 3.1 1.6 10.3 18.0 16.0 5.2 5.8 2.2 2.2 4.7 1.7 1.7 2.7 11.6 14.1 0.70 1.403.2 2.8 2.3 1.7 0.2 4.1 19.3 8.7 5.8 6.0 1.8 2.3 4.1 2.8 na na 11.9 12.0 0.59 0.633.2 3.7 2.3 3.0 2.3 8.9 18.5 7.9 5.9 7.0 2.0 2.0 3.5 0.3 na na 11.5 13.5 0.69 1.053.0 3.5 2.4 3.1 2.0 9.3 20.0 5.0 5.0 5.0 1.7 1.3 4.3 2.3 2.2 2.5 na na 0.67 0.903.0 3.0 2.4 2.7 1.7 7.6 15.6 7.8 5.1 4.7 1.9 2.0 3.3 1.3 1.9 2.2 11.8 13.8 0.67 1.193.0 2.5 1.9 2.0 1.1 6.8 13.7 8.0 4.4 5.7 2.3 2.4 4.7 3.5 1.2 1.7 11.1 12.1 0.65 0.823.0 na 2.1 na 0.2 na na na -2.6 na 2.3 na na na na na 12.2 na 0.61 na2.9 2.2 2.3 2.2 2.1 5.6 11.7 3.8 4.3 3.4 2.4 1.7 3.9 1.1 1.9 1.9 11.8 13.0 0.69 0.832.9 3.0 1.8 2.5 2.2 8.1 13.7 8.6 4.4 5.6 2.4 2.3 3.7 2.6 1.8 2.1 11.6 12.4 0.72 0.962.9 2.2 1.9 2.0 1.2 3.6 8.7 4.0 5.2 3.8 2.2 2.2 5.3 2.5 na na 11.6 11.9 0.63 0.682.9 2.7 1.9 1.8 2.8 10.8 13.9 5.3 5.7 5.0 2.1 1.9 3.8 1.0 na na 11.6 12.7 0.71 1.162.9 3.9 1.9 2.9 0.9 6.3 14.2 5.1 2.5 4.1 2.0 2.0 3.2 2.3 2.0 2.7 11.7 13.9 0.68 1.032.8 1.5 1.2 1.2 na na na na 8.0 1.3 1.6 1.3 2.6 2.2 na na 11.4 12.3 na na2.5 2.4 1.9 1.4 -3.5 2.3 8.6 8.7 5.1 4.4 1.9 0.8 4.7 1.7 1.3 0.9 11.2 11.9 0.63 0.842.5 1.9 1.9 1.6 -0.2 2.2 16.0 4.7 5.0 4.1 2.1 1.6 2.8 0.7 1.5 1.8 11.4 12.7 0.63 0.96
3.2 3.1 2.2 2.5 1.6 7.4 16.9 7.4 4.9 4.9 2.1 1.9 3.9 1.8 1.7 2.0 11.6 13.0 0.67 0.96
3.1 3.0 2.1 2.4 1.6 7.4 16.0 7.6 4.9 4.8 2.2 1.9 3.5 1.7 1.7 1.9 11.6 12.9 0.69 0.972.9 3.1 1.9 2.5 -0.7 7.2 14.6 7.2 4.4 4.8 2.2 1.9 2.7 1.8 1.7 1.9 11.8 13.1 0.73 1.043.9 4.4 2.7 4.0 4.3 11.3 22.8 16.0 8.0 7.0 3.0 3.9 5.4 4.8 2.2 2.7 12.3 15.1 0.76 1.402.5 1.5 1.2 1.2 -3.5 2.2 8.6 3.8 -2.6 1.3 1.6 0.8 2.6 -1.2 1.2 0.9 11.0 11.5 0.59 0.630.3 0.7 0.3 0.7 1.4 2.7 4.1 2.7 1.8 1.2 0.3 0.7 0.9 1.3 0.3 0.5 0.3 0.9 0.05 0.18
1.7 3.5 1.7 1.3 2.0 3.8 1.4 1.52.7 2.42.5 2.8 1.3 2.4 2.1 7.8 1.7 1.3
First Trust AdvisorsDuPontBarclays CapitalRDQ EconomicsFord Motor CorpMacroeconomic AdvisersCredit SuisseJP MorganUBSWells Capital MgmtNat Assn of Home BuildersBank of America - MerrillOxford EconomicsMorgan StanleySwiss ReGeneral MotorsIHS Global InsightWells FargoNorthern TrustGeorgia State UniversityEaton CorporationInforum - Univ of MarylandUniv of Michigan - RSQEMoody's Economy.comEcon Intelligence UnitGoldman SachsThe Conference Board
Consensus (Mean)
Last Month's Mean3 Months AgoHighLowStandard Deviation
Comparison ForecastsCBO (Aug. '09)OMB (Aug. '09)IMF (Jan. '10)OECD (Nov. '09)
Gross Domestic Product*Personal Consumption*Business Investment*Pre - Tax Corporate Profits*Industrial Production*Consumer Prices*Producer Prices*Employment Costs*Auto & Light Truck Sales (inc. imports), mnHousing Starts, mnUnemployment Rate, %Current Account, US$ bnFederal Budget Balance,
fiscal years, US$ bn3 mth Treasury Bill, % (end yr)10 Year Trsy Bond, % (end yr)
Historical Data
UNITED STATES
2010 2011 2010 2011 2010 2011 2010 2011 2010 2011 2010 20112010 2011 2010 2011 2010 2011
GrossDomesticProduct
Average % Change on Previous Calendar Year Annual Total
Government and Background DataPresident - Mr. Barack Obama (Democrat). Congress - The Demo-
crats have majorities in both the House of Representatives (lower
house) and the Senate (upper house). Next Elections - November 2010
(Congressional); November 2012 (Presidential and Congressional).
Nominal GDP - US$14,265bn (2008). Population - 311.7mn (mid-
year, 2008).
* % change on previous year
PersonalConsum-
ption
BusinessInvest-ment
Pre - TaxCorporate
Profits
IndustrialProduct-
ion
Con-sumerPrices
ProducerPrices
Employ-mentCosts
Auto &LightTruck
Sales (inc.imports,
mn units)
HousingStarts
(mn units)
Economic Forecasters
Percentage Change (year-on-year).
2006 2007 2008 20092.7 2.1 0.4 -2.42.9 2.7 -0.2 -0.67.9 6.2 1.6 -17.8
10.5 -4.1 -11.8 -3.82.3 1.5 -2.2 -9.73.2 2.9 3.8 -0.32.9 3.9 6.4 -2.53.1 3.4 3.0 1.7
16.5 16.1 13.2 10.31.81 1.34 0.90 0.55
4.6 4.6 5.8 9.3-804 -727 -706 -420
-248 -161 -459 -14174.9 3.3 0.1 0.1
4.7 4.2 2.4 3.8
2010 2011
Gross DomesticProduct
PersonalConsumption
ConsumerPrices
Quarterly Consensus ForecastsHistorical Data and Forecasts (bold italics) From Survey of
March 8, 20102009 2010 2011Q3 Q4 Q1 Q2 Q3 Q4 Q1 Q2 Q3 Q4
-2.6 0.1 2.5 3.5 4.0 3.3 3.4 3.4 3.1 3.2
-0.2 1.0 1.5 2.3 2.2 2.4 2.4 2.4 2.5 2.6
-1.6 1.5 2.5 2.4 2.0 1.8 1.9 2.0 2.0 2.1

APRIL 2010
5© Copyright Consensus Economics Inc. 2010
9.3 8.3 na na -1200 -950 0.2 1.8 4.3 5.09.5 8.9 na na -1500 -1100 0.3 2.3 4.3 5.09.4 8.3 -520 -613 -1250 -1075 0.2 1.0 4.1 4.69.6 9.2 na na -1400 -1100 0.2 0.5 4.3 5.29.6 8.7 na na -1313 -1257 1.0 2.8 4.3 5.09.5 8.5 -517 -622 -1383 -1217 0.2 0.4 4.0 4.59.5 8.9 -491 -511 -1430 -1229 na na 3.8 na9.5 9.1 -503 -572 -1500 -1200 na na na na9.6 9.5 -421 -471 -1290 -1100 0.2 0.9 3.8 4.19.8 8.8 -427 -492 -1475 -1050 0.1 1.2 4.3 5.29.6 8.9 -525 -630 -1349 -1250 0.2 0.5 4.0 4.59.4 9.2 -530 -600 -1250 -825 na na na na9.7 9.1 -493 -511 -1446 -1387 0.2 1.8 3.9 5.09.7 9.3 -541 -661 -1325 -1160 0.4 2.2 4.6 5.59.6 8.7 -354 -373 -1488 -1200 0.2 0.3 3.8 3.99.6 9.0 -530 -630 -1362 -1215 0.2 1.0 3.9 4.79.6 9.0 -526 -579 -1392 -1083 0.4 1.8 4.0 4.19.9 9.5 -550 -595 -1455 -1323 0.2 1.3 4.2 4.49.8 na na na na na 0.1 0.8 3.5 4.49.9 9.5 -576 -612 -1377 -1138 0.5 1.8 4.1 4.99.6 8.9 na na -1450 -1175 0.3 2.1 3.8 4.39.6 9.3 na na na na 0.3 1.3 3.9 4.89.5 9.1 na na na na 0.2 0.8 3.7 3.7
10.0 9.5 -482 -473 -1365 -1085 0.3 1.2 3.9 4.79.7 9.3 -463 -447 -1645 -1636 na na na na9.8 10.1 -458 -367 -1641 -1396 0.3 0.3 3.5 3.39.7 9.7 -552 -591 -1339 -1171 0.2 0.3 3.7 4.0
9.6 9.1 -498 -545 -1401 -1180 0.3 1.2 4.0 4.5
9.7 9.2 -502 -559 -1403 -117510.0 9.3 -504 -568 -1378 -115510.0 10.1 -354 -367 -1200 -825 1.0 2.8 4.6 5.59.3 8.3 -576 -661 -1645 -1636 0.1 0.3 3.5 3.30.2 0.4 54 88 110 159 0.2 0.7 0.3 0.5
10.2 9.1 -1381 -9219.8 8.6 -1502 -1123
9.9 9.1
Rates on Survey Date
-3-2-10123456
91 92 93 94 95 96 97 98 99 00 01 02 03 04 05 06 07 08 09 10 11 12 13 14 15
Major Import Suppliers(% of Total)
China 16.5Canada 15.7Mexico 10.1Asia (ex. Japan) 22.8Latin America 17.8Africa 5.1
Major Export Markets(% of Total)
Canada 20.1Mexico 11.7China 5.5Latin America 22.2Asia (ex. Japan) 10.3Middle East 3.8
UNITED STATES
Real Growth and Inflation
YearAverage
2010 2011 2010 2011
Annual Total Fiscal Years(Oct-Sep)
Direction of Trade – 2008
%
Unemploy-ment
Rate (%)
CurrentAccount(US$ bn)
FederalBudgetBalance
(US$ bn)1
3 monthTreasury
Bill Rate (%)
10 YearTreasury
BondYield (%)
End EndJul’10 Apr’11
FY FY09-10 10-11
<Forecast>
0.2% 3.9%Recovery Spreads from Industry to Other SectorsPayroll employment finally registered a significant gain of162,000 jobs, its best monthly showing in more than twoyears. In addition, revisions to the data over previous monthsindicated that 62,000 more jobs were added to the economythan previously thought. The news suggests that the privatesector finally feels confident enough in the recovery to begintentatively hiring again. While the jobs market does indeedappear to have turned a corner, it remains soft in comparisonwith the cyclical highs of the previous expansion. Detractorspoint to the fact that unemployment is unchanged at 9.7% forthe third consecutive month. However, our panel’s forecastsfor this variable continue to trend downward. Elsewhere, realpersonal expenditure picked up from 0.2% (m-o-m) in Januaryto 0.3% the following month, with upbeat auto sales under-scoring the gradual strengthening in consumer activity. Eventhe housing market is starting to exhibit some improvement.Personal consumption expectations have risen while, in turn,the consensus for 2010 GDP growth has edged up on the backof both domestic demand and industry.
While it is clear that the economic turnaround continued in Q1,uncertainty still hangs over the course of policy. This hasbeen highlighted by divisions among Fed policymakers overthe outlook for the CPI. Low interest rates have sparked fearsof higher inflation over the medium-term, but some havesuggested that inflation could slow further. Indeed, headlineconsumer prices were flat m-o-m in February and rose by only0.1% in March. Meanwhile, core PCE prices remained flat inFebruary, while the annual rate stood at 1.3%. CPI forecastsare tracking downward as a result, and our panel predicts thatinflation will moderate going into 2011, too.
1.4
1.6
1.8
2.0
2.2
2.4
2.6
2.8
3.0
3.2
2009Jan FebMar Apr May Jun Jul Aug Sep OctNov Dec
2010Jan FebMar Apr
GDP Growth and Inflation ForecastsConsensus Forecasts from Survey of:
%
2010 ConsumerPrice InflationForecasts (%)
2010 Real GDPGrowth
Forecasts (%)
End EndJul’10 Apr’11
US Fed Funds Rate – April 12, 2010 = between 0%-0.25%
0.16% 0.26% 0.54% 0.91%
0.125% 0.125% 0.125% 1.00%
ConsensusMean Average:
Mode (mostfrequent forecast):
FORECASTS End June End Sep. End Dec. End Mar.2010 2010 2010 2011
Real GDP (% chg yoy) Consumer Prices (% chg yoy)

APRIL 2010
© Copyright Consensus Economics Inc. 2010 6
Deutsche SecuritiesCredit SuisseMorgan StanleyJP Morgan - JapanMerrill Lynch - JapanMizuho SecuritiesNikko CitigroupJapan Tech Info Services CorpJapan Ctr for Econ ResearchGoldman SachsNLI Research InstituteNomura SecuritiesBank of Tokyo-Mitsubishi UFJUBSMitsubishi UFJ ResearchDaiwa Institute of ResearchMitsubishi Research InstituteIHS Global InsightITOCHU InstituteHSBCMizuho Research InstituteToyota Motor CorporationEcon Intelligence Unit
Consensus (Mean)
Last Month's Mean3 Months AgoHighLowStandard Deviation
Comparison ForecastsIMF (Jan. '10)OECD (Nov. '09)
2.8 0.9 1.3 0.0 0.1 4.2 18.0 1.9 -1.2 -0.6 -0.2 1.2 1.3 0.8 na na 0.80 0.822.8 1.1 2.4 0.7 0.7 2.7 14.5 2.6 -0.9 -0.5 na na na na na na na na2.7 1.6 2.4 1.3 -0.2 2.9 16.6 5.9 -0.9 0.0 -0.4 -0.3 na na na na na na2.6 1.9 2.5 1.1 1.8 5.1 18.6 12.1 -1.2 -0.3 -0.1 1.3 na na na na na na2.6 2.1 2.1 1.4 0.0 5.6 12.1 4.8 -0.9 0.0 na na na na na na na na2.4 2.9 1.7 0.9 3.3 10.3 21.7 7.0 -1.1 -0.5 -1.8 -0.8 0.3 1.6 na na 0.85 0.952.4 1.9 2.4 1.5 1.0 4.6 16.1 4.7 -0.8 -0.1 na na na na na na na na2.4 2.3 2.7 3.3 1.4 6.1 15.4 3.8 -0.8 0.0 1.2 0.5 1.7 2.9 3.1 3.0 0.87 0.932.2 1.3 2.1 0.7 -0.1 3.4 15.6 3.6 -1.2 -0.5 -0.7 -0.4 -0.3 -0.3 na na 0.83 0.842.2 1.7 2.8 0.5 0.8 6.4 13.2 5.1 -1.4 -0.4 -2.5 0.6 na na na na na na2.2 1.9 1.2 0.9 0.1 5.2 14.9 6.8 -1.1 0.0 -0.4 0.8 -1.7 -1.0 na na 0.88 0.932.1 2.3 1.5 0.8 2.2 9.5 14.8 8.3 -1.0 -0.4 -1.7 0.7 0.6 0.5 na na na na2.0 1.1 2.1 0.3 -1.2 2.0 16.4 5.1 -1.3 -0.1 -1.5 0.4 na na na na 0.86 0.922.0 1.4 1.7 1.4 1.2 7.5 13.2 5.0 -1.6 -0.2 na na na na na na na na2.0 0.9 1.8 -0.2 0.7 4.9 13.8 1.4 -1.1 0.0 -0.4 0.8 -0.2 0.3 na na 0.84 0.881.9 1.9 1.9 1.2 -0.9 4.3 14.9 5.0 na na 1.0 0.4 na na na na na na1.9 1.4 1.8 0.5 -0.7 4.5 17.2 5.1 -0.9 -0.4 -1.0 -0.6 na na na na 0.78 0.811.9 1.2 2.0 0.5 1.1 6.1 17.0 6.4 -0.7 -0.4 -0.9 -1.4 na na na na 0.89 1.031.8 2.0 1.4 0.5 -0.5 6.1 15.0 4.4 -1.4 -0.4 -0.7 0.7 -0.3 0.2 2.9 2.7 0.81 0.881.7 1.3 1.7 1.0 -1.4 2.0 15.1 5.1 -1.3 -0.7 -0.5 -0.3 na na na na na na1.7 1.2 1.3 0.4 -0.8 3.3 14.7 3.0 -0.6 -0.1 -0.7 0.6 -0.9 -0.3 na na 0.83 0.891.7 1.3 1.3 1.0 -1.0 3.5 13.0 5.0 -0.8 0.0 -1.3 -0.5 0.8 0.5 2.8 2.5 0.85 0.901.5 1.1 1.6 1.3 na na 10.6 2.0 -1.0 0.6 -0.5 1.2 na na 4.3 4.4 na na
2.2 1.6 1.9 0.9 0.4 5.0 15.3 5.0 -1.1 -0.2 -0.7 0.3 0.1 0.5 3.3 3.1 0.84 0.90
1.9 1.6 1.5 0.9 -0.1 4.8 14.1 4.9 -1.1 -0.3 -1.2 0.0 -0.3 0.5 3.3 3.2 0.84 0.901.3 1.5 1.2 0.9 -1.6 4.1 11.7 4.7 -1.0 -0.3 -1.6 0.0 -0.7 0.3 3.7 3.5 0.81 0.882.8 2.9 2.8 3.3 3.3 10.3 21.7 12.1 -0.6 0.6 1.2 1.3 1.7 2.9 4.3 4.4 0.89 1.031.5 0.9 1.2 -0.2 -1.4 2.0 10.6 1.4 -1.6 -0.7 -2.5 -1.4 -1.7 -1.0 2.8 2.5 0.78 0.810.4 0.5 0.5 0.7 1.2 2.2 2.3 2.3 0.3 0.3 0.9 0.8 1.0 1.1 0.7 0.9 0.03 0.06
1.7 2.21.8 2.0 1.2 1.2 -0.9 -0.5
* % change on previous year
Gross Domestic Product*Private Consumption*Business Investment*Industrial Production*Consumer Prices*Domestic Corporate Goods Prices*Total Cash Earnings (nominal)*New Car Registrations, mnHousing Starts, mnUnemployment Rate, %Current Account, ¥tnGeneral Govt Budget Balance,
SNA basis, fisc. years, ¥tn3 mth CD's, % (end yr)10 Yr Govt Bond, % (end yr)
Historical Data
2010 2011 2010 2011 2010 2011 2010 2011 2010 2011 2010 2011 2010 2011 2010 2011 2010 2011
JAPAN
Average % Change on Previous Calendar Year
Economic Forecasters
Percentage Change (year-on-year).
Government and Background Data
Prime Minister - Mr. Yukio Hatoyama of the Democratic Party ofJapan (DPJ). Parliament - The DPJ has negotiated a coalition with twosmaller parties in the lower House of Representatives, or Shugiin (318out of 480 seats). Next Elections - July 2010 (upper house). NominalGDP - ¥507.3tn (2008). Population - 127.3mn (mid-year, 2008). Yen/$ Exchange Rate - 103.4 (average, 2008).
e = consensus estimate based on latest survey
GrossDomesticProduct
PrivateConsump-
tion
BusinessInvestment
IndustrialProduction
ConsumerPrices
DomesticCorporate
GoodsPrices
Total CashEarnings(nominal)
New CarRegistra-tions (mn)
HousingStarts(mn)
Annual Total
2006 2007 2008 20092.0 2.3 -1.2 -5.21.5 1.6 -0.6 -1.12.4 2.3 -0.1 -19.34.2 2.9 -3.4 -22.30.2 0.0 1.4 -1.42.1 1.8 4.6 -5.20.2 -1.0 -0.3 -3.93.1 3.0 2.8 2.7
1.29 1.06 1.09 0.794.1 3.9 4.0 5.1
19.8 24.8 16.4 13.3
-5.1 -15.1 -15.3 -47.5e
0.5 0.8 0.8 0.81.7 1.5 1.2 1.3
新設住宅
Quarterly Consensus ForecastsHistorical Data and Forecasts (bold italics) From Survey of
March 8, 20102009 2010 2011Q3 Q4 Q1 Q2 Q3 Q4 Q1 Q2 Q3 Q4
Gross DomesticProduct
PrivateConsumption
ConsumerPrices
-4.9 -0.9 2.6 1.7 2.1 1.3 1.4 1.6 1.6 1.8
-0.4 1.0 2.5 1.5 1.3 0.9 0.8 0.9 0.8 0.9
-2.2 -2.1 -1.2 -1.2 -1.1 -0.8 -0.7 -0.3 -0.2 -0.2
APRIL 2010
7© Copyright Consensus Economics Inc. 2010
4.7 4.5 21.0 26.6 -29.2 -31.6 0.3 0.3 1.4 1.44.9 4.8 16.7 17.7 na na 0.5 0.5 1.4 na4.7 4.4 16.7 14.9 na na na na 1.3 1.54.8 4.6 13.9 11.7 -46.3 -47.5 na na 1.4 1.65.0 4.2 13.3 na na na na na 1.5 1.75.1 4.0 17.2 17.6 -44.0 -35.0 0.4 0.4 1.3 1.35.1 4.9 16.3 16.7 -45.3 -49.0 na na 1.4 1.64.8 4.4 12.5 13.1 na na 0.9 1.2 1.4 1.54.9 4.7 13.2 11.5 -42.7 -46.1 na na 1.4 1.55.1 4.9 11.6 8.4 na na na na 1.5 2.05.1 4.8 15.3 19.2 na na 0.7 1.0 1.5 1.65.0 4.6 20.9 21.0 -41.8 -43.9 na na 1.5 1.64.9 4.8 13.3 15.1 na na na na 1.4 1.75.1 4.5 18.9 20.6 na na na na na na5.1 4.9 16.4 17.2 na na 0.5 0.5 1.4 1.55.0 4.7 25.3 28.6 na na na na na na4.9 4.8 16.8 17.5 na na na na 1.4 1.54.5 5.0 15.1 13.9 na na 0.8 0.8 1.5 1.55.0 4.4 16.8 22.6 na na 0.8 0.8 1.4 1.64.9 4.8 19.4 22.1 na na na na 1.3 1.35.0 4.7 16.7 17.3 na na na na 1.2 1.25.5 5.2 17.0 17.0 na na 0.8 0.8 1.5 1.55.2 5.2 na na na na na na na na
5.0 4.7 16.6 17.6 -41.6 -42.2 0.6 0.7 1.4 1.5
5.1 4.8 16.8 18.1 -40.8 -43.45.4 5.1 16.2 17.1 -39.1 -41.45.5 5.2 25.3 28.6 -29.2 -31.6 0.9 1.2 1.5 2.04.5 4.0 11.6 8.4 -46.3 -49.0 0.3 0.3 1.2 1.20.2 0.3 3.2 4.9 6.3 7.2 0.2 0.3 0.1 0.2
5.6 5.4
-6
-4
-2
0
2
4
91 92 93 94 95 96 97 98 99 00 01 02 03 04 05 06 07 08 09 10 11 12 13 14 15
Major Export Markets(% of Total)
United States 17.8China 16.0South Korea 7.6Asia (inc. the above) 27.4Latin America 5.0Middle East 4.4
JAPAN
Real Growth and Inflation
YearAverage Annual Total
Fiscal Years(Apr-Mar)
2010 2011 2010 2011
Rates on Survey Date
Direction of Trade – 2008Major Import Suppliers
(% of Total)China 18.9United States 10.4Saudi Arabia 6.7Asia (inc. the above) 32.9Middle East 22.0Latin America 3.4
%
Unemploy-ment
Rate (%)
CurrentAccount
(¥tn)
GeneralGovernment
BudgetBalance (¥tn)
3 monthYen Cert ofDeposit (%)
10 YearGovt BondYield (%)
<Forecast>
0.8% 1.4%
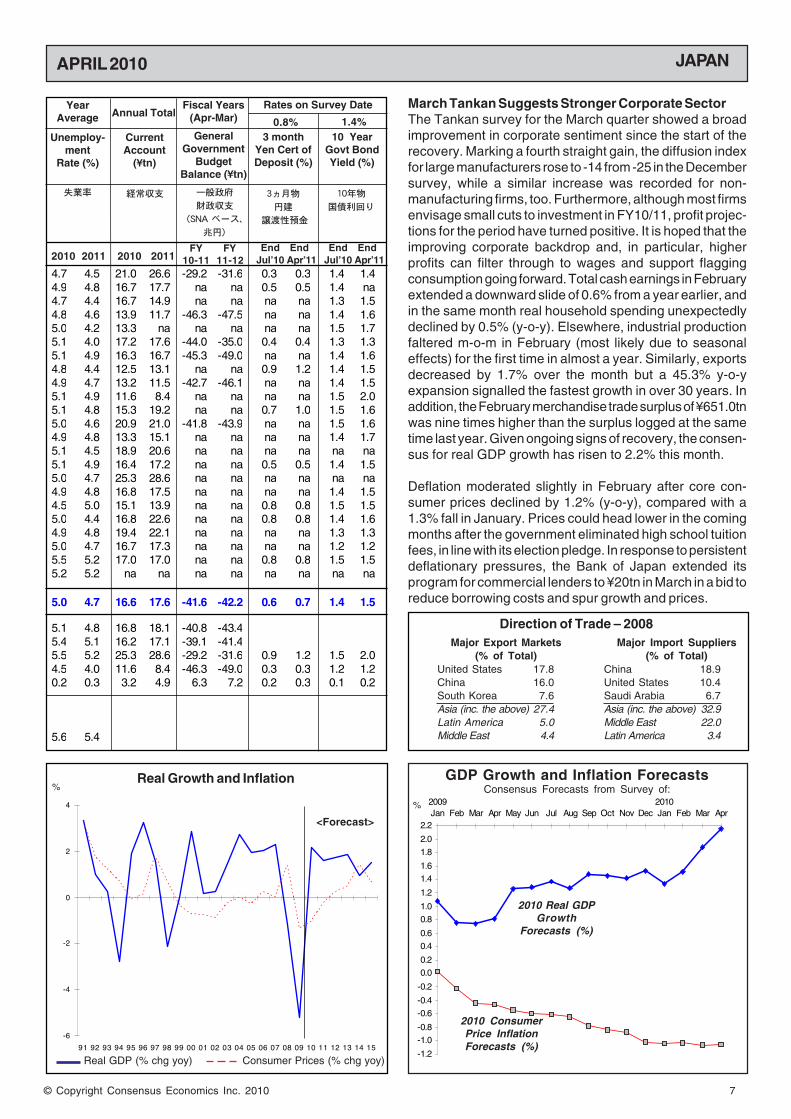
March Tankan Suggests Stronger Corporate SectorThe Tankan survey for the March quarter showed a broadimprovement in corporate sentiment since the start of therecovery. Marking a fourth straight gain, the diffusion indexfor large manufacturers rose to -14 from -25 in the Decembersurvey, while a similar increase was recorded for non-manufacturing firms, too. Furthermore, although most firmsenvisage small cuts to investment in FY10/11, profit projec-tions for the period have turned positive. It is hoped that theimproving corporate backdrop and, in particular, higherprofits can filter through to wages and support flaggingconsumption going forward. Total cash earnings in Februaryextended a downward slide of 0.6% from a year earlier, andin the same month real household spending unexpectedlydeclined by 0.5% (y-o-y). Elsewhere, industrial productionfaltered m-o-m in February (most likely due to seasonaleffects) for the first time in almost a year. Similarly, exportsdecreased by 1.7% over the month but a 45.3% y-o-yexpansion signalled the fastest growth in over 30 years. Inaddition, the February merchandise trade surplus of ¥651.0tnwas nine times higher than the surplus logged at the sametime last year. Given ongoing signs of recovery, the consen-sus for real GDP growth has risen to 2.2% this month.
Deflation moderated slightly in February after core con-sumer prices declined by 1.2% (y-o-y), compared with a1.3% fall in January. Prices could head lower in the comingmonths after the government eliminated high school tuitionfees, in line with its election pledge. In response to persistentdeflationary pressures, the Bank of Japan extended itsprogram for commercial lenders to ¥20tn in March in a bid toreduce borrowing costs and spur growth and prices.
End EndJul’10 Apr’11
FY FY10-11 11-12
-1.2
-1.0
-0.8
-0.6
-0.4
-0.2
0.0
0.2
0.4
0.6
0.8
1.0
1.2
1.4
1.6
1.8
2.0
2.2
2009Jan Feb Mar Apr May Jun Jul Aug Sep Oct Nov Dec
2010Jan Feb Mar Apr
GDP Growth and Inflation ForecastsConsensus Forecasts from Survey of:
%
2010 ConsumerPrice InflationForecasts (%)
2010 Real GDPGrowth
Forecasts (%)
End EndJul’10 Apr’11
Real GDP (% chg yoy) Consumer Prices (% chg yoy)

APRIL 2010
© Copyright Consensus Economics Inc. 2010 8
2.3 1.8 0.1 0.9 5.6 4.8 5.9 3.1 0.9 1.5 0.8 2.3 1.5 1.52.1 2.2 -0.4 0.9 2.9 3.3 3.9 2.9 0.9 0.7 0.5 1.1 1.2 1.82.0 2.6 -1.0 1.2 5.0 8.2 na na 1.0 1.3 na na na na1.9 2.1 0.6 1.7 na na 6.1 3.6 0.6 1.6 -0.4 1.7 na na1.9 1.4 -0.1 0.9 4.2 6.2 5.8 2.5 1.1 1.2 0.2 1.5 1.5 2.01.8 1.1 0.0 1.1 1.0 3.1 7.3 7.1 1.0 0.9 -0.4 1.9 1.0 2.01.8 1.5 -0.7 0.5 -0.1 1.9 4.6 3.4 0.7 1.2 0.0 1.3 1.3 1.31.8 1.4 0.0 1.0 3.0 3.0 6.0 3.0 0.9 0.9 0.5 1.0 1.5 1.51.8 1.5 -0.3 0.8 3.2 7.6 3.6 2.3 0.9 1.4 0.9 2.0 1.1 1.51.7 1.2 0.2 0.7 1.0 1.5 na na 0.6 0.8 na na na na1.7 1.8 0.0 1.3 0.6 3.8 3.0 5.0 0.9 1.0 -0.3 1.8 1.5 1.71.7 1.6 0.0 1.0 2.0 4.0 6.0 4.0 1.2 1.5 1.0 2.0 na na1.7 1.7 -0.5 1.0 0.9 7.4 6.7 5.9 1.2 1.4 0.4 1.8 1.1 1.41.6 1.6 -1.3 0.8 1.8 2.1 na na 1.3 1.7 na na na na1.6 2.2 -1.2 0.6 1.0 4.1 3.7 1.9 0.7 1.7 0.8 1.9 na na1.6 1.5 -1.0 0.3 1.0 3.4 4.8 3.5 1.0 1.2 na na 1.5 1.51.5 2.0 -0.9 0.9 -0.3 1.8 2.3 2.8 0.9 1.1 0.1 1.0 1.5 1.81.5 2.0 -0.8 1.1 1.0 5.0 4.0 3.0 1.0 1.5 0.0 2.5 1.5 1.71.5 2.0 -1.0 0.7 0.3 5.4 na na 1.3 1.5 na na na na1.4 1.4 -1.0 0.7 0.9 2.3 4.0 2.2 1.0 1.4 0.1 1.9 2.0 1.61.4 1.6 -0.3 0.7 0.4 2.6 4.0 3.0 0.9 1.3 1.0 3.3 2.0 3.01.4 1.6 -0.3 0.4 0.7 5.0 3.8 3.6 0.8 1.1 na na 2.0 1.71.4 1.2 -1.3 0.7 0.6 3.2 4.4 2.6 1.0 1.4 na na na na1.3 1.5 -1.4 0.5 -0.3 4.0 4.5 6.0 1.0 1.3 0.4 4.0 1.5 1.01.2 1.8 0.2 1.8 2.7 6.6 na na 0.6 0.8 na na na na1.2 2.0 -0.9 1.0 0.5 3.9 4.1 3.3 1.2 1.4 0.2 1.6 na na1.1 1.2 0.2 0.7 -2.0 3.0 2.0 2.8 0.4 1.2 0.0 1.7 0.5 2.0
1.6 1.7 -0.5 0.9 1.4 4.1 4.6 3.5 0.9 1.3 0.3 1.9 1.4 1.7
1.7 1.6 -0.3 0.9 1.8 4.0 4.5 3.4 0.8 1.2 0.3 1.9 1.4 1.61.8 1.6 -0.1 0.9 2.8 3.7 4.9 3.3 1.0 1.3 0.2 1.7 1.5 1.62.3 2.6 0.6 1.8 5.6 8.2 7.3 7.1 1.3 1.7 1.0 4.0 2.0 3.01.1 1.1 -1.4 0.3 -2.0 1.5 2.0 1.9 0.4 0.7 -0.4 1.0 0.5 1.00.3 0.4 0.6 0.3 1.7 1.9 1.4 1.3 0.2 0.3 0.5 0.7 0.4 0.4
1.41.2 1.7 -0.2 0.8 1.0 7.0 0.8 1.00.3 -1.0 0.21.6 1.8
AllianzSEBBank of America - MerrillGoldman SachsMM WarburgBank Julius BaerHSBC TrinkausWGZ BankCommerzbankIFO - Munich InstituteDIW - BerlinHelaba FrankfurtIHS Global InsightCitigroupUBSUniCreditBHF-BankHWWISal Oppenheim DekaBankLandesbank BerlinRWI EssenMorgan StanleyWestLBIfW - Kiel InstituteDZ BankEcon Intelligence Unit
Consensus (Mean)
Last Month's Mean3 Months AgoHighLowStandard Deviation
Comparison ForecastsGovernment (Jan. '10)Eur Commission (Oct. '09)IMF (Oct. '09)OECD (Nov. '09)
NegotiatedWages and
Salaries
* % change on previous year
Gross Domestic Product*Private Consumption*Machinery & Eqpt Investment*Industrial Production*Consumer Prices*Producer Prices*Negotiated Wages & Salaries*Unemployment Rate, %Current Account, Euro bnGeneral Govt. Budget Balance (Maastricht definition), Euro bn
3 mth Euro, % (end yr)10 Yr German Govt Bond, % (end yr)
GERMANY
Historical DataGovernment and Background Data
GrossDomesticProduct
PrivaterVerbrauch
Bruttoinlands-produkt
Average % Change on Previous Calendar Year
Ausrüstungs-investitionen
Produktion imProduzierenden
Gewerbe
Tariflohn- und-gehaltsniveau
Index fürErzeugerpreise
Preisindexfür die
Lebenshaltung
2010 2011 2010 2011 2010 2011 2010 2011 2010 2011 2010 2011 2010 2011Economic Forecasters
PrivateConsumption
Machinery &EquipmentInvestment
IndustrialProduction
ConsumerPrices
ProducerPrices
2006 2007 2008 20093.2 2.5 1.3 -5.01.3 -0.3 0.4 0.2
11.8 11.0 3.3 -20.56.0 5.9 -0.1 -16.01.6 2.3 2.7 0.45.4 1.3 5.5 -4.22.0 2.1 2.9 2.4
10.8 9.0 7.8 8.1151 191 165 119
-37.8 4.9 1.1 -79.1 e
3.7 4.7 2.8 0.7
4.0 4.3 3.0 3.4
Percentage Change (year-on-year).
Chancellor - Mrs. Angela Merkel (Christian Democratic Party or CDU).Parliament - A coalition of the CDU/CSU and FPD has a small majority in the622-seat Bundestag (lower house); the CDU/CSU has a majority in theBundesrat (upper house). Next Elections - By September 2013 (Bundestag).Nominal GDP - Euro 2,487bn (2008). Population - 82.3mn mid-year (2008).$/Euro Exchange Rate - 1.472 (average, 2008).
Quarterly Consensus ForecastsHistorical Data and Forecasts (bold italics) From Survey of
March 8, 20102009 2010 2011Q3 Q4 Q1 Q2 Q3 Q4 Q1 Q2 Q3 Q4
Gross DomesticProduct
PrivateConsumption
ConsumerPrices
-4.8 -2.4 1.4 1.6 1.3 1.7 1.8 1.6 1.8 1.9
0.2 -0.4 -1.0 -1.6 -0.5 0.6 0.7 0.8 0.9 1.0
-0.2 0.4 0.7 0.8 1.0 1.0 1.2 1.3 1.4 1.5e = consensus estimate based on latest survey

APRIL 2010
9© Copyright Consensus Economics Inc. 2010
8.3 8.3 152 164 -120 -106 0.8 1.6 3.5 4.28.2 8.0 120 120 -142 -128 0.8 1.3 3.4 3.68.1 na 119 113 -113 -70 na na na na9.2 9.2 87 87 -130 -126 1.2 1.5 3.3 3.48.5 8.6 145 160 -120 -100 0.8 1.4 3.4 3.58.1 8.4 na na na na 0.9 1.3 3.4 3.38.6 9.3 128 136 -135 -100 0.8 1.6 3.3 3.18.3 8.6 125 125 na na 0.7 1.2 3.2 3.58.2 8.8 126 146 -135 -109 1.0 1.8 3.4 3.78.6 8.6 na na -125 -138 0.7 1.3 3.4 4.08.5 8.7 130 125 -146 -121 0.9 2.2 3.5 4.08.2 8.2 155 165 -136 -115 0.8 2.2 3.5 3.88.1 8.2 145 144 -122 -112 0.9 1.9 3.4 4.17.8 7.8 171 175 -123 -116 0.8 1.5 3.4 3.98.9 8.7 174 218 na na 0.5 1.6 3.5 4.18.2 8.4 135 140 -120 -105 0.8 1.5 3.4 3.98.4 8.6 140 170 -131 -121 1.2 1.7 3.8 3.88.5 9.0 168 180 -130 -122 1.0 1.7 3.5 3.98.8 9.2 na na na na 0.7 1.7 3.1 3.88.3 8.7 120 133 -129 -99 0.7 1.3 3.2 3.78.8 9.1 162 190 -148 -116 1.0 2.0 3.4 4.08.3 8.5 148 176 -125 -115 0.6 1.0 3.1 3.58.8 9.0 142 157 -138 -121 1.2 2.1 4.1 4.78.5 9.0 na na -135 -100 0.8 1.2 3.0 3.48.2 7.9 na na -127 -128 na na 3.3 3.58.3 8.5 135 160 -135 -120 0.8 1.9 3.3 4.29.1 8.7 na na na na 0.7 1.0 na na
8.4 8.6 139 152 -130 -113 0.8 1.6 3.4 3.8
8.7 9.0 137 143 -131 -1159.0 9.2 120 127 -131 -1149.2 9.3 174 218 -113 -70 1.2 2.2 4.1 4.77.8 7.8 87 87 -148 -138 0.5 1.0 3.0 3.10.3 0.4 21 30 9 14 0.2 0.3 0.2 0.3
9.2 9.3 93 93
9.2 9.7
Rates on Survey DateYearAverage 3.2%
Annual Total
Leistungs-bilanz(€ bn)
3 MonateEuro(%)
2010 2011 2010 2011 2010 2011
Finanzierungs-saldo des
Staates(Maastricht)
(€ bn)
Rendite vonBundesan-leihen, 10Jahre (%)
Arbeitslosen-quote, % derErwerbspers.
insgesamt
0.6%
GERMANY
Unemploy-ment
Rate (%)
CurrentAccount(Euro bn)
General GovtBudget Bal(Maastricht)
(Euro bn)
3 monthEuro
Rate (%)
10 YearGerman
Govt BondYield (%)
0.0
0.2
0.4
0.6
0.8
1.0
1.2
1.4
1.6
1.8
2.0
2009Jan Feb Mar Apr May Jun Jul Aug Sep Oct Nov Dec
2010Jan Feb Mar Apr
-6
-5
-4
-3
-2
-1
0
1
2
3
4
5
6
91 92 93 94 95 96 97 98 99 00 01 02 03 04 05 06 07 08 09 10 11 12 13 14 15
Real Growth and Inflation(data for 1990-1991 are for former West Germany)
Direction of Trade – 2008Major Export Markets
(% of Total)France 9.7United States 7.1United Kingdom 6.7Eastern Europe 17.8Asia (ex. Japan) 5.5Middle East 2.7
Major Import Suppliers(% of Total)
Netherlands 12.5France 8.3Belgium 7.5Eastern Europe 17.7Asia (ex. Japan) 8.7Latin America 2.2
%
<Forecast>
GDP Growth and Inflation ForecastsConsensus Forecasts from Survey of:
%
2010 ConsumerPrice InflationForecasts (%)
2010 Real GDPGrowth
Forecasts (%)
End EndJul’10 Apr’11
End EndJul’10 Apr’11
Contraction on the Cards in Q1 2010?After the recovery unexpectedly stagnated at the end of lastyear, there are now fears that the economy could contract inQ1 2010 as a prolonged period of bad weather caused activityto slow. Retail sales were down by 0.5% (m-o-m) in Januaryand by 0.4% in February, while industrial production – themain driver of GDP in previous quarters – managed only a0.1% (m-o-m) rise in January and stagnated in February.Consequently, the OECD expects the economy to contractby 0.4% (q-o-q annualised) in Q1 in contrast with other G-7nations which are projected to expand. Business confidencesurveys indicate that growth should return in Q2, however.The PMI for manufacturing rose from 57.2 in February to 60.2in March, the highest level in the region and consistent witha return to rapid growth in the sector, while the services indexrose to 54.9. Though German industries are benefiting fromthe depreciation of the euro following the Greek fiscal crisis,the ongoing threat of further bailouts in southern Europecould be problematic as without a swift resolution, demandin valuable inter-European export markets could dry up.Meanwhile, March inflation jumped by 0.5% (m-o-m) and1.1% (y-o-y) as the combined result of the depreciatingcurrency, rising energy costs and bad weather.
The German labour market is once again proving resilient intesting times as the number of registered unemployed sawa further decline in February, with claims falling by 31,000 onthe month before. This leaves the overall rate at 8.1%, wellbelow the Euro zone average which passed 10% in the samemonth. Increased job flexibility appears to be paying off, andour panel has downgraded its forecast for the unemploymentrate this year to 8.4%.
Real GDP (% chg yoy) Consumer Prices (% chg yoy)
APRIL 2010
© Copyright Consensus Economics Inc. 2010 10
Bank of America - MerrillBIPEGoldman SachsCitigroupCoe-RexecodeUBSING Financial MarketsTotalBNP-ParibasUniCreditEcon Intelligence UnitAXA Investment ManagersGAMAOddo SecuritiesSociete GeneraleNatixisCredit AgricoleHSBC FranceOFCE
Consensus
Last Month's Mean3 Months AgoHighLowStandard Deviation
Comparison ForecastsGovernment (Sep. '09)Eur Commission (Oct. '09)IMF (Jan. '10)OECD (Nov. '09)
1.9 2.5 0.9 1.6 0.5 4.5 6.7 5.2 1.4 1.6 1.7 2.51.8 1.2 1.2 0.8 -2.8 1.3 1.9 1.2 1.8 2.0 1.6 1.61.8 2.4 0.8 1.4 na na 2.4 3.0 1.5 1.4 na na1.7 1.5 1.0 0.8 na na na na 1.4 1.5 1.8 1.51.7 1.4 0.9 0.8 -0.8 2.5 na na 1.2 1.0 1.9 1.91.7 2.2 1.6 2.3 0.4 4.6 4.8 4.1 1.1 2.0 na na1.5 2.0 1.5 1.9 -0.7 2.7 3.0 3.7 1.5 1.9 2.5 2.71.5 2.0 1.1 2.0 0.5 3.0 na na 1.2 1.5 na na1.4 2.0 1.2 1.9 -1.0 3.8 3.2 3.5 1.4 1.1 2.1 2.51.4 1.6 1.2 1.4 -1.5 2.8 na na 1.5 1.5 2.3 2.61.4 1.3 1.0 1.5 na na na na 1.0 1.7 na na1.3 1.8 0.6 1.4 -2.1 4.1 2.5 3.5 1.2 1.3 2.0 2.51.3 1.5 0.8 1.1 -0.8 2.7 na na 1.2 1.6 1.9 2.11.3 1.3 1.2 1.3 -1.7 2.7 3.7 3.2 1.6 1.7 2.0 1.91.3 1.6 0.9 1.7 -0.8 3.5 na na 1.4 1.5 1.5 2.11.1 1.1 0.8 0.9 -1.5 2.5 3.5 na 1.3 1.1 na na1.1 1.3 1.2 1.0 -1.5 1.4 0.5 2.1 1.4 1.6 na na1.0 1.6 0.7 1.0 -2.4 2.9 1.0 1.7 1.7 1.6 1.5 1.60.9 1.4 0.9 1.5 -5.5 -0.8 na na 1.2 0.7 na na
1.4 1.7 1.0 1.4 -1.4 2.8 3.0 3.1 1.4 1.5 1.9 2.1
1.4 1.6 1.0 1.4 -1.2 2.7 3.0 3.0 1.2 1.5 1.9 2.21.4 1.6 0.9 1.4 -1.0 2.6 3.6 3.1 1.2 1.5 1.9 2.11.9 2.5 1.6 2.3 0.5 4.6 6.7 5.2 1.8 2.0 2.5 2.70.9 1.1 0.6 0.8 -5.5 -0.8 0.5 1.2 1.0 0.7 1.5 1.50.3 0.4 0.3 0.4 1.5 1.3 1.7 1.2 0.2 0.3 0.3 0.4
0.8 0.8 0.6 1.21.2 1.5 0.8 0.8 1.1 1.41.4 1.71.4 1.7 0.3 1.5
Historical Data
FRANCE
Government and Background Data
President - Mr. Nicolas Sarkozy (UMP). Prime Minister - Mr. FrançoisFillon (UMP). Parliament - The centre-right Union for a PopularMovement (UMP) currently has 314 out of the 577 seats in the NationalAssembly. Next Elections - Presidential: by April 2012. Nominal GDP- Euro1,949bn (2008). Population - 62.0mn (mid-year, 2008). $/EuroExchange Rate - 1.472 (average, 2008).
* % change on previous year
Gross Domestic Product*
Household Consumption*
Business Investment*
Manufacturing Production*
Consumer Prices*
Hourly Wage Rates*
Unemployment Rate (ILO), %
Current Account, Euro bn
General Govt. Budget Balance
(Maastricht definition), Euro bn
3 mth Euro, % (end yr)
10 Yr French Govt Bond,
% (end yr)
2006 2007 2008 2009
2.4 2.3 0.3 -2.2
2.6 2.4 0.9 0.8
4.7 8.6 2.4 -7.8
1.6 1.6 -3.0 -12.9
1.7 1.5 2.8 0.1
3.0 2.9 3.1 2.3
8.8 8.0 7.4 9.1
-9.2 -18.9 -44.0 -40.6
-41.1 -51.3 -65.9 -150 e
3.7 4.7 2.8 0.7
4.0 4.4 3.5 3.6
2010 2011 2010 2011 2010 2011 2010 2011 2010 2011 2010 2011
Average % Change on Previous Calendar Year
ConsumerPrices
Consommationdes Ménages
Investissementsdes Entreprises
Prix à laConsommation
Economic Forecasters
Taux de SalaireHoraire
ProduitIntérieur Brut
ProductionManufacturière
GrossDomesticProduct
HouseholdConsumption
BusinessInvestment
HourlyWage Rates
ManufacturingProduction
Percentage Change (year-on-year).
Quarterly Consensus ForecastsHistorical Data and Forecasts (bold italics) From Survey of
March 8, 20102009 2010 2011Q3 Q4 Q1 Q2 Q3 Q4 Q1 Q2 Q3 Q4
Gross DomesticProduct
HouseholdConsumption
ConsumerPrices
-2.3 -0.3 1.5 1.5 1.7 1.5 1.6 1.7 1.9 2.0
0.6 1.5 1.3 1.1 1.2 0.7 1.1 1.4 1.6 1.8
-0.4 0.4 1.1 1.2 1.4 1.4 1.4 1.4 1.4 1.5
e = consensus estimate based on latest survey

APRIL 2010
11© Copyright Consensus Economics Inc. 2010
9.6 8.6 -24.0 -15.9 -157 -132 na na na na10.0 10.2 -38.0 -33.0 -162 -165 0.7 0.7 3.2 3.69.9 9.8 -40.1 -32.5 -176 -152 1.2 1.5 na na9.8 9.7 -25.6 -7.7 -154 -138 0.8 1.5 na na9.9 10.0 -42.0 -45.0 -147 -131 0.6 1.0 3.3 3.5
10.3 9.6 -46.3 -47.9 na na 0.5 1.6 3.5 4.19.9 9.4 -37.0 -36.0 -120 -118 0.8 1.3 3.2 3.4
10.0 9.8 -36.0 -34.0 -150 -140 1.0 1.4 3.6 3.810.0 10.0 -51.0 -61.0 -160 -132 0.9 1.3 3.3 3.49.8 9.6 -37.5 -36.6 -167 -152 na na na na
10.1 10.3 na na na na na na na na10.3 10.4 -44.0 -50.0 -160 -140 1.5 2.5 4.0 4.39.9 10.1 na na na na 1.0 1.4 3.7 4.19.8 9.6 -40.0 -35.0 -160 -142 0.9 1.6 3.5 3.9
10.1 9.9 -39.0 -39.0 -161 -142 0.7 1.5 3.4 3.79.9 10.1 na na -155 na na na na na
10.0 9.9 -36.9 -39.8 -158 -146 0.9 1.8 3.9 4.410.3 10.6 -38.4 -31.4 -178 -152 0.8 1.6 3.5 3.410.2 10.6 -46.0 -55.0 -165 -150 1.0 1.5 3.5 3.5
10.0 9.9 -38.9 -37.5 -158 -142 0.9 1.5 3.5 3.8
10.0 9.9 -35.7 -33.7 -161 -14510.1 9.9 -37.7 -39.0 -162 -14610.3 10.6 -24.0 -7.7 -120 -118 1.5 2.5 4.0 4.49.6 8.6 -51.0 -61.0 -178 -165 0.5 0.7 3.2 3.40.2 0.5 6.9 13.3 13 11 0.2 0.4 0.2 0.3
10.2 10.0 -44.4 -48.4
9.9 10.1
-2.5
-2.0
-1.5
-1.0
-0.5
0.0
0.5
1.0
1.5
2.0
2.5
3.0
3.5
4.0
4.5
91 92 93 94 95 96 97 98 99 00 01 02 03 04 05 06 07 08 09 10 11 12 13 14 15
Real Growth and Inflation
FRANCE
%
Direction of Trade – 2008Major Export Markets
(% of Total)Germany 14.3Italy 8.7Spain 8.3Eastern Europe 8.7Africa 5.7Asia (ex. Japan) 4.5
Major Import Suppliers(% of Total)
Germany 17.9Belgium 11.7Italy 8.3Eastern Europe 9.1Asia (ex. Japan) 5.9Africa 4.5
%
<Forecast>
Rates on Survey DateYearAverage 0.6%
SoldeCourant(€ md)
Taux deChômage,
BIT (%)
Annual Total
BalanceBudgétaire(Maastricht)
(€ md)
2010 2011 2010 2011 2010 2011
Tauxd'intéret3 mois
Euro (%)
Rendement des obligat-ions d'Etat, 10 ans (%)
3.5%
CurrentAccount(Euro bn)
Unemploy-ment
Rate, ILO(%)
GeneralGovt Budget
Balance(Maastricht)
(Euro bn)
3 monthEuro
Rate (%)
10 YearFrench
Govt Bond Yield (%)
Manufacturing, Not Consumption, Starts to Drive ActivityThe final release of the Q4 2009 national accounts confirmedthe acceleration in GDP evidenced in the preliminary report,from 0.2% (q-o-q) in Q3 to 0.6%. GDP was lifted by invento-ries and a 2.0%-point contribution from domestic final sales,but net trade subtracted from activity. Going into 2010, themain impetus of activity appears to be shifting away fromdomestic demand and towards industry. Manufacturing or-ders rose by 1.0% (m-o-m) in January on the back of a 3.4%surge in exports, underscoring the comparative softness ofdomestic activity. Elsewhere, manufacturing production con-tinued to rise after a 0.6% (m-o-m) gain in February, reaching0.4% in March which brought the y-o-y rate up from 3.6% to4.6%. With March’s purchasing managers’ index (PMI) for thesector rising from 54.9 in the previous month to 56.5 andINSEE’s own survey of industrialists also recording gains,manufacturing is expected to pick up further in the monthsahead. Our panel’s production forecast for 2010, however,remains unchanged at 3.0% this month.
By contrast, March’s services PMI fell back, once againhighlighting the shakiness outside of industry. With employ-ment contracting in the final quarter of 2009 and the joblessrate standing at 9.6% – not to mention the gradual phasing outof last year’s successful car scrappage scheme – 2010consensus forecasts for household spending remain at 1.0%.Indeed, retail trade declined in m-o-m terms in January.Meanwhile, spending on durable goods in February registereda 1.2% monthly fall, its second consecutive contraction,which leaves spending in the first two months of 2010 downfrom the December quarter. 2011 consumption is not ex-pected to accelerate significantly either.
GDP Growth and Inflation ForecastsConsensus Forecasts from Survey of:
0.2
0.3
0.4
0.5
0.6
0.7
0.8
0.9
1.0
1.1
1.2
1.3
1.4
1.5
1.6
1.7
2009Jan Feb Mar Apr May Jun Jul Aug Sep Oct Nov Dec
2010Jan Feb Mar Apr
2010 ConsumerPrice InflationForecasts (%)
2010 Real GDPGrowth
Forecasts (%)
End EndJul’10 Apr’11
End EndJul’10 Apr’11
Real GDP (% chg yoy) Consumer Prices (% chg yoy)

APRIL 2010
© Copyright Consensus Economics Inc. 2010 12
2.2 1.4 -0.2 -0.7 3.0 6.1 5.0 8.0 3.0 1.5 3.4 3.8 3.2 3.6 3.5 4.5 2.7 3.52.0 2.7 0.5 1.5 -0.1 5.2 na na 3.2 5.4 3.8 2.8 2.8 2.6 na na 3.4 3.81.9 1.5 1.4 1.2 0.8 4.0 na na 2.4 2.5 3.9 2.5 2.8 1.4 na na 2.2 2.51.8 2.8 0.8 2.5 na na na na na na na na 1.8 2.2 na na 3.7 4.21.6 3.2 0.4 0.7 -0.9 7.8 na na 2.7 4.4 3.8 2.3 2.7 1.6 3.0 2.0 na na1.5 2.5 0.9 2.0 -4.9 1.5 na na 0.7 1.8 na na 2.7 0.7 3.5 2.7 na na1.5 2.5 -0.1 2.3 2.6 2.2 3.5 5.0 na na 2.9 0.7 2.5 0.8 na na na na1.5 2.5 1.0 1.8 -3.3 3.8 na na na na 3.6 1.4 2.5 1.0 na na na na1.5 3.2 0.7 2.1 -2.6 3.7 na na 1.8 3.2 na na 2.5 1.7 2.3 1.5 na na1.4 2.2 1.3 1.7 -4.7 2.0 na na 0.0 0.0 4.4 2.8 3.1 1.5 na na na na1.4 3.0 0.0 2.3 -1.5 1.4 11.8 8.6 2.8 5.1 4.2 3.0 2.9 1.6 na na 1.8 2.31.4 2.3 1.3 1.4 -9.3 -1.7 14.4 11.7 0.2 0.8 4.4 2.9 3.6 2.9 na na 1.2 2.11.2 2.0 0.8 1.6 -4.3 3.4 8.8 10.0 2.7 3.5 na na 2.9 1.7 3.7 4.0 na na1.1 1.8 -0.2 1.1 -3.4 2.7 na na 2.0 2.6 3.7 2.3 2.8 1.6 4.0 2.3 2.2 2.91.1 2.5 0.7 1.8 -1.7 9.5 na na 3.4 3.9 3.6 2.5 2.5 2.3 na na 2.8 3.71.1 2.3 0.2 1.6 -3.6 0.6 3.1 5.9 2.1 3.0 3.8 2.0 2.7 1.5 2.3 1.3 2.0 2.21.0 1.6 -0.1 1.5 -2.3 2.0 na na 1.0 2.3 2.5 3.0 2.2 2.4 na na 1.4 2.51.0 1.5 -0.5 1.0 -2.0 2.0 na na 2.0 3.0 3.9 1.6 2.6 0.3 4.8 na 0.7 -0.21.0 2.5 0.7 1.9 -3.3 4.3 2.3 8.1 1.4 2.3 3.1 2.0 2.4 1.6 3.3 2.2 2.1 3.11.0 1.5 0.7 0.8 -3.7 2.8 na na 1.7 2.6 na na 2.4 2.0 2.2 2.4 1.4 2.21.0 2.5 0.4 0.9 -1.0 3.2 4.0 5.0 2.6 5.6 2.9 2.3 2.2 1.7 2.1 3.0 2.0 3.11.0 2.3 0.8 0.9 -1.6 4.3 na na 0.8 3.0 4.0 2.9 2.8 1.9 2.2 1.5 1.5 1.90.9 2.5 1.5 3.3 0.4 6.9 na na 3.0 5.2 3.9 1.5 2.9 0.4 4.7 5.4 2.3 2.50.9 1.9 0.6 1.8 -3.4 1.2 na na 1.2 2.5 4.0 2.3 2.8 1.7 4.2 3.1 1.8 2.3
1.3 2.3 0.6 1.5 -2.2 3.4 6.6 7.8 1.9 3.1 3.7 2.4 2.7 1.7 3.3 2.8 2.1 2.6
1.4 2.3 0.5 1.7 -1.6 3.6 5.0 7.1 2.1 3.1 3.5 2.3 2.6 1.7 3.0 2.9 2.4 2.91.5 2.2 0.6 1.6 -1.3 2.9 5.1 6.5 1.9 2.7 3.2 2.4 2.4 1.7 2.9 3.0 2.2 2.82.2 3.2 1.5 3.3 3.0 9.5 14.4 11.7 3.4 5.6 4.4 3.8 3.6 3.6 4.8 5.4 3.7 4.20.9 1.4 -0.5 -0.7 -9.3 -1.7 2.3 5.0 0.0 0.0 2.5 0.7 1.8 0.3 2.1 1.3 0.7 -0.20.4 0.5 0.5 0.8 2.6 2.5 4.5 2.4 1.0 1.5 0.5 0.7 0.4 0.8 0.9 1.2 0.8 1.0
1.3 3.3 0.3 2.5 -2.5 4.8 1.8 3.8 2.0 1.50.9 1.9 -0.3 1.5 -3.8 3.0 1.4 1.61.3 2.71.2 2.2 -0.2 2.0 -5.2 2.6 1.7 0.5
Economic PerspectivesHSBC BNP ParibasLiverpool Macro ResearchGoldman SachsDeutsche BankLombard Street ResearchCredit SuisseJP Morgan Barclays CapitalBank of America - MerrillCitigroupSociete GeneraleIHS Global InsightSchrodersOxford EconomicsCambridge EconometricsCapital EconomicsConfed of British IndustryING Financial MarketsITEM ClubRBS Financial MarketsBeacon Econ ForecastingExperian Business Strategies
Consensus (Mean)
Last Month's Mean3 Months AgoHighLowStandard Deviation
Comparison ForecastsTreasury (Mar. '10)Eur Commission (Oct. '09)IMF (Jan. '10)OECD (Nov. '09)
Gross Domestic Product*Household Consumption*Gross Fixed Investment*Company Trading Profits*Manufacturing Production*Retail Prices (RPI-X underlying rate)*
Consumer Prices Index (HICP)*Output Prices*Average Earnings*Unemployment Rate, %Current Account, £ bnPublic Sector Net Cash
Requirement, fiscal yrs, £ bn3 mth Interbank, % (end yr)10 Yr Gilt Yields, % (end yr)
Historical Data
GrossDomesticProduct
RetailPrices (RPI-X, underly-
ing rate)
UNITED KINGDOM
Government and Background Data
Prime Minister - Mr. Gordon Brown (Labour Party). Parliament - TheLabour party has a working majority of 65 in the 646-seat House ofCommons (lower house). Next Election - May 6th 2010 (generalelection). Nominal GDP - £1,443bn (2008). Population - 61.2mn (mid-year, 2008). $/£ Exchange Rate - 1.853 (average, 2008).
CompanyTradingProfits
2010 2011Economic Forecasters
* % change on previous year
Average % Change on Previous Calendar Year
GrossFixed
Investment
Manufactur-ing
Produc-tion
OutputPrices
AverageEarnings
HouseholdConsump-
tion
Percentage Change (year-on-year).
ConsumerPricesIndex(HICP)
2006 2007 2008 20092.9 2.6 0.5 -4.9
1.5 2.5 0.9 -3.2
6.5 7.8 -3.5 -14.9
9.2 4.5 0.6 -5.1
1.5 0.6 -2.9 -10.5
2.9 3.2 4.3 2.0
2.3 2.3 3.6 2.2
2.5 2.6 7.3 1.3
4.1 4.0 3.4 1.3
3.0 2.7 2.8 4.7
-43.8 -37.7 -22.0 -18.4
35.1 21.5 59.6 162 e
5.3 6.0 2.6 0.7
4.7 4.6 3.0 4.0
2010 2011 2010 2011 2010 2011 2010 2011 2010 2011 2010 2011 2010 2011 2010 2011
Quarterly Consensus ForecastsHistorical Data and Forecasts (bold italics) From Survey of
March 8, 20102009 2010 2011Q3 Q4 Q1 Q2 Q3 Q4 Q1 Q2 Q3 Q4
Gross DomesticProduct
HouseholdConsumption
ConsumerPrice Index
-5.3 -3.3 0.0 1.2 2.0 2.4 2.4 2.3 2.3 2.1
-3.4 -1.9 -0.4 0.7 1.0 1.1 1.4 1.6 1.7 1.6
1.4 2.1 3.2 2.9 2.3 1.8 1.4 1.6 1.6 1.7
e = consensus estimate based on latest survey

APRIL 2010
13© Copyright Consensus Economics Inc. 2010
5.2 5.3 -16.0 -12.0 165 150 1.5 2.2 4.3 4.84.8 4.3 -16.1 -7.4 na na 0.7 2.1 3.9 3.44.7 4.8 -16.0 -8.5 155 126 0.6 0.6 4.1 4.15.0 4.7 -30.7 -27.9 na na 0.7 1.3 na na5.1 4.2 -4.6 7.7 na na 0.8 2.4 4.0 4.4na na -5.1 0.0 165 130 0.7 1.2 4.3 4.9na na -40.3 -32.8 na na 0.7 1.1 4.4 4.2na na -36.4 -38.0 160 117 na na 4.3 4.4na na -29.0 -29.8 na na na na na nana na -25.2 -16.8 na na 1.0 2.5 4.8 5.35.1 5.1 -20.0 -18.0 na na na na na na5.2 5.5 -8.8 18.3 169 125 1.0 2.5 4.6 5.15.4 6.2 -15.0 -10.0 165 145 0.9 1.5 4.4 4.85.2 5.3 -26.7 -23.9 165 135 0.7 1.2 4.2 4.55.1 4.8 -19.0 -30.0 160 129 0.7 1.3 4.3 4.45.0 5.0 -28.1 -21.1 172 145 0.6 1.1 4.3 5.15.9 6.4 -26.2 -23.7 na na na na na na6.0 6.6 -14.8 -7.8 167 132 0.6 0.5 4.0 3.05.1 5.0 -36.6 -36.7 na na na na na na5.5 5.6 -16.0 -18.5 175 125 0.7 1.3 4.4 4.75.0 4.7 -30.0 -8.7 180 155 na na na na5.0 5.2 -11.4 -6.1 170 155 0.8 1.7 4.4 4.35.2 5.3 -35.7 -53.0 197 207 0.5 1.3 3.5 3.65.1 4.9 -22.5 -36.2 183 166 1.2 2.5 4.5 5.0
5.2 5.2 -22.1 -18.4 170 143 0.8 1.6 4.3 4.4
5.3 5.3 -27.0 -25.2 177 1475.4 5.4 -22.3 -19.8 178 1476.0 6.6 -4.6 18.3 197 207 1.5 2.5 4.8 5.34.7 4.2 -40.3 -53.0 155 117 0.5 0.5 3.5 3.00.3 0.6 10.1 16.0 11 22 0.2 0.6 0.3 0.6
-35.0 -36.0
-5-4-3-2-10123456789
91 92 93 94 95 96 97 98 99 00 01 02 03 04 05 06 07 08 09 10 11 12 13 14 15
Major Export Markets(% of Total)
United States 13.9Germany 11.5Netherlands 7.8Eastern Europe 6.5Asia (ex. Japan) 5.0Middle East 4.1
Fiscal Years(Apr-Mar)
Real Growth and Inflation
UNITED KINGDOM
Rates on Survey DateYearAverage 4.1%
Annual Total
2010 2011 2010 2011
0.7%
Direction of Trade – 2008
Major Import Suppliers(% of Total)
Germany 13.1United States 8.7Netherlands 7.4Asia (ex. Japan) 11.5Eastern Europe 7.5Africa 2.9
%
CurrentAccount
(£ bn)
Public Sec-tor Net CashRequirement
(£ bn)
3 monthInterbankRate (%)
10 YearGilt Yield
(%)
Unemploy-ment
Rate (%)
<Forecast>
Expansion Could Continue into Q1Early indicators suggest that despite the VAT hike and badweather in January putting an initial dampener on activity, theeconomy managed to avoid a dreaded “double-dip” recessionand continued on a path of expansion in Q1. Retail sales, forexample, rebounded by 2.1% (m-o-m) in February, overcom-ing much of the previous month’s slump, while the PMI formanufacturing reached a new high of 57.2 in March. In itslatest interim assessment, the OECD even said that itexpected the UK economy to grow the fastest out of all theG-7 countries bar Canada in the first half of the year,forecasting a q-o-q annualised growth rate of 2.0% in Q1 and3.1% in Q2. The labour market appears to be indicative of thisturnaround in fortunes, as new hirings in February were upand the claimant count of unemployment fell by 32,300. Acause of concern, however, is that the number of thosedeemed “economically inactive” has risen to its highest levelin years, with the proportion of those employed falling to58.1%. Meanwhile, inflation surprised on the downside inFebruary as it fell to 3.0% (y-o-y) from a high of 3.5% inJanuary. This suggests that the upside risk to inflation couldbe dissipating, allowing monetary policy to stay looser for alittle longer (until the final quarter of this year according to ourpanel – see below).
It was finally confirmed that the next general election will takeplace on May 6th. Investors will be hoping for a clear victor toemerge so that steps to grapple with the spiralling deficit canfinally be undertaken. In the meantime, the revised govern-ment estimate of the FY2009-10 budget deficit from £178bnto £167bn did little to reassure the markets, as the UK poundmade further losses against the US dollar.
FY FY10-11 11-12
%
GDP Growth and Inflation ForecastsConsensus Forecasts from Survey of:
0.0
0.2
0.4
0.6
0.8
1.0
1.2
1.4
1.6
1.8
2.0
2.2
2.4
2.6
2.8
2009Jan Feb Mar Apr May Jun Jul Aug Sep Oct Nov Dec
2010Jan Feb Mar Apr
2010 ConsumerPrice InflationForecasts (%)
2010 Real GDPGrowth
Forecasts (%)
End EndJul’10 Apr’11
End EndJul’10 Apr’11
UK Official Bank Rate – April 12, 2010 = 0.50%
0.53% 0.69% 1.06% 1.35%
0.50% 0.50% 1.00% 2.00%
ConsensusMean Average:
Mode (mostfrequent forecast):
FORECASTS End June End Sep. End Dec. End Mar.2010 2010 2010 2011
Real GDP (% chg yoy) Consumer Prices (% chg yoy)
14
APRIL 2010
© Copyright Consensus Economics Inc. 2010
1.1 2.1 0.6 1.5 0.5 3.7 3.4 3.2 1.4 1.9 0.9 1.2 na na
1.1 1.3 0.8 1.3 1.4 2.7 na na 1.4 2.0 na na na na
1.0 1.6 0.8 0.9 -0.1 1.0 1.6 2.0 1.3 1.8 1.3 3.3 na na
1.0 1.4 0.8 1.1 0.8 2.8 na na 1.6 2.0 1.9 2.4 1.5 0.7
0.9 1.2 0.6 0.8 0.5 2.0 na na 2.1 2.3 na na na na
0.7 0.8 0.6 0.5 -1.1 4.0 3.2 -1.8 1.4 1.5 na na 2.4 1.9
0.7 1.0 0.7 0.9 -0.8 1.3 1.3 1.4 1.5 1.7 1.8 2.0 2.2 2.3
0.7 0.8 0.5 0.7 -1.1 0.3 1.2 1.0 1.5 1.9 2.1 2.3 2.0 2.3
0.7 1.2 0.6 1.7 -0.5 1.9 3.7 0.8 1.4 2.0 0.4 1.1 2.0 2.1
0.6 1.1 0.6 0.8 -0.2 1.9 1.0 2.0 1.6 1.9 1.8 2.5 2.2 2.8
0.6 0.6 0.6 0.7 0.4 1.3 3.0 1.0 1.4 1.7 1.1 1.6 na na
0.6 1.0 0.7 0.8 -0.9 2.2 3.7 2.5 1.1 1.4 na na na na
0.6 1.0 0.4 0.7 0.4 1.8 1.7 1.5 1.5 1.7 2.8 1.7 1.6 2.0
0.5 1.0 0.2 0.8 -2.3 0.6 na na 1.6 1.9 1.6 2.7 2.8 2.4
0.5 1.0 0.6 1.0 -0.9 1.2 4.1 3.0 1.4 1.8 na na na na
0.8 1.1 0.6 0.9 -0.3 1.9 2.5 1.5 1.5 1.8 1.6 2.1 2.1 2.1
0.8 1.2 0.6 0.9 0.2 1.9 1.9 1.7 1.5 1.8 1.6 2.1 2.1 2.1
0.9 1.2 0.6 0.9 0.2 2.0 2.2 1.8 1.6 1.8 1.4 2.2 2.1 2.3
1.1 2.1 0.8 1.7 1.4 4.0 4.1 3.2 2.1 2.3 2.8 3.3 2.8 2.8
0.5 0.6 0.2 0.5 -2.3 0.3 1.0 -1.8 1.1 1.4 0.4 1.1 1.5 0.7
0.2 0.4 0.2 0.3 1.0 1.0 1.2 1.4 0.2 0.2 0.7 0.7 0.4 0.6
0.7 0.5 1.7 1.5
0.7 1.4 0.8 1.3 0.1 2.4 1.8 2.0
1.0 1.3
1.1 1.5 0.7 1.1 0.6 4.0
Bank of America - MerrillConfindustriaGoldman SachsISAECentro Europa RicercheCitigroupING Financial MarketsRef.Intesa SanpaoloBanca Nzle del LavoroEcon Intelligence UnitHSBCPrometeiaUniCreditIHS Global Insight
Consensus (Mean)
Last Month's Mean3 Months AgoHighLowStandard Deviation
Comparison ForecastsGovernment (Sep. '09)Eur Commission (Oct. '09)IMF (Jan. '10)OECD (Nov. '09)
ITALY
* % change on previous year
Gross Domestic Product*
Household Consumption*
Gross Fixed Investment*
Industrial Production*
Consumer Prices*
Producer Prices*
Contractual Hourly Earnings*
Unemployment Rate,%
Current Account, Euro bn
General Govt. Budget Balance
(Maastricht definition), Euro bn
3 mth Euro, % (end yr)
10 yr Italian Govt Bond,
% (end yr)
Historical Data
Average % Change on Previous Calendar Year
RetribuzioneOrarie
Contrattuali
Prezzi allaProduzione
Prezzial Consumo
ProduzioneIndustriale
InvestimentiFissi Lordi
Consumidelle Famiglie
ProdottoInterno Lordo
ContractualHourly
Earnings
ProducerPrices
ConsumerPrices
IndustrialProduction
GrossFixed
Investment
HouseholdConsumption
GrossDomesticProduct
2010 2011 2010 2011 2010 2011 2010 2011 2010 2011 2010 2011 2010 2011Economic Forecasters
2006 2007 2008 2009
2.1 1.4 -1.3 -5.1
1.2 1.1 -0.8 -1.8
3.1 1.3 -4.0 -12.2
3.6 2.1 -3.2 -17.6
2.1 1.8 3.4 0.8
4.5 3.0 5.1 -4.7
3.0 2.2 3.5 3.1
6.8 6.2 6.7 7.8
-38.3 -37.7 -54.5 -48.0
-49.3 -23.2 -43.0 -80.8 e
3.7 4.7 2.8 0.7
4.2 4.6 4.3 4.2
Percentage Change (year-on-year).
Government and Background Data
Prime Minister - Mr. Silvio Berlusconi (People of Freedom Party).Parliament - A centre-right coalition led by the People of Freedom Partyhas majorities in both the Chamber of Deputies (lower house) and theSenate (upper house). Next Elections - By 2013 (parliamentary).Nominal GDP - Euro1,572bn (2008). Population - 59.6mn (mid-year,2008). $/Euro Exchange Rate - 1.472 (average, 2008).
Quarterly Consensus ForecastsHistorical Data and Forecasts (bold italics) From Survey of
March 8, 20102009 2010 2011Q3 Q4 Q1 Q2 Q3 Q4 Q1 Q2 Q3 Q4
Gross DomesticProduct
HouseholdConsumption
ConsumerPrices
-4.6 -2.8 0.3 1.0 0.7 1.2 1.2 1.2 1.3 1.3
-1.6 -0.4 0.8 0.7 0.5 0.5 0.7 0.8 0.9 1.0
0.1 0.7 1.4 1.3 1.6 1.6 1.7 1.7 1.8 1.9
e = consensus estimate based on latest survey

APRIL 2010
15© Copyright Consensus Economics Inc. 2010
8.3 7.8 -43.6 -31.3 -80.9 -66.4 na na na na
8.7 9.0 -47.4 -47.4 -83.4 -81.1 na na na na
na na -24.2 -13.1 -83.2 -79.3 1.2 1.5 na na
8.8 8.8 na na na na na na na na
8.8 9.0 na na na na 0.7 1.9 4.1 4.6
8.9 9.1 -37.7 -23.4 -82.3 -87.5 0.8 1.5 4.3 4.5
8.8 8.4 -43.5 -42.3 -84.2 -78.7 0.8 1.3 4.0 4.2
9.5 9.7 -47.8 -43.4 -91.0 -89.0 0.9 1.5 3.9 4.2
9.0 9.4 -43.0 -52.1 -85.0 -79.0 1.2 2.2 4.1 4.3
8.8 9.2 -43.0 -40.0 na na na na na na
8.5 8.5 na na na na na na na na
8.8 8.9 -35.0 -34.0 na na 0.7 1.6 4.1 3.9
9.1 9.3 -60.0 -54.0 -90.9 -78.7 0.8 1.4 4.4 4.5
8.9 8.8 na na -77.0 -71.0 na na na na
8.9 8.8 -42.0 -39.1 -76.4 -59.2 na na 4.1 4.7
8.8 8.9 -42.5 -38.2 -83.4 -77.0 0.9 1.6 4.1 4.3
8.8 8.8 -43.3 -39.1 -83.6 -78.3
8.5 8.5 -43.1 -38.8 -85.0 -79.5
9.5 9.7 -24.2 -13.1 -76.4 -59.2 1.2 2.2 4.4 4.7
8.3 7.8 -60.0 -54.0 -91.0 -89.0 0.7 1.3 3.9 3.9
0.3 0.5 8.8 12.2 4.9 9.1 0.2 0.3 0.2 0.3
8.8
8.7 8.7 -37.0 -38.6
8.5 8.7
0.0
0.2
0.4
0.6
0.8
1.0
1.2
1.4
1.6
1.8
2.0
2009Jan Feb Mar Apr May Jun Jul Aug Sep Oct Nov Dec
2010Jan Feb Mar Apr
-6
-5
-4
-3
-2
-1
0
1
2
3
4
5
6
7
91 92 93 94 95 96 97 98 99 00 01 02 03 04 05 06 07 08 09 10 11 12 13 14 15
Major Export Markets(% of Total)
Germany 12.8France 11.2Spain 6.6Eastern Europe 15.7Middle East 5.9Asia (ex. Japan) 3.8
2010 2011
Real GDP (% chg yoy) Consumer Prices (% chg yoy)
2010 2011 2010 2011
Real Growth and Inflation
Rates on Survey DateYearAverage 3.9%
GeneralGovt
Budget Bal(Maastricht)
(Euro bn)
Annual Total
10 YearItalian
Govt BondYield (%)
Tasso diDisoccupaz-
ione (%)
PartiteCorrenti(€ mld)
Buoni del TesoroDecennali
(%)
3 monthEuro
Rate (%)
CurrentAccount(Euro bn)
Unemploy-ment
Rate (%)
ITALY
InteressiEuro Tri-
mestrali (%)
0.6%
Direction of Trade – 2008Major Import Suppliers
(% of Total)Germany 16.0France 8.6China 6.2Eastern Europe 15.5Middle East 8.9Asia (ex. Japan) 8.8
%
<Forecast>
Fragile RecoveryRevisions to the Italian national accounts have furtherhighlighted the fragility of the recovery. The unexpectedcontraction in Q4 2009 GDP was larger than originallythought, posting a 0.3% (q-o-q) fall compared with the initial0.2% estimate, while Q3 growth – which initially brought Italyout of recession – was revised down slightly from 0.6% to0.5%. The contraction seen for the year as a whole wasamended to 5.1% from an original 4.9% estimate. The poorperformance at the end of last year was driven by slumps inconsumer spending and investment, which fell by 0.1% (q-o-q) and 1.0%, respectively. Nevertheless, going forward,manufacturing appeared to recover at the turn of the year,with industrial production jumping by a large 2.6% (m-o-m) inJanuary on the back of an increase in exports. Indeed, theIMF anticipates that it will be external demand which drivesfuture growth while consumer spending remains subdued. Arapid rise in joblessness appears to be the source of con-sumer caution, as in February when unemployment reached8.5% after posting an average of 8.2% in the last threemonths of 2009. In a bid to shore up domestic demand, thegovernment recently passed a consumer-targeted stimulusmeasure worth €300mn in order to encourage the sale ofdurable goods.
After resisting the temptation to lower taxes to stimulategrowth, the government budget is expected to post a rela-tively modest deficit of 5.3% of GDP in 2009 and aims to cutthis down to 3.9% in 2011. This puts Italy in a better positionthan the likes of Spain, Portugal and Greece, although weakgrowth prospects in the near-term remain an issue for creditrating agencies considering downgrades.
Indebit-amentonetto
(Maastricht)(€ mld)
%GDP Growth and Inflation Forecasts
Consensus Forecasts from Survey of:
2010 ConsumerPrice InflationForecasts (%)
2010 Real GDPGrowth
Forecasts (%)
End EndJul’10 Apr’11
End EndJul’10 Apr’11

16
APRIL 2010
© Copyright Consensus Economics Inc. 2010
3.4 3.2 3.2 3.5 0.2 4.7 15.0 10.0 3.5 4.0 2.2 1.9 1.0 2.0 2.8 2.6 180 180
3.4 3.5 3.3 3.5 1.0 6.0 16.0 12.0 3.6 4.1 2.1 1.9 1.5 3.0 2.6 3.0 180 180
3.4 2.3 3.1 2.6 4.1 7.9 18.0 8.6 na na 1.8 2.2 na na na na 180 170
3.4 3.6 2.9 2.8 2.7 8.6 20.8 16.5 na na 1.9 2.2 na na na na 184 189
3.4 3.5 3.1 2.5 2.8 3.7 33.4 15.8 7.0 8.5 1.5 1.7 1.2 2.6 na na 191 182
3.4 2.9 3.3 2.8 1.1 9.9 20.9 10.0 na na 1.7 1.9 na na na na 185 170
3.3 2.8 3.1 2.7 1.9 5.8 27.0 16.0 3.7 4.9 1.9 2.3 na na na na 190 175
3.2 3.3 3.0 2.7 2.6 10.8 27.3 7.2 na na 1.8 2.6 1.2 2.5 na na 187 194
3.2 3.4 3.0 3.6 6.0 5.5 22.0 15.0 8.5 4.5 2.0 2.0 3.5 3.0 2.0 3.5 192 178
3.1 2.7 2.6 2.3 2.1 8.3 22.8 8.6 na na 2.1 2.6 na na na na 180 175
3.0 2.9 3.0 2.9 4.6 4.9 14.4 8.9 na na 1.7 2.2 1.6 3.8 2.8 4.4 182 174
3.0 2.5 2.7 2.5 2.7 2.9 11.5 15.0 na na 1.9 2.1 na na na na 210 205
2.7 3.0 2.6 2.9 4.7 6.9 na na na na 1.5 2.0 na na na na 170 177
2.5 2.9 2.2 1.9 2.5 4.1 na na na na 2.0 2.5 na na na na 155 165
3.2 3.0 2.9 2.8 2.8 6.4 20.8 12.0 5.3 5.2 1.9 2.2 1.7 2.8 2.6 3.4 183 180
2.9 3.2 2.7 2.8 3.4 6.1 19.8 12.7 3.7 3.7 1.8 2.2 1.8 2.8 2.6 2.9 178 181
2.6 3.2 2.4 2.8 4.1 6.5 15.7 12.2 2.8 4.3 1.7 2.2 1.4 2.7 2.6 2.8 168 177
3.4 3.6 3.3 3.6 6.0 10.8 33.4 16.5 8.5 8.5 2.2 2.6 3.5 3.8 2.8 4.4 210 205
2.5 2.3 2.2 1.9 0.2 2.9 11.5 7.2 3.5 4.0 1.5 1.7 1.0 2.0 2.0 2.6 155 165
0.3 0.4 0.3 0.5 1.6 2.4 6.3 3.5 2.4 1.9 0.2 0.3 0.9 0.6 0.4 0.8 12 10
2.6 3.6
2.0 3.0 2.3 3.0 1.3 1.0
BMO Capital Markets
Economap
National Bank Financial
Royal Bank of Canada
IHS Global Insight
Toronto Dominion Bank
Scotia Economics
Conf Board of Canada
Informetrica
University of Toronto
Desjardins
CIBC World Markets
Caisse de Depot
EDC Economics
Consensus (Mean)
Last Month's Mean
3 Months Ago
High
Low
Standard Deviation
Comparison Forecasts
IMF (Jan. '10)
OECD (Nov. '09)
* % change on previous year
Gross Domestic Product*Personal Expenditure*Machinery & Eqpt Investment*Pre - Tax Corporate Profits*Industrial Production*Consumer Prices*Industrial Product Prices*Average Hourly Earnings*Housing Starts, '000 unitsUnemployment Rate, %Current Account, C$ bnFederal Govt Budget Balance, fiscal years, C$ bn3 mth Trsy Bill, % (end yr)10 Yr Govt Bond, % (end yr)
Average % Change on Previous Calendar Year
Historical Data
IndustrialProductPrices
Machinery& Equip-
mentInvestment
PersonalExpendi-
ture
GrossDomesticProduct
ConsumerPrices
ProduitIntérieur
Brut
Dépensesde Con-
sommationdes
Ménages
Investisse-ment
Productif
Prix à laConsom-mation
Prix desProduits
Industriels
HousingStarts
(thousand units)
Construc-tion de
Logementsmises enchantier,milliers
IndustrialProduction
ProductionIndustrielle
Economic Forecasters
AnnualTotal
Pre - TaxCorporate
Profits
Bénéficesdes
Sociétésavant
impôts
Percentage Change (year-on-year).
Historical DataGovernment and Background DataPrime Minister - Mr. Stephen Harper (Conservative). Government -The Conservatives lead a minority government, with 143 out of 308 seatsin parliament (155 seats are needed for a clear majority). Next Election- By 2013 (general election). Nominal GDP - C$1,600bn (2008).Population - 33.3mn (mid-year, 2008). C$/$ Exchange Rate - 1.067(average, 2008).
CANADA
Economic Forecasters 2010 2011 2010 2011 2010 2011 2010 2011 2010 2011 2010 2011 2010 2011 2010 2011 2010 2011
2006 2007 2008 2009
2.9 2.5 0.4 -2.6
4.1 4.6 3.0 0.2
10.5 4.4 0.5 -19.2
5.1 4.1 5.7 -33.2
-0.3 0.1 -4.2 -10.0
2.0 2.1 2.4 0.3
2.3 1.6 4.3 -3.4
2.6 4.6 3.5 3.0
227 228 211 149
6.3 6.1 6.2 8.3
20.3 15.6 8.1 -41.3
13.8 9.6 -5.8 -54.3 e
4.2 3.8 0.9 0.2
4.1 4.0 2.9 3.6
AverageHourly
Earnings
Rémunér-ation
HoraireMoyenne
Quarterly Consensus ForecastsHistorical Data and Forecasts (bold italics) From Survey of
March 8, 20102009 2010 2011Q3 Q4 Q1 Q2 Q3 Q4 Q1 Q2 Q3 Q4
Gross DomesticProduct
PersonalExpenditure
ConsumerPrices
-3.3 -1.2 1.8 3.2 3.6 3.1 3.0 3.0 3.1 3.2
0.2 1.9 2.9 3.0 2.7 2.5 2.5 2.8 3.0 3.1
-0.9 0.8 1.7 1.7 2.0 1.8 1.9 2.1 2.1 2.1
e = consensus estimate based on latest survey

APRIL 2010
17© Copyright Consensus Economics Inc. 2010
1.51.61.71.81.92.02.12.22.32.42.52.62.72.82.93.03.13.2
2009Jan Feb Mar Apr May Jun Jul Aug Sep Oct Nov Dec
2010Jan Feb Mar Apr
8.1 7.8 -35.0 -37.0 -46.0 -30.0 0.5 1.9 3.7 4.1
8.1 7.8 -36.0 -35.0 -40.0 -22.0 0.5 1.9 3.7 4.1
8.1 7.8 -12.3 1.5 -30.0 -20.0 0.8 2.0 3.9 4.0
8.2 7.5 -29.2 -23.3 na na 0.6 2.5 3.8 4.1
8.0 7.6 -39.8 -19.9 na na 0.5 1.1 4.1 4.2
8.1 7.6 -14.0 -9.7 na na 0.9 2.1 3.8 4.4
8.2 8.0 -35.8 -31.9 -49.2 -27.6 1.1 2.5 4.0 4.7
8.0 7.3 -31.5 -31.0 -42.0 -27.0 0.5 2.4 3.7 4.2
8.2 7.9 -30.0 15.0 -42.0 -23.0 0.4 1.5 3.6 4.1
8.2 7.9 -40.0 -38.0 na na 0.5 1.2 3.7 3.9
8.2 7.5 -30.5 -18.8 -45.0 -25.0 0.8 2.5 3.7 4.0
8.2 8.1 -31.5 -16.5 na na 0.7 1.2 3.7 4.0
8.7 8.0 -32.0 -25.0 na na 0.3 1.0 3.5 3.8
8.3 7.8 -18.0 -14.0 na na na na na na
8.2 7.8 -29.7 -20.3 -42.0 -24.9 0.6 1.8 3.8 4.1
8.3 7.8 -32.3 -22.4 -45.8 -27.7
8.5 8.0 -33.5 -24.1 -42.9 -28.0
8.7 8.1 -12.3 15.0 -30.0 -20.0 1.1 2.5 4.1 4.7
8.0 7.3 -40.0 -38.0 -49.2 -30.0 0.3 1.0 3.5 3.8
0.2 0.2 8.8 15.1 6.1 3.5 0.2 0.6 0.2 0.2
8.7 8.1
-3-2-10123456
91 92 93 94 95 96 97 98 99 00 01 02 03 04 05 06 07 08 09 10 11 12 13 14 15
2010 2011 2010 2011
Major Import Suppliers(% of Total)
United States 52.4China 9.8Mexico 4.1Asia (ex. Japan) 12.5Latin America 7.1Africa 3.1
Real Growth and Inflation
Rates on Survey Date
CurrentAccount(C$ bn)
FederalGovt Budget
Balance(C$ bn)
3 monthTreasury
Bill Rate (%)
10 YearGovernment
BondYield (%)
Taux deChômage
(%)
BalanceCourante(C$ md)
Rendement sur les Bons du Trésor de
3 mois %
Rendementdes Obligat-ions d'État
de 10 ans %
BalanceBudgétaire
(C$ md)
CANADA
%
Unemploy -ment
Rate (%)
Annual Total Fiscal Years(Apr-Mar) 0.3% 3.7%
Major Export Markets(% of Total)
United States 77.7United Kingdom 2.7Japan 2.3Asia (ex. Japan) 3.8Latin America 2.8Eastern Europe 1.1
<Forecast>
Real Growth and Inflation
Taux deChômage
(%)
Direction of Trade – 2008
%
Canadian Outlook Surges Ahead of its G-7 CounterpartsOutput-based GDP picked up from 0.5% (m-o-m) in Decem-ber to 0.6% in January, its fifth consecutive rise. Moreover,the y-o-y rate finally emerged from recession, rising by 1.3%,which bodes well for activity in Q1 as a whole. GDP was liftedby a 1.3% monthly increase in goods-producing industries.Manufacturing, in particular, jumped by 1.9% (m-o-m) as theresult of a 2.1% surge in durables, while industrial productionas a whole accelerated by 1.3%. Elsewhere, factory salesregistered a strong January showing of 2.4% over theprevious month. This was far above initial expectations and,coupled with a 2.2% monthly increase in shipments, under-scores the turnaround evidenced in industry. Indeed, ourpanel’s production forecast for 2010 has been noticeablyupgraded again this month, from 3.7% to 5.3%, while GDPexpectations have jumped past the 3%-mark to 3.2%.
Personal expenditure weathered the worst of the recession in2009 by managing to avoid an outright contraction. Going into2010, consumption has been supported by resilient jobmarket fundamentals. Unemployment, for example, stayedat 8.2% in March while payrolls have been registering gainsfor a while now. This has helped 2010 consensus expecta-tions for the jobless rate to edge down. The concertedadvance in activity has also increased attention on the Bankof Canada’s forthcoming policy moves. The overnight lendingrate remains at negligeable levels, but the accelerating paceof growth is likely to prompt a rate hike by the summer (seebox, below). February headline consumer price increases,however, remain below the bank’s 2% target while coreinflation saw a modest uptick to 2.1% . Headline expecta-tions for the year as a whole remain within target.
YearAverage
FY FY10-11 11-12
GDP Growth and Inflation ForecastsConsensus Forecasts from Survey of:
%
2010 ConsumerPrice InflationForecasts (%)
2010 Real GDPGrowth
Forecasts (%)
End EndJul’10 Apr’11
End EndJul’10 Apr’11
Canada Overnight Lending Rate – April 12, 2010 = 0.25%
0.28% 0.67% 1.08% 1.54%
0.25% 0.75% 1.25% 2.00%
ConsensusMean Average:
Mode (mostfrequent forecast):
FORECASTS End June End Sep. End Dec. End Mar.2010 2010 2010 2011
Real GDP (% chg yoy) Consumer Prices (% chg yoy)

18
APRIL 2010
© Copyright Consensus Economics Inc. 2010
Danske BankAllianzSEBBank of America - MerrillJP MorganABN AmroETLAUBS ING Financial MarketsEuropean F'cast NetworkGoldman SachsHSBCGrupo SantanderBank Julius BaerCitigroupIntesa SanpaoloBNP-ParibasCommerzbankUniCreditEcon Intelligence UnitIHS Global InsightSociete GeneraleWestLBOxford EconomicsCredit AgricoleMorgan StanleyNatixisBBVA
Consensus (Mean)
Last Month's Mean 3 Months Ago HighLowStandard Deviation
Comparison ForecastsEur Commission (Oct. '09)IMF (Jan. '10)OECD (Nov. '09)
1.8 2.2 0.3 1.5 1.7 1.6 -0.1 4.7 na na 1.0 1.5 na na na na 9.8 9.51.7 1.5 0.6 0.9 2.0 2.0 -0.3 2.3 4.7 2.2 1.2 1.8 1.7 3.0 na na 10.4 10.71.7 2.0 0.4 0.9 2.0 1.8 3.0 4.2 3.3 3.5 0.8 0.8 1.8 2.0 2.2 2.5 10.2 10.21.7 2.6 0.1 1.5 1.7 2.0 -0.5 4.7 3.8 3.9 1.3 1.5 na na 2.4 2.5 10.0 9.21.5 2.1 0.0 1.3 0.8 1.0 -1.1 3.8 3.1 3.2 1.2 0.9 1.2 3.0 na na 9.9 9.51.5 1.5 0.4 1.3 1.1 0.9 -1.5 2.2 3.8 2.5 1.3 1.6 na na 1.8 1.7 10.4 10.61.5 1.5 0.0 1.5 1.0 1.0 -0.5 2.5 4.0 3.5 1.5 1.6 na na na na 10.2 10.41.5 2.2 0.3 1.4 1.4 1.1 -0.1 4.3 3.0 2.5 1.2 1.4 1.0 1.7 na na 10.7 10.41.4 1.7 0.4 1.1 1.7 0.3 -1.0 2.0 6.0 3.0 1.3 1.4 na na 1.5 1.0 9.7 9.01.2 1.6 -0.1 0.5 1.3 1.3 -1.3 2.6 1.1 1.0 1.3 1.7 na na 2.4 1.9 10.5 11.01.2 1.9 0.1 1.1 0.9 0.7 -1.4 0.9 2.2 2.6 1.0 1.6 1.0 1.9 na na 10.7 11.11.2 1.5 0.2 0.7 1.2 0.5 -0.8 2.7 3.9 2.6 1.4 1.4 na na na na 10.5 10.41.2 1.7 0.3 1.1 1.4 1.0 0.2 4.1 na na na na na na na na 10.3 10.31.1 1.2 0.9 1.8 1.2 1.2 1.6 5.5 9.6 8.0 1.3 1.4 -0.7 -0.2 1.8 0.5 9.8 9.21.1 1.3 0.0 1.1 1.6 1.1 -1.0 3.1 5.4 3.2 1.5 1.5 na na na na 10.2 10.01.0 1.4 0.2 0.8 1.1 1.1 -1.1 2.0 4.2 1.4 1.4 1.4 0.2 1.7 1.6 1.7 10.1 10.51.0 1.2 -0.2 0.6 1.0 1.0 -1.5 1.5 5.5 1.6 1.2 1.2 0.8 0.9 na na 10.3 10.31.0 1.3 0.3 0.8 1.6 1.2 -1.1 2.8 4.5 2.0 1.4 1.7 1.6 2.4 1.5 1.8 10.4 10.70.9 1.3 -0.2 0.7 1.1 0.9 -2.4 1.7 na na 1.5 1.8 1.8 3.4 1.6 1.3 10.4 10.50.9 1.1 0.3 0.9 1.6 1.0 0.3 2.3 na na 1.3 1.7 0.9 1.7 na na 10.7 10.70.9 1.4 0.2 1.0 0.6 0.5 -1.7 2.1 3.2 2.9 1.3 1.7 1.2 1.8 2.2 2.7 10.5 10.50.9 1.1 -0.1 0.7 1.3 0.7 -2.2 1.4 na na 1.3 0.7 na na 1.5 1.3 10.3 10.70.9 1.4 0.0 1.2 2.2 1.5 0.2 2.0 2.3 3.5 1.0 1.3 2.5 3.2 -0.5 0.5 10.7 11.10.9 1.6 0.0 1.1 1.0 0.7 -1.6 2.2 1.7 3.2 1.2 1.5 0.7 1.9 na na 10.4 10.80.9 1.2 0.4 0.8 1.0 0.5 -1.2 1.7 1.9 2.1 1.1 1.7 na na na na 10.4 10.50.9 1.1 -0.2 0.7 1.6 1.7 -1.6 1.8 na na 1.3 1.8 na na na na 10.4 10.40.8 1.0 0.0 0.5 1.1 0.4 -1.9 1.2 na na 1.4 1.3 na na 1.4 1.2 10.2 10.90.6 1.2 0.1 0.5 1.9 1.6 -1.2 1.1 na na 1.1 1.2 na na na na 10.7 11.0
1.2 1.5 0.2 1.0 1.4 1.1 -0.8 2.6 3.9 2.9 1.2 1.4 1.1 2.0 1.6 1.6 10.3 10.4
1.1 1.5 0.2 1.0 1.6 1.2 -0.6 2.5 2.7 2.9 1.1 1.4 1.0 2.0 1.7 1.8 10.4 10.51.3 1.6 0.2 1.0 1.9 1.3 0.0 2.4 3.0 2.8 1.2 1.5 0.9 1.9 2.0 1.9 10.4 10.41.8 2.6 0.9 1.8 2.2 2.0 3.0 5.5 9.6 8.0 1.5 1.8 2.5 3.4 2.4 2.7 10.7 11.10.6 1.0 -0.2 0.5 0.6 0.3 -2.4 0.9 1.1 1.0 0.8 0.7 -0.7 -0.2 -0.5 0.5 9.7 9.00.3 0.4 0.3 0.3 0.4 0.5 1.1 1.2 1.9 1.4 0.2 0.3 0.8 1.0 0.7 0.7 0.3 0.6
0.7 1.5 0.2 1.0 1.1 1.0 -1.9 2.1 1.1 1.5 10.7 10.91.0 1.60.9 1.7 0.0 1.1 1.1 0.8 -1.0 2.3 0.9 10.6 10.8
* % change on previous year 2006 2007 2008 2009
Gross Domestic Product* 3.1 2.7 0.5 -4.0
Private Consumption* 2.1 1.6 0.4 -1.0
Government Consumption* 2.1 2.3 2.1 2.3
Gross Fixed Capital Formation* 5.6 4.7 -0.9 -10.8
Industrial Production* 4.2 3.7 -1.8 -14.7
Consumer Prices* 2.2 2.1 3.3 0.3
Industrial Producer Prices* 5.1 2.7 6.1 -5.1
Hourly Labour Costs – Total* 2.2 2.4 3.5 3.3
Unemployment Rate, (%) 8.3 7.5 7.6 9.4
Exports - Goods & Services* 8.7 6.3 0.8 -12.8
Imports - Goods & Services* 8.6 5.5 0.9 -11.4
Current Account, Euro bn -10.2 10.7 -143 -57.5
General Govt. Budget Balance
(Maastricht definition), Euro bn -111 -52 -182 -555 e
Money Supply, M3, end period* 9.9 11.6 7.6 -0.3
Historical Data
EURO ZONE
YearAverage
GrossDomesticProduct
European Monetary Union
Euro zone - The sixteen European countries (listed at the top of thispage) are united by a common currency (the euro), monetary policy andadherence to the Maastricht Treaty. Monetary Policy - is set by theEuropean Central Bank’s (ECB) governing board, headed by Jean-Claude Trichet. Nominal GDP - Euro9,269bn (2008). Population -321.5mn (mid-year, 2008). $/Euro Exchange Rate - 1.472 (average,2008).
PrivateConsump-
tion
GovtCon-
sumption
GrossFixed
Invest-ment
IndustrialProduct-
ion
ConsumerPrices(HICP)
IndustrialProducer
Prices
HourlyLabourCosts– Total
Unemploy-ment
Rate (%)
Economic Forecasters
The EURO ZONE is: Austria,Belgium, Cyprus, Finland,France, Germany, Greece, Ire-land, Italy, Luxembourg, Malta,Netherlands, Portugal, Spain,Slovakia and Slovenia.
Average % Change on Previous Calendar Year
2010 2011 2010 2011 2010 2011 2010 2011 2010 2011 2010 2011 2010 2011 2010 2011 2010 2011
Percentage Change (year-on-year).
Quarterly Consensus ForecastsHistorical Data and Forecasts (bold italics) From Survey of
March 8, 20102009 2010 2011Q3 Q4 Q1 Q2 Q3 Q4 Q1 Q2 Q3 Q4
Gross DomesticProduct
PrivateConsumption
ConsumerPrices
-4.1 -2.1 0.7 1.3 1.2 1.4 1.5 1.4 1.5 1.5
-1.1 -0.6 -0.1 0.0 0.4 0.6 0.8 0.9 1.1 1.2
-0.4 0.4 1.0 1.1 1.2 1.2 1.3 1.3 1.4 1.5
e = consensus estimate based on latest survey

APRIL 2010
19© Copyright Consensus Economics Inc. 2010
-40.0
-35.0
-30.0
-25.0
-20.0
-15.0
-10.0
-5.0
0.0
5.0
10.0
Jan-98 Jan-99 Jan-00 Jan-01 Jan-02 Jan-03 Jan-04 Jan-05 Jan-06 Jan-07 Jan-08 Jan-09 Jan-10 Jan-11
6.8 5.3 4.9 5.4 na na na na na na6.7 3.5 4.0 4.1 -35.0 20.0 na na na na4.0 4.8 3.8 4.4 -15.0 0.0 -645 -570 3.5 5.07.0 7.7 5.2 7.6 -18.0 -13.0 na na na na8.3 8.1 5.7 7.7 10.1 23.8 -620 -520 na na5.3 4.3 3.5 4.1 0.0 35.0 -640 -555 na na5.0 6.0 4.0 5.5 na na na na na na4.4 5.7 3.9 5.0 -0.4 48.6 na na na na5.1 3.8 3.4 3.5 na na na na 2.5 5.07.1 7.8 5.9 6.8 na na na na na na4.6 4.4 2.5 2.6 -40.1 -25.2 -593 -569 3.4 6.26.1 5.1 4.4 4.5 -10.3 5.2 na na na na4.7 4.9 2.9 5.0 -8.0 16.0 -608 -582 na na9.0 6.2 9.4 11.0 na na na na na na5.9 5.1 5.1 5.7 60.9 137.7 -609 -571 na na6.0 5.6 5.0 5.4 6.8 -37.5 -650 -588 1.2 2.35.7 4.8 3.9 4.4 -25.0 -35.0 -618 -533 na na5.0 5.3 5.2 5.9 -40.0 20.0 -660 -650 2.4 4.55.5 4.2 3.3 3.6 na na na na na na3.3 2.8 2.6 3.2 na na -658 -610 na na4.4 3.6 3.2 3.4 -25.0 -0.5 -604 -521 5.0 6.44.8 4.4 3.3 4.2 28.0 10.0 -635 -585 na na4.4 2.9 2.9 2.5 -25.4 -14.5 -620 -560 na na4.5 4.9 2.9 4.8 13.0 23.6 -622 -524 na na4.8 3.7 3.9 3.1 -47.3 -37.2 -589 -522 5.1 6.54.7 2.5 3.0 2.5 42.7 65.2 -656 -598 na na3.8 2.4 2.3 2.0 na na na na 1.6 5.15.0 7.7 4.8 7.2 na na na na na na
5.4 4.9 4.1 4.8 -6.7 12.7 -627 -566 3.1 5.1
5.1 4.7 3.9 4.6 -14.6 0.6 -632 -572 3.2 5.14.9 4.5 3.8 4.3 -19.6 -4.9 -635 -566 3.3 4.99.0 8.1 9.4 11.0 60.9 137.7 -589 -520 5.1 6.53.3 2.4 2.3 2.0 -47.3 -37.5 -660 -650 1.2 2.31.3 1.6 1.4 2.0 28.9 41.5 23 37 1.5 1.4
-48.5 -44.4
-5.0-4.0-3.0-2.0-1.00.01.02.03.04.0
97 98 99 00 01 02 03 04 05 06 07 08 09 10 11 12 13 14 15
EURO ZONE
Consumer and Industrial ConfidenceDiffusion Indices for the EA 16Source: European Commission
Real Growth and Inflation
2010 2011 2010 2011 2010 2011 2010 2011 2010 2011
% balance ofresponses
%
CurrentAccount(€ bn)
GeneralGovt Budget
Balance(Maastricht)
(€ bn)
MoneySupply, M3,end period
<Forecast>
Exports ofGoods &Services
Imports ofGoods &Services
Average % Change onPrevious Calendar Year
Euro Zone Economic StatisticsThe source of all Historical Data (facing page) is Eurostat, withthe exception of the Current Account and the Money Supply, M3,which are from the European Central Bank. The base years andstatistics methodologies used by Eurostat may differ from thoseused by individual Euro zone-member countries included inConsensus Forecasts. Eurostat data is often drawn from thenational statistical agencies within the Euro zone but is adjustedto achieve standard classifications.
Consumer
Industrial
Euro Zone Interest RatesForecasts are provided by a total of more than 80 panel-lists for Germany (page 9), France (page 11), Italy (page15), the Netherlands (page 20) and Spain (page 22). Thisallows the analysis of forecasts for different yields onindividual country 10-year benchmark bonds. Forecastsfor 3-month interest rates are all for the EURIBOR rate.
Annual TotalAverage %Change onPrev. Year
Actual ---- Consensus -----Apr. 12 '10 End July '10 End Apr. '11
Euribor, 3-mth, % 0.6 0.8 1.5German 10-yr Govt Bond, % 3.2 3.4 3.8
Backward-Looking Data GloomyThe ECB kept its target rate unchanged on April 8 for theeleventh consecutive month. Despite inflation spiking at1.5% (y-o-y) in March (from 0.9% in February), the ECBindicated that interest rate levels were appropriate consider-ing the current economic environment. Data show the paceof the recovery is slowing and sentiment has been further hitby Greece’s fiscal crisis. Q4 GDP was revised down from0.1% (q-o-q) to zero growth, while unemployment edged upfrom 9.9% in January to break the 10%-mark the followingmonth. February retails sales fell again, by 0.6% (m-o-m), asthe result of faltering confidence. On the upside, the MarchPMI for manufacturing underscored a relatively upbeat out-look for industry. 2010 production forecasts have soared.
Euro Exchange RatesForecasts are provided by more than 100 panellists and areshown on page 27.
Euro zone Refinancing Rate – April 12, 2010 = 1.0%
1.00% 1.01% 1.08% 1.34%
1.00% 1.00% 1.00% 1.25%
ConsensusMean Average:
Mode (mostfrequent forecast):
FORECASTS End June End Sep. End Dec. End Mar.2010 2010 2010 2011
Real GDP (% chg yoy) Consumer Prices (% chg yoy)
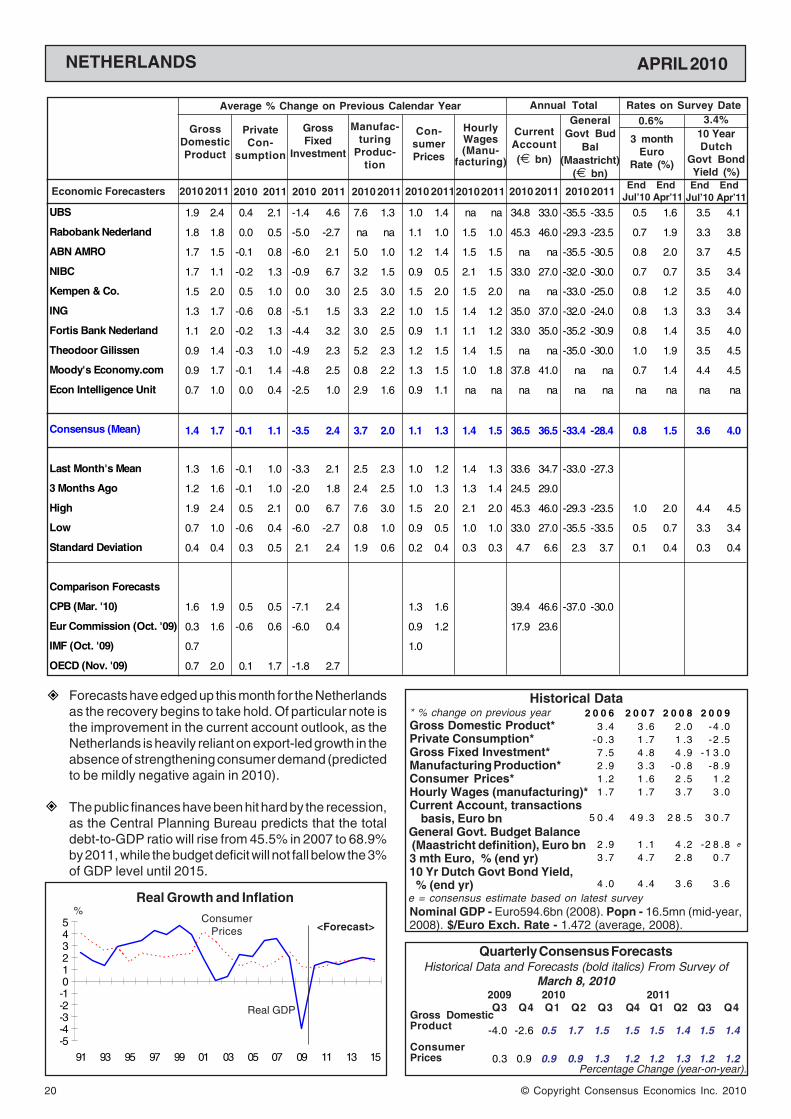
20
APRIL 2010
© Copyright Consensus Economics Inc. 2010
UBS
Rabobank Nederland
ABN AMRO
NIBC
Kempen & Co.
ING
Fortis Bank Nederland
Theodoor Gilissen
Moody's Economy.com
Econ Intelligence Unit
Consensus (Mean)
Last Month's Mean
3 Months Ago
High
Low
Standard Deviation
Comparison Forecasts
CPB (Mar. '10)
Eur Commission (Oct. '09)
IMF (Oct. '09)
OECD (Nov. '09)
1.9 2.4 0.4 2.1 -1.4 4.6 7.6 1.3 1.0 1.4 na na 34.8 33.0 -35.5 -33.5 0.5 1.6 3.5 4.1
1.8 1.8 0.0 0.5 -5.0 -2.7 na na 1.1 1.0 1.5 1.0 45.3 46.0 -29.3 -23.5 0.7 1.9 3.3 3.8
1.7 1.5 -0.1 0.8 -6.0 2.1 5.0 1.0 1.2 1.4 1.5 1.5 na na -35.5 -30.5 0.8 2.0 3.7 4.5
1.7 1.1 -0.2 1.3 -0.9 6.7 3.2 1.5 0.9 0.5 2.1 1.5 33.0 27.0 -32.0 -30.0 0.7 0.7 3.5 3.4
1.5 2.0 0.5 1.0 0.0 3.0 2.5 3.0 1.5 2.0 1.5 2.0 na na -33.0 -25.0 0.8 1.2 3.5 4.0
1.3 1.7 -0.6 0.8 -5.1 1.5 3.3 2.2 1.0 1.5 1.4 1.2 35.0 37.0 -32.0 -24.0 0.8 1.3 3.3 3.4
1.1 2.0 -0.2 1.3 -4.4 3.2 3.0 2.5 0.9 1.1 1.1 1.2 33.0 35.0 -35.2 -30.9 0.8 1.4 3.5 4.0
0.9 1.4 -0.3 1.0 -4.9 2.3 5.2 2.3 1.2 1.5 1.4 1.5 na na -35.0 -30.0 1.0 1.9 3.5 4.5
0.9 1.7 -0.1 1.4 -4.8 2.5 0.8 2.2 1.3 1.5 1.0 1.8 37.8 41.0 na na 0.7 1.4 4.4 4.5
0.7 1.0 0.0 0.4 -2.5 1.0 2.9 1.6 0.9 1.1 na na na na na na na na na na
1.4 1.7 -0.1 1.1 -3.5 2.4 3.7 2.0 1.1 1.3 1.4 1.5 36.5 36.5 -33.4 -28.4 0.8 1.5 3.6 4.0
1.3 1.6 -0.1 1.0 -3.3 2.1 2.5 2.3 1.0 1.2 1.4 1.3 33.6 34.7 -33.0 -27.3
1.2 1.6 -0.1 1.0 -2.0 1.8 2.4 2.5 1.0 1.3 1.3 1.4 24.5 29.0
1.9 2.4 0.5 2.1 0.0 6.7 7.6 3.0 1.5 2.0 2.1 2.0 45.3 46.0 -29.3 -23.5 1.0 2.0 4.4 4.5
0.7 1.0 -0.6 0.4 -6.0 -2.7 0.8 1.0 0.9 0.5 1.0 1.0 33.0 27.0 -35.5 -33.5 0.5 0.7 3.3 3.4
0.4 0.4 0.3 0.5 2.1 2.4 1.9 0.6 0.2 0.4 0.3 0.3 4.7 6.6 2.3 3.7 0.1 0.4 0.3 0.4
1.6 1.9 0.5 0.5 -7.1 2.4 1.3 1.6 39.4 46.6 -37.0 -30.0
0.3 1.6 -0.6 0.6 -6.0 0.4 0.9 1.2 17.9 23.6
0.7 1.0
0.7 2.0 0.1 1.7 -1.8 2.7
-5-4-3-2-1012345
91 93 95 97 99 01 03 05 07 09 11 13 15
* % change on previous yearGross Domestic Product*Private Consumption*Gross Fixed Investment*Manufacturing Production*Consumer Prices*Hourly Wages (manufacturing)*Current Account, transactions basis, Euro bn
General Govt. Budget Balance (Maastricht definition), Euro bn3 mth Euro, % (end yr)10 Yr Dutch Govt Bond Yield, % (end yr)
Nominal GDP - Euro594.6bn (2008). Popn - 16.5mn (mid-year,2008). $/Euro Exch. Rate - 1.472 (average, 2008).
CurrentAccount(€ bn)
Manufac-turing
Produc-tion
Average % Change on Previous Calendar Year
GrossDomesticProduct
Historical Data
10 YearDutch
Govt BondYield (%)
3 monthEuro
Rate (%)
PrivateCon-
sumption
GrossFixed
Investment
Con-sumerPrices
HourlyWages(Manu-
facturing)
Rates on Survey Date0.6% 3.4%
Real Growth and Inflation%
NETHERLANDS
Economic Forecasters
ConsumerPrices
Annual Total
Real GDP
<Forecast>
Percentage Change (year-on-year).
2010 2011 2010 2011 2010 2011
Quarterly Consensus ForecastsHistorical Data and Forecasts (bold italics) From Survey of
March 8, 20102009 2010 2011Q3 Q4 Q1 Q2 Q3 Q4 Q1 Q2 Q3 Q4
Gross DomesticProduct
ConsumerPrices
-4.0 -2.6 0.5 1.7 1.5 1.5 1.5 1.4 1.5 1.4
0.3 0.9 0.9 0.9 1.3 1.2 1.2 1.3 1.2 1.2
e = consensus estimate based on latest survey
Forecasts have edged up this month for the Netherlandsas the recovery begins to take hold. Of particular note isthe improvement in the current account outlook, as theNetherlands is heavily reliant on export-led growth in theabsence of strengthening consumer demand (predictedto be mildly negative again in 2010).
The public finances have been hit hard by the recession,as the Central Planning Bureau predicts that the totaldebt-to-GDP ratio will rise from 45.5% in 2007 to 68.9%by 2011, while the budget deficit will not fall below the 3%of GDP level until 2015.
GeneralGovt Bud
Bal(Maastricht)
(€ bn)
2010 2011 2010 2011
2 0 0 6 2 0 0 7 2 0 0 8 2 0 0 93 .4 3 .6 2 .0 -4 .0
-0 .3 1 .7 1 .3 -2 .57 .5 4 .8 4 .9 -1 3 .02 .9 3 .3 -0 .8 -8 .91 .2 1 .6 2 .5 1 .21 .7 1 .7 3 .7 3 .0
5 0 .4 4 9 .3 2 8 .5 3 0 .7
2 .9 1 .1 4 .2 -2 8 .8 e
3 .7 4 .7 2 .8 0 .7
4 .0 4 .4 3 .6 3 .6
2010 2011 2010 201120102011End End
Jul’10 Apr’11End End
Jul’10 Apr’11

APRIL 2010
21© Copyright Consensus Economics Inc. 2010
* % change on previous yearGDP (Mainland)*Private Consumption*Gross Fixed Investment*Manufacturing Production*Consumer Prices*Wages & Salaries per Full-Time Employee (Total)*Current Account, Nkr bnGeneral Govt. Bud Bal, Nkr bn3 mth Interbank Rate, % (end year)10 Yr Govt Bond Yield, % (end year)
Nominal GDP (total) - Nkr 2,548bn (2008). Population - 4.8mn (mid-yr, 2008). Nkr/$ Exchange Rate - 5.640 (average, 2008).
2.8 3.0 3.0 2.3 0.2 3.5 3.4 3.9 2.5 2.1 3.6 3.8 400 450 na na 2.8 3.9 4.1 4.5
2.6 2.9 4.2 3.1 -1.9 2.5 na na 2.0 2.1 3.3 3.4 370 410 na na na na 4.3 4.8
2.5 3.0 4.0 3.6 -1.6 3.4 2.4 5.6 2.9 1.5 3.5 3.5 298 285 162 166 2.4 3.1 4.3 4.6
2.5 3.0 4.1 3.3 -1.2 4.5 2.1 4.8 2.6 2.1 na na 301 264 na na na na na na
2.4 2.8 3.9 3.4 -0.1 4.1 0.7 2.5 1.9 2.2 na na 396 400 285 250 2.6 3.7 4.2 4.6
2.0 2.4 4.0 2.7 -6.8 0.2 na na 2.0 1.5 3.5 3.5 390 448 185 205 2.5 3.0 3.9 4.4
2.0 2.7 5.5 4.7 -3.1 -0.5 na na 1.7 1.3 3.4 3.4 388 418 na na 2.6 3.3 na na
1.5 2.6 4.1 3.2 -1.7 2.9 3.3 4.2 2.4 1.1 na na 402 417 280 300 na na na na
2.3 2.8 4.1 3.3 -2.0 2.6 2.4 4.2 2.3 1.7 3.5 3.5 368 387 228 230 2.6 3.4 4.2 4.6
2.4 2.6 4.0 3.2 -2.2 1.9 3.3 4.4 2.1 1.8 3.6 3.8 376 413 206 264
2.6 2.7 4.1 3.1 -1.9 2.4 3.8 4.3 1.6 1.9 3.8 4.0 382 425
2.8 3.0 5.5 4.7 0.2 4.5 3.4 5.6 2.9 2.2 3.6 3.8 402 450 285 300 2.8 3.9 4.3 4.8
1.5 2.4 3.0 2.3 -6.8 -0.5 0.7 2.5 1.7 1.1 3.3 3.4 298 264 162 166 2.4 3.0 3.9 4.4
0.4 0.2 0.7 0.7 2.2 1.8 1.1 1.1 0.4 0.4 0.1 0.2 43 71 64 58 0.1 0.4 0.2 0.1
2.3 2.8 5.0 4.3 2.5 1.8 3.8 4.3
1.3 3.2 4.4 4.5 0.4 5.3 1.6 2.2
ING Financial Markets
Citigroup
First Securities
Bank of America - Merrill
UBS
DnB NOR
Statistics Norway
JP Morgan
Consensus (Mean)
Last Month's Mean
3 Months Ago
High
Low
Standard Deviation
Comparison Forecasts
Bank of Norway (Apr. '10)
OECD (Nov. '09)
-2-101234567
91 93 95 97 99 01 03 05 07 09 11 13 15
NORWAY
Historical Data
10 YearGovt BondYield (%)
3 month InterbankRate (%)
Rates on Survey Date2.4% 3.8%
Real Growth and Inflation%
Economic Forecasters
<Forecast>Real Mainland GDP
ConsumerPrices
The Norges Bank left interest rates on hold in March afteranticipating that inflation and economic activity will belower than expected. Retail sales and industrial produc-tion initially fell on a monthly basis in January beforerecovering slightly in February, though the purchasingmanagers’ index for manufacturing in March remainedrelatively weak at 49.6. Production forecasts have dipped.
GDP forecasts have edged down slightly this month andthose for the current account have fallen even morenoticeably as the krone continues to appreciate againstthe euro.
Percentage Change (year-on-year).
Quarterly Consensus ForecastsHistorical Data and Forecasts (bold italics) From Survey of
March 8, 20102009 2010 2011Q3 Q4 Q1 Q2 Q3 Q4 Q1 Q2 Q3 Q4
Gross Domestic Product(Mainland)
ConsumerPrices
-1.7 -0.2 1.2 2.2 2.7 3.2 3.1 2.8 2.5 2.3
1.7 1.4 2.4 2.0 1.9 1.9 1.6 1.7 1.7 1.9
e = consensus estimate based on latest survey
CurrentAccount(Nkr bn)
Manufac-turing
Produc-tion
Average % Change on Previous Calendar Year
PrivateCon-
sumption
GrossFixed
Invest-ment
Con-sumerPrices
Annual Total
2010 2011 2010 2011 2010 2011
GeneralGovt
BudgetBalance(Nkr bn)
2010 2011 2010 20112010 2011 2010 2011 2010 2011
GrossDomesticProduct(Main-land)
Wages &Salaries
2 0 0 6 2 0 0 7 2 0 0 8 2 0 0 94 .5 5 .4 2 .0 - 1 .44 .8 5 .3 1 .1 0 .1
1 1 .7 1 2 .4 1 .3 - 7 .95 .5 5 .8 2 .9 - 6 .32 .3 0 .7 3 .8 2 .2
4 .8 5 .5 6 .0 4 .13 7 2 3 2 1 4 7 3 3 3 33 9 9 4 0 3 4 8 0 2 2 9 e
3 .9 5 .9 3 .9 2 .2
4 .4 4 .7 3 .9 4 .2
End EndJul’10 Apr’11
End EndJul’10 Apr’11

22
APRIL 2010
© Copyright Consensus Economics Inc. 2010
0.3 1.4 0.0 0.7 -2.9 2.2 0.6 1.3 0.9 1.3 na na -37.7 -22.2 -95 -75 0.5 1.6 3.5 4.1
-0.1 0.8 -0.4 1.1 -4.0 -0.8 -1.0 1.8 0.8 1.5 na na na na -122 -104 na na na na
-0.1 1.4 -0.3 1.0 -6.3 0.5 2.0 2.5 1.4 1.5 na na -40.0 -38.0 -106 -87 0.7 1.3 4.2 4.8
-0.3 1.1 -0.4 0.9 -5.9 1.0 -0.5 1.4 1.8 2.1 2.6 2.6 -58.6 -51.3 -118 -121 0.8 1.4 3.6 3.9-0.3 1.2 0.3 0.5 -4.0 0.7 1.0 2.1 1.7 1.7 na na -46.5 -49.0 na na 0.7 1.6 4.0 3.8
-0.4 1.5 -0.1 0.7 -5.7 0.7 -1.1 2.6 1.3 1.1 2.0 2.1 -40.4 -33.3 -109 -93 0.8 1.4 3.9 4.1
-0.4 0.1 -0.2 0.2 -4.6 0.2 -1.0 -2.2 1.3 1.0 na na -38.8 -57.6 -110 -102 0.8 1.5 4.3 4.6
-0.4 1.1 -0.4 1.2 -6.6 -1.3 na na 1.6 2.0 2.0 2.2 -46.6 -40.0 -114 -91 na na na na
-0.4 0.7 -0.2 0.9 -5.0 -2.0 -0.4 0.7 1.5 1.5 2.2 2.1 -43.1 -39.1 -90 -78 na na na na-0.5 1.1 -1.7 0.6 -5.9 2.2 -0.5 3.0 1.2 1.7 1.7 1.7 -45.6 -32.4 -113 -86 0.9 1.5 4.4 4.9
-0.5 1.4 -1.4 1.2 -4.8 2.1 -1.0 2.0 1.3 1.8 2.0 2.2 -55.0 -61.0 -110 -96 0.8 1.1 4.0 4.2
-0.6 0.6 -0.1 0.5 -4.3 -1.4 na na 1.0 1.4 na na -58.5 -55.8 -105 -95 na na 4.1 4.6
-0.6 0.7 -0.7 0.8 -7.0 -0.6 na na 1.1 2.1 na na -39.0 -36.0 -113 -101 0.7 1.3 4.2 4.4
-0.6 1.1 -1.1 0.3 -5.8 -2.1 -1.0 0.4 1.5 1.9 na na -23.9 -14.6 -107 -95 1.2 1.5 na na-0.7 0.8 0.1 1.2 -7.6 -2.9 1.5 4.0 1.2 1.3 na na -54.0 -46.7 -113 -90 0.8 1.3 4.2 4.7
-0.8 na -0.6 na -7.1 na -4.6 na 1.6 na na na -43.0 na -110 na 1.0 1.2 3.4 3.6
-0.8 na -0.5 na -7.2 na -2.0 na 1.5 na 2.0 na -40.0 na na na 1.0 1.7 4.0 4.5
-0.4 1.0 -0.5 0.8 -5.6 -0.1 -0.6 1.6 1.3 1.6 2.1 2.2 -44.4 -41.2 -109 -94 0.8 1.4 4.0 4.3
-0.4 1.1 -0.6 0.8 -5.4 0.1 -0.7 2.1 1.4 1.7 2.2 2.2 -45.9 -43.3 -108 -94
-0.4 1.2 -0.8 0.9 -6.3 0.1 -1.7 1.4 1.4 1.7 2.0 2.2 -47.8 -43.4
0.3 1.5 0.3 1.2 -2.9 2.2 2.0 4.0 1.8 2.1 2.6 2.6 -23.9 -14.6 -90 -75 1.2 1.7 4.4 4.9
-0.8 0.1 -1.7 0.2 -7.6 -2.9 -4.6 -2.2 0.8 1.0 1.7 1.7 -58.6 -61.0 -122 -121 0.5 1.1 3.4 3.60.3 0.4 0.5 0.3 1.3 1.6 1.6 1.6 0.3 0.3 0.3 0.3 8.9 13.4 8 11 0.2 0.2 0.3 0.4
-0.8 1.0 -0.5 0.9 -8.4 -1.3 0.8 2.0 -47.8 -44.5
-0.6 0.9-0.3 0.9 -1.1 0.6 -5.3 -0.8
UBSEcon Intelligence UnitBanestoCEPREDEHSBCLa CaixaCitigroupGrupo SantanderIFL-Univers Carlos IIICaja MadridInst L R Klein (Gauss)IHS Global InsightAFIGoldman SachsFUNCASBBVAInst Estud Economicos
Consensus (Mean)
Last Month's Mean 3 Months Ago HighLowStandard Deviation
Comparison ForecastsEur Commission (Oct. '09)IMF (Jan. '10)OECD (Nov. '09)
-4-3-2-10123456
91 93 95 97 99 01 03 05 07 09 11 13 15
Real GDP
* % change on previous yearGross Domestic Product*Household Consumption*Gross Fixed Investment*Industrial Production*Consumer Prices*Salary Cost per Hour*Current Account, Euro bn
General Govt. Budget Balance(Maastricht definition), Euro bn3 mth Euro, % (end yr)10 Yr Spanish Govt Bond Yield, % (end yr)
Nominal GDP - Euro1,095bn (2008). Popn - 44.5mn (mid-year,2008). $/Euro Exch. Rate - 1.472 (average, 2008).
SPAIN
10 YearSpanish
Govt BondYield (%)
3 monthEuro
Rate (%)
3.8%0.6%
Economic Forecasters
Real Growth and Inflation%
Historical Data
Rates on Survey Date
ConsumerPrices <Forecast>
2 0 0 6 2 0 0 7 2 0 0 8 2 0 0 94 .0 3 .6 0 .9 - 3 .63 .8 3 .6 - 0 .6 - 5 .07 .2 4 .6 - 4 .4 - 1 5 .33 .7 2 .4 - 7 .1 - 1 6 .23 .5 2 .8 4 .1 - 0 .33 .1 4 .7 4 .1 4 .7
- 8 8 .3 - 1 0 5 - 1 0 6 - 5 7 .2
1 9 .8 2 0 .1 - 4 4 .3 - 1 1 7 e
3 .7 4 .7 2 .8 0 .7
4 .0 4 .4 3 .8 4 .0
In a bid to avoid the same outcome as Greece, primeminister Zapatero is taking radical steps to shake up thenation’s finances and restore confidence amongst inves-tors. Though progress has been made by securing thecooperation of the regional governments in making cuts,social security spending shows no signs of easing asunemployment rose further, by around 59,000 from Feb-ruary to March.
The PMIs for manufacturing and services finally roseabove 50 in March, indicating expansion in the sectors,though the levels are still below the Euro zone average.
Percentage Change (year-on-year).
Quarterly Consensus ForecastsHistorical Data and Forecasts (bold italics) From Survey of
March 8, 20102009 2010 2011Q3 Q4 Q1 Q2 Q3 Q4 Q1 Q2 Q3 Q4
Gross DomesticProduct
ConsumerPrices
-4.0 -3.1 -1.5 -0.4 -0.1 0.2 0.5 0.8 1.2 1.5
-1.1 0.1 1.0 1.0 1.5 1.6 1.7 1.8 1.5 1.6
e = consensus estimate based on latest survey
SalaryCost per
Hour
HouseholdConsump-
tion
IndustrialProduc-
tion
CurrentAccount(€ bn)
Average % Change on Previous Calendar Year
GrossDomesticProduct
GrossFixed
Invest-ment
Con-sumerPrices
Annual Total
2010 2011 2010 2011 2010 2011
GeneralGovt Bud
Bal(Maastricht)
(€ bn)
2010 2011 2010 20112010 2011 2010 2011 2010 2011 End EndJul’10 Apr’11
End EndJul’10 Apr’11

APRIL 2010
23© Copyright Consensus Economics Inc. 2010
NordeaSE BankenErik Penser BankCitigroupConfed of Swed EnterpriseNational Institute - NIERSBABGoldman SachsHQ BankSwedbankUBSJP MorganING Financial MarketsMorgan StanleyBank of America Merril
Consensus (Mean)
Last Month's Mean 3 Months Ago HighLowStandard Deviation
Comparison ForecastsRiksbank (Oct. '09)Eur Commission (Oct. '09)IMF (Oct. '09)OECD (Nov. '09)
3.2 2.4 2.8 2.2 -1.0 4.1 na na 1.7 2.4 na na 237 233 -55 -43 0.7 2.4 3.5 3.93.1 2.7 2.9 2.6 0.0 5.0 na na 1.3 2.4 1.9 2.3 na na na na 0.5 2.2 3.4 3.7
3.0 2.3 3.0 1.8 -1.0 4.9 na na 1.4 1.8 1.5 2.2 210 210 na na 0.8 1.5 3.5 3.8
2.4 2.5 2.4 2.0 -1.7 4.2 na na 1.4 2.4 2.0 2.3 230 240 na na na na 3.5 4.3
2.4 2.6 2.6 2.2 -4.0 5.0 5.0 5.5 1.6 3.3 na na 230 240 na na 1.0 2.0 3.5 4.02.4 3.8 2.2 3.0 1.6 6.5 3.3 6.9 1.0 1.6 2.0 1.9 190 228 -38 -37 0.4 1.2 3.7 4.1
2.2 3.0 1.7 2.6 0.3 5.0 4.5 4.0 1.0 2.3 1.6 2.2 230 250 -45 -35 0.6 1.6 3.5 4.2
2.0 3.6 1.8 2.2 -4.0 3.3 5.5 9.9 1.4 2.7 na na 279 324 -109 -85 0.5 2.5 na na
2.0 2.7 1.5 2.8 0.0 4.5 5.2 6.5 0.9 1.5 2.5 2.5 na na -70 -70 0.6 1.5 3.6 4.0
2.0 2.6 2.2 2.5 -3.2 3.5 5.3 6.2 0.9 2.2 2.0 2.0 na na na na 0.5 1.5 3.4 3.81.9 2.8 1.8 1.9 -3.5 4.7 2.8 5.8 1.8 2.3 na na 183 215 -106 -92 0.5 1.7 3.4 4.2
1.6 3.0 2.2 2.5 -4.6 3.5 4.5 5.3 1.3 2.6 na na 225 228 -50 -20 na na na na
1.5 2.4 1.7 2.1 -3.1 5.8 3.4 4.5 1.4 1.8 2.0 2.5 235 230 na na 0.5 1.7 3.4 3.7
1.5 2.3 1.6 1.8 -2.4 5.6 na na 1.5 1.9 na na 215 246 -120 -103 0.6 1.7 4.0 4.8
1.2 2.7 0.9 1.3 -2.8 2.1 na na 0.8 1.6 na na 192 181 -108 -141 na na na na
2.2 2.8 2.1 2.2 -2.0 4.5 4.4 6.1 1.3 2.2 1.9 2.2 221 235 -78 -70 0.6 1.8 3.5 4.0
2.1 2.6 1.9 2.2 -1.5 4.2 4.6 5.6 1.1 2.0 2.1 2.2 229 241 -72 -74
2.3 2.6 1.9 2.1 -1.5 4.1 4.2 5.5 1.0 2.1 2.2 2.2 227 2403.2 3.8 3.0 3.0 1.6 6.5 5.5 9.9 1.8 3.3 2.5 2.5 279 324 -38 -20 1.0 2.5 4.0 4.8
1.2 2.3 0.9 1.3 -4.6 2.1 2.8 4.0 0.8 1.5 1.5 1.9 183 181 -120 -141 0.4 1.2 3.4 3.7
0.6 0.4 0.6 0.4 1.9 1.1 1.0 1.7 0.3 0.5 0.3 0.2 26 34 32 39 0.2 0.4 0.2 0.3
2.5 2.0 -1.8 0.9
1.4 2.1 1.0 1.5 -1.5 3.2
1.2
2.0 3.0 1.7 2.4 -2.0 5.5 1.4 3.2
-6-4-202468
10
91 93 95 97 99 01 03 05 07 09 11 13 15
* % change on previous yearGross Domestic Product*Household Consumption*Gross Fixed Investment*Min. & Manufacturing Prodn*Consumer Prices*Average Hourly Earnings (Mining & Manufacturing)*Current Account, Skr bnGeneral Govt. Bud Bal, Skr bn3 mth Interbank Rate, % (end yr)10 Yr Govt Bond Yield, % (end yr)
Nominal GDP - Skr 3,157bn (2008). Population - 9.2mn (mid-year, 2008). Skr/$ Exchange Rate - 6.591 (average, 2008).
Historical Data
0.5%
10 YearGovt BondYield (%)
Real Growth and Inflation%
SWEDEN
Economic Forecasters
Rates on Survey Date
<Forecast>RealGDP
ConsumerPrices
2 0 0 6 2 0 0 7 2 0 0 8 2 0 0 94 .5 2 .7 - 0 .5 - 4 .72 .5 3 .1 - 0 .4 - 0 .79 .6 7 .8 2 .1 - 1 5 .15 .3 4 .1 - 3 .5 - 1 9 .21 .4 2 .2 3 .5 - 0 .3
3 .0 3 .9 4 .1 2 .02 3 1 2 5 7 3 0 0 2 2 5
n 7 0 .1 1 1 6 7 9 .7 - 4 5 .8 e
3 .3 4 .7 2 .4 0 .5
3 .8 4 .4 2 .4 3 .4
3.2%
Percentage Change (year-on-year).
Quarterly Consensus ForecastsHistorical Data and Forecasts (bold italics) From Survey of
March 8, 20102009 2010 2011Q3 Q4 Q1 Q2 Q3 Q4 Q1 Q2 Q3 Q4
Gross DomesticProduct
ConsumerPrices
-5.4 -1.5 0.5 1.2 2.3 3.5 2.9 2.8 2.8 2.7
-1.2 -0.4 0.9 1.0 1.1 1.2 1.4 1.8 2.2 2.4
3 monthInterbankRate (%)
e = consensus estimate based on latest survey
While confidence surveys suggest that a recovery isforthcoming, with the purchasing managers’ index stabil-ising around 61 and various consumer confidence indi-ces rising, other data is less supportive. February was abad month as the trade surplus fell sharply after importsgrew at a much faster pace than exports. Furthermore,retail sales were down 1% (m-o-m) and industrial produc-tion contracted by 0.8% (m-o-m).
The situation is expected to improve as the year goes on,however, as consensus forecasts for GDP growth edgeup this month to 2.2% and 2.8% for this year and next.
Mining &Manu-
facturingProduc-
tion
HourlyEarnings(Mining &Manuf.)
House-holdCon-
sumption
Average % Change on Previous Calendar Year
GrossDomesticProduct
GrossFixed
Invest-ment
Con-sumerPrices
Annual Total
2010 2011 2010 2011 2010 2011
GeneralGovt
BudgetBalance(Skr bn)
2010 2011 2010 20112010 20112010 2011 2010 2011
CurrentAccount(Skr bn)
End EndJul’10 Apr’11
End EndJul’10 Apr’11

24
APRIL 2010
© Copyright Consensus Economics Inc. 2010
2.5 2.1 1.7 1.7 3.3 3.0 na na 1.3 1.5 na na na na na na na na 2.3 2.8
2.5 2.8 2.0 1.9 8.9 4.9 12.1 7.1 1.0 0.8 215 234 55.6 65.5 -11.0 -9.0 na na na na
2.3 2.5 1.5 2.0 6.0 4.0 na na 1.2 1.2 na na 60.0 70.0 -0.5 1.0 na na na na
2.1 1.6 1.2 1.2 3.0 12.0 15.2 7.8 1.1 0.8 na na na na na na na na na na
2.0 1.6 1.1 1.7 2.0 0.7 4.3 1.3 1.1 1.4 192 199 55.8 56.5 -5.9 -4.7 0.3 1.0 2.1 2.6
2.0 1.5 1.4 1.1 4.0 2.6 4.2 4.0 1.2 1.2 na na 53.0 55.6 na na 0.3 0.8 2.2 2.5
1.9 1.9 1.5 1.7 4.1 2.3 na na 0.8 1.1 na na na na -6.0 -5.2 0.4 0.8 1.9 2.1
1.9 1.8 1.2 1.1 2.6 3.4 4.9 3.3 1.2 1.0 189 198 57.4 62.7 -8.2 -7.4 0.3 1.1 2.2 2.9
1.9 2.3 1.8 2.1 7.1 4.8 na na 0.7 1.0 na na 55.0 60.0 -0.5 0.0 0.3 1.0 2.2 2.6
1.7 1.9 1.2 1.4 3.3 1.4 5.2 6.0 0.8 1.2 na na 43.2 47.4 na na 0.3 1.0 na na
1.7 2.2 2.1 2.0 1.8 6.3 na na 0.9 1.0 189 202 47.9 43.5 -7.9 -4.6 0.3 0.8 2.2 2.7
1.4 1.8 1.5 1.7 5.2 3.3 5.5 7.5 1.2 1.7 197 214 45.3 52.5 na na 0.3 0.8 1.9 2.0
1.2 1.7 0.5 1.0 0.5 0.4 2.5 3.4 0.9 0.9 188 200 49.8 64.0 -9.5 -10.5 0.3 1.0 2.2 2.6
1.0 1.1 0.5 0.7 0.5 1.1 3.3 0.7 0.9 0.8 na na na na na na na na na na
0.9 2.0 1.0 1.3 -1.4 2.1 na na 0.8 1.0 na na 57.0 62.0 na na 0.3 0.8 2.0 2.4
1.8 1.9 1.3 1.5 3.4 3.5 6.4 4.6 1.0 1.1 195 208 52.7 58.2 -6.2 -5.1 0.3 0.9 2.1 2.5
1.5 1.8 1.2 1.4 2.4 2.6 4.1 4.0 0.8 1.1 206 219 50.0 58.1 -6.3 -5.9
1.2 1.7 0.8 1.3 0.9 3.4 4.3 4.7 0.7 1.0 190 202 51.4 58.5
2.5 2.8 2.1 2.1 8.9 12.0 15.2 7.8 1.3 1.7 215 234 60.0 70.0 -0.5 1.0 0.4 1.1 2.3 2.9
0.9 1.1 0.5 0.7 -1.4 0.4 2.5 0.7 0.7 0.8 188 198 43.2 43.5 -11.0 -10.5 0.3 0.8 1.9 2.0
0.5 0.4 0.5 0.4 2.7 2.9 4.3 2.7 0.2 0.3 10 14 5.4 8.0 3.9 4.0 0.0 0.1 0.1 0.3
0.5 0.5
0.9 1.9 1.2 1.4 1.1 2.1 0.6 0.41.4 2.0 1.3 1.5 0.8 0.7
UBS
JP Morgan
Pictet & Cie
Swiss Life
Zürcher Kantonalbank
HSBC
Bank Vontobel
IHS Global Insight
ING Financial Markets
Goldman Sachs
KOF Swiss Econ Inst
Bank Julius Baer
BAK Basel
Econ Intelligence Unit
Credit Suisse
Consensus (Mean)
Last Month's Mean
3 Months Ago
High
Low
Standard Deviation
Comparison Forecasts
IMF (Oct. '09)
OECD (Nov. '09)SECO (Mar. '10)
-2-10123456
91 93 95 97 99 01 03 05 07 09 11 13 15
* % change on previous yearGross Domestic Product*Private Consumption*Gross Fixed Investment*Industrial Production*Consumer Prices*Merch Exports, SwFr bnCurrent Account, SwFr bnGeneral Govt. Bud. Bal. SwFr bn3 mth Euro-Franc Rate, % (end yr)10 Yr Govt Bond Yield, % (end yr)
Nominal GDP - SwFr 532.1bn (2008). Population - 7.5mn (mid-year, 2008). SwFr/$ Exchange Rate - 1.083 (average, 2008).
Historical Data
Rates on Survey Date2.0%0.3%
10 YearGovt BondYield (%)
3 monthEuro-
Franc Rate(%)
Real Growth and Inflation%
SWITZERLAND
Economic Forecasters
Real GDP
ConsumerPrices <Forecast>
The recovery in Switzerland appears to be picking uppace, as the government agency SECO upgraded itsforecast for 2010 GDP from 0.7% to 1.4%. Consensusforecasts have also improved, reaching 1.8% this month.Expectations were driven by surges in exports andmanufacturing as the global recovery takes hold. ThePMI for manufacturing even jumped from 57.4 in Februaryto 65.5 in March, indicating a significant expansion.
One factor which may hold back the recovery is a furtherrise in the Swiss franc against the euro, which coulddamage exports.
Percentage Change (year-on-year).
Quarterly Consensus ForecastsHistorical Data and Forecasts (bold italics) From Survey of
March 8, 20102009 2010 2011Q3 Q4 Q1 Q2 Q3 Q4 Q1 Q2 Q3 Q4
Gross DomesticProduct
ConsumerPrices
-1.4 0.0 1.0 1.6 1.6 1.5 1.5 1.7 1.9 2.1
-1.0 -0.2 0.9 0.7 0.7 0.7 0.9 1.0 1.2 1.2
e = consensus estimate based on latest survey
2 0 0 6 2 0 0 7 2 0 0 8 2 0 0 93 .6 3 .6 1 .8 -1 .51 .6 2 .4 1 .7 1 .24 .7 5 .2 0 .4 -3 .77 .8 9 .5 1 .3 -7 .91 .1 0 .7 2 .4 -0 .5
1 7 7 1 9 8 2 0 6 1 8 07 4 .2 4 6 .8 1 1 .1 4 4 .7
8 .4 1 1 .2 5 .6 1 .2 e
2 .1 2 .8 1 .1 0 .3
2 .5 3 .1 2 .2 2 .0
Average % Change on Previous Calendar Year
GrossDomesticProduct
GrossFixed
Invest-ment
Con-sumerPrices
Annual Total
2010 2011 2010 2011 2010 2011 2010 20112010 2011 2010 2011 2010 2011
Merchan-dise
Exports(SwFr bn)
PrivateConsump-
tion
CurrentAccount
(SwFr bn)
IndustrialProduc-
tion
GeneralGovt
BudgetBalance
(SwFr bn)End End
Jul’10 Apr’11End End
Jul’10 Apr’112010 2011

© Copyright Consensus Economics Inc. 2010
APRIL 2010
25
Bank Leumi Bank of America – Merrill Lynch Citigroup
Danske Bank DnB Economist Intelligence Unit
Experian Fitch Ratings Forecaster ECOSA
Moody’s Economy.com Oxford Economics UniCredit
Nominal GDP - US$341.2bn (2008)Gross Domestic Product (% change on previous year)
Manufacturing Production (% change on previous year)Consumer Prices (% change on previous year)Current Account (US Dollar bn)
Nominal GDP - US$506.2bn (2008)Gross Domestic Product (% change on previous year)Industrial Production (% change on previous year)
Consumer Prices (% change on previous year)Current Account (US Dollar bn)
Nominal GDP - US$357.5bn (2008)Gross Domestic Product (% change on previous year)
Industrial Production (% change on previous year)Consumer Prices (% change on previous year)Current Account (US Dollar bn)
Nominal GDP - US$274.0bn (2008)Gross Domestic Product (% change on previous year)
Industrial Production (% change on previous year)Consumer Prices (% change on previous year)Current Account (US Dollar bn)
Nominal GDP - US$169.7bn (2008)1
Gross Domestic Product (% change on previous year)1
Consumer Prices (% change on previous year)
Current Account (US Dollar bn)
Nominal GDP - US$415.5bn (2008)Gross Domestic Product (% change on previous year)Industrial Production (% change on previous year)
Consumer Prices (% change on previous year)Current Account (US Dollar bn)
ADDITIONAL COUNTRIES
AUSTRIA Population - 8.3mn (2008, mid-year) Consensus Forecasts Historical Data
BELGIUM Population - 10.6mn (2008, mid-year) Consensus Forecasts Historical Data
DENMARK Population - 5.5mn (2008, mid-year) Consensus Forecasts Historical Data
EGYPT Population - 81.5mn (2008, mid-year) Consensus Forecasts Historical Data
FINLAND Population - 5.3mn (2008, mid-year) Consensus Forecasts Historical Data
GREECE Population - 11.1mn (2008, mid-year) Consensus Forecasts Historical Data
1 year(s) ending June 30
Forecasts for the countries in Western Europe, the Middle East and Africa shown on the next two pages were provided bythe following leading economic forecasters:
2006 2007 2008 2009 2010 20113.5 3.5 2.0 -3.6 1.3 1.67.1 5.3 1.4 -10.1 0.8 2.31.4 2.1 3.3 0.6 1.2 1.69.2 13.2 13.3 7.3 e 7.9 9.6
2006 2007 2008 2009 2010 20112.8 2.8 0.8 -3.0 1.3 1.75.0 2.8 -0.6 -13.4 -0.6 3.01.8 1.8 4.5 -0.1 1.1 1.68.0 7.3 -14.9 2.5 1.8 4.1
2006 2007 2008 2009 2010 20113.4 1.7 -0.9 -4.9 1.2 1.95.5 1.0 -0.3 -17.2 0.2 2.41.9 1.7 3.4 1.3 1.4 1.88.2 4.6 7.5 12.4 9.0 8.2
2006 2007 2008 2009 2010 2011
6.8 7.1 7.2 4.7 e 5.2 5.6
7.6 9.4 18.3 11.8 11.5 10.8
2.6 0.4 -1.4 -3.2 e -2.7 -2.1
2006 2007 2008 2009 2010 20114.4 4.8 1.2 -7.8 1.2 2.29.9 4.5 0.7 -20.9 2.9 4.11.6 2.5 4.0 0.0 1.2 1.78.8 10.5 8.5 3.2 4.4 5.1
2006 2007 2008 2009 2010 20114.5 4.5 2.0 -2.0 -2.6 -0.51.1 2.2 -4.0 -9.5 -3.1 1.13.2 2.9 4.2 1.2 1.8 1.6
-30.0 -44.9 -51.2 -37.5 -28.2 -23.6
e = consensus estimate based on latest survey

© Copyright Consensus Economics Inc. 2010
APRIL 2010
26
Nominal GDP - US$244.6bn (2008)
Gross Domestic Product (% change on previous year)Industrial Production (% change on previous year)Consumer Prices (% change on previous year)
Current Account (US Dollar bn)
Nominal GDP - US$468.8bn (2008)
Gross Domestic Product (% change on previous year)
Consumer Prices (% change on previous year)
Current Account (US Dollar bn)
Nominal GDP - US$199.0bn (2008)Gross Domestic Product (% change on previous year)Industrial Production (% change on previous year)
Consumer Prices (% change on previous year)Current Account (US Dollar bn)
Nominal GDP - US$276.4bn (2008)Gross Domestic Product (% change on previous year)
Manufacturing Production (% change on previous year)Consumer Prices (% change on previous year)Current Account (US Dollar bn)
Nominal GDP - US$267.6bn (2008)Gross Domestic Product (% change on previous year)Industrial Production (% change on previous year)
Consumer Prices (% change on previous year)Current Account (US Dollar bn)
IRELAND Population - 4.4mn (2008, mid-year) Consensus Forecasts Historical Data
ISRAEL Population - 7.1mn (2008, mid-year) Consensus Forecasts Historical Data
NIGERIA Popn - 151.2mn (2008, mid-year) Consensus Forecasts Historical Data
PORTUGAL Population - 10.7mn (2008, mid-year) Consensus Forecasts Historical Data
SAUDI ARABIA Popn - 25.2mn (2008, mid-year) Consensus Forecasts Historical Data
SOUTH AFRICA Popn - 49.7mn (2008, mid-year) Consensus Forecasts Historical Data
2006 2007 2008 2009 2010 20115.4 6.0 -3.0 -7.1 -1.1 2.42.8 5.1 -1.8 -3.9 0.1 3.83.9 4.9 4.1 -4.5 -0.7 1.3
-8.0 -13.9 -13.9 -6.8 -2.4 -0.6
2006 2007 2008 2009 2010 20115.3 5.2 4.2 0.2 2.9 3.98.7 5.2 7.0 -6.0 3.0 3.52.1 0.5 4.6 3.3 2.8 2.67.4 4.9 1.3 7.2 4.9 4.7
2006 2007 2008 2009 2010 20111.4 1.9 0.0 -2.7 0.5 1.03.0 0.2 -4.0 -8.4 1.0 2.23.1 2.4 2.6 -0.8 0.9 1.3
-19.5 -21.0 -29.4 -23.6 -20.3 -20.0
2006 2007 2008 2009 2010 2011
3.2 3.3 4.4 0.2 e 4.0 4.6
2.2 4.2 9.9 5.0 4.9 4.9
99.1 93.4 132.3 19.0 e 50.3 60.1
2006 2007 2008 2009 2010 20115.6 5.5 3.7 -1.8 2.9 3.84.7 4.6 0.8 -12.3 7.7 5.74.6 7.2 11.5 7.1 6.0 6.0
-13.7 -20.5 -19.6 -11.4 -16.2 -18.1
2006 2007 2008 2009 2010 2011
6.2 6.4 5.3 5.8 e 5.8 6.3
8.2 5.5 11.6 12.3 11.2 11.0
38.2 30.9 39.4 12.1 e 24.1 23.9
Nominal GDP - US$201.2bn (2008)
Gross Domestic Product (% change on previous year)
Consumer Prices (% change on previous year)
Current Account (US Dollar bn)
ADDITIONAL COUNTRIES
e = consensus estimate based on latest survey

© Copyright Consensus Economics Inc. 2010
APRIL 2010
27
APRIL2010 OIL PRICES
FOREIGN EXCHANGE FORECASTS
Foreign Exchange Rates
Rates at end of:
2006 2007 2008 2009
LatestSpotRate
(Apr. 12)
Forecast End July
2010
PercentChange
ForecastEnd Apr.
2011
PercentChange
PercentChange
Consensus ForecastsHistorical Data
West Texas Intermediate, US$ per barrel
1All US$ rates are amounts ofcurrency per dollar, except theUK pound and the euro which arereciprocals. A positive (+) signfor the % change implies an ap-preciation of the currency againstthe US Dollar and vice versa.
US$ per Euro1Yen per US$
ForecastEnd Apr.
2012
Rates per US Dollar
Canadian Dollar 1.165 0.998 1.225 1.048
Egyptian Pound 5.704 5.504 5.504 5.485
European Euro 1.317 1.472 1.389 1.435
Israeli Shekel 4.225 3.846 3.777 3.788
Japanese Yen 119.0 114.0 90.75 93.10
Nigerian Naira 128.3 118.0 132.6 149.5
Saudi Arabian Riyal 3.745 3.750 3.750 3.751
South African Rand 6.970 6.810 9.305 7.364
United Kingdom Pound 1.963 2.003 1.458 1.615
Rates per Euro
Danish Krone 7.456 7.471 7.340 7.441
Norwegian Krone 8.244 7.964 9.722 8.288
Swedish Krona 9.040 9.441 10.85 10.24
Swiss Franc 1.607 1.657 1.477 1.483
80.0
90.0
100.0
110.0
120.0
130.0
140.0
150.0Jan-93 Jan-95 Jan-97 Jan-99 Jan-01 Jan-03 Jan-05 Jan-07 Jan-09
0.800
0.900
1.000
1.100
1.200
1.300
1.400
1.500
1.600
Jan-93 Jan-95 Jan-97 Jan-99 Jan-01 Jan-03 Jan-05 Jan-07 Jan-091.30
1.35
1.401.45
1.50
1.55
1.60
1.65
1.70
1.75
1.80
1.85
1.90
1.95
2.00
2.05
2.10
Jan-93 Jan-95 Jan-97 Jan-99 Jan-01 Jan-03 Jan-05 Jan-07 Jan-09
US$ per UK Pound
1
1 historical rates up to January 1, 1999, are calculatedas "synthetic" euro exchange rates based on a weightedaverage of the eleven original component currencies.
Range 1985-2010Spot Rate (April 12)
AprilSurvey
Mean Forecast
HighLowStandard DeviationNo. of Forecasts
145.3 - 10.484.3
Forecast forEnd July End Apr.
2010 2011
1.002 1.017 -1.5 1.040 -3.6 1.053 -4.9
5.518 5.549 -0.6 5.593 -1.3 5.673 -2.7
1.361 1.340 -1.5 1.326 -2.5 1.329 -2.4
3.680 3.748 -1.8 3.696 -0.4 3.701 -0.6
93.31 94.10 -0.8 98.29 -5.1 99.55 -6.3
150.6 151.7 -0.7 155.2 -3.0 158.6 -5.0
3.750 3.749 0.0 3.749 0.0 3.749 0.0
7.239 7.519 -3.7 7.938 -8.8 8.423 -14.1
1.539 1.512 -1.8 1.537 -0.1 1.563 +1.6
7.443 7.450 -0.1 7.450 -0.1 7.448 -0.1
8.004 7.909 +1.2 7.783 +2.8 7.756 +3.2
9.759 9.607 1.6 9.362 +4.2 9.250 +5.5
1.440 1.438 0.1 1.449 -0.6 1.463 -1.6
Oil Prices Step into Higher GearWest Texas Intermediate (WTI) hit US$86 per barrel on the week ofApril 5 and remained strong on the back of the Euro zone agreeingto a €30bn loan to help struggling Greece. The price of crude hasrisen by 75% over the past year and from US$71.7 in February,spurred by the global economic recovery. OPEC’s current productionquotas now look increasingly geared towards a lower price level,though observers speculate that the oil cartel will hold off fromexpanding output for the time being. The possibility that futuresmight even surge to US$100 per barrel could derail the nascentrebound in activity. Indeed, the International Energy Agency hasonce again raised its 2010 forecast for oil demand, to 86.6mn barrelsper day. Our panel has also raised the likelihood of a higher US$80-100 trading range (see left).
81.4 83.8
94.5 99.066.0 70.0
5.6 6.167 65
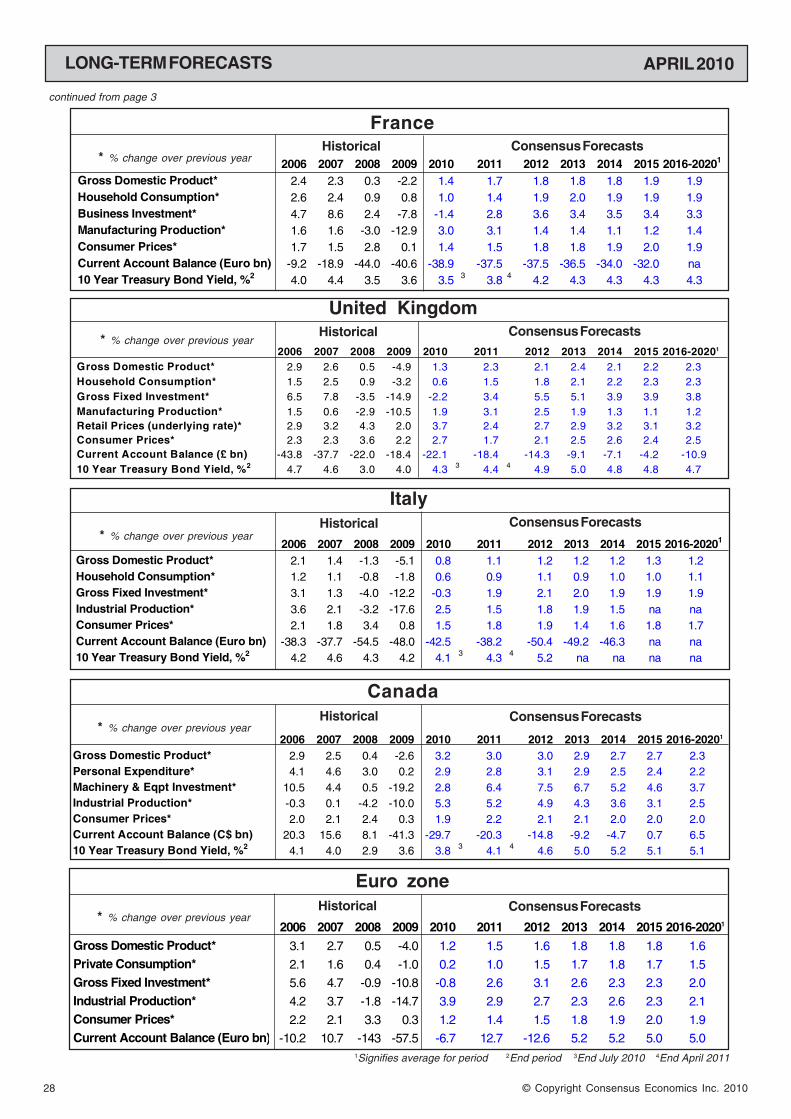
28 © Copyright Consensus Economics Inc. 2010
APRIL 2010LONG-TERM FORECASTS
continued from page 3
United Kingdom
FranceConsensus Forecasts
* % change over previous yearHistorical
Italy
Consensus Forecasts* % change over previous year
Historical
Consensus Forecasts* % change over previous year
CanadaHistorical
* % change over previous yearConsensus Forecasts
Historical
2006 2007 2008 2009 2010 2011 2012 2013 2014 2015 2016-20201
Gross Domestic Product* 2.1 1.4 -1.3 -5.1 0.8 1.1 1.2 1.2 1.2 1.3 1.2Household Consumption* 1.2 1.1 -0.8 -1.8 0.6 0.9 1.1 0.9 1.0 1.0 1.1Gross Fixed Investment* 3.1 1.3 -4.0 -12.2 -0.3 1.9 2.1 2.0 1.9 1.9 1.9Industrial Production* 3.6 2.1 -3.2 -17.6 2.5 1.5 1.8 1.9 1.5 na naConsumer Prices* 2.1 1.8 3.4 0.8 1.5 1.8 1.9 1.4 1.6 1.8 1.7Current Account Balance (Euro bn) -38.3 -37.7 -54.5 -48.0 -42.5 -38.2 -50.4 -49.2 -46.3 na na10 Year Treasury Bond Yield, %2 4.2 4.6 4.3 4.2 4.1 3 4.3 4 5.2 na na na na
2006 2007 2008 2009 2010 2011 2012 2013 2014 2015 2016-20201
Gross Domestic Product* 2.9 2.6 0.5 -4.9 1.3 2.3 2.1 2.4 2.1 2.2 2.3Household Consumption* 1.5 2.5 0.9 -3.2 0.6 1.5 1.8 2.1 2.2 2.3 2.3Gross Fixed Investment* 6.5 7.8 -3.5 -14.9 -2.2 3.4 5.5 5.1 3.9 3.9 3.8Manufacturing Production* 1.5 0.6 -2.9 -10.5 1.9 3.1 2.5 1.9 1.3 1.1 1.2Retail Prices (underlying rate)* 2.9 3.2 4.3 2.0 3.7 2.4 2.7 2.9 3.2 3.1 3.2Consumer Prices* 2.3 2.3 3.6 2.2 2.7 1.7 2.1 2.5 2.6 2.4 2.5Current Account Balance (£ bn) -43.8 -37.7 -22.0 -18.4 -22.1 -18.4 -14.3 -9.1 -7.1 -4.2 -10.910 Year Treasury Bond Yield, %2 4.7 4.6 3.0 4.0 4.3 3 4.4 4 4.9 5.0 4.8 4.8 4.7
2006 2007 2008 2009 2010 2011 2012 2013 2014 2015 2016-20201
Gross Domestic Product* 2.4 2.3 0.3 -2.2 1.4 1.7 1.8 1.8 1.8 1.9 1.9Household Consumption* 2.6 2.4 0.9 0.8 1.0 1.4 1.9 2.0 1.9 1.9 1.9Business Investment* 4.7 8.6 2.4 -7.8 -1.4 2.8 3.6 3.4 3.5 3.4 3.3Manufacturing Production* 1.6 1.6 -3.0 -12.9 3.0 3.1 1.4 1.4 1.1 1.2 1.4Consumer Prices* 1.7 1.5 2.8 0.1 1.4 1.5 1.8 1.8 1.9 2.0 1.9Current Account Balance (Euro bn) -9.2 -18.9 -44.0 -40.6 -38.9 -37.5 -37.5 -36.5 -34.0 -32.0 na10 Year Treasury Bond Yield, %2 4.0 4.4 3.5 3.6 3.5 3 3.8 4 4.2 4.3 4.3 4.3 4.3
1Signifies average for period 2End period 3End July 2010 4End April 2011
Euro zoneHistorical
* % change over previous yearConsensus Forecasts
2006 2007 2008 2009 2010 2011 2012 2013 2014 2015 2016-20201
Gross Domestic Product* 3.1 2.7 0.5 -4.0 1.2 1.5 1.6 1.8 1.8 1.8 1.6Private Consumption* 2.1 1.6 0.4 -1.0 0.2 1.0 1.5 1.7 1.8 1.7 1.5Gross Fixed Investment* 5.6 4.7 -0.9 -10.8 -0.8 2.6 3.1 2.6 2.3 2.3 2.0
Industrial Production* 4.2 3.7 -1.8 -14.7 3.9 2.9 2.7 2.3 2.6 2.3 2.1Consumer Prices* 2.2 2.1 3.3 0.3 1.2 1.4 1.5 1.8 1.9 2.0 1.9Current Account Balance (Euro bn) -10.2 10.7 -143 -57.5 -6.7 12.7 -12.6 5.2 5.2 5.0 5.0
2006 2007 2008 2009 2010 2011 2012 2013 2014 2015 2016-20201
Gross Domestic Product* 2.9 2.5 0.4 -2.6 3.2 3.0 3.0 2.9 2.7 2.7 2.3Personal Expenditure* 4.1 4.6 3.0 0.2 2.9 2.8 3.1 2.9 2.5 2.4 2.2Machinery & Eqpt Investment* 10.5 4.4 0.5 -19.2 2.8 6.4 7.5 6.7 5.2 4.6 3.7Industrial Production* -0.3 0.1 -4.2 -10.0 5.3 5.2 4.9 4.3 3.6 3.1 2.5Consumer Prices* 2.0 2.1 2.4 0.3 1.9 2.2 2.1 2.1 2.0 2.0 2.0Current Account Balance (C$ bn) 20.3 15.6 8.1 -41.3 -29.7 -20.3 -14.8 -9.2 -4.7 0.7 6.510 Year Treasury Bond Yield, %2 4.1 4.0 2.9 3.6 3.8 3 4.1 4 4.6 5.0 5.2 5.1 5.1

29© Copyright Consensus Economics Inc. 2010
APRIL 2010 LONG-TERM FORECASTS
The NetherlandsConsensus Forecasts* % change over previous year
Historical
Sweden
Spain
NorwayConsensus Forecasts* % change over previous year
Historical
Consensus Forecasts* % change over previous yearHistorical
Consensus Forecasts* % change over previous yearHistorical
SwitzerlandConsensus Forecasts* % change over previous year
Historical2006 2007 2008 2009 2010 2011 2012 2013 2014 2015 2016-20201
Gross Domestic Product* 3.6 3.6 1.8 -1.5 1.8 1.9 1.9 2.2 2.0 2.0 1.8Private Consumption* 1.6 2.4 1.7 1.2 1.3 1.5 1.8 1.8 1.6 1.6 1.5Gross Fixed Investment* 4.7 5.2 0.4 -3.7 3.4 3.5 3.6 3.6 2.9 3.0 2.9Industrial Production* 7.8 9.5 1.3 -7.9 6.4 4.6 4.7 4.3 3.7 3.6 3.3Consumer Prices* 1.1 0.7 2.4 -0.5 1.0 1.1 1.7 1.5 1.4 1.5 1.6Current Account Balance (SwFr bn) 74.2 46.8 11.1 44.7 52.7 58.2 61.3 61.7 62.3 62.7 65.010 Year Treasury Bond Yield, %2 2.5 3.1 2.2 2.0 2.1 3 2.5 4 3.1 3.3 3.3 3.3 3.4
2006 2007 2008 2009 2010 2011 2012 2013 2014 2015 2016-20201
Gross Domestic Product* 4.5 2.7 -0.5 -4.7 2.2 2.8 3.0 2.6 2.4 2.3 2.5Household Consumption* 2.5 3.1 -0.4 -0.7 2.1 2.2 3.0 2.5 2.2 2.0 2.4Gross Fixed Investment* 9.6 7.8 2.1 -15.1 -2.0 4.5 6.3 5.3 4.7 2.7 4.9Mining & Manufacturing Production* 5.3 4.1 -3.5 -19.2 4.4 6.1 6.0 6.0 4.5 3.5 5.0Consumer Prices* 1.4 2.2 3.5 -0.3 1.3 2.2 2.3 2.1 2.0 1.9 2.0Current Account (Skr bn) 231 257 300 225 221 235 235 240 230 220 21010 Year Treasury Bond Yield, %2 3.8 4.4 2.4 3.4 3.5 3 4.0 4 4.4 4.7 4.5 4.4 4.6
2006 2007 2008 2009 2010 2011 2012 2013 2014 2015 2016-20201
Gross Domestic Product* 4.0 3.6 0.9 -3.6 -0.4 1.0 1.6 1.9 2.1 2.3 2.1Household Consumption* 3.8 3.6 -0.6 -5.0 -0.5 0.8 1.4 1.7 2.0 2.2 2.1Gross Fixed Investment* 7.2 4.6 -4.4 -15.3 -5.6 -0.1 2.5 3.5 3.9 4.1 4.0Industrial Production* 3.7 2.4 -7.1 -16.2 -0.6 1.6 2.7 3.0 2.9 2.6 2.0Consumer Prices* 3.5 2.8 4.1 -0.3 1.3 1.6 1.8 2.0 2.1 2.1 1.9Current Account Balance (Euro bn) -88.3 -105 -106 -57.2 -44.4 -41.2 -47.0 -49.1 -53.3 -48.6 -49.710 Year Treasury Bond Yield, %2 4.0 4.4 3.8 4.0 4.0 3 4.3 4 4.7 4.7 4.6 4.8 4.9
2006 2007 2008 2009 2010 2011 2012 2013 2014 2015 2016-20201
Gross Dom Prod (Mainland)* 4.5 5.4 2.0 -1.4 2.3 2.8 3.0 3.0 2.4 2.6 2.3Private Consumption* 4.8 5.3 1.1 0.1 4.1 3.3 3.4 3.0 2.7 2.7 2.7Gross Fixed Investment* 11.7 12.4 1.3 -7.9 -2.0 2.6 5.4 4.4 1.8 2.8 2.6Manufacturing Production* 5.5 5.8 2.9 -6.3 2.4 4.2 3.8 2.5 1.0 2.3 1.9Consumer Prices* 2.3 0.7 3.8 2.2 2.3 1.7 2.2 2.4 2.3 2.3 2.3Current Account Balance (Nkr bn) 372 321 473 333 368 387 416 475 470 450 42510 Year Treasury Bond Yield, %2 4.4 4.7 3.9 4.2 4.2 3 4.6 4 4.8 4.8 5.0 5.0 5.0
2006 2007 2008 2009 2010 2011 2012 2013 2014 2015 2016-20201
Gross Domestic Product* 3.4 3.6 2.0 -4.0 1.4 1.7 1.4 1.8 2.0 1.9 2.1Private Consumption* -0.3 1.7 1.3 -2.5 -0.1 1.1 1.1 1.2 1.6 1.4 1.8Gross Fixed Investment* 7.5 4.8 4.9 -13.0 -3.5 2.4 2.4 3.4 2.5 2.0 2.2Manufacturing Production* 2.9 3.3 -0.8 -8.9 3.7 2.0 0.3 4.0 1.8 -0.5 2.0Consumer Prices* 1.2 1.6 2.5 1.2 1.1 1.3 1.7 1.7 1.9 1.6 1.8Current Account Balance (Euro bn) 50.4 49.3 28.5 30.7 36.5 36.5 41.1 44.8 47.0 49.6 43.010 Year Treasury Bond Yield, %2 4.0 4.4 3.6 3.6 3.6 3 4.0 4 4.3 4.5 4.3 4.1 4.4
1Signifies average for period 2End period 3End July 2010 4End April 2011

30 © Copyright Consensus Economics Inc. 2010
APRIL 2010JANUARY 2010
❒ GDP - Gross Domestic Product IMF - International Monetary Fundna - not available Emu - European economic and monetary unionOECD - Organisation for Economic Co-operation and Development ECB - European Central Banky-o-y - year-on-year q-o-q - quarter-on-quarter m-o-m - month-on-month
❒ Measures of GDP, Consumption, Business Investment and Industrial Production are expressed in real (i.e.inflation-adjusted) terms. These variables, and certain others as indicated, are expressed as percentagechanges over the previous year.
❒ All individual country forecasters on pages 4-24 are listed in descending order of their 2010 real GDPestimates. Consensus forecasts are mean arithmetic averages of the listed individual estimates.
NOTES AND ABBREVIATIONS MARCH 2009NOTES AND ABBREVIATIONS APRIL 2010

31© Copyright Consensus Economics Inc. 2010
APRIL 2010
This page has been left intentionally blank

32 © Copyright Consensus Economics Inc. 2010
APRIL 2010
-3.0 1.3 1.7 -0.1 1.1 1.6 2.5 1.8 4.1-2.6 3.2 3.0 0.3 1.9 2.2 -36.1 -29.0 -19.5-2.2 1.4 1.7 0.1 1.4 1.5 -57.0 -52.5 -49.8-5.0 1.6 1.7 0.4 0.9 1.3 168 188 201-5.1 0.8 1.1 0.8 1.5 1.8 -67.4 -57.4 -50.7-5.2 2.2 1.6 -1.4 -1.1 -0.2 142 177 179-4.0 1.4 1.7 1.2 1.1 1.3 43.1 49.3 48.5-1.4 2.3 2.8 2.2 2.3 1.7 53.3 62.5 65.9-3.6 -0.4 1.0 -0.3 1.3 1.6 -80.3 -60.0 -54.7-4.7 2.2 2.8 -0.3 1.3 2.2 29.5 30.9 33.4-1.5 1.8 1.9 -0.5 1.0 1.1 41.2 49.3 53.2-4.9 1.3 2.3 2.2 2.7 1.7 -28.8 -33.8 -28.3-2.4 3.2 3.1 -0.3 2.1 1.9 -420 -498 -545
-2.4 3.2 3.1 -0.2 2.0 1.9 -456 -527 -564-4.2 1.1 1.7 0.6 1.5 1.6 61.7 153 207-4.1 1.1 1.7 0.8 1.5 1.6 -57.9 5.0 41.5-4.0 1.2 1.5 0.3 1.2 1.4 -80.7 -9.1 16.9
1.5 5.7 5.2 0.8 2.1 2.4 555 527 518-5.7 3.3 4.0 6.6 6.0 5.5 0.6 14.5 -0.1-2.3 4.0 3.7 5.5 7.5 6.8 -20.6 -46.9 -73.01.2 4.0 4.7 7.2 6.6 6.5 23.0 60.3 68.5
-2.1 3.2 3.3 1.4 2.7 2.7
Real GDP
% increase
2009 2010 2011
Consumer Prices
% increase
2009 2010 2011
Current Account
Balance, US$bn
2009 2010 2011
AprilSurvey
CONSENSUS FORECASTS: WORLD ECONOMIC ACTIVITY
BelgiumCanadaFranceGermanyItalyJapanNetherlandsNorwaySpainSwedenSwitzerlandUnited KingdomUnited States
North America1
Western Europe2
European Union2
Euro zone2
Asia Pacific3
Eastern Europe4
Latin America5
Other Countries6
Total
© Copyright Consensus Economics Inc. 2010
Regional totals, as well as the grand total for GDP growth and inflation, are weighted averages calculated using 2008 GDPweights, converted at average 2008 exchange rates. Current account forecasts given in national currencies on pages 7-24 have been converted using consensus exchange rate forecasts for the purposes of comparison. 1USA and Canada. 2 TheEuro zone aggregate is taken from our panel’s latest forecasts (pages 18-19). The Euro zone current account data andforecasts are based on extra-euro zone data, i.e., they are compiled from an aggregate of the Euro zone member states’transactions only with nonresidents of the Euro zone. The European Union data includes the Euro zone countries listed onpage 18 plus Denmark, Sweden and the United Kingdom, as well as May 2004 entrants the Czech Republic, Estonia, Hungary,Latvia, Lithuania and Poland, plus Romania and Bulgaria who entered in January 2007 (data taken from Eastern EuropeConsensus Forecasts). Western Europe comprises the Euro zone plus Denmark, Sweden and the United Kingdom, alongwith Norway and Switzerland. 3 Survey results for Japan plus fifteen other countries taken from Asia Pacific ConsensusForecasts. 4 Twenty-seven countries, including eleven European Union countries taken from the latest issue of EasternEurope Consensus Forecasts. 5Eighteen countries taken from the latest issue of Latin American Consensus Forecasts(Inflation figures are on a December/December basis). 6 Egypt, Israel, Nigeria, Saudi Arabia and South Africa.
SUBSCRIPTION FORMPlease enter my subscription to Consensus Forecasts. My cheque for payment (US$595 or £370 or €540 for twelvemonthly issues, payable to Consensus Economics Inc.) is attached. My address is as shown below:
NAME
COMPANY
ADDRESS
COUNTRY POST/ZIP CODE
TELEPHONE FAX
SIGNATUREReturn this form to: Consensus Economics Inc.
53 Upper Brook StreetLondon W1K 2LTUnited KingdomTel: (44 20) 7491 3211 Fax: (44 20) 7409 2331
See www.consensuseconomics.com for adescription of our other products and services.
04/10 CF