Conoscopic figure: a complex consequence of a not so...
23
This content has been downloaded from IOPscience. Please scroll down to see the full text. Download details: IP Address: 141.255.204.59 This content was downloaded on 11/12/2014 at 09:41 Please note that terms and conditions apply. Conoscopic figure: a complex consequence of a not so simple phenomenon View the table of contents for this issue, or go to the journal homepage for more 2015 Eur. J. Phys. 36 015014 (http://iopscience.iop.org/0143-0807/36/1/015014) Home Search Collections Journals About Contact us My IOPscience
Transcript of Conoscopic figure: a complex consequence of a not so...

This content has been downloaded from IOPscience. Please scroll down to see the full text.
Download details:
IP Address: 141.255.204.59
This content was downloaded on 11/12/2014 at 09:41
Please note that terms and conditions apply.
Conoscopic figure: a complex consequence of a not so simple phenomenon
View the table of contents for this issue, or go to the journal homepage for more
2015 Eur. J. Phys. 36 015014
(http://iopscience.iop.org/0143-0807/36/1/015014)
Home Search Collections Journals About Contact us My IOPscience

Conoscopic figure: a complex consequenceof a not so simple phenomenon
Maja Pečar1 and Mojca Čepič1,2
1 Faculty of Education, University of Ljubljana, Slovenia2 Jožef Stefan Institut, Ljubljana, Slovenia
E-mail: [email protected]
Received 6 May 2014, revised 22 July 2014Accepted for publication 1 August 2014Published 24 November 2014
AbstractObservation of conoscopic figures through a special microscope is widely usedas an experimental method for determination of optical properties of aniso-tropic materials. The conoscopic figure appears when a divergent light passesthrough an anisotropic material sandwiched between crossed polarizers. Thecomplex pattern of bright and dark areas appears due to different polarizationstates of light. The pattern gives information about optical axes and birefrin-gence of the material and allows for deduction of microscopic structures at theorigin of such properties. Due to the complexity of the figure, the method isoften used following recipes. This contribution presents a series of experi-ments that provide students with experiences needed for construction andcomprehension of optical phenomena that contribute to the complexity of theconoscopic figure.
Keywords: conoscopy, polarization states, education, simple experiments
1. Introduction
A semi-transparent tracing paper, one polarizer, a few layers of transparent adhesive tape or atransparency and another polarizer crossed (two polarizers called polarizer and analyser withtheir transmission directions set perpendicularly) with the first one are placed one onto another.If one shines a laser onto such a simple hands-on set-up from the side where the tracing paper isplaced, a conoscopic figure appears on the screen as seen in figure 1. The resulting complexfigure is one of the traditional methods for determination of optical properties for anisotropicmaterials. In addition, the artistic beauty of the figure is interesting on its own.
Before continuing, let us briefly state the reasons for such complexity. The light in atransparent anisotropic material in general splits into two beams with different phase velo-cities, different refractive indices and mutually perpendicular polarizations. In the experimentdescribed above the light is divergent due to the irregularity of the tracing paper. The incident
European Journal of Physics
Eur. J. Phys. 36 (2015) 015014 (22pp) doi:10.1088/0143-0807/36/1/015014
0143-0807/15/015014+22$33.00 © 2015 IOP Publishing Ltd Printed in the UK 1

light becomes polarized by the first polarizer and enters the sandwiched anisotropic material.The polarization state changes during the transmission and in general becomes ellipticallypolarized. The polarization state depends on the polarization of the incident light, its wave-length and its direction of incidence. The dielectric tensor of the material determines thepolarization state of the transmitted light. The second polarizer partially absorbs the light, asthe intensity of transmitted light through the last polarizer depends on the polarization stateafter transmission through the anisotropic material. The reason for the complexity of theconoscopic figure is due to the variation of polarization state in dependence of direction of theincident light.
For students to deduce anisotropic material properties from the conoscopic figure, athorough understanding of its formation is highly beneficial. This knowledge is of specialvalue in situations when ‘cookbook recipes’ do not give an unambiguous answer, for examplewhen only a small part of a conoscopic figure can be observed.
Not many aspects of teaching and learning conoscopy as an experimental method fordetermination of anisotropic properties of matter have been discussed yet. Several experi-ments were suggested as demonstrations related to the polarization of light, mostly for lin-early polarized light. Only a few of them suggest demonstrations or models of explanationsfor phenomena related to elliptical polarization and its construction from two orthogonalphase shifted linearly polarized light beams [1–3]. More studies were found related to thedetermination and presentation of different states of elliptical polarization [4–6].
Conoscopic figures were discussed in [7–14]. The authors considered simple hands-onexperiments that allowed for an observation of conoscopic figures of transparencies [7–9] andsimple arrangements for observing conoscopic figures of crystals [10–14]. More details weregiven for a theoretical analysis of conoscopic figures [9, 13, 15] and propagation of elec-tromagnetic waves through other anisotropic media [16, 17]. All references consideringconoscopic pictures were focused on understanding its meaning. Other papers were focusedon specific properties of simple anisotropic material and their measurements [18–21]; how-ever they were not related to conoscopic figure formation. The main goal of this paperhowever is to present a set of experiments, which combined in a proper sequence provideexperience with optics of anisotropic materials to students and help them understand andcomprehend the formation of the conoscopic figure.
Figure 1. (a) Schematic representation of illuminating a piece of tracing paper and atransparency between crossed polarizers by a laser beam and (b) the photograph of theexperiment which results in a complex figure on the screen.
Eur. J. Phys. 36 (2015) 015014 M Pečar and M Čepič
2

The paper is organized as follows: in section 2 we briefly resume the optics of anisotropicmaterials and description and presentation of polarization states. We derive expressions thatlink properties of the polarized incident light, the anisotropic material and the intensity of thetransmitted light through the second polarizer. We also describe the conoscopic figure andintroduce the nomenclature that is used in the continuation. In section 3 we present thesequence of experiments that explains separately several phenomena merging in the cono-scopic figure. We apply the results to discussion of additional experiments allowing for adeeper insight into the method and the data the conoscopy can provide. Section 4 concludesthe report and discusses few suggestions that could be used for laboratory work. As the paperdiscusses several different phenomena, experiments are distinguished by the main goal of theexperiment given in italics and with a bold experimental number.
2. Theoretical background
In this section we shortly review fundamentals of phenomena essential for understanding theconoscopic figure. The section does not report any new physics but should help the readerwith a general physics background to remember or to become acquainted with the nomen-clature used later.
2.1. Properties of anisotropic materials
Electrical properties of anisotropic materials are described by a dimensionless symmetricdielectric tensor ε that connects an electric displacement vector D⃗ and the electric field ⃗E .
⎛
⎝⎜⎜
⎞
⎠⎟⎟ε
ε ε εε ε εε ε ε
ε= ⃗ = ⃗D E, . (1)xx xy xz
yx yy yz
zx zy zz
Three mutually perpendicular directions exist for which a direction of an electric dis-placement vector is parallel to the applied electric field. These three directions correspond tothe eigenvectors of the three eigenvalues (ε ε ε, ,1 2 3) of the dielectric tensor, and are called alsoprincipal axes. If the axes of the coordinate system in which an analysis is consideredcoincide with eigenvectors, one says that the phenomenon is studied in the eigensystem andthe dielectric tensor adopts a very simple form.
⎛
⎝⎜⎜⎜
⎞
⎠⎟⎟⎟
⎛
⎝
⎜⎜⎜
⎞
⎠
⎟⎟⎟εε
εε
= =n
n
n
0 00 00 0
0 0
0 0
0 0
. (2)1
2
3
12
22
32
Here n1, n2 and n3 are the corresponding refractive indices. The solution of waveequations for propagation of light through an anisotropic material shows that in any directionlight propagates with two different beams having two different phase velocities and mutuallyperpendicular polarizations. In general, the two velocities, the phase (wave-normal) velocityand the ray (energy) velocity are different in magnitude and directions [22]. As our discussionis limited to the phase velocity that defines changes of phase during the propagation and therefraction of light in an anisotropic material, we do not discuss these subtleties in furtherdetails. The phase velocity we simply call the speed of light.
In this paragraph we will illustrate the phenomenon in a specific geometry. Let theprincipal axes correspond to x0, y0 and z0 axes of the coordinate system in which we considerthis example. The dielectric tensor has the same form as in equation (2). The light propagates
Eur. J. Phys. 36 (2015) 015014 M Pečar and M Čepič
3

along the z0 axis. The polarizations of the two beams are parallel to the other two principalaxes, x0 and y0 and their phase velocities are c n0 1 and c n0 2, respectively. For any otherdirection the situation is the same. The light propagates in two parallel beams with two phasevelocities and two mutually perpendicular polarizations. The only difference is that bothphase velocities and corresponding polarizations are not so straightforward as in the presentedexample. They have to be calculated taking the geometry of the problem into consideration.Finally, the ratio between the speed of light in the vacuum and the speed of light in atransparent anisotropic material for a specific direction and a corresponding polarizationdefines the index of refraction for the light beam. Therefore the incidence light from anisotropic medium splits into two perpendicularly polarized beams that propagate with dif-ferent speeds and in different directions.
In every transparent anisotropic material directions exist in which the light propagates asin an optically isotropic material, that is, the speed does not depend on the polarization of thebeam. These directions are called optical axes. In materials where two of eigenvalues for ε areequal, only one such direction exists and such materials are called uniaxial. If all three valuesof ε differ, two such directions of light propagation exist and the material is called biaxial.
Another point with respect to nomenclature is worth mentioning. The numerical differ-ence between the minimum and the maximum values of the refractive indices is called thebirefringence of the material. Sometimes researchers are not very strict when they use theterm birefringence. The expression ‘birefringence’ is often used for the difference of the tworefractive indices for the two polarizations in the considered direction of light propagation. Ifthe term birefringence is used in such a way, it is direction dependent. In this paper we use theexpression birefringence in its original meaning as the difference between the largest and thesmallest refractive index of the material [22, 23].
2.2. Polarization states
Students get acquainted with polarization as an essential property of electromagnetic andother transversal waves. Equations are always written for waves with well determineddirections of oscillating electric field in time. The fact that light is usually not polarized ismentioned when polarization is introduced. Textbooks and lecturers mostly consider othertypes of polarization, such as the circular and the elliptical for very specific geometries. Atypical example would be where the linear polarizer is placed under 45° with respect tovibration directions and a derivation of the polarization state for the transmitted light leads tospecific examples of λ-quarter and λ-half plates. A smart student can easily apply theapproach to more general examples but without being forced to practice not so straightfor-ward examples, both theoretically and experimentally, students usually forget that thepolarization direction of the incident light also significantly affects the polarization state oftransmitted light. The conoscopic figure is a result of such a variation. As light has differentincident directions with respect to the principal axes of the material, a large variety ofsituations combines in the final figure. As polarization state of the transmitted light is veryimportant for understanding of a conoscopic figure, we review in this subsection the theo-retical and graphical presentation of polarization states. The analysis is made for perpendi-cularly incident light although the conclusions are valid for a superposition of any two phaseshifted mutually perpendicularly polarized beams and therefore for the propagation of light inany direction.
The most obvious description of the polarization state is if the coordinate system, inwhich the analysis is done, corresponds to two polarization directions called also directions ofvibration or vibration directions, say x and y, that determine the two phase velocities and the
Eur. J. Phys. 36 (2015) 015014 M Pečar and M Čepič
4

corresponding wave vectors along the zth axis. This coordinate system does not necessarycorrespond to the principal axes of the material and depends on the direction of propagationof light in an anisotropic material.
After propagating through the anisotropic material, the two electromagnetic waves havethe same wavelength but they in general differ in phase and in the amplitude:
φ ω δ φ ω δ⃗ ⃗ = − − − −{ }( )( )( )E r t E t kz E t kz, cos cos , sin cos . (3)x y0 0
Here φ is the angle between a direction of polarization of the incident beam and the x axis asseen in figure 2(b). The electromagnetic wave of angular frequency ω propagates in thevacuum with a wave vector k. As the two polarizations in the material have different phasevelocities and thus the material has different optical lengths for the two polarizations, the twopolarizations acquire different phase shifts when leaving the material, δx and δy, respectively.The presentation of the electric field is further simplified by renormalization of time that setsthe whole phase of the component Ex at the coordinate z, where the light passes the interfacefrom anisotropic material to air to zero:
φ ω φ ω δ⃗ ⃗ = − − −( )E r t E t kz E t kz, { cos cos ( ), sin cos ( )}. (4)0 0
In equation (4), δ δ δ= −y x is called the phase difference.The polarization state of light is usually visualized by a curve in the shape of an ellipse
called also a characteristic ellipse that is traced by a tip of the electric field vector during oneperiod at a constant position z. Figure 3 shows polarization states for various orientations ofthe incident polarizations φ and for various phases δ.
Let us discuss polarization states presented in figure 3. One can easily see that for generalangles φ and for general phase differences δ the characteristic curves drawn by the end of theelectric field vector is an ellipse. The light is then called elliptically polarized light. Forspecific cases the ellipse degenerates to a line (if φ = 0 or π 2 or δ π= k where
= ± ±k 0, 1, 2 ,...), which means that electric field oscillates in one plane and the light iscalled linearly polarized. Finally, for a very specific case, when amplitudes of oscillations inboth perpendicular directions are the same (φ π= 4) and the phase difference is exactly
Figure 2. (a) Schematic representation of an experiment for studying effects ofanisotropic material (light grey) on polarized light. Double sided arrows marktransmission directions of polarizer (P) and analyser (A). The light in the anisotropicmaterial splits into two beams polarized along x and y directions. Characteristic ellipseE illustrates the polarization state of light after passing the polarizer and the anisotropicmaterial. (b) Polarization state of transmitted light and a geometry corresponding to thesituation on the left.
Eur. J. Phys. 36 (2015) 015014 M Pečar and M Čepič
5

δ π= ± 2, the ellipse has equal diameters, i.e., it is a circle and the light is called thecircularly polarized light.
In a typical experimental setup in students’ laboratories the polarizer is set at 45° withrespect to one of the vibration directions of the anisotropic material and students may get afalse impression. By increasing the thickness of the anisotropic material, the phase differenceδ increases. The elliptical polarization changes through circular polarization (the λ-quarterplate) to linearly polarized light that is rotated for 90° (the λ-half plate) with respect to theincident polarization. The long axis of the characteristic ellipse changes to the short axis,however its direction remains parallel to the direction of the incident polarization. This is aparticular case. For any other direction of incident polarization the length of the long axis ofthe characteristic ellipse changes but it also rotates upon increasing the phase difference δ.
The initially polarized light that has propagated through an anisotropic medium generallychanges its state of the polarization and becomes elliptically polarized. The polarization stateis described by two parameters (figure 3): the angle φ that gives the orientation of thepolarizer with respect to the vibration directions and the phase difference δ that occurs due todifferent optical lengths of the two beams with different phase velocities:
δ δ δ πλ
πλ
πλ
= − =′
−″
= ′ − ″( ) ( )
d
n
d
nn n
d2 2 2 ( ) . (5)y x
0 0 0
Here λ0 is the wavelength of light in vacuum, d is the material thickness (for perpendicularincident light), and ′ ″n n, are refractive indices for two specific polarizations of the two beamsin which the light splits.
Although the analysis above was made for a special geometry it is valid generally. Let usrepeat, for any direction of light propagation in the anisotropic medium, two mutually
Figure 3. Different polarization states. Angle φ is associated to the magnitudes ofelectric field along x and y directions. The ∓ sign in the phase difference δ distinguishesbetween the left and the right handedness of the elliptically or circularly polarized light.
Eur. J. Phys. 36 (2015) 015014 M Pečar and M Čepič
6

perpendicular directions that coincide to polarizations of the two beams can be associated to xand y axes. For these two directions two in general different phase velocities are associatedand define two different refractive indices, say ′ ″n n, [22].
A very nice and instructive visualization of the polarization state changes during thepropagation of light through an anisotropic material is the animation called EMANIMavailable at [24].
To summarize, any linearly polarized light that passes an anisotropic material generallychanges its state of polarization. The state of polarization after transmission depends on theinitial polarization and the wavelength of the incident light; on the properties of the aniso-tropic sample, through which the light propagates, and its thickness; finally it depends on thedirection of light propagation in the material and with it associated two refractive indices.
2.3. Determination of polarization states
There are several means to analyse the state of polarization. One may use linear polarizers,circular polarizers, retardation plates and their combinations. Conoscopic figure is composedfrom light beams with different directions transmitted through an anisotropic materialbetween the crossed polarizers. The second polarizer, called the analyser, is also used todetect the polarization state of a single light beam passing through the material. Thereforesuch analyser can be helpful for better understanding of the transmitted intensity of light atdifferent places in conoscopic figure.
The polarization state is detected by rotation of the analyser accompanied by the mea-surement of the intensity of transmitted light as shown in figure 4. Here it is not necessary thatthe incident light is perpendicular to the anisotropic material as long as the material israther thin.
The measurements of intensity of transmitted light with respect to the orientation of theanalyser are presented in two different ways. Figure 5(a) presents a dependence of theintensity of the transmitted light on the direction of the analyserʼs transmitting direction givenby the angle χ. Both maxima and minima give the orientation of the major and minorsemiaxes of the characteristic ellipse describing the state of polarization. The same is true fora presentation given in figure 5(b), but the graph is polar and the properties of the ellipse are
Figure 4. (a) Schematic representation of the experimental set-up for the measurementof the intensity of the transmitted light while rotating the analyser. (b) Intensity of lightis proportional to the projection of the characteristic ellipses on the transmissiondirection of the analyser as marked by dashed lines and brighter line on the analyser.
Eur. J. Phys. 36 (2015) 015014 M Pečar and M Čepič
7

even easier to recognize as marked in the figure with a red inner curve. The graphicalpresentation of the electric field amplitude corresponds to the characteristic ellipse, while thepresentation of the intensity of the transmitted light is proportional to its square.
The study of the polarization state of light presented above allows for determination ofoptical properties of anisotropic material. Let us study the intensity of light in a coordinatesystem as shown in figure 2(b). The intensity of light φ χI t( , , ) after passing the analyser isobtained from the superposition of two (monochromatic) waves with phase difference δ aftertransmission through the anisotropic material and it is proportional to φ χE t( , , )2 . The timeaverage of the electric field and therefore the intensity is given with the equation
φ χ φ φ χ φ φ χφ φ φ χ φ χ δ
= − + −+ − −
I E E
E
( , ) cos cos ( ) sin sin ( )
2 sin cos sin ( ) cos ( ) cos (6)
2 2 2 2 2 2
2
or simplified
δ= + +I I I I I2 cos ,x y x y
where the amplitude E is proportional to the amplitude of the E0 presented in the equations (3)and (4). Here φ φ χ= −I E cos cos ( )x
2 2 2 and φ φ χ= −I E sin sin ( )y2 2 2 are the intensities
of the two perpendicularly polarized waves after passing the analyser. Using the identityδ δ= −cos 1 2 sin ( 2)2 , we get
⎜ ⎟⎛⎝
⎞⎠χ φ φ χ δ= − −I E cos sin 2 sin 2( ) sin
2. (7)2 2 2
The conoscopic figure studies the transition of light through crossed polarizers, thereforethe sample is studied for one very specific situation, where χ π= 2. The equation (7) for this
Figure 5. Two different graphical presentations of an elliptical state with the phasedifference δ = °90 and the orientation of the vibration direction due to the incidencelinear polarization φ = °120 measured as transmitted intensity (in percents) whilerotating the analyser (χ). (a) Dependence of the intensity in the transmitted signal(vertical axis) on the orientation of the analyser (horizontal axis). (b) The samedependence given as a polar graph, where the blue curve is the transmitted intensity independence of the orientation of the analyser χ, the red curve is the average electricfield or better the characteristic ellipse of the polarization state, which is not directlyproportional to the the intensity, because the intensity of the transmitted light isdetermined by the average of the square of electric field.
Eur. J. Phys. 36 (2015) 015014 M Pečar and M Čepič
8

condition is much simpler and is reduced to
φ δ=⊥I E sin 2 sin2
. (8)2 2 2
The latter case allows for determination of vibration directions in an anisotropic material.If one of the polarizers, either analyser or polarizer is parallel to one of the vibration direc-tions, the light is completely absorbed. The two directions are straightforwardly found if thematerial is anisotropic only. If a material is optically active as well, the two directions are notso straightforward. In general, when studying a sample, vibration directions are not known,therefore also details about the polarization state do not satisfy to estimate the phase differ-ence δ and the difference in refractive indices. As the analysis above always starts from anelectric field with components along the two known principal axes students often get a falseimpression that by knowing the shape, i.e. both semiaxes of the ellipse and the orientation ofthe ellipse, all information can be extracted. The fact that the same shape of the ellipses can beobtained for different phase differences is often overlooked [22].
2.4. The conoscopic figure
In previous subsections we used simplified examples where the incident light was alwaysperpendicular to the sample surface. Such observations are called orthoscopic.
The conoscopic figure is a different type of observation. The incident light is obliquewith different incident angles and different planes of refraction. The observation is rather localas a smaller area of the sample is studied, but the complex picture (figure 1) gives informationabout light that is transmitted in a large variety of directions through the small but specificarea of the sample. Therefore a direction dependence of optical properties is measured by asingle measurement.
The professional conoscopy controls the direction of the incident light by focusing thelight beam onto the surface of the sample. The oblique light refracts into two beams thatseparate in space after transmission. After leaving the material both beams are again paralleland they superpose (figure 6). An additional lens allows for a formation of a (sharp) cono-scopic picture on the screen [25, 26].
Another method, less accurate but still appropriate for use in the laboratory or fordemonstrations for educational purposes, is the following: instead of focusing the light on thesample, the laser beam passes a piece of normal tracing paper that is placed right before thepolarizer and the sample (the configuration of the set-up in the figure 1(a)). In this way thelight transmitted through the tracing paper has all directions (the incident light on the sampleis represented in figure 6). The difference with the former method is that light is incident on awider area of the sample and the setup is not so spatially accurate. In addition, the mutuallyperpendicularly polarized waves that are superposed actually correspond to different areas ofthe sample. Still, if the sample is thin (the thickness of the sample is marked with h infigure 6), the spatial difference is not very large and the accuracy of the setup is more thansatisfactory for educational purposes.
Let us introduce some vocabulary that will be needed.The pattern that appears on the screen is formed from curves of equal intensity of the
monochromatic light. Those curves are called isochromes. The name becomes evident if aconoscopic figure is obtained by a white light, because they are curves of equal colour.
Another series of lines is important for understanding of the conoscopic figure. Theisogyres connect positions in the conoscopic figure that have constant angle between the
Eur. J. Phys. 36 (2015) 015014 M Pečar and M Čepič
9

polarization direction of the polarizer and one of the two vibration directions in the material(angle φ in figure 2(b)).
As mentioned before, there are two (or one only) directions in the crystal in which bothpolarizations have the same speed and the phase difference does not occur, called opticalaxes. As the polarizer and the analyser are crossed, in those directions there is no phasedifference and the black spots appear surrounded by circles of monochromes. These spots arecalled melatops. Uniaxial materials have one melatope only and biaxial materials have two.
After this introduction of the optics of anisotropic materials, introduction of typicalexpressions that are used in this field and a description of the conoscopic figure, we areprepared to dissect the conoscopic figure into its components by a set of experiments. Our aimis to provide students with experimental experiences on the influences mentioned above andhelp them to construct understanding of the complex conoscopic picture by applying theexperience to the new more complex situation, where various phenomena are mergedresulting in one complex and beautiful figure [25, 26].
3. Getting experiences through experiments
The first students’ encounter with a conoscopic figure (figure 1) is usually accompanied by awow effect due to its beauty and complexity but also because of simplicity of the experiment.However, for understanding the reasons for the complexity of the figure, more effort isrequired. To fully comprehend the conoscopic figure and how the anisotropic properties of thematerial are extracted from them, one should understand the following:
(i) Why does the intensity of the transmitted light change from one position on the figure toanother?
Figure 6. Schematic representation of the superposition of the two perpendicularlylinearly polarized light beams in the sample while using a less accurate methodilluminating an area of the material through a diffuser (tracing paper or similar, notshown in the representation). The concept of the superposition of the twoperpendicularly polarized waves (red and blue schematic lines) is the same in bothcases (the professional and less professional one).
Eur. J. Phys. 36 (2015) 015014 M Pečar and M Čepič
10
(ii) What influence does the change of the polarization state have and how can it influencethe transmission of light?
(iii) Why does the polarization state change with the incident angle but also by changing theplane of refraction?
and in addition(iv) Which data about the material are needed and how can they be extracted from the
conoscopic figure?(v) What happens if instead of the monochromatic light, white light is used?
In the following sections we present a set of experiments, which allow students toconstruct concepts that later intertwine in the complex conoscopic figure, separately. With thehelp of experiences gained by experiments students should be able to give explanations toquestions (i)–(iii), while the last two questions can be used as project work using the newknowledge in novel circumstances.
3.1. Initial polarization and the outgoing elliptical state
The conoscopic figure is a visualization of angular dependence of the transmitted lightintensity. The intensity can vary due to two reasons straightforwardly seen in equation (8): theinitial polarization given by φ and the phase difference δ. As already mentioned, because thesetups are usually met with a polarization in 45° with respect to vibration directions, studentsget a strong impression that the polarization state is defined solely by the sample. With thefollowing experiment students become aware that with an anisotropic sample several if noteven any state of elliptical polarizations can be achieved. This experience is related toisogyres in a conoscopic figure and the recognition of directions where one of the polarizers isperpendicular to the vibration direction of a beam.
If the light is elliptically polarized, the intensity of transmitted light through an analyser isalways larger than zero and it depends on the orientation of the analyser. Two orientations ofanalyser where the intensity of a transmitted light have the maximum and the minimumindicate orientations of the major and minor semiaxes of the characteristic ellipse(figure 4(b)). With azimuthal changes (angle ψ in figure 8) of linearly polarized incident lightto the conoscope setup, the components of electric field along vibration directions change aswell. Therefore the elliptical state is influenced by the relative orientation of a polarizer withrespect to polarizations of waves. To make students aware that the effect of the polarizationdirection is important, we suggest the experiment 1: different elliptical states obtained by asingle material sample.
A single sheet of an anisotropic material is used. The sample serving the purpose the bestis a simple λ 4 (lambda-quarter) plate available for educational purposes. The laser pointerthat has the closest possible wavelength to the characteristic wavelength of the lambda-quarterplate is used. If a pointer with a characteristic wavelength is not available, the fundamentalmessage that a large variety of elliptical polarizations can be obtained by a single sample, canstill be shown. The experimental set-up is presented in figure 4(a). The λ 4 plate is placedbetween the two polarizers. Principal axes of the lambda-quarter plate are usually marked, butif one uses a plastic foil or a piece of a transparency instead, axes are found by rotating thesample between the crossed polarizers until the sandwich becomes completely dark(experiment demonstrated later in figures 8 and 9). The polarizer is oriented at various angleswith respect to the vibration directions. The analyser is rotated and the intensity of thetransmitted light is measured by a detector. Three examples of measurements are shown infigure 7. Although the sample is the same and therefore the phase difference is the same as it
Eur. J. Phys. 36 (2015) 015014 M Pečar and M Čepič
11

Figure 7. The intensity of transmitted light through an anisotropic material (quarter-wave plate for λ = 560 nm) in dependence on the orientation of analyser (χ) and theschematic representation of the polarization state as the characteristic curve (red curve).(a) The incident light is polarized at °45 with respect to the axes of the lambda quarterplate. The transmitted light is almost circularly polarized as the green laser withλ = 532 nm was used. (b) The polarization along one of the principal directions remainslinearly polarized and (c) a general polarization direction of the incident light results inelliptically polarized transmitted wave. In all figures the measurement for the crossedpolarizers that correspond to the conoscopy setup are marked by an orange dot.
Eur. J. Phys. 36 (2015) 015014 M Pečar and M Čepič
12

depends on material and its thickness for the orthogonal monochromatic light, states ofelliptical polarization are very different—from almost circular to linear—due to the orienta-tion of the incident polarization plane.
This set of experiments shows that the vibration direction influences the final polarizationstate significantly (columns in figure 3) even if the phase difference between the two waves isconstant. In the conoscopic figure only one situation (the crossed polarizers) marked infigure 7 with orange dots is present. If crossed polarizers coincide with vibration direction,only one wave is present and the light is not transmitted through the system (figure 7(b)). Inthe conoscopic figure this situation corresponds to two isogyres that are dark. The isogyre linecorresponds to different elliptical states for which the phase difference δ varies along theisogyre but the vibration direction with respect to the incident polarization in the wave, i.e. φis constant. Elliptical states for such a condition are presented in lines of figure 3.
In a conoscopic figure the intensity of illumination changes from one point to another.This is because the relative orientation of the incident polarization with respect to thevibration directions change upon the incident angle and its azimuth but also due to the phasedifference changes for each direction of the incident light. We shall focus on these influencesin experiments in the continuation.
3.2. Directions of vibration of the two waves
The orientations of the two mutually perpendicular vibration directions of the two waveschange with direction of propagation in general. In order to define the direction of lightpropagation let us first define a coordinate system to define the azimuthal incidence of light(angle ψ). For perpendicularly incident light (θ = 0) two orientations of a sample betweencrossed polarizers, perpendicular to each other, exist for which the light is not transmitted andthey will be represented as u and v (see figure 8).
In more detail, the set-up for the experiment consists of a laser beam, a light intensitydetector and an anisotropic material between two crossed polarizers. The laser beam is fixedin the normal direction with respect to polarizers and the sample. The sample is rotatedbetween crossed polarizers and the intensity of transmitted light is measured. Orientations ofpolarizer and analyser, where the intensity of the transmitted light is negligible are chosen as uand v axes, and the normal corresponds to the nth axis of the system that is used for theanalysis in the continuation. The experiment used for determination of the coordinate systemis similar to the one used in [18, 19]. The direction of the light propagation is now defined byan angle θ between the propagation direction and the normal to the sample that is the nth axis(figure 8(c)). The azimuth of the propagation direction ψ is an angle between the projection ofthe propagation direction and the u-axis. Figure 8(c) illustrates the meaning of the angles foran example of the oblique incident light.
For perpendicularly incident light the vibration direction of the two waves in the materialcorresponds to the x and y axes. For an oblique incidence on an anisotropic material thepropagation direction changes as well as vibration directions do not lie in xz or yz planes anymore. As most of the laboratory experiments with anisotropic materials are performed withperpendicularly incident light, this phenomenon remains often overlooked. Experiment 2, thedependence of vibration direction on direction of light propagation, provides straightforwardevidence for the rotation of vibration directions in an anisotropic material for an obliqueincidence of light.
Biaxial material like a piece of a transparency is taken. The experiment is set up on theoptical bench in order to allow for accurate rotations of the polarizer, the anisotropic sampleand the analyser, figure 9. The transparency (marked as T in figure 9 in the direction of its
Eur. J. Phys. 36 (2015) 015014 M Pečar and M Čepič
13

axis u) is positioned between the crossed polarizers (their transmission directions are markedby A and P in figure 9). The polarizer and the analyser are rotated in order to find theorientations where the transmission is negligible (x and y axes), which for perpendicularlyincident light correspond to the u and v axes (figure 9(a)). Next, the sample is slightly rotatedaround the vertical axis—the holder with a transparency is rotated (figure 9(b)). In the newset-up the light is not absorbed in general. The mutually perpendicular polarizer and the
Figure 8. (a) A schematic presentation of the experimental set-up for the determinationof the coordinate system. (b) The relative intensity of transmitted light of a green laserthrough a layer of transparent adhesive tape between two crossed polarizers independence of the rotation angle (ψ) of the adhesive tape and its trend line proportionedto ψsin 22 because in this case the angle ψ corresponds to φ and the mentioneddependence can be seen from the equation (7). A photodiode and a voltmeter were usedas the detector and a green laser as light emitter. (c) The schematic presentation of theorientation of the incidence light with the angles ψ and θ.
Figure 9. Photos (in the middle) and schematic representations (above) of theexperiment of searching the directions of the vibration directions, where a transparency(T, with its orientation u) in between a polarizer (P) and an analyser (A) is used.(a) Some light passes through the transparency (anisotropic material) between twocrossed polarizers (A and P). The vibration directions (schematic representation belowthe photos) are found with the rotation of the still crossed polarizer and analyser(schematic representation left) where no light passes through. (b) The transparency istilted so the light is entering it at the angle θ = °15 and ψ = °45 and the light is againpassing through. As in the (a) case the two vibration directions are found and aredifferently oriented as in (a).
Eur. J. Phys. 36 (2015) 015014 M Pečar and M Čepič
14
analyser are both rotated until the light is absorbed again. The vibration directions are markedin figure 9(b) below and are not the same as in figure 9(a).
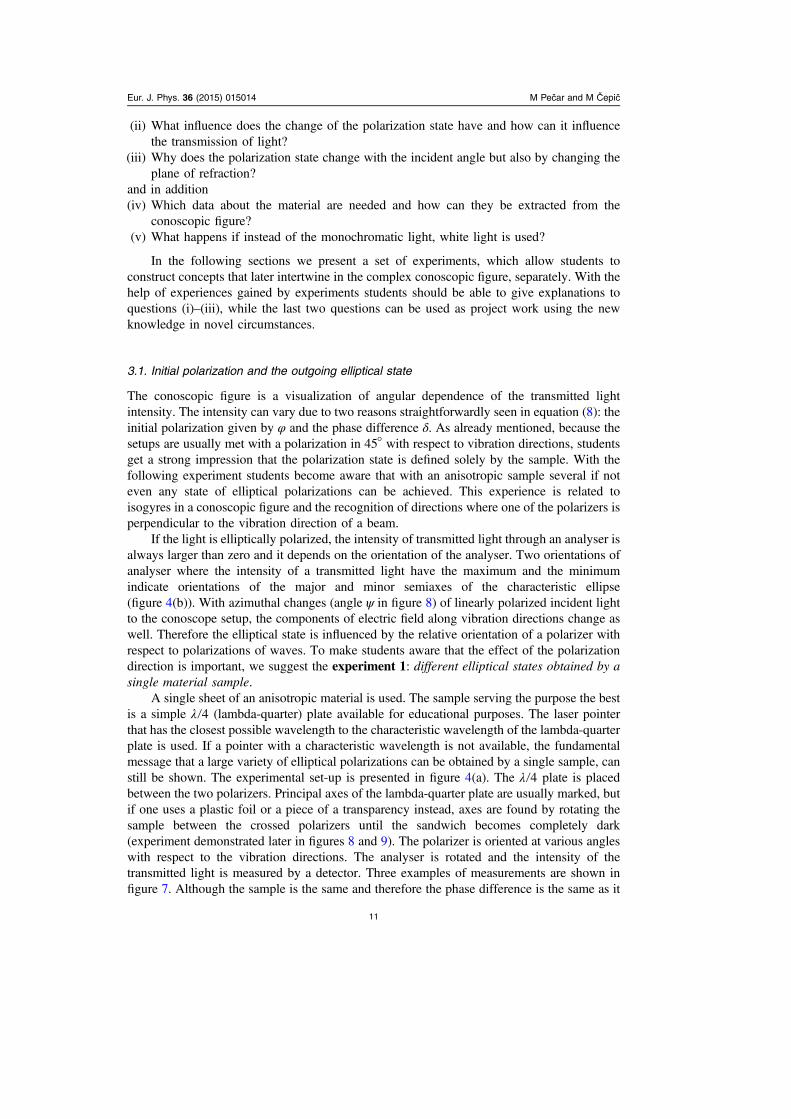
3.2.1. The angle of incidence. As shown by the previous experiment the obliqueness of theincident light drastically changes the properties of the propagating light in an anisotropicmaterial. It influences the vibration directions but also the phase velocity, the propagationdirection and the optical length. All that result as variations of polarization states andtherefore different transmitted light detected in different position on the conoscopic figure.Experiments 3 and 4 show the influences of the incident direction variation on θ and theazimuth ψ variation of the incident light on the intensity of the transmitted light.
Optical paths of both partial beams differ for two reasons, the wavelengths and thegeometrical lengths of both partial beams due to refraction. Strictly speaking the expressionfor a phase difference δ has a different form than in equation (5):
⎜ ⎟⎛⎝⎜⎜
⎞⎠⎟⎟ ⎛
⎝⎞⎠δ π
λ λπ
λπλ θ θ
= ′′
− ″″
= ′ ′ − ″ ″ = ′′
− ″″( ) ( )
d
n
d
nn d n d
h n n2
2( )
2
cos cos. (9)
0 0 0 0
Here λ0 is the vacuum wavelength, and ′ ′n d and ″ ″n d are optical lengths of partial beamshaving refractive i ′n and ″n , respectively. A detailed measurement of the polarization statecould be performed with a set-up presented in figure 9 following the procedure presented infigure 7. However, to make visually evident the correspondence between the conoscopicfigure and the experiment that studies the dependence separately, the laser is tilted instead ofthe sample (set-up shown in figure 8(c)). The incident angle is controlled by the tilt of thelaser with respect to the normal to the anisotropic sample between two crossed polarizers. Theintensity of the transmitted light varies with changes of the angle of incidence θ and theazimuth ψ (figure 10(b)).
Figure 10. (a) The trace of the laser beam transmitted through a transparency betweentwo crossed polarizers and seen on a screen taken with a long exposure photographicpicture and (b) three traces of the laser beam (red) transmitted through a transparencybetween two crossed polarizers and seen on a screen taken with a long exposurephotographic picture, while increasing three times the angle θ from zero to highervalues for three different angles ψ. The schematic white lines represent areas withconstant angles ψ, while blue curves represent areas with constant angles θ.
Eur. J. Phys. 36 (2015) 015014 M Pečar and M Čepič
15

3.3. The conoscopic figure
The conoscopic figure presents simultaneously the consequences of all the separate phe-nomena discussed above. Each position on the figure is associated with a different incidentangle and a different azimuth, and consequently, the polarization state of transmitted light ineach direction is different due to a different phase difference δ and due to a differentpolarization direction of incident light with respect to different vibration directions in thespecific direction φ.
For teaching purposes a simple conoscope (experiment 5) is assembled as follows.The model conoscope is made by illuminating the sample between two crossed polarizers
with a diffused light. The experiment is similar to that described in section 3.2.1, only thesample is illuminated from more angles at the same time. The diffusion of the laser beam canbe obtained with translucent (diffuse scattering) Scotch tape (figure 11(c)), a translucent partof some of the microscopic slides, some translucent plastics (from a CD case, figure 11(d)) orother diffusers (as in figure 11(e)). The diffuser should be as close to the sample as possiblesuch that the illuminated area is small and consequently the conoscopic figure is sharp. Thepolarizers, the sample and the diffuser are put together one on the top of the other. The screenon which the conoscopic figure is formed can be placed at different distances from the samplewith respect to the desired size of the figure.
The changes in thickness of the sample and the wavelength of the incident light alsoinfluence the polarization state. To avoid such influences one uses monochromatic light and asample with a uniform thickness. Our goal is to use simple and cheap transparent anisotropicmaterials, but also those should be chosen carefully, because not all transparent anisotropicmaterials give a proper conoscopic figure. Several minima and maxima of transmittedintensity of light for different angles θ (that give several isochromes in the conoscopic figures)are needed. Therefore the sample has to have the appropriate parameters h, λ and ″ − ′n n( )that define the phase difference and consequently the state of polarization and therefore thetransmitted intensity at different incident angles θ (figure 12). This is the reason that a thin
Figure 11. (a) Schematic representation of the experimental set-up, (b) the beam of thelaser without diffuser, the laser beam diffused with (c) Scotch tape, (d) translucent CDcase and (e) semi-transparent tracing paper and (f) the illumination of a spot on thetransparency between two crossed polarizers with a laser covered by Scotch tape andthe formation of a conoscopic figure taken with a long exposure photo.
Eur. J. Phys. 36 (2015) 015014 M Pečar and M Čepič
16
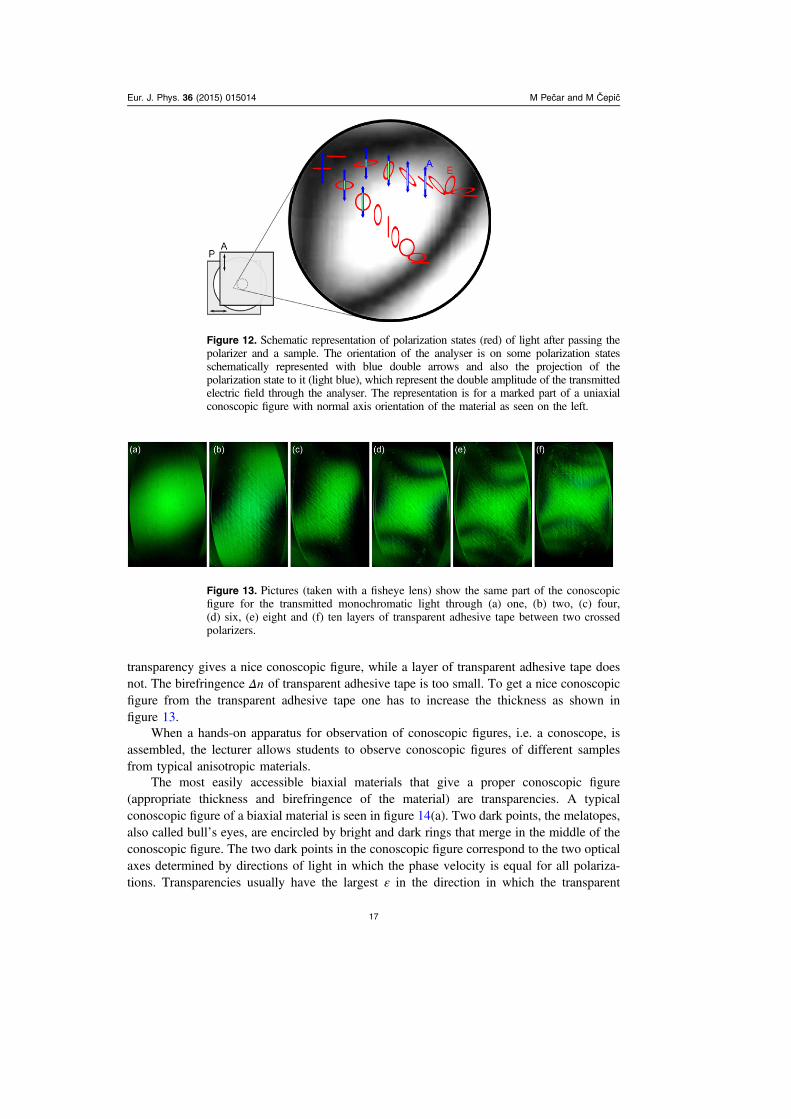
transparency gives a nice conoscopic figure, while a layer of transparent adhesive tape doesnot. The birefringence Δn of transparent adhesive tape is too small. To get a nice conoscopicfigure from the transparent adhesive tape one has to increase the thickness as shown infigure 13.
When a hands-on apparatus for observation of conoscopic figures, i.e. a conoscope, isassembled, the lecturer allows students to observe conoscopic figures of different samplesfrom typical anisotropic materials.
The most easily accessible biaxial materials that give a proper conoscopic figure(appropriate thickness and birefringence of the material) are transparencies. A typicalconoscopic figure of a biaxial material is seen in figure 14(a). Two dark points, the melatopes,also called bullʼs eyes, are encircled by bright and dark rings that merge in the middle of theconoscopic figure. The two dark points in the conoscopic figure correspond to the two opticalaxes determined by directions of light in which the phase velocity is equal for all polariza-tions. Transparencies usually have the largest ε in the direction in which the transparent
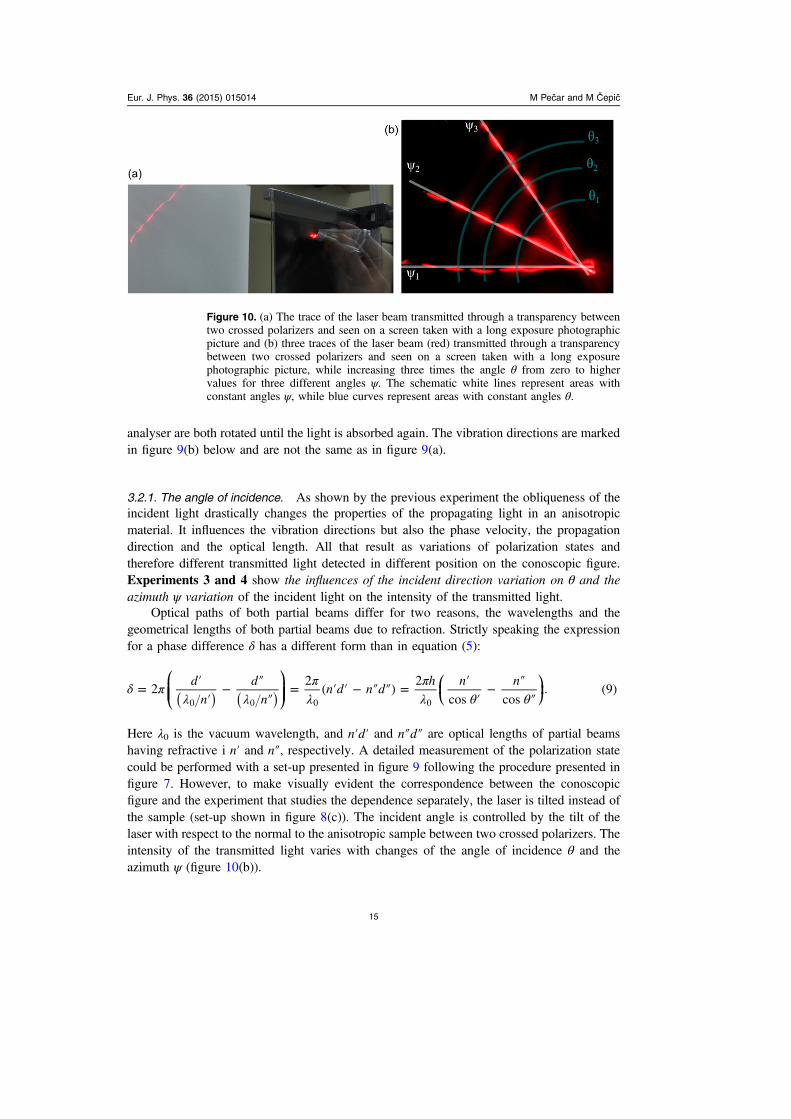
Figure 12. Schematic representation of polarization states (red) of light after passing thepolarizer and a sample. The orientation of the analyser is on some polarization statesschematically represented with blue double arrows and also the projection of thepolarization state to it (light blue), which represent the double amplitude of the transmittedelectric field through the analyser. The representation is for a marked part of a uniaxialconoscopic figure with normal axis orientation of the material as seen on the left.
Figure 13. Pictures (taken with a fisheye lens) show the same part of the conoscopicfigure for the transmitted monochromatic light through (a) one, (b) two, (c) four,(d) six, (e) eight and (f) ten layers of transparent adhesive tape between two crossedpolarizers.
Eur. J. Phys. 36 (2015) 015014 M Pečar and M Čepič
17

material was rolled and stretched during the production process. The smallest usually lies inthe direction perpendicular to the transparency. If so the two optical axes are in the planedefined by the largest and the smallest epsilon that is perpendicular to the transparency.
A typical conoscopic figure for a uniaxial material is seen in figure 14(b). Here a darkpoint in the middle corresponds to the single optical axis of the material that is perpendicularto the sample (a typical orientation). The figure is also nicely symmetric with respect to theoptical axis. Cheap and easily obtained uniaxial materials having the optical axis perpendi-cular to the thin sample are not very common, at least to our knowledge. Several crystals areuniaxial, but they should be cut in the specific orientation and to specific thickness to obtain aproper conoscopic figure. Transparent adhesive tapes are also uniaxial [18, 19], but with aplanar axial orientation. Materials that are rather easily manipulated are liquid crystals. In thenematic phase of a liquid crystal elongated molecules are parallel. Liquid crystals can besynthesized in a school laboratory [27] or obtained from providers (e.g. Merck [28]). Thesynthesis described by Pavlin et al takes about 90 min and must be performed in a fume hood.It consists of carefully heating the mixture of 4-butylaniline and p-anisaldehyde to a cloudyliquid, which should be rinsed several times to remove the impurities, as accurately describedin [27]. By submerging a microscope slide and cover slip (or two microscope slides) into asolution of simple dishwashing detergent, the surface treatment that provides perpendicularorientation of long molecular axes of the nematic liquid crystal is prepared. A drop of a liquidis put on a dry preliminarily treated microscope slide glass and covered with the cover slip,also treated previously. For accurate thickness of the sample two spacers are used between theglasses. The spacer can be simply adhesive tapes or thin wires strongly fixed to the micro-scope slide.
The third typical picture is similar for uniaxial and biaxial materials and to distinguishbetween them additional observation should be made. As in figure 14(c) melatopes are notseen and dark and bright areas form a symmetric picture. Such a situation is met when opticalaxes are perpendicular to the initial light beam. Materials that provide such a picture are theregular transparent tapes, because they have planar axial orientation due to the stretch in onedirection during manufacturing. Nematic liquid crystals provide samples in which thedirection of the optical axis can be manipulated. By rubbing clean object and cover glasseswith velvet the elongated molecules orient parallel to the glass surfaces along microscopicscratches and the optical axis is correspondingly determined by the rubbing direction [27].
Figure 14. Conoscopic figures of (a) a biaxial sample (transparency, thicknessh = 110 μm) (b) a uniaxial material with the axis normal to the sample plane(homeotropically aligned nematic liquid crystal 5CB of thickness h = 200 μm), (c) auniaxial material with the axis parallel to the sample plane (several layers of adhesivetape with a total thickness of h = 1.2 mm) and (d) a biaxial sample (transparency) withrandom orientation. For all figures the orientation of the polarizer and the analyser isthe same (left: schematic representation of P and A).
Eur. J. Phys. 36 (2015) 015014 M Pečar and M Čepič
18
A similar conoscopic figure is gained from biaxial materials with axial plane parallel to thesurface, but such samples are not so easy to find.
Researchers often observe conoscopic figures of samples having optical axes in generaldirection, when determining optical properties of anisotropic materials. Experiences of suchconoscopic figures are provided by tilting the samples with respect to the laser beam(figure 14(d)).
For a better understanding of conoscopic figure formation or for verification thatunderstanding is correct, we propose some additional experiments.
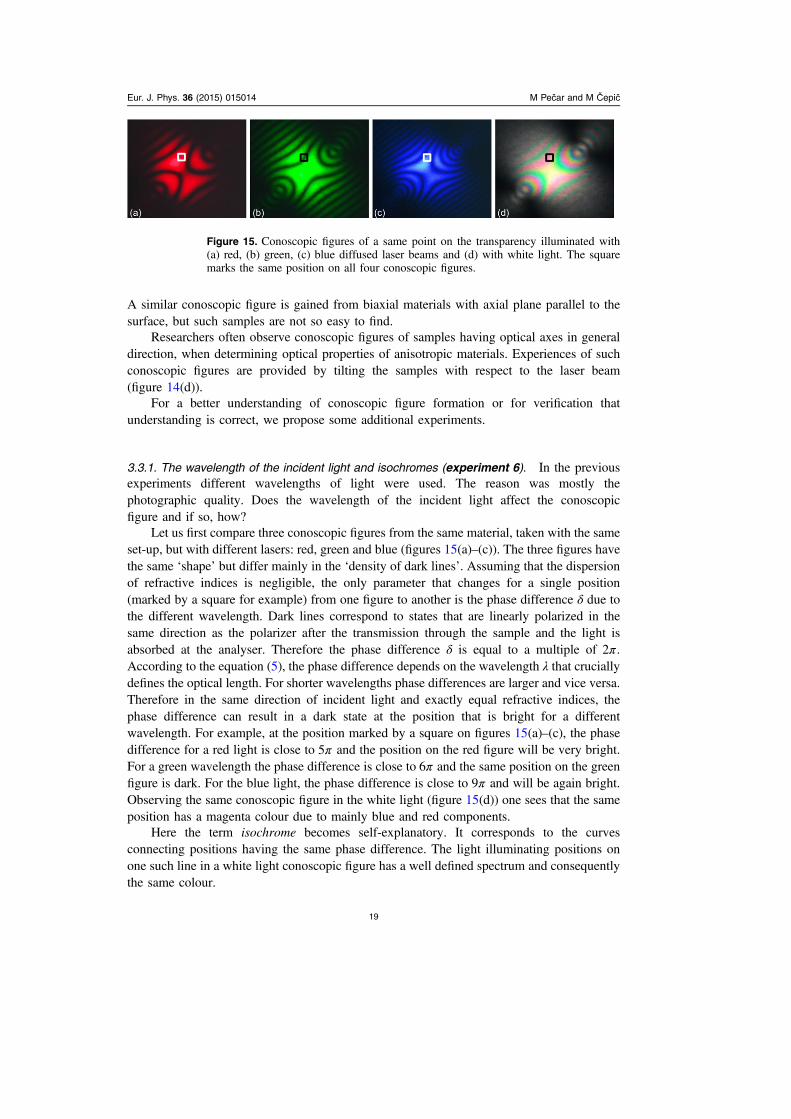
3.3.1. The wavelength of the incident light and isochromes (experiment 6). In the previousexperiments different wavelengths of light were used. The reason was mostly thephotographic quality. Does the wavelength of the incident light affect the conoscopicfigure and if so, how?
Let us first compare three conoscopic figures from the same material, taken with the sameset-up, but with different lasers: red, green and blue (figures 15(a)–(c)). The three figures havethe same ‘shape’ but differ mainly in the ‘density of dark lines’. Assuming that the dispersionof refractive indices is negligible, the only parameter that changes for a single position(marked by a square for example) from one figure to another is the phase difference δ due tothe different wavelength. Dark lines correspond to states that are linearly polarized in thesame direction as the polarizer after the transmission through the sample and the light isabsorbed at the analyser. Therefore the phase difference δ is equal to a multiple of π2 .According to the equation (5), the phase difference depends on the wavelength λ that cruciallydefines the optical length. For shorter wavelengths phase differences are larger and vice versa.Therefore in the same direction of incident light and exactly equal refractive indices, thephase difference can result in a dark state at the position that is bright for a differentwavelength. For example, at the position marked by a square on figures 15(a)–(c), the phasedifference for a red light is close to π5 and the position on the red figure will be very bright.For a green wavelength the phase difference is close to π6 and the same position on the greenfigure is dark. For the blue light, the phase difference is close to π9 and will be again bright.Observing the same conoscopic figure in the white light (figure 15(d)) one sees that the sameposition has a magenta colour due to mainly blue and red components.
Here the term isochrome becomes self-explanatory. It corresponds to the curvesconnecting positions having the same phase difference. The light illuminating positions onone such line in a white light conoscopic figure has a well defined spectrum and consequentlythe same colour.
Figure 15. Conoscopic figures of a same point on the transparency illuminated with(a) red, (b) green, (c) blue diffused laser beams and (d) with white light. The squaremarks the same position on all four conoscopic figures.
Eur. J. Phys. 36 (2015) 015014 M Pečar and M Čepič
19

3.3.2. The brushes and isogyres (experiment 7). Finally, let us observe the changes of theconoscopic figure if the sample is rotated between crossed polarizers.
Figure 16(a) shows a conoscopic figure of a biaxial sample oriented in such a way that twooptical axes lie in a plane defined by a transmission direction of the polarizer and the normal tothe sample. Both melatopes are encircled by dark isochromes. Two additional dark lines, alsocalled brushes, parallel to transmission directions of both polarizers crossing isochromes areclearly seen. These two lines connect positions in the conoscopic figure that are related to lightbeams being polarized along one of the vibration directions in the anisotropic sample. Whitecrosses mark these two directions at each point in an upper right part of the figure.
Figure 16(b) shows the same sample rotated clockwise by about 13° in the same set-up.Brushes now have a different shape. They again cross the melatopes, as the light propagatingalong the optical axis can have any polarization. Dark brushes that start in the melatopeconnect positions with the same property as before the vibration directions of both beamscorrespond to transmission directions of P and A. Orange crosses in the figure mark vibration
Figure 16. Conoscopic figures of the biaxial sample (a transparency). The sample isrotated with respect to crossed polarizers that are indicated in the left corner of eachpicture. Rotating angle is measured between the transmission direction of polarizer Pand the plane containing optical axes seen as melatopes. The sample is rotated for(a) 0°, (b) 13°, (c) 22,5°, and (d) 43°. Vibration directions are marked on the brushes—the dark isogyres. (e) Figure shows isogyres with the angles between the polarizationdirection and the vibration direction °0 (white), °13 (orange), 22.5° (blue) and °42(yellow). This experimental procedure allows for mapping of vibration direction for ageneral place in the figure. In the directions of the melatopes (optical axes) the marksare red and in those directions the light is travelling as through isotropic material.(f) Skiodrome of a biaxial material.
Eur. J. Phys. 36 (2015) 015014 M Pečar and M Čepič
20
directions within the upper brush. Rotating further (figures 16(c) and (d)) it is clearly seen byrotating the sample; the brushes have different orientations and forms. This procedure allowsfor experimental determination of vibration directions for light illuminating each point on theconoscopic figure.
Figure 16(e) shows the cumulative results of vibration direction mapping performed inthe first four figures. Crosses indicating different vibration directions were transferred fromfigures 16(b)–(d) onto figure 16(a) and were rotated to correspond to the system presented infigure 16(a). The colour code indicates crosses from the same figure that correspond to thebrushes observed at that figure. It is clearly seen that crosses are rotated for the same angleanti-clockwise as the corresponding figure where they were marked. If orange crosses areconnected by a line, the places illuminated by the light with the vibration direction of one ofthe beams that forms an angle of 13° with the transmission direction of polarizer in theanisotropic material are known. Such lines with fixed orientation of the polarizer with respectto vibration direction are called isogyres. Different angles are marked by differently colouredcrosses on figure 16(e). A greater amount of such mapping would result in a map of curvescalled a skiodrome that define the planes of vibrations in various directions. For a biaxialmaterial a skiodrome is represented in the figure 16(f). Such experiments not only improvethe understanding of isogyres, but also of skiodromes, which are often used for explanation ofisogyres and consequently their lines are often mistaken as isogyre curves.
The procedure described above allows for determination of vibration directions of lightilluminating any point in the conoscopic figure. It is clearly seen that for oblique incidence thepolarization directions change with azimuth of the incident beam as shown already by muchsimpler experiments (figures 9 and 10). As already said, the conoscopic figure merges severalphenomena presented separately by previous introductory experiments.
4. Conclusions
The transmission of light through an anisotropic material and its polarization seems to hide alot of small phenomena and subtle details that contribute to conoscopic figure formation andwhich are far from clear to many undergraduate students. This paper presents a theoreticalbackground important for understanding conoscopic figure formation and two sets ofexperiments. The first set of experiments study isolated phenomena that contribute to theconoscopic figure formation. The aim is to provide fundamental experiences to students onhow the elliptical state of polarization can be determined, influenced and how it influences thetransmission through crossed polarizers. In the second set of experiments, a simple hands-onconoscope is first constructed. This conoscope is then used for experiments introducingelements of the conoscopy: different conoscopic figures for different materials with differentproperties and different orientations, the influence of the wavelength on the figure, andexperimental demonstration of isochromes and isogyres.
We believe that the set of experiments suggested in this paper will help students toconstruct the necessary knowledge and also stimulate the lecturer to present some of them as ademonstration or to include conoscopy in the optics laboratory if not yet present.
We purposely did not include the extraction of optical data, refractive indices, opticalaxis orientations and similar from the figure as the procedures are discussed in detail invarious textbooks [22, 23]. Our main aim was to allow students enough experience throughexperiments to substantiate the extraction of data from experimental measurements forresearch purposes that are often done by following ‘cookbook recipes’.
Eur. J. Phys. 36 (2015) 015014 M Pečar and M Čepič
21

Acknowledgments
The authors gratefully acknowledge Dr Simon Čopar, and the reviewers for their carefulreading of the contribution and for useful suggestions.
References
[1] Zeldovich B Y and Soileau M J 2004 Phys.-Usp. 47 1239–55[2] Herreman W and Notebaert H 1983 Am. J. Phys. 51 91[3] Morgan B H 1982 Phys. Teach. 20 541–2[4] Cox A J 1978 Am. J. Phys. 46 302–3[5] Fernando P C B and Samarasinghe S 1996 Am. J. Phys. 64 565–8[6] Mayes T W 1976 Am. J. Phys. 44 1101–3[7] Camp P R 1994 Am. J. Phys. 62 859–60[8] Perkalskis B S 2010 Am. J. Phys. 78 1434[9] Berry M, Bhandari M and Klein S 1999 Eur. J. Phys. 20 1–14[10] Burns S H and Jeppesen M A 1960 Am. J. Phys. 28 774–6[11] Davies G R 1990 Phys. Teach. 28 464–7[12] Ohtsuka K, Ara H and Ogawa T 1984 Jpn J. Appl. Phys. 23 1541–2[13] Gao Y, Xia H R, Xu J Q, Si S C, Zhang H J, Wang J Y and Song H L 2007 Cryst. Res. Technol. 42
1126–31[14] Ageev L A and Yegorenkov V D 1999 Am. J. Phys. 67 837–8[15] Piquero G and Velgas-Balbuena J 2004 Eur. J. Phys. 25 793–800[16] Bullver-Cebreros C and Rodriguez-Danta M 2009 Eur. J. Phys. 30 285–94[17] Ziherl S, Bajc J, Urankar B and Čepič M 2010 Eur. J. Phys. 31 531–42[18] Blanco M A, Yuste M and Carreras C 1997 Am. J. Phys. 65 784–7[19] Beléndez A, Fernández E, Francés J and Neipp C 2010 Eur. J. Phys. 31 551–61[20] Cloud S D 1973 Am. J. Phys. 41 1184–8[21] Trester S 1993 Am. J. Phys. 61 62–6[22] Born M and Wolf E 1993 Principles of Optics (Oxford: Pergamon)[23] Hecht E 2002 Optics 4th edn (San Francisco: Addison-Wesley)[24] EMANIM 2014 Animations of electromagnetic waves www.enzim.hu/szia/emanim/emanim.htm
(24 February 2014)[25] Hartshorne N H and Stuart A 1964 Practical Optical Crystallography (London: Edward Arnold)[26] Wahlstrom E E 1969 Optical Crystallography 4th edn (New York: Wiley)[27] Pavlin J, Susman K, Ziherl S, Vaupotič N and Čepič M 2011 Mol. Cryst. Liq. Cryst. 547 255–61[28] Merck & Co. Inc., www.merck.com/
Eur. J. Phys. 36 (2015) 015014 M Pečar and M Čepič
22