CONNECTU SOCIAL ENTERPRISE - · PDF fileconnectu social enterprise final research monograph...
56
CONNECTU SOCIAL ENTERPRISE FINAL RESEARCH MONOGRAPH EVALUATION OF HORIZON 21’S CONNECTU SOCIAL ENTERPRISE (WARRNAMBOOL AND SURROUNDING DISTRICTS) Graeme Wines Mary Graham Helen Scarborough Janet Stanley Anne Wallis
Transcript of CONNECTU SOCIAL ENTERPRISE - · PDF fileconnectu social enterprise final research monograph...

CONNECTU SOCIAL ENTERPRISE
FINAL RESEARCH MONOGRAPH
EVALUATION OF HORIZON 21’S CONNECTU SOCIAL ENTERPRISE
(WARRNAMBOOL AND SURROUNDING DISTRICTS)
Graeme Wines
Mary Graham
Helen Scarborough
Janet Stanley
Anne Wallis

2
CONNECTU SOCIAL ENTERPRISE
Final Research Monograph
EVALUATION OF HORIZON 21’S CONNECTU SOCIAL ENTERPRISE
(WARRNAMBOOL AND SURROUNDING DISTRICTS)
Authors
Prof Graeme Wines, Deakin University
Dr Mary Graham, Deakin University
Dr Helen Scarborough, Deakin University
Dr Janet Stanley, Monash Sustainability Institute, Monash University
Dr Anne Wallis, Deakin University
Acknowledgements
The authors gratefully acknowledge the financial support for this research provided by the
Bus Industry Confederation, Bus Association Victoria Inc and Warrnambool Bus Lines Pty
Ltd. We also thank the ConnectU staff for their time in providing us with information to
assist in the preparation of this report, and thank the passengers, passenger’s family members
and volunteer drivers who made themselves available for our interviews.
© 2014 Horizon 21
ISBN: 978-0-9875677-7-2
MSI Report: 14/4

3
CONTENTS Executive summary .................................................................................................................... 5
The importance of transport and the ConnectU social enterprise .......................................... 5
ConnectU services delivered .................................................................................................. 6
Passenger feedback ................................................................................................................ 6
Organisation/Agency information .......................................................................................... 7
Cost-benefit analysis .............................................................................................................. 7
Recommendations .................................................................................................................. 8
1. Introduction ........................................................................................................................ 9
The importance of transport ................................................................................................... 9
Community transport.............................................................................................................. 9
Integrated transport .............................................................................................................. 10
2. Background to ConnectU ................................................................................................. 13
Transport disadvantage, social exclusion and wellbeing ..................................................... 13
About ConnectU ................................................................................................................... 14
This evaluation ..................................................................................................................... 15
3. Research Method .............................................................................................................. 17
Research aims ....................................................................................................................... 17
Research ethics ..................................................................................................................... 17
Research method .................................................................................................................. 18
Pilot study: The first 12 months of ConnectU’s operation ............................................... 18
Data collection: ConnectU services delivered .................................................................. 18
Semi-structured interviews: ConnectU passengers .......................................................... 18
Semi-structured interviews: Community agencies ........................................................... 18
Cost-benefit analysis......................................................................................................... 19
4. Research findings ............................................................................................................. 20
ConnectU services delivered ................................................................................................ 20
ConnectU trips delivered .................................................................................................. 20
ConnectU passengers ........................................................................................................ 23
Purpose of trips with ConnectU........................................................................................ 25
Method of operation of ConnectU .................................................................................... 27
Passenger interviews ............................................................................................................ 29
Description of interviewed service users .......................................................................... 29

4
Use of ConnectU .............................................................................................................. 30
Opinions about the ConnectU service .............................................................................. 31
Other issues....................................................................................................................... 34
Changes in connection with the community and wellbeing ............................................. 35
Organisation / Agency information ...................................................................................... 38
Organisation characteristics .............................................................................................. 38
Transport role of agencies ................................................................................................ 39
Cost-benefit analysis ............................................................................................................ 43
Estimation of benefits ....................................................................................................... 44
Estimation of Costs ........................................................................................................... 45
Benefit cost ratio ............................................................................................................... 45
Sensitivity analysis ........................................................................................................... 45
5. Discussion And Conclusions ............................................................................................ 47
6. Recommendations ............................................................................................................ 50
6.1 Transparency in transport funding ............................................................................ 50
6.2 Place-based organisation of transport services.......................................................... 50
6.3 A transport or a service problem? ............................................................................. 50
6.4 Increase in public transport ....................................................................................... 50
6.5 Extend the ConnectU service .................................................................................... 51
6.6 Trial of ‘Total Transport’ .......................................................................................... 51
6.7 Improved allocation of resources .............................................................................. 52
References ................................................................................................................................ 54

5
EXECUTIVE SUMMARY To address issues of transport disadvantage and social exclusion in Warrnambool and the
surrounding region, the Warrnambool based Horizon 21 has piloted a two year social
enterprise project under the name ConnectU. The project commenced on 6 August 2012, with
the first passenger being transported on 11 September 2012.
Research into the ConnectU pilot project has been undertaken by a team of researchers from
Deakin University and the Monash Sustainability Institute. The research, reported in this
monograph, evaluates the ConnectU pilot social enterprise, particularly assessing outcomes in
terms of services delivered, costs and benefits, and social inclusion, wellbeing and equity.
Some of the major findings of the research into ConnectU are as follows:
THE IMPORTANCE OF TRANSPORT AND THE CONNECTU SOCIAL ENTERPRISE
ConnectU is an innovative pilot scheme, representing a social enterprise, aimed at
addressing issues of transport disadvantage and social exclusion in Warrnambool and
the surrounding region. The service provides members of the community with access to
a central hub for transport services, assistance and information.
The ConnectU pilot is important as Warrnambool and surrounding regions have a
relatively high incidence in the population of groups who find difficulty in achieving
mobility.
Users of the service include individuals who are unable to access public transport and
those who are having difficulty finding a means of travelling to and from their
destinations, especially for medical and medically related appointments.
Connection with community remains a significant contributor to social inclusion and
personal wellbeing, and this is especially the case for people in regional areas. The
ConnectU social enterprise has assisted greatly in this respect.
A great deal of significant work has been undertaken and completed in terms of
establishing ConnectU and its services. This work will have been wasted if the service
is not funded into the future.
Funding into the future will allow ConnectU to continue working toward the
development of greater synergies and economies in the utilisation of vehicles controlled
by various agencies in Warrnambool and the surrounding region.
The considerable increase in the number of clients serviced by ConnectU, as indicated
in the rapid increase in the number of trips per month since inception, means that the
service has limited scope, at its current level, to satisfy a clear level of unmet demand.
The Warrnambool based ConnectU pilot is a working example of a social enterprise
project that could be extended to other regional areas to address issues of social
wellbeing and social disadvantage.

6
CONNECTU SERVICES DELIVERED
The total number of one-way trips delivered by ConnectU to clients over the period
commencing October 2012 to the end of August 2014 was 3,387. The program started
slowly but has grown appreciably with little advertising.
The number of trips undertaken when the service first commenced was low, but this
increased rapidly as ConnectU became established. The average number of trips per
month in the first six months of operation was 39 (October 2012 to March 2013), with
this increasing to an average of 346 trips per month in the three months June to August
2014. There were 360 trips for the month of August 2014 (the latest period covered in
this research monograph).
165 clients have utilised ConnectU’s services in the period from its inception until the
end of August 2014. The majority of clients (three-quarters) were female.
ConnectU passengers were predominantly in the older age groups, with approximately
one-third of passengers aged 70 to 79 and a further one-third aged 80 to 89. The next
highest frequency age brackets for passengers were 60 to 69 (9.9 per cent) and 90 to 99
(9.2 per cent). Only 6.4 per cent of passengers were aged below 50.
The number of trips undertaken by any one individual client varied greatly. The largest
group of clients (58 clients, or 35.2 per cent) had made one return journey only in the
period from ConnectU’s inception until the end of August 2014. The majority of clients
(103 clients, or 62.5 per cent) used the service for one to five return trips over the
period. At the other end of the scale, only 28 clients (17 per cent) used the ConnectU
service for 20 or more return trips over the period. These statistics indicate that the
ConnectU service has not become one servicing a small number of clients who are
making a large number of multiple journeys, as this is not its role.
The majority of trips undertaken by ConnectU passengers were for medical purposes
(doctor, dentist, optometrist, podiatrist, audiologist, physiotherapy, etc). These trips
represented 69.3 per cent of those in the period from October 2012 until the end of
August 2014. The other highest frequency purpose was for shopping, banking and
paying bills (11.3 per cent).
Vehicles sourced from ConnectU itself represented by far the greatest kilometres
travelled in delivering its services (67.6 per cent of total kilometres travelled). Vehicles
sourced from Warrnambool City Council represented 13.4 per cent of total kilometres
travelled. Volunteer and Moyne Health vehicles represented, respectively, 10.9 and
eight per cent of total kilometres, while Brophy vehicles were used for a minority (0.1
per cent) of kilometres.
ConnectU’s operating costs have been minimised by the extensive use of volunteer
drivers, mainly pursuant to the Warrnambool City Council’s Volunteering
Warrnambool program. A further advantage is that these volunteers are able to provide
additional services to ConnectU clients that would not be provided by commercial
transport providers.
PASSENGER FEEDBACK
Interviews with clients/passengers indicated that the ConnectU service was preferable to
public transport as it costs less, was prompt and because the driver could provide
additional assistance. Reasons for not using public transport included the lack of public
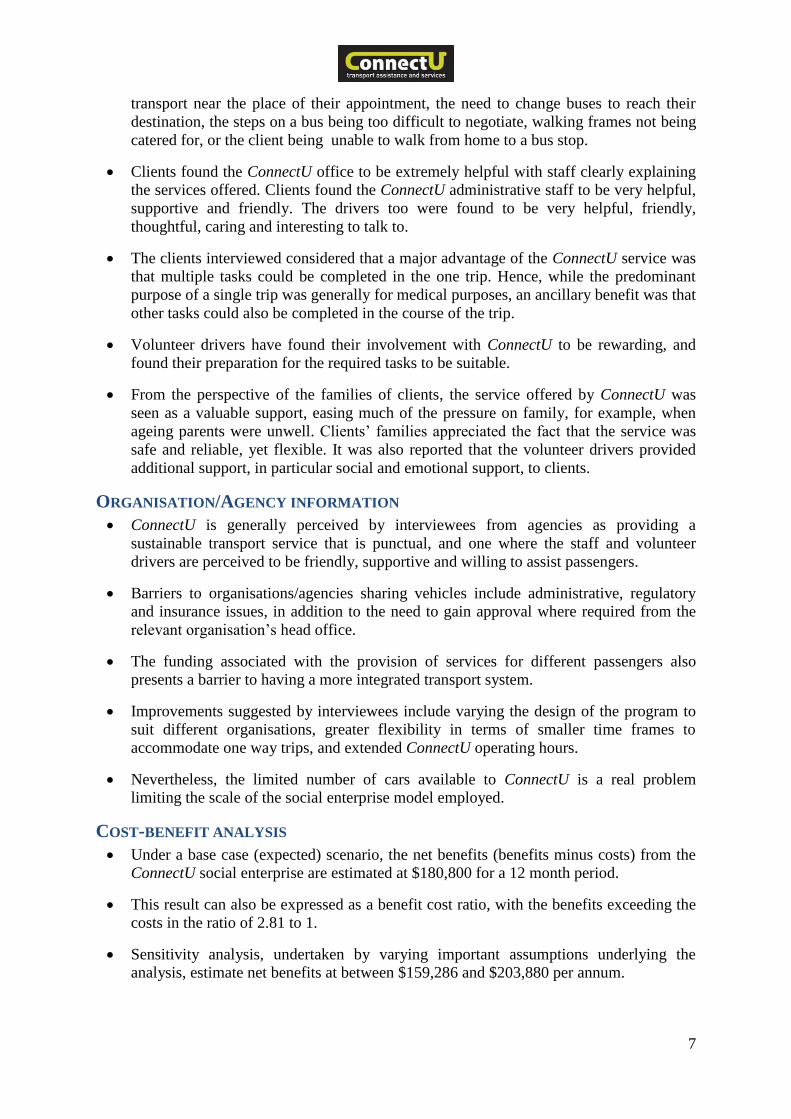
7
transport near the place of their appointment, the need to change buses to reach their
destination, the steps on a bus being too difficult to negotiate, walking frames not being
catered for, or the client being unable to walk from home to a bus stop.
Clients found the ConnectU office to be extremely helpful with staff clearly explaining
the services offered. Clients found the ConnectU administrative staff to be very helpful,
supportive and friendly. The drivers too were found to be very helpful, friendly,
thoughtful, caring and interesting to talk to.
The clients interviewed considered that a major advantage of the ConnectU service was
that multiple tasks could be completed in the one trip. Hence, while the predominant
purpose of a single trip was generally for medical purposes, an ancillary benefit was that
other tasks could also be completed in the course of the trip.
Volunteer drivers have found their involvement with ConnectU to be rewarding, and
found their preparation for the required tasks to be suitable.
From the perspective of the families of clients, the service offered by ConnectU was
seen as a valuable support, easing much of the pressure on family, for example, when
ageing parents were unwell. Clients’ families appreciated the fact that the service was
safe and reliable, yet flexible. It was also reported that the volunteer drivers provided
additional support, in particular social and emotional support, to clients.
ORGANISATION/AGENCY INFORMATION
ConnectU is generally perceived by interviewees from agencies as providing a
sustainable transport service that is punctual, and one where the staff and volunteer
drivers are perceived to be friendly, supportive and willing to assist passengers.
Barriers to organisations/agencies sharing vehicles include administrative, regulatory
and insurance issues, in addition to the need to gain approval where required from the
relevant organisation’s head office.
The funding associated with the provision of services for different passengers also
presents a barrier to having a more integrated transport system.
Improvements suggested by interviewees include varying the design of the program to
suit different organisations, greater flexibility in terms of smaller time frames to
accommodate one way trips, and extended ConnectU operating hours.
Nevertheless, the limited number of cars available to ConnectU is a real problem
limiting the scale of the social enterprise model employed.
COST-BENEFIT ANALYSIS
Under a base case (expected) scenario, the net benefits (benefits minus costs) from the
ConnectU social enterprise are estimated at $180,800 for a 12 month period.
This result can also be expressed as a benefit cost ratio, with the benefits exceeding the
costs in the ratio of 2.81 to 1.
Sensitivity analysis, undertaken by varying important assumptions underlying the
analysis, estimate net benefits at between $159,286 and $203,880 per annum.

8
Under a long run projected growth scenario for ConnectU of 10,000 trips per annum
(scenario 3), and given the assumption that the ConnectU social enterprise model has
the potential to generate significant efficiency dividends and additional benefits to the
community through the sharing and pooling of regional transport resources, estimated
net benefits could be as high as $452,000 per annum.
The cost-benefit analysis reveals that the benefits of the service to the community
outweigh the costs of the provision of the service provided by ConnectU. This is
particularly significant as many of the intangible benefits of the service cannot be, and
have not been, quantified in the cost benefit analysis.
RECOMMENDATIONS
There should be clear transparency in transport funding to provide the government with
coherent oversight of the totality of funding for transport services. The funding for
community transport is, at present, highly complex, disaggregated, and lacking clear
transparency.
As local areas best understand local needs and the optimal way to achieve mobility for
all those who need it, a place based organisation of transport services is recommended.
To overcome the potential for a failure of services, especially those medically related,
there should be better planning of appointments to fit in with transport options. This will
ensure individuals and agencies are not paying unnecessarily for a high cost service,
such as a taxi or ambulance.
An increase in the provision of public transport services over the Warrnambool
catchment area is recommended.
It is recommended, when resources become available, that the ConnectU social
enterprise move to broaden its passenger groups and extend its hours of operation.
It is recommended that ConnectU move to a trial of ‘Total Transport’, based on the UK
model which involves health, social services, education and mainstream transport fleets
and budgets being pooled to provide a single service.
There needs to be a change in the funding scheme to support transport for those people
who are not able to utilise the public transport system.
In summary, this research clearly demonstrates the need for the services provided by
ConnectU. The growth in the use of the service has been significant, particularly considering
the minimal advertising of the services provided. The constraint to further growth will be
from the supply side and the availability of vehicles, but it is highly likely that there is
considerable unmet further demand for the service within the community. The process of the
establishment of the service has been professional and efficient, and the professionalism of
the ConnectU staff in the operation of the service, as evidenced by the positive feedback from
all parties involved, is to be commended.

9
1. INTRODUCTION
THE IMPORTANCE OF TRANSPORT
There is an increasing recognition of the important role of transport in the delivery of good
economic, social and environmental outcomes. While the priority of attention has centred on
commuting travel, there is at present increasing international interest in the delivery of local
transport. A number of issues have led to this interest, including urban sprawl, traffic
congestion, the need to reduce greenhouse gas emissions, growing obesity levels, poor
quality and inadequate levels of infrastructure resulting in pockets of urban disadvantage, and
increasing recognition that many people have inadequate transport options. At the same time
there has also been recognition of the social and economic value of the ability to be mobile,
both to the individual and wider society. A recent report from the UK has found that:
The bus is one of the biggest bargains available to transport policy makers in
achieving a very broad range of transport, economic, environmental and social
objectives in a cost effective way and in a timely fashion (pteg newsletter, 2014)
As a solution to many traffic and planning related problems, internationally, cities such as
Portland, Vancouver, Toronto and Frankfurt are adopting policies of a city of ‘20 minute
neighbourhoods’. A 20 minute neighbourhood is one where most people are able to undertake
most activities needed for a good life within a 20 minute walk, cycle or public transport trip
from where they live. The essential component of this idea is the provision of a high quality
minimum route bus service. This minimum service level has been found to be economically
viable in Victoria at about eight passenger boardings per hour (Stanley, 2012). Public
transport is supported by walking and cycling opportunities. Where there is a low boarding
rate, or people are not able to use route bus transport or undertake active transport, then
mobility is provided in other ways, such as by taxis, community transport and demand
responsive transport. The 20 minute neighbourhood is also facilitated through densification of
urban dwellings, which also encompasses mixed use buildings, and the local provision of
most essential services, such as retail, local doctors, banks, a library and a theatre.
In Victorian regional areas, urban centres such as Warrnambool have been experiencing
many of the urban problems referred to above. However, they also experience an overlay of
issues due to changes in rural communities. Rural Victoria has a growing aging population.
This is part of the aging trend of the total Australian population, but in rural areas there is a
trend for youth to move to larger urban areas, in part due to a lack of transport to places of
education and employment. Local businesses (services) in smaller towns are closing, creating
additional difficulties for those without easy transport options. When services, such as
doctors, banks, hospitals, or pharmacies move away from small towns and become
centralised, cost shifting takes place. The cost of transport is moved from the supplier of the
service to the user of the service. On retirement, many older people move to the larger
regional centres to access services more easily. These older persons are boosting the numbers
of people who are experiencing mobility difficulties in larger rural towns, such as
Warrnambool.
COMMUNITY TRANSPORT
Recognition of the importance of being able to access services and occupational needs where
there is either an absence of local public transport or personal difficulties using public
transport, has led to the growth of community transport in Australia and other industrialised
10
countries. Community transport is available for selected people and for selected activities –
commonly those with a disability and the aged, usually to travel to and from a specific
agency service or activity at a set day/time. It is common for the agency to own or lease
vehicles (cars and small buses) to transport their clients. The capital cost of the vehicles is
often funded through a charitable donation or purchased under a state or sometimes federal
government grant. Operational costs of the vehicles are commonly met through joint funding
from federal and state governments, under the Commonwealth Home and Community Care
Services (HACC) scheme or other welfare state funded programs, such as disability services.
In a 2011 survey of 88 organisations with community transport, 43 per cent of agencies said
they received HACC funding for transport. ‘Internal’ sources of funding for transport
occurred in 15 per cent of agencies, and ‘donations from clients/passengers’ occurred in 13
per cent of the agencies (IPSOS-Eureka, 2011).
There is an overlap of the type of passengers who travel on both the route bus and community
transport systems, both groups of passengers tending to have a lower income and be a non-car
driver. However, some community bus passengers are unable to travel on a route bus due to
disability. There is a marked difference in the regulations and oversight of each of the
transport systems. The routes and timetables of route buses, and requirements around issues
such as safety, hours of driving, fees and training, are determined by the state government. In
contrast, community buses are not required to follow a particular route or have a set
timetable, nor are they available to the general public.
Despite the presence of both route bus and community transport services, an examination of
transport in Warrnambool found that there is a potential market of unmet trips amounting to
perhaps 150,000 trips a year (Stanley & Stanley, 2012). These people with unmet mobility
needs tend not to be associated with a welfare agency or residential institution. Welfare
agencies commonly provide a service to their clients who have a disability, are aged, and
those receiving counselling and social support. Residential institutions sometimes cater for
some shopping, medical and recreational needs. Those groups of people with unmet travel
needs include those not connected with a welfare agency, elderly frail people, those on a low
income who can’t afford a car, single parents, those with chronic or short term medical
problems and, particularly, youth. This issue of unmet travel needs has been recognised
elsewhere, and has led to developments such as the ‘SunAssist’ program in Mildura which
offers a day and night transport service to elderly people and those with a disability
(Sunraysia Daily, 2014). Other locations are also looking at models for the provision of
transport for those presently missing out, however sustainability and economic viability
appears to be a significant hurdle to overcome (personal communication, 2014).
The 2012 Warrnambool report also found that there was under-utilisation of vehicles in the
community transport sector, it being uncommon for vehicles to be used more than half time
during the week and rarely used at weekends and evenings (Stanley & Stanley, 2012). This
under-utilisation of vehicles has also been noted in a 2011 survey of community transport in
Victoria and also in important transport work coming from the UK (IPSOS-Eureka, 2011;
pteg 2014). Thus some vehicle assets are sitting idle, while at the same time there appears to
be considerable unmet transport needs.
INTEGRATED TRANSPORT
Concerns are being expressed internationally about the fragmentation of transport services for
health (including ambulance transportation) and welfare, including a lack of leadership and
monitoring of services, with poor data on costs and activities and the best use of resources
11
(Auditor General for Scotland and the Accounts Commission, 2011). At the same time there
is increasing recognition that those who live and work in a local area understand the
requirements of the area better than those designing and planning a standardised service from
a distance.
Recognising these issues, there is increasing interest in the UK, Europe and in Canada in
better coordination of local transport through a localised central hub. This involves jointly
working across the public sector and commercial and voluntary transport providers to
improve planning and service efficiency and reduce costs (Auditor General for Scotland and
the Accounts Commission, 2011). In work from Canada, a report from Ontario recommends
coordination between conventional and specialised public transport agencies, including:
Long-term care agencies; social service agencies; hospitals, ambulance and patient
transfer operators; school boards and school bus companies; intercity bus
companies; taxi operators; and volunteer groups (Ontario Ministry of Transportation
2012, p.105).
This inclusive coordination is again echoed in a recent report from the UK (pteg, 2014). The
report talks about the:
sharing of resources, the opportunities associated with excess capacity and a
centralised service for dispatch of services, …with harmonized hours, routes, transfer
points and timing (Ontario Ministry of Transportation 2012, p.105).
The report recommends the central hub should develop a coordinated, agency-wide
technology plan encompassing all aspects of transport, such as vehicle location identification,
transfer information, maintenance tracking, electronic fares, passenger counters and security.
There should also be centralised asset management targeted to meet service quality and
passenger growth targets while maximising returns on investments. The central hub would
provide information and detailed wayfinding on all transport routes and stops, as well as
connections to other modes of transport, including bike paths and walking paths. Real time
tracking by passengers should be available through a range of media outlets.
The Western Australian Planning Commission (2012) has produced guidelines for integrating
transport plans. While not offering details on the integration between public and active
transport and community transport, the report espouses the importance and value of all
transport integration to achieve social inclusion, safety, air quality, to address greenhouse gas
emissions, achieve effectiveness and robustness and cost efficiency. It talks of integration
between modes, as well as between transport and other activities; drawing on local
knowledge to influence high-level policy; and, the provision of opportunities to develop new
ways of doing things, not allowed for under present transport funding arrangements.
In September 2011, the Victorian government implemented the Transport Connections
Program ((Department of Planning and Community Development, 2011). This program had
the aims of improving access to services and facilities for the young, elderly and those with a
disability living in regional Victoria, as well as improving coordination and sustainability of
community transport, and the skills and independence of isolated people (Department of
Planning and Community Development, 2012). The program ran for three years before being
closed. The program failed to address issues of transport coordination, costs and the
sustainability of transport and the needs of local people not associated with a welfare agency.

12
This report evaluates an embryonic transport project, ConnectU in Warrnambool, a regional
town with a population of 34,000, in western Victoria, Australia. This project seeks to
address many of the issues now also being identified internationally, namely the need for
considerable improvement in local transport in terms of efficiency and effectiveness. The
argument is that such improvements would improve social and financial outcomes for
individuals and organisations, as well as ultimately provide economic benefits both regionally
and in the wider society. This report examines whether ConnectU can be said to be beginning
to achieve some of these outcomes.
13
2. BACKGROUND TO CONNECTU
TRANSPORT DISADVANTAGE, SOCIAL EXCLUSION AND WELLBEING
Prior research has developed models for, and investigated links between, transport
disadvantage, social exclusion and wellbeing.1 The research has associated a lack of transport
options with wider social disadvantage and social exclusion. Various studies have identified a
mismatch between public transport supply and social need, with the mismatch having greater
impacts for marginalised groups. In particular, negative impacts are apparent in terms of
reduced access to jobs, education and recreational options.
Stanley et al. (2011, 2012) highlight the significant association between increased mobility
(trip making and activities undertaken) and a reduced risk of social exclusion and an
increased sense of community and social capital. The findings of Vella-Brodrick and Stanley
(2013) further indicate that the impact and benefits of transport mobility extend to
psychosocial factors related to wellbeing. The above papers derive estimates of the
considerable value of increased mobility, and suggest that the risk of social exclusion may be
reduced by policy and program measures that foster the development of social capital and
connection to the community.
Currie et al. (2009) point to gaps in public transport services in Australian fringe urban areas
and to the link with transport disadvantaged people who tend to live in these areas, and
highlight the technical challenge of identifying more viable approaches to meet the social
equity gap. Improved mobility may be one way to foster the development of social capital,
giving increased mobility an important role in reducing risks of exclusion (Stanley et al.,
2011). Prior research generally suggests that a mix of creative solutions is required if the
travel needs of marginalised groups are to be met.
In modelling influences on risk of social exclusion and wellbeing, Stanley et al. (2011)
suggest that connection with community remains a significant contributor to personal
wellbeing.2 This finding highlights the importance of considering how to improve regional
mobility levels (Stanley & Stanley, 2012). It has been argued that:
Public policy initiatives that deliver cost-effective improvements in regional personal
mobility are likely to be valuable to both individuals and the community generally.
Where the beneficiaries are likely to be at risk of social exclusion, this value is likely to
be particularly high, provided mobility solutions are provided cost-effectively. (Stanley
& Stanley, 2012, p. 4)
The Victorian government has identified transport disadvantage as ‘a key factor contributing
to social exclusion for a variety of different groups in Victoria’, with access to transport
‘consistently rated by rural and regional communities as one of the most significant barriers
to accessing services, employment and social networks’ (Department of Planning and
Community Development, 2011, [now known as the Department of Transport, Planning and
Local Infrastructure]). The specific groups identified as being more likely to experience
transport disadvantage were (a) people aged over 60, (b) people living with a disability,
1 See, for example, Cass et al., 2005; Hurni, 2006; Currie and Senbergs, 2007; Preston and Rajé, 2007; Currie
et al., 2009; Delbosc and Currie, 2011; Stanley et al., 2011. 2 As measured by the Personal Well-being Index.

14
(c) unemployed persons, (d) students (at all levels), (e) children (0 to 5 years of age),
(f) people from culturally and linguistically diverse backgrounds, (g) Indigenous people,
(h) lone parents, and (i) shift workers (Department of Planning and Community
Development, 2011).
ABOUT CONNECTU
ConnectU is a pilot social enterprise project, with the aim of addressing unmet transport
needs in a coordinated and cost effective way, thereby improving the inclusion and wellbeing
of local residents. ConnectU provides members of the community with access to a central
hub for transport services, assistance and information. It aims to combine the transport
resources of various service providers and integrate service provision to efficiently achieve
improved services and improved utilisation of vehicles.
Users of the service include individuals who are unable to access public transport and those
who are having difficulty finding a means of travelling to and from their destinations.
ConnectU organises drivers to provide door-to-door transport for clients to attend medical
appointments, shopping, social outings, or to meet other needs. A fare of $12 is charged at
present for a return trip is charged for local Warrnambool trips and $15 for Port Fairy based
trips.
The operation of ConnectU depends on volunteer drivers. The service provided often extends
beyond vehicle transportation. For example, the service frequently assists passengers from
the car and into a medical clinic for their appointment and assists in familiarising passengers
with public transport. In partnership with Volunteers Warrnambool, organised by
Warrnambool City Council, and a more recent addition of the Moyne Health Services
volunteer system, ConnectU volunteers have completed a police check, have a Working with
Children Certificate and are covered for insurance.
To be eligible to access the ConnectU community transport scheme, passengers must meet at
least one criterion in one access category from the following table (Table 2.1). The policy of
ConnectU is to offer a regular transport service once a person has been registered as a
passenger, until transport can be offered elsewhere on a sustainable basis, such as through the
use of public transport, taxis or where transport is provided by a community member.

15
Table 2.1 ConnectU passenger eligibility criteria
Access Category Eligibility Criteria
1. Accessibility 1.1 Public transport does not service the local area or the
frequency and routes are not compatible with the needs of the user.
1.2 That the person is unable to access public transport options
independently and that the individual has no means of personal
support to assist in accessing an available transport option.
2. Affordability 2.1 The person has a degree of financial hardship. This will need
to be demonstrated via evidence that the person is currently a Health
Card holder, disability pensioner or aged pensioner.
3. Intended Use 3.1 To attend medical appointments, essential shopping needs,
employment, studies or social programs.
3.2 To visit family.
3.3 To reduce social isolation.
4. Other options 4.1 Not eligible to access any other local community transport
program.
4.2 Other local programs for which the person is eligible but for
which that program is unable to provide the service (e.g. through
high demand for that service).
The two-year pilot project is being operated under the auspices of the Warrnambool based
Horizon 21. 3 ConnectU commenced in August 2012, with the first passenger being
transported on 11 September 2012.
THIS EVALUATION
This research monograph presents the findings of a study into the ConnectU pilot project.
The research has been undertaken by a team of researchers from Deakin University and the
Monash Sustainability Institute, Monash University. The study evaluates the ConnectU pilot
project.
The research project was established under the auspices of Horizon 21, with funding
primarily provided by the Bus Industry Confederation, Bus Association Victoria Inc, and
3 Horizon 21 was established in 2011 as ‘an innovative partnership, uniting industry via the common desire to
establish integrated and innovative approaches to create a sustainable future for regional communities’
(Horizon 21, 2011). Foundation members were Wannon Water, Midfield Meats, Warrnambool Bus Lines
Pty Ltd, Urbanomics, Warrnambool City Council, Deakin University, South West TAFE and Warrnambool
Cheese and Butter (Horizon 21, 2011).

16
Warrnambool Bus Lines Pty Ltd.4 The bus industry funded the project as part of its interest in
broader transport objectives and to better understand desired outcomes and possible solutions
to unmet accessibility needs in the sector.
4 Warrnambool Bus Lines Pty Ltd operates its urban bus operation under the business name Transit South
West.

17
3. RESEARCH METHOD
RESEARCH AIMS
This research monograph presents the findings of a study into the ConnectU pilot project.
The aim of the research study is to assess and document the outcomes of the pilot transport
scheme, particularly in terms of costs and benefits and the impact on social inclusion,
wellbeing and equity.
The research investigates the extent to which the ConnectU pilot has resulted in a better
integration of existing regional mobility opportunities to improve transport opportunities
where people had limited means of travel before. It also examines if additional benefits arise
from the project, such as increases in social capital and sense of community, a reduction in
social isolation and improvements in wellbeing. The research particularly examines the extent
to which better use is made of existing transport resources, resulting in more efficient and
effective transport services, and the extent to which more transport opportunities are being
provided to those who have low mobility.
The general research questions addressed by the study are:
1. To what extent does the ConnectU transport hub contribute to an increase in the number
of trips being undertaken by transport disadvantaged community transport users, and
what is the economic and social value of those additional trips?
2. What advantages and disadvantages do transport disadvantaged community transport
users perceive arise from the ConnectU pilot in terms of improved transport options,
reduced perceptions of social disadvantage and exclusion, and improved feelings of
wellbeing and equity?
3. What advantages and disadvantages do community service providers involved in, or
reliant on, community and public transport options consider to arise from the ConnectU
pilot project?
4. Do the operators of ConnectU consider that net benefits arise from the pilot project?
What advantages and disadvantages arise from the social enterprise model employed? Is
there potential for ‘add-on’ value, such as support for travellers and community
volunteers and further training options?
5. To what extent has the pilot project resulted in the identification of potential
improvements in the provision of community and public transport services, especially
from the viewpoint of transport disadvantaged groups? What is the nature of these
improvements and how can they be categorised?
6. Based on the ConnectU pilot, can any improvements be identified in the manner in
which a social enterprise aimed at improving community transport provision could be
administered and operated?
RESEARCH ETHICS
The research project, including research questionnaires used, were approved by the Deakin
University Research Ethics Committee.

18
RESEARCH METHOD
The research project applies well-established transport research methods and models to
evaluate the net economic and social benefits arising from the ConnectU pilot project. The
research approach adopted comprised the following major components:
1. Pilot study: The first 12 months of ConnectU’s operation.
2. Data collection: ConnectU services delivered.
3. Semi-structured interviews: ConnectU passengers.
4. Semi-structured interviews: Community organisations/agencies.
5. Cost-benefit analysis.
Each of these five components of the study’s research method are explained below.
PILOT STUDY: THE FIRST 12 MONTHS OF CONNECTU’S OPERATION
An initial pilot study was undertaken to examine the establishment and development of
ConnectU over its first 12 months of operation to the end of September 2013. Results were
published in an interim research report titled Establishment and development of ConnectU:
The first 12 months (Wines et al., 2014).
DATA COLLECTION: CONNECTU SERVICES DELIVERED
The database collated by the administrators of ConnectU was used to extract quantitative data
relating to the services delivered by ConnectU since its inception and up until the end of
August 2014. The database contains, for each trip, details relating to the date of travel, the
passenger, the volunteer driver, and details relating to the trip such as destination, the time the
passenger was to be collected from their home, any appointment time and the cost of the trip.
In addition, technical details such as vehicle odometer reading and vehicle registration were
recorded. Any special needs of the passenger were also recorded for the driver’s information.
For purposes of this report, the major data extracted from the database related to the number
of trips undertaken in transporting ConnectU passengers, passenger gender and location, the
purpose of each trip, and the number of trips undertaken by each driver. The anonymity of
passengers was maintained throughout the collection of data.
SEMI-STRUCTURED INTERVIEWS: CONNECTU PASSENGERS
Building on the 14 interviews conducted as part of the pilot study for this research, semi-
structured interviews with a sample of 25 ConnectU passengers were conducted between
February and July 2014. Findings are presented in this monograph for all 39 interviewees
where there is consistency in questions between the pilot and final interviews.
SEMI-STRUCTURED INTERVIEWS: COMMUNITY AGENCIES
A survey and semi-structured interviews with a sample of community agencies in the
Warrnambool and district region were conducted between May and August 2014. The
agencies selected were either agencies whose clients utilised ConnectU’s transport services or
agencies who had clients who could potentially benefit from the ConnectU service.

19
Twelve agencies were interviewed for this component of the research.5
COST-BENEFIT ANALYSIS
Cost-benefit analysis is a method of organising information to aid decisions about the
allocation of resources and about the efficiency and value to society of policy alternatives
(Department of Finance, 2006). Costs and benefits are valued in terms of the claims they
make on, and the gains they provide to, the community as a whole, so the perspective is in
terms of society in general rather than that of a particular individual or interest group
(Department of Finance, 2006). The analysis assists decision-makers in determining whether
a project, program or enterprise should be undertaken or continued. In particular, the analysis
aims to show whether, and to what extent, the benefits of a particular project or enterprise
exceed their costs.
Costs and benefits, to the extent possible, are expressed in monetary terms, thereby enabling
the comparison of outcomes. However, it must be recognised that the estimation of costs and
benefits in monetary terms is not without challenges. For example, it is difficult to estimate
the dollar value of the benefit an individual obtains from a program that adds to their
wellbeing, or of the value a volunteer gains from the knowledge that they have helped
someone in need.
The cost-benefit analysis conducted pursuant to this research report seeks to quantify the
costs involved in, and the benefits arising from, the operation of the ConnectU social
enterprise. While some of the costs of running an operation such as that of ConnectU are
readily calculable, others require various assumptions to be made. Likewise, many of the
benefits arising from ConnectU’s services require assumptions to be made to derive a
monetary value. For example, various assumptions are required in calculating the value of the
extent to which ConnectU allows passengers using the service to be more socially connected
within their community. A valid cost-benefit analysis requires the various assumptions made
to be stated and justified, if possible by reference to prior literature. Hence, the cost-benefit
analysis of ConnectU provides quantitative analysis to the extent possible, but the limitations
of the analysis are also discussed.
5 Due to research ethics considerations relating to confidentiality and anonymity of responses, the 12 agencies
are not identified in this monograph.

20
4. RESEARCH FINDINGS Research findings are presented under the following headings:
4.1 ConnectU services delivered;
4.2 Passenger interviews;
4.3 Agency information; and
4.4 Cost-benefit analysis
CONNECTU SERVICES DELIVERED
This section provides an overview of the services delivered by ConnectU in the period
October 2012 to the end of August 2014.6
CONNECTU TRIPS DELIVERED
Table 4.1 illustrates the breakdown of trips undertaken each month from October 2012 until
August 2014. The total number of one-way trips undertaken by ConnectU clients/passengers
over this period was 3,387.7
6 The authors thank the ConnectU staff, clients and volunteers for assistance in compiling this information.
Information indicates that ConnectU took its first client on 11 September 2012. While a small number of
trips were provided in the month of September 2012, this report is based on trips for which more detailed
information was collected, commencing from the month of October 2012. 7 Trips were recorded as the number of one-way trips. Hence, if a ConnectU client was transported to an
appointment and then home again, that return trip comprises two one-way trips.

21
Table 4.1 Number of trips undertaken by ConnectU by month
Month Number of one-
way trips per
month
2012 October 26
November 46
December 16
2013 January 32
February 54
March 58
April 80
May 94
June 74
July 75
August 84
September 87
October 91
November 121
December 115
2014 January 138
February 225
March 292
April 302
May 339
June 319
July 359
August 360
Total: 3,387
The trend line of passenger growth, from 26 one-way trips in October 2012 to 359 in July
2014, is shown in Figure 4.1 on the following page. The figure indicates a trend increase
averaging 17.5 per cent per month.

22
Figure 4.1 Trend growth in ConnectU one-way trips
As shown in Table 4.1 and Figure 4.1, the number of trips undertaken by ConnectU in
delivering its transport service has been steadily rising over the period since its inception,
with a dramatic increase from January 2014. Demand was low in the period from
commencement in October 2012 until January 2013, reflecting the start-up period and the
December holiday period. Demand for ConnectU trips then increased steadily from January
2013 until January 2014, indicative of ConnectU becoming established in the community.
The number of trips undertaken by ConnectU then increased dramatically from January 2014,
from 138 trips per month to 360 trips for August 2014, the latest month for which figures are
presented.
This trend can be elaborated on by calculating the average number of trips per month for
specific sub-periods, as shown in Table 4.2.
Table 4.2 Average number of trips per month by sub-period
Period Average number
of trips per month
October 2012 to March 2013 (6 months) 38.7
April to September 2013 (6 months) 82.3
October 2013 to March 2014 (6 months) 163.7
April to August 2014 (5 months) 335.8
For the six month period from commencement of the service until March 2013, ConnectU
delivered an average of 38.7 trips per month. This then more than doubled to an average of
82.3 trips per month for the six month period April to September 2013. There was again a
doubling to an average of 163.7 trips per month for the six month period October 2013 to
March 2014. In the final five month sub-period April to August 2014, the average number of
Month: from October 2012 (1) to July 2014 (22)

23
ConnectU trips per month was 335.8, again representing a doubling over the previous six
month period. This again emphasises the rapid growth in services delivered by ConnectU in
the period since its establishment.
The period in which the most rapid growth occurred in the number of trips delivered by
ConnectU was the three month period January to March 2014. From 138 trips for the month
of January 2014, 292 trips were undertaken in March 2014. Hence, over this period of only
three months, there was a 111.6 per cent increase in the number of trips undertaken. This
increase is in the context that little marketing is done about the service, for fear of being over-
whelmed with passengers (Hampson, personal communication). Indeed, in recent times, the
service has been unable to provide some of the longer trips due to service demand.
The total distance travelled in delivering ConnectU services to passengers over the period
October 2012 to the end of August 2014 was 39,593 kilometres. Over 90 per cent of the trips
involved Warrnambool passengers, with the Moyne service (Port Fairy) being offered since
2014.
Individual trip lengths varied. Figure 4.2 illustrates the variations in length for the six month
period February to end July 2014. While fewer trips were undertaken commencing in the
Shire of Moyne, individual trips from Moyne tended to be longer than those commencing
with Warrnambool. Figure 4.2 does not include 15 long distance trips (over 100 kilometres)
which were taken over this time. Most of these longer trips were under 200 kilometres, with
one being 520 kilometres.
Figure 4.2 Distance of trips for Warrnambool and Moyne from Feb to end July 2014
The varying distance between Warrnambool and Moyne is reflected in passenger charges. A
flat rate of $12 is currently charged for a trip around Warrnambool and $15 for a trip around
Moyne. This charge is reduced or waived where the passenger cannot afford that amount.
CONNECTU PASSENGERS
ConnectU has catered for the needs of 165 passengers, 75 per cent of whom are females.

24
The passengers are predominantly in the older age groups. Figure 4.3 below shows the age
distribution of passengers. The figure shows the prominence of passengers aged between 70
and 89. ConnectU does not presently have the facility to manage wheelchairs.
Figure 4.3 Age distribution of passengers who use ConnectU (N=141)8
The number of journeys undertaken by any one individual passenger varied greatly, as
summarised in Table 4.3 below. The table shows the number of journeys from the
passenger’s perspective. In the majority of cases, a journey will be a return one; for example,
involving a pick up from home to attend an appointment and then a return trip home. In some
cases, though, the journey will have involved a one-way trip only.
As shown in Table 4.3, the largest group of passengers had made one journey only in the
period from ConnectU’s inception until the end of August 2014 (58 passengers, or 35.2 per
cent). Forty-five passengers (27.3 per cent) had made between two and five journeys, while
34 (20.6 per cent) had undertaken between six and 19 journeys. Twenty-two passengers (13.3
per cent) had made between 20 and 49 journeys. Six of the 165 passengers (3.6 per cent) had
undertaken 50 or more journeys. The maximum number of journeys undertaken by an
individual passenger was 89.
8 Of the 165 clients, information on age was not known for 24 passengers. Hence, Figure 4.3 is based on the
age profile of the 141 passengers for which this information is known.

25
Table 4.3 Frequency distribution of passenger journeys
Number
of journeys
Frequency %
1 58 35.2
2 18 10.9
3 to 5 27 16.4
6 to 9 23 14.0
10 to 14 7 4.2
15 to 19 4 2.4
20 to 29 11 6.7
30 to 39 8 4.8
40 to 49 3 1.8
50 to 59 4 2.4
≥ 60 2 1.2
165 100.0
To more clearly present the frequency distribution of passenger journeys, Figure 4.4 shows
the frequency distribution in the form of a bar chart. It clearly shows that the majority of
passengers accessing ConnectU tend to use the service for a smaller number of journeys. That
is, the service has not become one servicing a small number of passengers making a large
number of multiple journeys. In fact, 126 of the 165 passengers, or slightly over three-
quarters of ConnectU’s passengers, had undertaken a maximum of nine journeys only over
the period October 2012 to the end of August 2014.
Figure 4.4 Frequency distribution of passenger journeys
PURPOSE OF TRIPS WITH CONNECTU
Table 4.4 and Figure 4.5 provide statistics on the major purpose of ConnectU trips. The table
and figure indicates that the main purpose for trips undertaken by ConnectU passengers was

26
to attend medical appointments, accounting for almost 70 per cent of trips.9 Other major
purposes for trips were for shopping, bills and banking etc (11.3 per cent), church, cards, arts
and crafts, bingo etc (7.2 per cent), childcare, swimming, school pick up etc (5.3 per cent)
and TAFE attendance (4 per cent).
It is readily evident that by far the predominant purpose for passenger trips is medically
related. This in part may reflect the hours that the ConnectU service is offered, judgments
about the priority of transport needs and the difficulties in transport around medical services
in Warrnambool. It also reflects the form of service offered, with a door to door service with
supportive assistance being provided by ConnectU.
Table 4.4 Major purpose for trips
Major purpose of trip Number of
trips %
Medical – Doctor, Physio, Dentist etc 2,347 69.3%
Shopping, Bills, Banking etc 383 11.3%
Church, Cards, Arts & Craft, Bingo etc 244 7.2%
Childcare, Swimming, School pick up etc 180 5.3%
TAFE 135 4.0%
Hairdresser 48 1.4%
Family related – Visiting Hospital, Nursing home etc 30 0.9%
Out of town trips - Geelong, Melbourne etc 20 0.6%
Total: 3,387 100.0%
Figure 4.5 Major trip purpose pie chart
9 Medical appointments cover appointments at a doctor, dentist, optometrist, podiatrist, audiologist, as well as
for physiotherapy, hydrotherapy and transporting a patient from hospital to home.
27
ConnectU seeks, in most part, to meets all the travel needs of each passenger until the need
has gone. This could be due to the medical issue being resolved or the person being able to
obtain other forms of mobility, such as using a community or family member, public
transport or taxi. There are a small group of largely aged or people with a disability who are
dependent on ConnectU on a longer term basis as there is no other way of meeting their basic
needs, such as shopping.
METHOD OF OPERATION OF CONNECTU
Where they are able to meet the need, ConnectU accepts referrals of people needing transport
from agencies. Referrals from a passenger or other members of the public are assessed for
need by the Operations Manager. Sources of referrals include Discharge at South West
Healthcare, St John of God Hospital, Moyne Health Services, Port Fairy Medical Clinic, local
Warrnambool medical clinics, Home and Community Care (HACC) carers, Archie Graham
Centre, Brophy and family members. Where possible, individuals are directed to other
transport arrangements. This may mean, for example, that the person is offered assistance in
learning about how to use public transport. However, in many of the smaller towns around
Warrnambool, there is neither a local public transport service nor a taxi service, and the
passenger may have no family nearby.
ConnectU utilises volunteers as drivers, supplemented as needed by the two ConnectU staff.
Twenty-four volunteers are registered; 13 in Warrnambool and 11 in Moyne. The volunteers
are initially assessed by the Operations Manager, undergo police checks, and are insured
through the Warrnambool City Council and Moyne Shire Council volunteer schemes. The
volunteers are well informed about their passenger prior to any trip. Warrnambool volunteers
have worked a total of 1,803 hours and Moyne volunteers a total of 127 hours. Further
information about the volunteers can be found in the Pilot Study report.
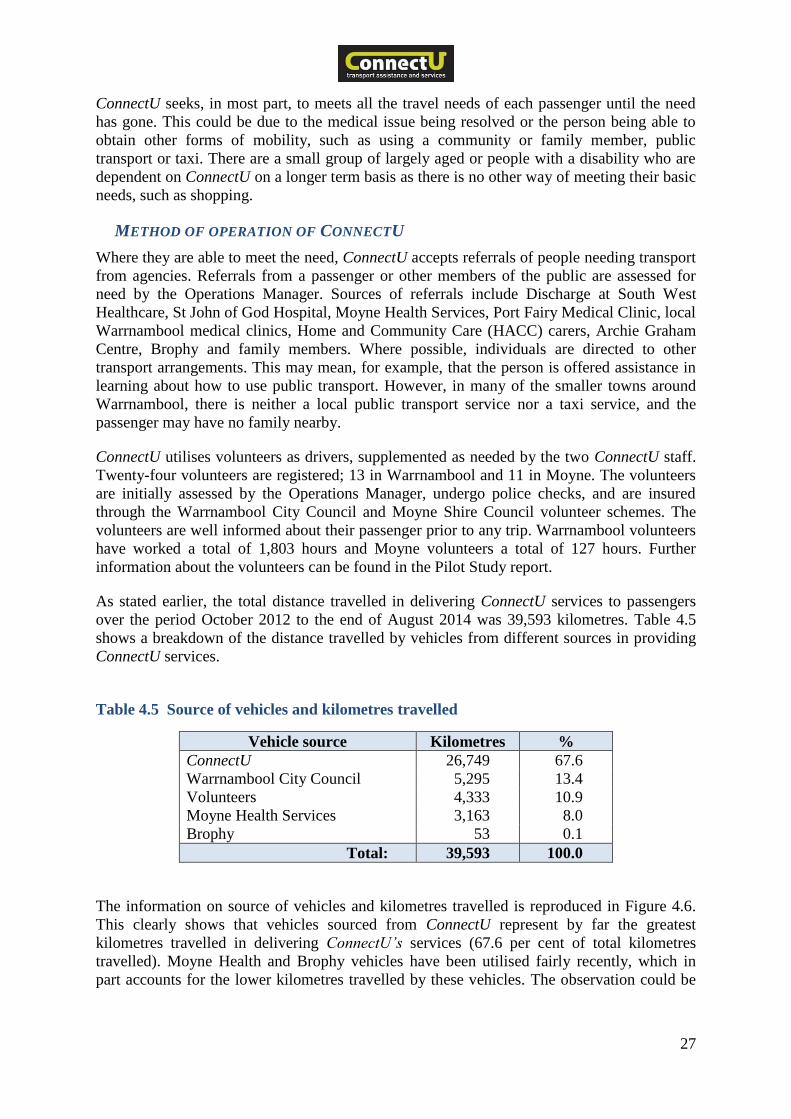
As stated earlier, the total distance travelled in delivering ConnectU services to passengers
over the period October 2012 to the end of August 2014 was 39,593 kilometres. Table 4.5
shows a breakdown of the distance travelled by vehicles from different sources in providing
ConnectU services.
Table 4.5 Source of vehicles and kilometres travelled
Vehicle source Kilometres %
ConnectU 26,749 67.6
Warrnambool City Council 5,295 13.4
Volunteers 4,333 10.9
Moyne Health Services 3,163 8.0
Brophy 53 0.1
Total: 39,593 100.0
The information on source of vehicles and kilometres travelled is reproduced in Figure 4.6.
This clearly shows that vehicles sourced from ConnectU represent by far the greatest
kilometres travelled in delivering ConnectU’s services (67.6 per cent of total kilometres
travelled). Moyne Health and Brophy vehicles have been utilised fairly recently, which in
part accounts for the lower kilometres travelled by these vehicles. The observation could be

28
made that there is considerable scope for the utilisation of vehicles other than ConnectU
vehicles in the delivery of services for passengers.
Figure 4.6 Source of vehicles and kilometres travelled
ConnectU passenger support
In many situations, the passenger requires the services of ConnectU because of the extra
support provided in addition to transport. Examples of the need for extra assistance are frailty
or recent surgery, the person having a walking aide or using an oxygen supply, the person
having poor vision, profound deafness or mild dementia, a change of bus route, or the
individual’s usual driver being away at the time. Notes about clients are kept for ConnectU
drivers that document necessary information, such as ‘requires the holding of an arm when
walking’, ‘needs assistance in and out of the vehicle’, ‘needs to be collected from the waiting
room’ and ‘needs help with seat belt’, etc. Some de-identified examples of this are given:
Referred by a friend from a social group and hairdresser. Person has a chronic
disease and can be unsteady on her feet so uses a walking support. She had previously
used taxis but found that she now needs more assistance.
Referred from ConnectU staff. She has no taxi card and is unable to use a bus. She
has been a car driver but now has reduced eyesight and sometimes uses a walking
stick.
Referred by an agency, does not have a taxi card and not able to use a bus. Has a
walker, has had falls and needs assistance in and out of the car and needs to be taken
into appointments. Needs to sit in the front seat of the car.
Referred by the district nurse. Friends and relatives have assisted with transport in
the past but not able to help at present. Doesn’t have a taxi card and unable to use a
bus as he has an oxygen tank.
Has no family living nearby. Has anxiety attacks and taxi drivers do not assist.

29
PASSENGER INTERVIEWS
The findings from the semi-structured interviews with ConnectU passengers are presented in
the following sections. As noted in section 3.3.3, 39 passengers were interviewed for
purposes of the research, 14 of whom were part of the pilot study.
DESCRIPTION OF INTERVIEWED SERVICE USERS
Thirty females and nine males were interviewed. The following information relates to those
in the second group of interviews (N=25). All except two people were born in Australia.
While the age of those interviewed varied from 34 to 93, most were seniors, the most
common age being in the 70s. Most people lived by themselves (76 per cent), with the
remaining living with another adult in the household. While five people said there was a
licenced driver in the household, in three households the passenger reported having been a
driver but was now unable to drive. In the other two households, no licenced driver appeared
available.
Most commonly, those interviewed had completed some secondary school (Table 4.6). Most
were retired (14 people), four people were unable to work due to disability or illness, three
people were employed (one full time and two part time), two were in education and two did
voluntary work (in addition to retirement). In relation to pensions/benefits received, slightly
over one-half of the interviewees (13 of the 25) were on the aged pension. Almost one-
quarter (six) were on the disability pension, and one each were on the Newstart allowance
and the Veterans Affairs pension. Four interviewees were not on government benefits.
Table 4.6 Interviewees’ level of education, occupation status and source of income
(N=25)
Highest level of education
Finished primary school 1 4.0
Some secondary schooling 11 44.0
Finished secondary school 5 20.0
Post-school certificate or diploma 5 20.0
Completed university 3 12.0
25 100.0
Occupation status
Employed full time 1 4.0
Employed part time 2 8.0
Unemployed due to disability/handicap/illness/injury 4 16.0
Retired 14 56.0
Study (school/TAFE/university) 2 8.0
Working in an unpaid voluntary job 2 8.0
25 100.0
Pensions/benefits
Newstart allowance 1 4.0
Aged pension 13 52.0
Disability pension 6 24.0
Veteran affairs pension 1 4.0
None 4 16.0
25 100.0

30
USE OF CONNECTU
Interviewees were asked to indicate the various reasons underlying their use of the transport
services of ConnectU. Their respondses were not limited to identifying only one reason for
using ConnectU, as multiple factors are often present given the types of passengers accessing
ConnectU’s services. The reasons for passengers using the ConnectU service are shown in
Table 4.7 and Figure 4.7
Table 4.7 Reasons for using ConnectU (N=39) (multiple responses allowed)
Reason Number % who said this
Age, disability or health prevents driving or use of
public or own transport
38
97.4
Lack of public transport 23 60.0
Lack of person to give a lift 22 56.4
Taxis often late 1 2.6
Loss of drivers licence 1 2.6
Figure 4.7 Reasons for using ConnectU (N=39, multiple responses allowed)
All but one passenger stated that a predominant reason for using the services of ConnectU
was due to issues of age, disability or health preventing the person being able to drive them
self or use public. The ConnectU passenger not citing this as a predominant reasons had lost
his/her driver’s licence.
Sixty per cent of interviewees (23 of the 39 respondents) also cited a lack of public transport
as a reason for accessing ConnectU. The ConnectU Operations Manager reports that
ConnectU has obtained 50 new passengers since PTV’s changes to the local bus routes on 28
January 2014. For example, the change in the public transport bus route has meant that the

31
stop is now too far away for an elderly man with a stick to access the service. He now uses
the ConnectU service. Again, two clients with disabilities attended work at a local agency,
however the new route bus timetable doesn’t match with working hours. The taxi costs one
person $35 a day now, and the second person is not attending work. ConnectU offered
assistance with travel. The other major reason for using ConnectU, indicated by 22
interviewees (56.4 per cent), was due to the lack of any other person being available to give
them a lift.
Interviewees were asked how they would have made the relevant ConnectU trip if the service
had not been available. While most said they would have made the trip (33), three people said
they would not have made it and two were unsure. However, it is uncertain as to whether
many of these people would indeed have made the trip, although the medical nature of many
of the trip purposes perhaps reduced the optional nature of the trip. Ten people said they
would take a taxi instead. Fourteen people suggested they might take a taxi but had expressed
doubts about this, particularly in relation to issues of cost, a lack of helpfulness and the long
wait generally involved.
Ten interviewees suggested that they would ask a friend to drive them. However, half of
these had said they used ConnectU as they didn’t have someone to drive them. Two
interviewees indicated they would drive themself (one would need to borrow a car), two
might ask an agency to take them, one might walk and one suggested public transport.
Only one respondent cited public transport as a possible alternate means of transport had
ConnectU not been available. This response can be considered in the light of the findings
summarised in Table 4.7, where age, disability or health reasons were indicated as major
reasons preventing the passenger driving or using public. Over one-half the interviewees (59
per cent) had already expressed the view that public transport was not available. This
reinforces the finding that ConnectU passengers clearly had mobility problems.
OPINIONS ABOUT THE CONNECTU SERVICE
Passenger interviewees were asked a number of questions seeking their evaluation of the
ConnectU service.
In response to a question asking interviewees for their opinion on how easy or difficult the
ConnectU service was to use, no passenger indicated any difficulty in using the service. All
39 interviewees said that the service was easy or very easy to use. Of these, 31 respondents
(79.5 per cent) indicated the ConnectU service was very easy to use.
Interviewees were asked for their opinion on how helpful they found the ConnectU staff. All
interviewees indicated they found the ConnectU staff to be helpful or very helpful. Of these,
almost eighty per cent of respondents indicated that ConnectU staff were very helpful.
Interviewees were asked a question seeking their opinion on how friendly and helpful
ConnectU drivers were. Interviewees clearly found ConnectU drivers to be friendly and
helpful, with all respondents indicating this to be the case.
All interviewees, in response to a question asking for their opinion on how valuable the
ConnectU service was, indicated they found the ConnectU service to be of value to them.
One interviewee (2.6 percent) indicated the service to be of some value, while the vast
majority (37 of the 38 responding to this question, or 97.4 per cent) considered the service to
be of great value.

32
Responses to a question asking for passengers to indicate an overall rating for the service
provided by ConnectU are presented in Table 4.8. No passenger indicated an adverse overall
rating of the ConnectU service. All respondents considered the service provided by ConnectU
to be good or excellent, with the vast majority (34 or 87.2 per cent) considering the service to
be excellent.
Table 4.8 Overall rating of ConnectU service
Passengers rating of the service provided
by ConnectU
Number %
Very poor 0 0.0
Poor 0 0.0
Neutral 0 0.0
Good 5 12.8
Excellent 34 87.2
39 100.0
The following represents a summary, in dot point form, of the positive comments about the
ConnectU service made by passenger interviewees:
allows passenger some independence,
allows passenger to achieve goals (work, appointments),
increased awareness (more aware of difficulties many individuals face),
valuable service, particularly for those who can’t afford a taxi,
good company,
the support available makes Warrnambool a good place to live,
meet people,
reliable, punctual, dependable (taxis not always),
friendliness of the people (drivers and staff) increases sense of community and
association with other people,
increases confidence, decreases reliance on others,
accommodating,
drivers also become friends,
feelings about community changed knowing the service is provided and drivers going
out of their way to assist,
well organised staff and drivers creates confidence of passengers in the system,
convenient, helpful,
obliging drivers, able to cope with all sorts of people,
caring and supportive drivers and staff, sensitive to needs,
drivers offer passenger reassurance and hope for future (chronic disease sufferer),
would be housebound without ConnectU, can get out more and see people,
ConnectU creates more positive feelings – service there if want to get out,

33
less stressful getting to appointments,
opens opportunities not previously available (being able to get around). More options
available, not as isolated, more connected,
meet different people, all friendly,
service is open, welcoming, accommodating,
as passenger becomes less independent, ConnectU becomes more valuable,
system gives a good sense of community in that it involves people helping others.
Need more of this type of assistance in the community,
ConnectU creates an extended family.
Some examples of the extended comments made by passenger interviewees are reproduced
below:
When the actual drivers come they’re very prompt, they’re very rarely a minute
behind, if anything they’re here early. They are very punctual and very helpful to get
you into the car, their care is wonderful, their driving is excellent … They help you
onto the street, they will set you on the street before they leave the parking spot, they
make sure that I’m up and about. And then, when they come and pick me up it’s the
same thing; they help you to pick up groceries and taking me to the car and seeing
that I’m installed well … I can’t really praise them enough. (Passenger interviewee
2)
They’re so obliging and so willing to work with you (Passenger interviewee 3)
Well the staff in the office are marvellous too. I mean I’ve only spoken to them on the
phone of course but I’ve never had any- but helpful. They’ve always been helpful.
(Passenger interviewee 4)
When I first had the accident … I felt a great pressure put on me when I came home,
when I was coming home from hospital. I felt really that I'd never cope at home … So
having ConnectU has made a tremendous difference to me. (Passenger interviewee
5)
They (drivers) make sure that everything is right with you, they make sure that you’re
– like sometimes I’ve got that great big bag there and they’ll help me to pull it in, and
open up the door. (Passenger interviewee 6)
The drivers are quite happy to stop and do little errands on the way if you need to.
(Passenger interviewee 8)
Yes. I definitely think this is a very helpful service we should continue in the
community. (Passenger interviewee 10)
I think I've said what I needed to say in regards to how helpful they’ve been, and as I
said courteous and good timekeepers. It certainly opens up an area for me that
presently – previously – wasn’t available... (Passenger interviewee 18)
Whoever picked the staff knew what they were doing because they’re brilliant.
(Passenger interviewee 19)

34
Well they help me into the car, fold up the walker, help me go up to dialysis with me
because it’s quite a walk. (Passenger interviewee 21)
And I was on crutches. And they’d help you put your bags in the car because I had a
bag to go up there because I was doing physio and they were … oh, it (the service)
was fantastic. (Passenger interviewee 22)
In summary, respondents to the passenger interview were exceedingly positive in their
assessment of the ConnectU service.
OTHER ISSUES
The passenger interviews canvassed some further issues related to the ConnectU service.
Interviewees were asked questions relating to a) whether they would like the service to be
provided in the evening and/or on weekends and b) the sharing of trips.
In response to a question asking passengers whether they would like the opportunity to use
the service to travel in the evening and/or on weekends, most interviewees answered in the
negative (see Table 4.9). Twenty-four interviewees (61.5 per cent), indicated they did not
need to use the service to travel in the evening or on the weekend. One interviewee was
unsure. Fourteen of the 39 (35.9 per cent) indicated that they would like the opportunity to
travel in the evening and/or on weekends.
This result is generally consistent with the predominant type of current passenger and the
purpose for which ConnectU trips are made. Statistics presented earlier indicate that trips for
which ConnectU is utilised are predominantly for medical reasons. These medical
appointments would generally be during the day during office hours, hence not requiring
evening or weekend travel.
Table 4.9 Evening and weekend travel
Would passengers like the opportunity to
travel in the evening and/or weekends?
Number %
Yes 14 35.9
No 24 61.5
Unsure 1 2.6
39 100.0
Interviewees were asked two questions relating to the sharing of trips. The first of these
questions asked whether the passenger had, in past travel with ConnectU, shared a trip with
another ConnectU passenger. The second asked whether the passenger would be prepared to
share a trip with another passenger.
Twenty interviewees, or approximately half, had shared trips with another passenger in the
past (see Table 4.10). Nineteen interviewees had not undertaken trips in which there was
shared travel.

35
Table 4.10 Sharing of trips with other passengers
Had passengers shared trips with another
passenger?
Number %
Yes 20 51.3
No 19 48.7
39 100.0
In response to the question asking interviewees whether they would be prepared to share
trips, Table 4.11 shows that the vast majority (38 of the 39) would be prepared to share a trip.
Only one interviewee indicated they would not be prepared to share a trip.
Table 4.11 Willingness to share trips
Would passengers be prepared to share a
trip with another passenger?
Number %
Yes 38 97.4
No 1 2.6
39 100.0
This represents a positive message, in that passengers are clearly receptive to the idea of
sharing trips. It confirms the ConnectU strategy of coordinating passenger trips where
possible. It also suggests a strategy of coordinating trips with other agencies and their
passengers where possible.
CHANGES IN CONNECTION WITH THE COMMUNITY AND WELLBEING
The findings outlined earlier show that ConnectU is offering a welcome service for people
with transport needs. Provision of transport has enabled them to realise their end purpose,
whether it is around health, shopping or recreation. As discussed early in this report, transport
also offers other benefits as it connects people with others and the community, thus
improving social inclusion and wellbeing. This research explored whether ConnectU was
able to improve people’s view of their community and their personal wellbeing.
Connection with the Community
Connection with the community was measured using the short version of the Sense of
Community Scale (McMillan & Chavis 1986). The scale has been found to be reliable and
valid across a range of communities, adults and youth and across different countries and
cultures (Tartaglia 2006). It has been used with communities based on both place and interest
or relational network (Long & Perkins 2007). It has also been found to be quite sensitive to
detecting differences in connections to community (Chipuer & Pretty 1999).
The Sense of Community Scale measures broad concepts in relation to community:
membership, influence, integration, fulfillment of needs, and shared emotional connection.
Interviewees were asked to give their response on a seven point scale, from ‘Strongly
Disagree’ to ‘Strongly Agree’. The higher the score achieved, the greater the connection with
the community.

36
While detailed analysis of the findings would not be valid with a sample of 25 people, some
trends can be noted. The group interviewed generated an average score of 5.16 with a
possible range from 1 to 7. Thus, they feel somewhat connected to the community, but there
is room for improvement.
When asked as to whether their feelings about the community had changed since their contact
with ConnectU, nine of the 25 respondents (36 per cent) said that their feelings about the
community had improved. Some examples of comments are:
Yeah. When I say the community, I honestly believe Warrnambool’s the best place I
ever lived in as far as support and stuff like that and it’s due to these people, like the
carers that came and helped and ConnectU and everything like that, so. Yeah, oh it’s,
yeah. (Passenger interviewee 3)
Just, well at times especially at my age, you often think back over things and that.
There’s some people that you feel don't really want to be friendly you know. Then
yes, I think since I've been involved with ConnectU, that I feel differently that possibly
there’s a lot of people that would like to be friendly. (Passenger interviewee 5)
Yes because not having known about them and now knowing what they do and go out
of their way to do. (Passenger interviewee 7)
It’s changed, and given me more freedom. (Passenger interviewee 18)
Oh, well I’ve met more people with them (ConnectU), so I suppose I’ve got more
social relationships. (Passenger interviewee 21)
Thus, it would appear that the ConnectU service is providing a broader function than
enabling people to realise a needed service or activity.
Wellbeing
The impact of ConnectU on the wellbeing of interviewees was measured using questions
based on (but not identical to) the Flourishing Scale (Diener et al. 2010). This instrument
draws on recent theories of psychological and social wellbeing. The questions addressed the
essential components found to be important to wellbeing, such as having the support of
others, supporting others, being optimistic about the future, and being engaged and interested
in meaningful activities. The interviewees are asked to make their own judgement as to how
they rate on the separate items.
Interviewees were asked, as a result of using ConnectU, to what extent do they feel:
a You are leading a purposeful and meaningful life
b Your social relationships are supportive and rewarding
c You are engaged and interested in your daily activities
d You actively contribute to the happiness and wellbeing of others
e You are competent and capable in the activities that are important to you
f You are optimistic about your future
g You are social engaged
The interviewees were asked ‘as a result of using ConnectU, to what extent do you feel’ (the
conditions listed above), the choice being:

37
1. To a considerably less extent
2. To a slightly less extent
3. No change
4. To a slightly greater extent
5. To a considerably greater extent
Again, only broad indications can be taken from these findings. Figure 4.8 shows that, for
each item (a to g), there has been some average improvement in self-assessed wellbeing for
the respondent group since contact with ConnectU.
Figure 4.8 Improvement for the total group of interviewees in each item relating to
wellbeing since using ConnectU (N=25)
* Note: The scale ranged from 1 to 5 where 3 was ‘no change’
** Note: The letters relate to the conditions listed above.
Figure 4.8 shows the average change for each interviewee since using ConnectU. While there
was no change for many, there was improvement in wellbeing for 12 people (48 per cent of
interviewees). The greatest change was for the item that the person was leading a purposeful
and meaningful life, followed by the person believing that social relationships are supportive
and rewarding. Only one item diminished by one point for one person.
Figure 4.9 also depicts the average change for each interviewee since using ConnectU.
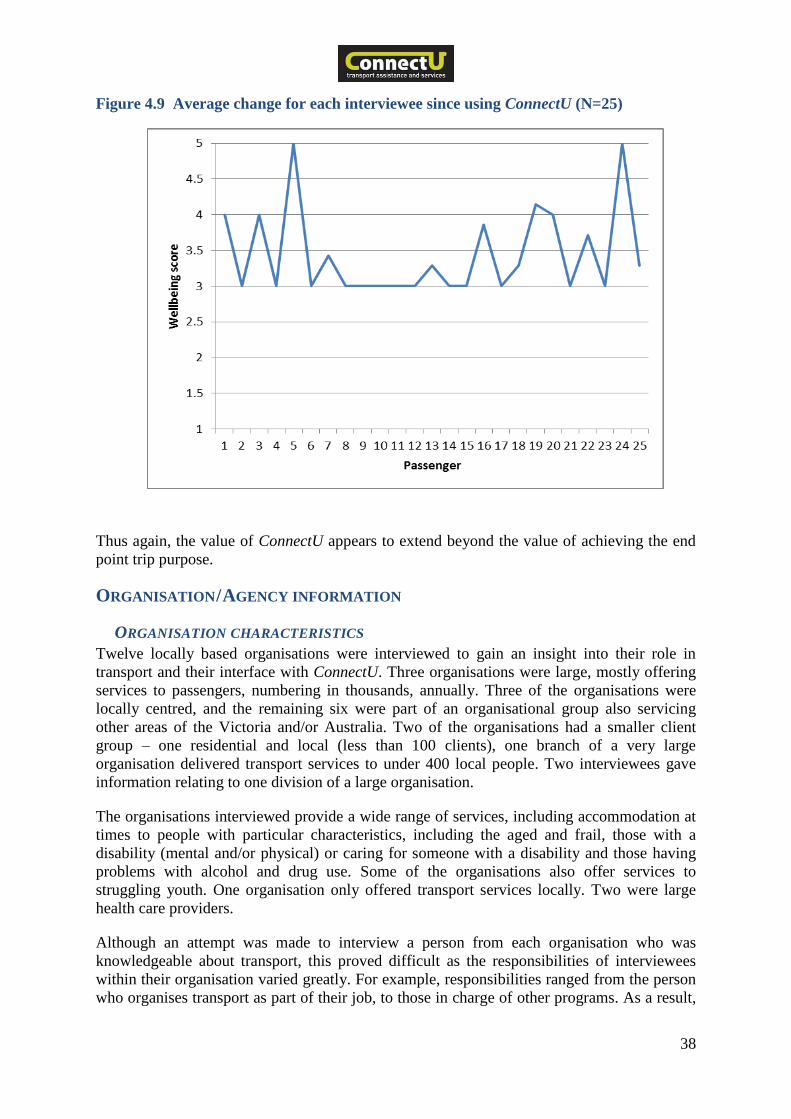
38
Figure 4.9 Average change for each interviewee since using ConnectU (N=25)
Thus again, the value of ConnectU appears to extend beyond the value of achieving the end
point trip purpose.
ORGANISATION / AGENCY INFORMATION
ORGANISATION CHARACTERISTICS
Twelve locally based organisations were interviewed to gain an insight into their role in
transport and their interface with ConnectU. Three organisations were large, mostly offering
services to passengers, numbering in thousands, annually. Three of the organisations were
locally centred, and the remaining six were part of an organisational group also servicing
other areas of the Victoria and/or Australia. Two of the organisations had a smaller client
group – one residential and local (less than 100 clients), one branch of a very large
organisation delivered transport services to under 400 local people. Two interviewees gave
information relating to one division of a large organisation.
The organisations interviewed provide a wide range of services, including accommodation at
times to people with particular characteristics, including the aged and frail, those with a
disability (mental and/or physical) or caring for someone with a disability and those having
problems with alcohol and drug use. Some of the organisations also offer services to
struggling youth. One organisation only offered transport services locally. Two were large
health care providers.
Although an attempt was made to interview a person from each organisation who was
knowledgeable about transport, this proved difficult as the responsibilities of interviewees
within their organisation varied greatly. For example, responsibilities ranged from the person
who organises transport as part of their job, to those in charge of other programs. As a result,

39
the interviewee’s knowledge about transport, both within and beyond the organisation, varied
widely.
TRANSPORT ROLE OF AGENCIES
Ownership of vehicles
All participating organisations had organisational vehicles. All had cars, said to be ranging in
number from one to 21, although quite a few interviewees were unsure about exact numbers.
The two organisations where the information related to a specific division did not have cars
in that division, although there were many cars in the organisation, which were borrowed by
staff at times, sometimes to transport or visit passengers. Six organisations were said to own
between one and three buses with a capacity of below 12 people and four organisations were
said to have one to three buses with a capacity of between 12 and 25 people. In total, nine of
the 12 organisations or divisions interviewed owned a mini bus. None of these organisations
or divisions owned a larger bus.
Three organisations occasionally used staff private vehicles to transport passengers. In five
organisations volunteers at times drive the agency vehicles. Four organisations make their
vehicles available to another organisation, three to ConnectU and one to the broader
organisation with which they are associated.
The source of financial support for organisational transport was not known by four of the
interviewees. Eight interviewees said the funding comes from agency or program funds, two
also mentioning donations. One respondent explained that block funding was provided by
government for programs, with an obligation to provide an agreed amount of activities. A
portion of this funding (but not necessarily identified separately) was for transport.
Five of the organisations had a specified person who handled transport, while another
organisation said this was handled at reception. Most organisations had the person who was
organising the activity also book the transport. Two interviewees said a staff member did
transport as a minor role in their job tasks. Two interviewees said their organisation had a
fleet manager who looked after the vehicles but did not get involved in bookings.
Use of vehicles
Most interviewees found it very difficult to provide information about how often the vehicles
were used for clients. One interviewee, talking about the organisation’s bus which carried 12
to 25 people, said it was used about 30 hours a week. Three (of six) interviewees who
answered regarding the use of the smaller mini bus, said usage was about 8 to 16 hours a
week, 17 to 30 hours a week and 30 hours a week. Six interviewees said their organisational
cars were used, four hours, eight hours (2), nine hours, 17 to 30 hours and 30 hours per week.
When asked about use of their vehicles at night, one respondent said their organisation used
them on many nights, one used them one night a week and one used them about once a
month. The remaining nine did not use their vehicles after working hours.
Eight of the 12 organisation interviewees said there was some use of vehicles over the
weekend. However, this was not a regular occurrence. The highest weekend use was in one
organisation where the interviewee said the vehicles were used eight to 20 hours, with the
second highest organisation using them for four to eight hours a weekend. One interviewee
felt that the vehicles were used for less than four hours a weekend, three said they were used
for less than four hours, one said it varied and the remaining four interviewees reported that
the organisation’s vehicles were not used over the weekend.

40
Passengers’ travel to access organisation’s services
One organisation has the sole function of providing transport. For the other eleven
organisations, by far the most common way for clients to travel to access their services is by
car, with four organisations having at least 80 per cent of their clients travelling this way
(Table 4.12). Eight of the 11 organisations had clients who used taxis, the heaviest users
being two medical organisations and an aged residential centre. The remaining organisations
were said to have around 5 per cent or less of their clients using taxis. One organisation was a
heavy user of taxis. The cost was covered by veteran affairs, the client, or the organisation
itself, with taxi voucher books available from the organisation.
One organisation had about one-quarter of their clients use public transport, a mode
particularly encouraged as it was viewed as part of gaining independence. Another
organisation reported that about 10 per cent of their clients used public transport, while four
others had a few clients who used public transport. A few clients walked or cycled to three
organisations.
Table 4.12 Mode of travel to ascertain services at the organisation (N=11)*
Travel Mode No. of
organisations
Private car 11
Taxis 8
Public transport 6
Cycle 3
Walk 3
Agency vehicle 8
ConnectU 4
Other organisation’s vehicle 0
Note: * One organisation only offered transport services.
Five organisations used ConnectU transport services for some of their clients. Three
organisations are building their use of ConnectU (two medical services and one aged care
service). Flyers are made available in their ward or specialised departments, such as
occupational therapy, or to the passengers directly.
No organisations indicated they use vehicles from other organisations, the exception being a
medical services organisation that always used an ambulance to transport clients to their
service when they came from a residential or aged care facility, ‘even if the person is mobile’.
They also used Red Cross vehicles to transport people to and from ‘essential medical
appointments’. Clients who were returned home after treatment were sometimes also referred
to a local support agency who offered patient care and at times needed transport due to their
medical condition.
Even if they didn’t provide organisational transport, all organisations said they offered their
clients assistance in relation to transport. Nine organisations said this assistance was offered
due to the client’s age, disability or health issues that prevented them driving or using public
transport. A lack of public transport was also identified by eight organisations. Six

41
organisations said the clients had no one to drive them and six said the cost of taxis was
beyond their clients’ means.
Five organisations said they were not always able to offer a transport arrangement for their
clients, and three noted that part of the reason was a lack of eligibility of their would-be
passengers. Five organisations did not have the capacity to meet all the transport needs, two
agencies reported that it was a characteristic of the client that prevented them providing
transport (for example, there was lifting involved or unsociable issues were present), while
one organisation had a problem in obtaining necessary support persons to accompany some
of their clients. The organisation that solely offered transport had difficulties in many of these
areas – eligibility, capacity, support persons and passenger features.
Where a transport service could not be provided, two organisations always tried to find
alternative transport arrangements, with three other organisations doing this some of the time.
Changing an appointment time was suggested to the client (always or sometimes) by five
organisations. Three organisations would at times use their personal car to transport a client.
Association with ConnectU
Nine of the 12 organisation interviewees have had some contact with ConnectU. Two
organisation representatives had heard about ConnectU. Four organisations are represented
on the ConnectU Board. Four organisations have offered vehicles to ConnectU, with three
organisation’s vehicles being used regularly. The fourth organisation has offered a vehicle for
three hours one day a week, but this offer has been taken up on only very limited occasions as
the time available is a little short for some return trips. ConnectU transports clients for nine of
the interviewed organisations, however the numbers tend to be small.
The source of referrals to ConnectU was known for about 80 per cent of passengers. These
are shown in Figure 4.10.
Figure 4.10 Source of referrals to ConnectU (N=165)

42
Local organisations were the second highest source of referrals, representing about 19 per
cent of ConnectU’s passengers. These referrals were dominated by one organisation, which
as yet does not share vehicles with ConnectU. Most referrals came from hospital services.
People who self-referred knew of ConnectU services through brochures, the media or talks
given on the ConnectU service. Anecdotally, about 20 referrals arose (passed through a range
of sources) because of the change in the itinerary and route of the route bus service since
early 2014.
One interviewee, whose organisation had never used the ConnectU service, did not respond
to a question about the value of ConnectU. Of the 11 who answered this question, nine felt
ConnectU was of value while two were unsure. One of the respondents who was unsure felt
that the quote given by ConnectU for a long distance trip was too high. The other interviewee
who was unsure had not used the ConnectU service.
The transport scheme uses a ConnectU vehicle (a medium sized sedan donated by an
interested party) every week day, and Warrnambool City Council (WCC) makes a vehicle
available for two days per week.10 Three organisations share a car with ConnectU. Moyne
Health allows ConnectU to use their vehicles when needed. It was noted by an interviewee
that sharing vehicles can be logistically difficult for the owner organisation if the vehicle is
returned late. In addition, ConnectU can enquire and use vehicles available from Mpower,11
although these have been used on only very limited occasions. Brophy Family and Youth
Services has recently made a vehicle available to ConnectU on a Friday morning between 9
am and 12 noon for a three month trial period. The ConnectU Operations Manager’s car,
provided by Transit South West, is also used for two days per week, on average. Finally, on
rare occasions, the cars of the ConnectU volunteers are also utilised.
Interviewees, when asked about the value of ConnectU, noted that limited public transport in
some locations leaves only private vehicles or taxis as an option. ConnectU is regarded by
many of the agencies as providing a sustainable transport system. It is a punctual service and
the staff and volunteer drivers are perceived to be friendly, supportive and willing to assist
passengers. ConnectU is used by some organisations to ensure their passenger receives the
necessary personal care, reassurance and assistance required.
Barriers to organisations sharing vehicles include administrative, regulatory and insurance
issues, in addition to the need to gain approval, where required, from the relevant
organisation’s head office. Moyne Health and Warrnambool City Council overcome some of
these issues by having the ConnectU volunteer drivers registered with them as well as with
ConnectU. Some of the interviewees noted that their organisation’s vehicles are not generally
used for client transport, but for staff to visit passengers and other agency needs. One
interviewee noted that they could not share vehicles as they were always fully booked. The
failure of many organisations to share a vehicle with ConnectU was viewed as a difficulty in
efficiently providing services.
The funding associated with the provision of services for different clients presents a barrier to
having a more integrated transport system. For example, one interviewee noted that their
10 WCC charge 25 cents per kilometre for use of their vehicles. 11 Mpower Inc. is an accredited, community-based agency servicing South West Victoria. It provides support
to individuals with a disability and their families and assists other disadvantaged members of the
community.

43
organisation is commonly awarded a total service package inclusive of transport funding, and
hence organisations do not want to risk losing funding by handing over the delivery of
transport to another organisation.
Suggested improvements to the current operating model used by ConnectU include varying
the design of the program to suit different organisations. For example, it was suggested that a
list could be prepared showing when vehicles are available and then try to fit passengers into
the available time slots. Greater flexibility, for example by having smaller time frames to
accommodate one way trips rather than having to commit to a return trip, was suggested as a
way of encouraging greater integration of vehicle use. Flexibility in terms of extending office
hours, for example, from 8.30 am to 5.30 pm, was also suggested. Having transport available
before 9 am would serve passengers who, for example, need to attend hospital early for day
procedures or have other early morning appointments.
Although the price charged by ConnectU for a trip is less than a taxi fare, one interviewee
noted that the price can still be too high for some passengers, particularly those who require
transport to or from rural areas. The ability of ConnectU to waive the required fee if it is not
affordable to an individual, was not known by this respondent.
Some of the interviewees reported that there needs to be a greater willingness by all to look at
how the various barriers can be overcome and promote the concept of social responsibility
and good citizenship. For example, it was suggested that insurance issues can be overcome by
registering drivers with both organisations. One interviewee noted that, if fleet cars are
available, they need to be used for the community good. It was suggested that a fleet
manager, or an independent operator in charge of the vehicles, could assist with the delivery
of a more integrated model. Social inclusion and connectedness by partnering a volunteer
with someone in need was felt to be something that should be encouraged.
COST-BENEFIT ANALYSIS
The objective of this cost-benefit analysis is to estimate the net benefit arising from the
operation of ConnectU. As expected, the findings of the analysis are sensitive to the chosen
time period. For this reason, the costs and benefits have been based on an indicative time
period based on extrapolating the actual data for the three month period June to August 2014
over a 12 month period. Hence, this analysis shows the expected net benefits for a 12 month
period into the future, based on the fact that ConnectU is now established and assuming
current capacity.
The findings are summarised in Table 4.13 below, with the remainder of this section then
outlining the various assumptions behind the calculation of the estimated costs and benefits,
including under the sensitivity analysis scenarios.

44
Table 4.13 Cost-benefit analysis summary
BASE CASE
SENSITIVITY ANALYSIS
SCENARIO 1 SCENARIO 2 SCENARIO 3
Assumptions: 75% passengers
socially
disadvantaged.
4,320 trips pa.
Costs=$100,000.
$23.15 per trip
gross cost
67% passengers
socially
disadvantaged.
4,320 trips pa.
Costs=$100,000.
75% passengers
socially
disadvantaged.
10% increase in
trips pa.
5% increase in
costs.
67% passengers
socially
disadvantaged.
10,000 trips pa.
Cost per trip
gross $15.00
BENEFITS $280,800 $259,286 $308,880 $602,000
NET COSTS* $100,000 $100,000 $105,000 $150,000
NET BENEFITS $180,800 $159,286 $203,880 $452,000
*Operating costs less fare retrieval.
Under the base case (expected) scenario, the net benefits (benefits minus costs) from the
ConnectU social enterprise are estimated at $180,800 for a 12 month period.
Sensitivity analysis, undertaken by varying important assumptions underlying the base case
analysis (scenarios 1 and 2), estimate expected net benefits at between $159,286 and
$203,880 per annum.
Under a long run projected growth scenario for ConnectU of 10,000 trips per annum
(scenario 3), and given the assumption that the ConnectU social enterprise model has the
potential to generate significant efficiency dividends and additional benefits to the
community through the sharing and pooling of regional transport resources, estimated net
benefits could be as high as $452,000 per annum.
In each instance, the benefits of the service to the community outweigh the costs of the
provision of the service provided by ConnectU. This is particularly significant, as many of
the intangible benefits of the service cannot be, and have not been, quantified in the cost
benefit analysis.
ESTIMATION OF BENEFITS
The benefits of ConnectU can be categorised according to the recipient of the benefit; hence
there are benefits to passengers, volunteers, family and carers and to other agencies. A well
acknowledged limitation of cost-benefit analysis is the difficulties associated with estimating
a value for intangibles, such as the increase in well-being that volunteers may experience
from donating their time. Hence, key intangibles associated with the provision of services by
ConnectU have not been quantified, and the benefits have been limited to those accruing to
passengers who have benefited from accessing the service. In this way, the cost-benefit
analysis is based on a conservative but quantifiable estimate of benefits.

45
An important aspect of the benefit to ConnectU services to passengers is the associated
increase in mobility and decrease in social exclusion. Research by Stanley et al. (2011, 2012)
provides dollar estimates for the value of a trip according to income. For this study, in order
to gain an approximation of the social value of trips to passengers, the value of $20 per trip
for a passenger on an average income and $80 per trip for more socially disadvantaged
passengers have been used. As income data for all passengers is not available, and based on
sample data, it has been assumed that one quarter of ConnectU passengers have an average
income and three quarters of passengers are more socially disadvantaged. Sensitivity analysis
of the findings to this assumption has also been undertaken.
The total number of trips under the base case is assumed to be 4,320 per annum. This is based
on the conservative assumption that the number of trips in August 2014 (360 for the month)
will be the minimum number of trips each month into the future. This is probably
significantly underestimated, as the present rate of passenger trips is increasing at 17.5 per
cent each month. This gives benefits:
–For passengers with an average income: 4,320 trips x 25% x $20 = $21,600
Plus
–For more socially disadvantaged passengers: 4,320 trips x 75% x $80= $259,200
Total benefits = $21,600 + $259,200 = $280,800
Intangible Benefits not included
This estimate of the benefit of the service provided by ConnectU is conservative due to the
many intangible benefits that have not been included. These benefits include, for example,
forgone costs to society, such as medical attention (as the medical condition was not
prevented) or savings in Newstart payment, as the person has been able to procure a job due
to the ConnectU service. In addition, the benefits to volunteers, such as social capital and
connection to the community, have not been included in the cost-benefit analysis.
ESTIMATION OF COSTS
The costs for this analysis have been based on data provided by ConnectU staff for the
operation of the service. These costs include the running costs of vehicles, computing costs,
the leasing of office space and salaries. The total annual costs, with ConnectU now
established, are estimated at $120,000. Approximately $20,000 of these costs are offset with
payment of fares for the trip, resulting in estimated net costs of $100,000 per annum.
BENEFIT COST RATIO
With total estimated benefits under the base case of $280,800 and total estimated net costs of
$100,000, it is estimated under the baseline scenario that the net benefit (benefits less costs)
of the service provided by ConnectU over a twelve month period amounts to $180,800. This
result can also be expressed as a benefit cost ratio, with the benefits exceeding the costs in the
ratio of 2.81 to 1.
SENSITIVITY ANALYSIS
As this analysis is sensitive to a number of assumptions, sensitivity to three key assumptions
has been explored in the cost-benefit analysis. These assumptions relate to:

46
1) the proportion of passengers who are assumed to be socially disadvantaged,
2) the number of trips per annum, and
3) the long run projected growth in the service.
Scenario 1: The extent of social disadvantage among passengers
If the assumption regarding the percentage of passengers who are socially disadvantaged is
reduced from three quarters to two thirds, the estimated benefits are reduced, as follows:
–For passengers with average income: 4,320 trips x 33.3% x $20= $28,771
Plus
–For socially disadvantaged passengers: 4,320 trips x 66.7% x $80= $230,515
Total benefits = $28,771 + $230,515 = $259,286
Hence varying this assumption reduces the estimated net benefit by $21,514, or
approximately 11.8 per cent. The expected net benefits under this scenario amount to
$159,286 ($259,286 less $100,000).
Scenario 2: The number of trips
The base case analysis has been based on the number of trips remaining at the same level as
August 2014. Given the continued increase in the number of trips, it is reasonable to assume
that this number may rise by at least 10 per cent in future years. This would result in an
increase in annual trip numbers from 4,320 to 4,752. If this was to occur the benefits of the
service, with the initial other assumptions remaining constant, would be:
–For average income passengers: 4,752 trips x 25% x $20= $23,760
Plus
–For socially disadvantaged passengers: 4,752 trips x 75% x $80= $285,120
Total benefits = $23,760 + $285,120 = $308,880
Hence, varying this assumption increases the estimated benefits, when compared to the base
case, by $28,080, or 10 per cent. It is likely that a 10 per cent increase in trips would also
result in a five per cent increase in costs. The percentage increase in costs is likely to be
lower than the percentage increase in trips due to the fixed, rather than variable, nature of
some of the costs. This assumption results in estimated costs increasing from $100,000 per
annum to $105,000. Hence, with a concurrent 5 per cent increase in costs, the net benefit
under this scenario increases to $203,880 ($308,880 less $105,000).
Scenario 3: The long run projected growth of the ConnectU service
As the service develops, the ConnectU model has the potential to generate significant
efficiency dividends and additional benefits to the community through the sharing and
pooling of regional transport resources. For this reason, scenario 3 provides long run
projected net benefits if the service increased to 10,000 trips per annum. A long run average
cost per trip of $15.00 has been used for this scenario. In this case, the projected net benefit
per annum of the ConnectU service is $452,000, with projected benefits of $602,000 and
costs of $150,000.

47
5. DISCUSSION AND CONCLUSIONS The research findings suggest that ConnectU offers a highly valuable and valued service for
passengers. The growth in numbers of passengers also indicates that it is fulfilling an
extensive need, particularly for those experiencing long term physical or mental illness, for
the frail aged and for those with limited or no support who have temporary mobility problems
due to an acute medical issue. Passengers almost unanimously report how they value the
ability to get to the needed service and the extra care taken to improve the quality of the trip,
or indeed make the trip possible at all.
In addition, there is early evidence that ConnectU provides benefits beyond the achievement
of the specific passenger service provided. Previous research has shown the level of benefits
from improvement in social inclusion provided by the ability to be mobile (Stanley et al.,
2011). This is reflected in the cost-benefit analysis which, based on social inclusion benefits
under a present (base) case scenario shows an expected benefit cost ratio of 2.81 to 1. Given
economies of scale and efficiencies in the future, there is scope for a considerable increase in
the benefit cost ratio.
The results of the evaluation also show that there are small but important improvements in
attachment to the community and the wellbeing of customers after they became a ConnectU
passenger. The reasons for this improvement in wellbeing are likely to be due to a number of
outcomes, such as the increase in inclusion or improvement in social capital and connections
to the community, the relative importance depending on individual factors. These
improvements are small but present, and if generalised to the population of passengers are
measurable even although just over one-third of passengers undertook only one trip with
ConnectU and just one-half took only one or two trips with ConnectU. This finding is very
important as it is often difficult for policy makers to initiate policy that increases a sense of
community (Farell, Aubry & Coulombe, 2004). This research shows that, even if no new
community initiatives are undertaken, merely facilitating mobility has a capacity building
impact. Of course, the caring and supportive operational style utilised by ConnectU in their
provision of transport also assists growth in community connections.
The considerable benefits for the volunteers of ConnectU were raised in the interim report
and continue to be mentioned in anecdotal evidence. These benefits increase the total value of
ConnectU. Other benefits not included in the dollar figures contained in the cost-benefit
analysis but which are relevant include the forgone costs to society. These include areas such
as health, education and employment, where the failure to be mobile would hinder progress in
these areas, such as in job attainment. These issues are beginning to be address in the UK.
An improvement in the allocation of resources has been found to generate cost savings in the
UK. The North West Centre of Excellence reported that:
Experience from local authorities who operate an Integrated Transport Unit and from
authorities that have recently assessed the business case for moving to such a unit
suggests that annual efficiency benefits of the order of hundreds of thousands of
pounds are achievable. (Auditor General for Scotland and the Accounts Commission,
2011, p. 15)
The cost benefit ratio calculation of buses in urban areas outside London found the generation
of £2.5 billion in economic benefits against public funding of £0.5 billion (pteg newsletter,
2014). This represents a benefit cost ratio of 5:1. Work in Australia has put the benefit cost
ratio at 3.8:1, a figure which includes social inclusion benefits (Stanley & Hensher, 2011).

48
The UK report recommends changes to bus funding streams to recognise the impacts that bus
services have on the achievement of goals in other government departments, such as health
and education (pteg, 2014). This would take the form of contributions from these other
functional departments to support transport, which assists in the achievement of, for example,
health and education outcomes.
Interestingly, research has been undertaken on the value of having the presence of a social
enterprise, as such, particularly in a rural neighbourhood (Dyson, 2013). Such a social
enterprise is an exercise in community capacity building, as local communities are
subsequently better placed to identify and respond to local needs. However, it was noted that
the enterprise needs to be of sufficient scale, longevity and sustainability so that the value
created for local people can be sustained and expanded into the future. These benefits are also
not included in the cost-benefit analysis undertaken in this report.
ConnectU works on the model where people are assisted to move from special purpose and
perhaps ‘exclusionary transport’ to an environment where there is greater mixing with the
general travelling public and greater personal self-sufficiency and transport sustainability.
The coordination of local transport will facilitate the monitoring of all transport needs and
identify service gaps, thereby enabling an improved understanding of passenger movements
and preferences and the better provision of a more cost effective total transport system.
Benefits from the presence of ConnectU will also be felt by local organisations. As many of
the ConnectU passengers are travelling to medical centres, these centres will now not have
the costs of issuing taxi vouchers or using an ambulance. As this source of passengers for
ConnectU is growing, the savings to these organisations are also likely to increase in the
future. These organisations should be supporting ConnectU.
While there is some organisational cooperation between ConnectU and Councils, health
services and welfare agencies, and particularly those who offer other modes of transport, this
evaluation suggests that this resource use and cost side of the enterprise needs to be
strengthened. ConnectU was designed to take advantage of under-utilised vehicle assets of
community transport providers and facilitate the better use of operational transport funding
through coordination between the community transport services and with other transport
modes. This arrangement would offer a specialised transport service for these organisations
while also extending the service to community members not necessarily associated with a
welfare agency and who are finding difficulty in accessing transport that meets their needs.
What the researchers found was a very complex community transport system, where the
funding comes from a range of uncoordinated sources, and is often not separately accounted
for from general service provision, but provided in funding packages (such as from state or
federal governments) where the number of ‘activities or passenger services achieved’ are
measured as the outcomes. The provision of the capital cost of vehicle purchase is also very
ad hoc – with sometimes philanthropic organisations providing funding, or the federal or state
government providing one-off donations of a vehicle.
The cost of community transport in Victoria is unclear due to the complexity of the
arrangements and an absence of any centralised planning systems for community transport.
The information on the amount of Home and Community Care Services (HACC) funding for
Victoria is not available at present due to the negotiations presently underway on the
Disability Act. There is no record the researchers were able to obtain on the donations to

49
support community transport in Victoria or on the total state funds distributed to community
transport, nor how this funding is used in practice at the local level.
Some information about the above is provided by the IPSOS-Eureka survey which stated that,
in 2010, organisations focussed on delivering community transport services averaged an
annual expenditure of $280,744 (IPSOS-Eureka. 2011). The average funding for transport
across all organisations that received any such funding was $115,902. Those organisations
whose primary focus is on delivering community transport services received significantly
more funding (average of $226,669) than those whose primary focus lies elsewhere (average
of $65,582). While 60 per cent of those surveyed by ISPOS said they were able to meet the
demand for community transport for their customers, 31 per cent said they had a waiting list
for their services. Reasons given for not being able to meet the demand included the lack of
funds and cost of running the service as being a barrier (31 per cent), a lack of staff to run the
service (29 per cent) and the increasing aged population (23 per cent). These figures suggest
that there is clearly room for improvement in the service.
However, the authors of this ConnectU report suggest there may be some uncertainty in these
figures. This is due to the nature of the on-line survey, the experience in this research in
relation to the difficulty in obtaining this information from the organisations, communications
with the researchers which suggested that there is considerable blurring between transport,
service and staff funding, and previous research, which found that some vehicle assets could
be used more efficiently.
Thus, it is suggested that it will be important to build partnerships and agreements with
welfare, health and residential organisations to enable financial sustainability of the social
enterprise model of ConnectU. This will also allow the provision of a high quality service to
people associated with these organisations, as well as those outside these organisations, who
have previously unmet transport needs.
A final point to note on this issue is that if the original model of ConnectU was able to be
realised, this would be unlikely to entail the use of additional new resources, once operational
Rather, the model is to more effectively using existing resources, while at the same time
providing an enhanced and extended customer service.

50
6. RECOMMENDATIONS The following are the recommendations of the evaluation researchers.
6.1 TRANSPARENCY IN TRANSPORT FUNDING
The findings from this ConnectU evaluation echo those in the UK report, where it was said
that the government as a whole needs to have coherent oversight of the totality of funding for
transport services. It is presently unclear how much money is used by community transport
and to what benefit, with suggestions that the resources could be more efficiently allocated.
The funding for community transport is highly complex, disaggregated and lacks
transparency, such that the cost effectiveness of the service is unclear.
6.2 PLACE-BASED ORGANISATION OF TRANSPORT SERVICES
This evaluation supports the findings in other locations that local areas best understand local
needs and the best way to achieve mobility for all those who need it. This is evidenced in the
ConnectU identification of many people in need of transport who had previously been
‘hidden’. The community was able to identify these people and refer them to ConnectU.
6.3 A TRANSPORT OR A SERVICE PROBLEM?
The evaluation noted that there was often a failure of services, especially those medically
related, to plan for appointments which fit in with transport options. Thus, the individual or
agency/organisation is at times paying for high cost services, such as taxis or ambulances, or
the cost is borne by another person or agency. This issue could be addressed through greater
flexibility in approach through the scheduling of appointments and/or a service which visits
the patient. Examples are already occurring in the local area, such as with visiting care nurses
and visiting child care with a purpose build bus. In effect, ConnectU is taking over some
organisational costs when they transport an organisation’s clients, therefore these
organisations, such as hospitals, should be financially contributing to ConnectU.
6.4 INCREASE IN PUBLIC TRANSPORT
It is recommended that there is an increase in public transport services over the Warrnambool
catchment area. Recent work from the UK states that ‘buses form the backbone of public
transport (pteg 2014, p.8), and that:
The bus is one of the biggest bargains available to transport policy makers in
achieving a very broad range of transport, economic, environmental and social
objectives in a cost effective way and in a timely fashion. (Bridge 2014, quoting from
pteg 2014 report)
There is little sense in operating an on-demand service when some of these passengers (and
many others) could be accommodated on a route bus service. In the IPSOS survey, 79 per
cent of respondents predicted that a lack of public transport would dictate an increase in
demand for community transport, rising to 89 per cent of those services operating in non-
metropolitan areas. Much of this demand should be absorbed by an increase in public
transport services. The information from ConnectU and from ConnectU passenger interviews
reported in this monograph indicate that a major reason for individuals utilising the services
of ConnectU arise from a lack of public transport options.

51
6.5 EXTEND THE CONNECTU SERVICE
The passengers with ConnectU are generally seniors and the service is offered, with a few
exceptions, over working hours Monday to Friday. It is suggested that ConnectU, when
resources become available, move to broaden its passenger groups and extend its hours of
operation.
It is suggested that this extension also apply to the purpose of trips. Work on new bus routes
on the edge of Melbourne has shown that the greatest use of the new services was for leisure,
often mistakenly defined as ‘non-essential’ travel (Bell et al., 2006). If people have a choice
they often travel for pleasure, travel at a whim, popping in to see friends, using public
transport in an unstructured manner. In the completed travel diaries for ConnectU trips kept
by the ConnectU office, much travel included ‘just getting out of the house’. Such travel is
important for connecting those who undertake little travel back into the community and to
establish boarder and deeper connections with people, thus building capabilities, social
inclusion and wellbeing. The evidence for the importance of building community and the role
of transport in this process has been reported in the research (see, for example, Diers, 2004;
Vella-Brodrick & Stanley, 2013).
It is recommended that particular attention be given to the travel needs of youth, particularly
as the wellbeing of rural youth is lower than youth in Melbourne (Stanley & Banks, 2012).
Earlier work in Warrnambool and in the Shires of Moyne and Corangamite showed that
youth came out as highly transport disadvantaged, particularly those youth living outside
Warrnambool in the smaller country towns (Stanley & Stanley, 2004; Stanley & Banks,
2012). A Moyne and Warrnambool Youth Council Forum held in November 2011 reported
that youth believed that health was their biggest problem, followed by transport. Concerns
were expressed about a lack of transport services, that they could sometimes get to a location
but not return home, the need for better transport connections, the need for better information
on available transport, and transport availability for after school activities. The movement of
youth away from rural areas, exacerbated by transport problems, has a role in rural decline;
thus adversely impacting on many people and the community.
6.6 TRIAL OF ‘TOTAL TRANSPORT’
It is recommended that ConnectU move to a trial of ‘Total Transport’, where the model in the
UK is that:
…health, social services, education and mainstream transport fleets and budgets are
pooled to provide a single service (pteg, 2014, p. 148).
Such a model is being operated and trialled in a number of locations in the UK and Europe.
For example, Greater Manchester’s Integrated Social Needs Transport project matches
underused accessible transport capacity (including from the local authority, third sector and
the ambulance service) to unmet demand for transport, particularly from those unable to use
conventional public transport services (pteg, 2011). The Transport Innovation Partnership
(covering East Riding, North Lincolnshire and York City councils, the Yorkshire Ambulance
Service and community transport providers) has been developing a common booking system
for vehicle fleets in the area. A partnership in Coventry coordinates transport services, which
has resulted in the creation of new revenue streams with the ability to operate new services at
minimal cost. Such schemes occur in the Netherlands, where some provinces have franchised
whole networks, pooling together social, health, education and public transport budgets and
services into one package to ensure the right vehicles are used for the job.

52
All transport should be coordinated and scheduled centrally. By working together, the
resources could be put to the best use for the greatest number of people. While not noted in
the pteg report, it is likely that a more comprehensive and frequent public transport would
encourage a shift from car driving to more public transport use, thus improving
environmental outcomes.
It is recommended that the ConnectU trial be undertaken in stages, with integration of
community transport and budgets into a central hub, thus allowing a specialised transport
service to be offered to welfare agencies, health services and residential services. Stage 2
would move this to also incorporate route bus services, taxis and ambulance services.
6.7 Improved allocation of resources
This report on ConnectU also recommends that there needs to be a change in the funding
scheme to support transport for those people who are not able to utilise the public transport
system. The Scottish Auditor General found that:
The large number of individual grants, and poorly aligned objectives of similar
services across different policy areas, can limit the ability of delivery organisations to
join up services around users. (Auditor General for Scotland and the Accounts
Commission, 2011. p. 5)
The authors of this report recommend that funding for transport, initially outside the taxi and
route bus systems, be combined into a central place-based transport hub. This hub would
offer a service for their passengers to those agencies with community transport at present. It
will integrate this service with a service to those passengers in need of transport but who are
currently missing out on mobility due to their lack of association with an agency.
Such an integrated approach will not only be more efficient but will offer better outcomes for
the community in the areas of choice, independence and personal control. The system will, in
most situations, allow the passenger to make the decisions about when and where to travel.
Such an arrangement should continually seek to move passengers to the mainstream route bus
system whenever possible. It is likely that the bus route system should also be part of this
integrated system of mobility, not divided by modes, but this should be investigated in later
stages of the ConnectU trial.
The central hub would pool and align national and local funding strands into a single ‘pot’ to
spend on tackling local problems. The Scottish Auditor General believes that this should help
to reduce inefficiency and duplication as well as offer a more coherent service to customers
(Auditor General for Scotland and the Accounts Commission, 2011). However, the Auditor
General also recognises the difficulties that can be associated with convincing agencies to
release some control and to work at breaking down silos of responsibility for the greater
good, as there are long established practices and boundaries between different policy areas.
The UK Auditor General also recommended that this include the ambulance service, where
there is a present tendency for many low-need users to be provided with high cost ambulance
service transport. A cross-sector approach to transport would provide people with vehicles
suited to their needs, and highly specified ambulance service transport would be reserved
only for those who need it most.
The UK pteg report (2014) recommends the establishment of a ‘Connectivity Fund’, with
contributions from a range of government departments such as health and education, thus
recognising the importance of transport in achieving the desired outcomes of these

53
departments. It is recommended that this approach be explored in relation to ConnectU. It
would be reasonable to ask other organisations to share transport costs to better enable their
passengers to access their services. It may be possible to negotiate a shared cost arrangement
between the organisation, the passenger and the state government. An obvious example of
where this would be feasible is in assisting young people to attend TAFE colleges. Such an
arrangement would reduce inefficiencies and duplications while also offering a more
coherent service to customers (pteg, 2014).

54
REFERENCES Auditor General for Scotland and the Accounts Commission. 2011. Transport for health and
social care, August, Audit Scotland, Edinburgh.
Australian Bureau of Statistics. 2013. Average weekly earnings,
<http://www.abs.gov.au/ausstats/[email protected]/Products/6302.0~Nov+2013~Main+Features~
Key+Figures?OpenDocument>.
Bell, D., in association with Currie, G., Stanley, J. & Fletcher, M. (2006), Buses in Outer
Suburban Melbourne, Multi-modal Transport Solutions, July
Bridge, T. 2014. Bus is ‘biggest bargain’ available to Whitehall, report claims, Surveyer
Transport Network 22 July, <http://www.transport-network.co.uk/Bus-is-biggest-bargain-
available-to-Whitehall-report-claims/10694#.VErghJ24bI>.
Cass, N., Shove, E. and Urry, J. 2005. Social exclusion, mobility and access, The
Sociological Review, 53, pp. 539–555.
Chipuer, H.M. and Pretty, G.M.H. 1999. A review of the Sense of Community Index: Current
uses, factor structure, reliability, and further development. Journal of Community
Psychology, 27, pp. 643–658.
Currie, G., Richardson, T., Smyth, P., Vella-Brodrick, D., Hine, J., Lucas, K., Stanley, J.R.,
Morris, J., Kinnear, R. and Stanley, J.K. 2009. Investigating links between transport
disadvantage, social exclusion and well-being in Melbourne: Preliminary results, Transport
Policy, 16, pp. 97–105.
Currie, G. and Senbergs, Z. 2007. Identifying Spacial Gaps in Public Transport provision for
Socially Disadvantaged Australians: The Melbourne ‘Needs Gap’ Study, Australasian
Transport Research Forum, Melbourne.
Dayson, C. (2013), Understanding the place based social value created by new-start social
enterprises: Evidence from ten rural UK communities, People, Place & Policy Online,
7(1), pp. 30-45.
Delbosc, A. and Currie, G. 2011. Exploring the relative influences of transport disadvantage
and social exclusion on well-being, Transport Policy, 18, pp. 555–562.
Department of Finance. 2006. Handbook of Cost-Benefit Analysis, Commonwealth of
Australia, Canberra, <http://www.finance.gov.au/finframework/docs/Handbook_of_CB_
analysis.pdf>.
Department of Planning and Community Development. 2010. Community Enterprise
Projects, State of Victoria, Melbourne, http://www.dpcd.vic.gov.au/
communitydevelopment/projects-and-programs/community-enterprise-projects>.
Department of Planning and Community Development. 2011. Transport Connections
Program, State of Victoria, Melbourne, <http://www.dpcd.vic.gov.au/
communitydevelopment/regional-programs/transport-connections>.

55
Department of Planning and Community Development, 2012. Transport Connections
Program, Snapshot 2012, <http://www.rdv.vic.gov.au/data/assets/pdf_file/
0009/200304/Transport-Connections-Program-Snapshot-2012.pdf>.
Diers, J. 2004. Neighbor Power: Building Community the Seattle Way, University of
Washington Press.
Diener, E., Wirtz, D., Tov, W., Kim-Prieto, C., Choi, D., Oishi, S. and Biswas-Diener, R.
2010. New well-being measures: Short scales to assess flourishing and positive and
negative feelings, Social Indicators Research, 97, pp. 143-156.
Farrell, S., Aubry, T. & Coulombe, D. 2004. Neighborhoods and neighbors: Do they
contribute to personal well-being? Journal of Community Psychology, Vol. 32, No. 1, 9–
25.
Horizon 21. 2011. Horizon 21: Our Mission, Horizon 21, Warrnambool.
Horizon 21. 2012. Who is Horizon 21?, Horizon 21, Warrnambool,
<http://www.horizon21.com.au/H21_web_version.pdf>.
Hurni, A. 2006. Transport and Social Exclusion in Western Sydney, University of Western
Sydney and Western Sydney Community Forum, Sydney.
IPSOS-Eureka. 2011. Community Transport Stocktake, Prepared for VCTA, Ipsos-Eureka,
Melbourne.
Long, D.A. and Perkins, D.D. 2007. Community social and place predictors of sense and
community: A multilevel and longitudinal analysis, Journal of Community Psychology, 35,
pp. 563–581.
McMillan, D.W., & Chavis, D.M. 1986. Sense of community: A definition and theory.
Journal of Community Psychology, 14, 6–23.
Ontario Ministry of Transportation. 2012. Transit-Supportive Guidelines, Ontario Ministry of
Transportation, Ontario.
Preston, J. and Rajé, F. 2007. Accessibility, mobility and transport-related social exclusion,
Journal of Transport Geography, 15, pp. 151–160.
pteg. 2011. Total Transport: Working Across Sectors to Achieve Better Outcomes, June,
Public Transport Executive Group, Leeds.
pteg. 2014. Making the Connections: The Cross-sector Benefits of Supporting Bus Services,
July, Public Transport Executive Group, Leeds.
pteg newsletter. 2014. The Biggest Bargain in Public Spending?, 32, September, Public
Transport Executive Group, Leeds.
RACV. 2013. Vehicle reimbursement rates, <http://www.racv.com.au/wps/wcm/connect/
racv/Internet/Primary/my+car/advice+_+information/vehicle+operating+costs/vehicle+
reimbursement+rates>, Accessed 31 July 2104.

56
Regional Accessibility Committee. 2007. Draft Terms of Reference, Regional Accessibility
Committee, Warrnambool.
Stanley, J. K. & Hensher, D. 2011, Economic Modelling, in (ed.) G. Currie, New Perspective
and Methods in Transport and Social Exclusion Research, pp.77-90, Emerald Press, UK
Stanley, J.R. 2011. Overview on Research on Community Transport using Warrnambool and
Surrounding Districts as a Case-study, Monash Sustainability Institute, Monash
University, Melbourne.
Stanley, J. and Banks, M. 2012. Transport Needs Analysis for Getting There and Back:
Report for Transport Connections Shires of Moyne and Corangamite, June, Monash
Sustainability Institute, Melbourne.
Stanley, J.K., Hensher, D.A., Stanley, J.R. and Vella-Brodrick, D. 2011. Mobility, social
exclusion and well-being: Exploring the links, Transportation Research Part A, 45,
pp. 789–801.
Stanley, J. and Stanley, J. 2004. Improving Public Transport to Meet Community Needs: A
Warrnambool Case-study, Report prepared for Bus Association Victoria and Warrnambool
Bus Lines.
Stanley, J.R. and Stanley, J.K. 2012. Improving Personal Mobility Opportunities in Regional
Areas: A Report to BusVic by Monash Sustainability Institute, June, Monash Sustainability
Institute, Melbourne.
Stanley, J.R., Stanley, J.K. and Hensher, D. 2012. Mobility, social capital and sense of
community: What value?, Urban Studies, 49, pp. 3595–3609.
Stanley, J.R. and Vella-Brodrick, D. 2009. The usefulness of social exclusion to inform social
policy in transport, Transport Policy, 16, pp. 90–96.
State of Victoria. 2006. Meeting our Transport Challenges: Connecting Victorian
Communities, State of Victoria, Melbourne.
Sunraysia Daily. 2014. Service Run off its Wheels, 24 September, p. 2, Mildura.
Tartaglia, S. 2006. A preliminary study for a new model of sense of community, Journal of
Community Psychology, 34(1), pp. 25–36.
Taxi Services Commission. 2014. Country fares, <http://www.taxi.vic.gov.au/
passengers/taxi-passengers/taxi-fares#coun try>, Accessed 31 July 2014.
Vella-Brodrick, D.A. and Stanley, J. 2013. The significance of transport mobility in
predicting well-being. Transport Policy, 29, pp. 236–242.
Western Australian Planning Commission. 2012. Guidelines for Preparation of Integrated
Transport Plans, May, Western Australian Planning Commission, Perth.
Wines, G., Graham, M., Scarborough, H., Stanley, J. and Wallis, A. 2014. Establishment and
development of ConnectU: The first 12 months, Interim Research Report, March, Deakin
University and the Monash Sustainability Institute, Warrnambool.