
Tourism&cycling 6-pitch-smart mobility solutions bike-valley_20150421

sensors
Article
Connected Bike-smart IoT-based CyclingTraining Solution
George Catargiu 1, Eva-H. Dulf 1,2,* and Liviu C. Miclea 1
1 Department of Automation, Faculty of Automation and Computer Science,Technical University of Cluj-Napoca, Memorandumului Str. 28, 400014 Cluj-Napoca, Romania;[email protected] (G.C.); [email protected] (L.C.M.)
2 Physiological Controls Research Center, Óbuda University, H-1034 Budapest, Hungary* Correspondence: [email protected]
Received: 17 February 2020; Accepted: 6 March 2020; Published: 7 March 2020
Abstract: The Connected Bike project combines several technologies, both hardware and software,to provide cycling enthusiasts with a modern alternative solution for training. Therefore, a trainercan monitor online through a Web Application some of the important parameters for training, morespecifically the speed, cadence and power generated by the cyclist. Also, the trainer can see at everymoment where the rider is with the aid of a GPS module. The system is built out of both hardware andsoftware components. The hardware is in charge of collecting, scaling, converting and sending datafrom sensors. On the software side, there is the server, which consists of the Back-End and the MQTT(Message Queues Telemetry Transport) Broker, as well as the Front-End of the Web Application thatdisplays and manages data as well as collaboration between cyclists and trainers. Finally, there is theAndroid Application that acts like a remote command for the hardware module on the bike, givingthe rider control over how and when the ride is monitored.
Keywords: connected bike; smart technologies; IoT; personalized training; embedded; back-end;front-end; Android; modules; MQTT; monitoring
1. Introduction
As times change, technology evolves and people migrate from fieldwork to deskwork, a newhealth threat arises: the sedentary lifestyle. To fight this phenomenon, fitness seems like a handysolution, especially for the advantage of having a personal trainer that can monitor the activity andoffer guidance throughout the training. The electric bicycle is a trendy solution, as it is presented in [1].However, most cyclists either amateur or professionals do not have this opportunity, making it harderto improve and reach specific goals. This paper proposes a technical solution meant to overcome thisissue, by using sensors, microcontrollers and microcomputers to read, send, save, and display data.Therefore, any trainer can monitor relevant cycling data gathered from the bike in real time.
Data collection from sensors is widely used today. However, all the data are focused on sharingsystem development [2–4], sensor network implementation [5,6], safety [7], smart city development [8,9]or intelligent control implementation [10–12]. A series of great results are published considering thepositioning method of the sensor system, structural health monitoring, and intelligent vehicle [13–17].No research focusing on IoT (Internet of Thinks) and smart bike fusion for training has been published.
Nowadays, in cycling, the most common training method is by sheet. This sheet can be custommade by a trainer for one or more riders and holds a training plan by days, weeks and even seasonperiods. However, this old and rigid method has a higher chance of failing to reach its purpose.
The Connected Bike proposed in this paper retrieves and transmits over internet the speed,cadence and cyclist power output both to a server-hosted database and to a web application, from
Sensors 2020, 20, 1473; doi:10.3390/s20051473 www.mdpi.com/journal/sensors

Sensors 2020, 20, 1473 2 of 27
where a trainer can monitor, evaluate and notify possible errors made by the cyclist during the ride.Furthermore, by persisting data to a server, both the cyclist and the trainer can return over past ridesand discuss about them. The rider also has the possibility to control the system by starting, pausing orending the ride with the help of a mobile application and internet connection.
All the technologies used in the presented Connected Bike project serve the following purposes:
• Collecting data from sensors• Computing the speed, pedaling cadence and instant power output of the cyclist from collected data• Real time GPS tracking of the bicycle• Aggregating and sending data to the web interface for online monitoring• Persisting training data to a database for later visualization• Allowing user to control the monitoring system through a mobile Android app• Implementing security levels to protect users’ data
The idea of real time bicycle tracking has been around for a while, and Chris Kiefer and FraukeBehrendt tackled this in [18] with a smart e-bike monitoring system (SEMS). They use custom hardwareand a mobile phone with internet connection as an access point to monitor data like the bike’s currentlocation and the motor’s level of assistance. This project is aimed towards e-bicycle fleets, focusingon scalability and ease of use, thus leaving aside acquisition of training relevant data like speed orcadence. A significant drawback for SEMS is that the battery powering the system discharges quitefast because of the hardware and connected mobile phone.
Neil Savage describes in [19] a bicycle data-monitoring concept named Copenhagen Wheel, byreplacing the rear wheel with an intelligent one. This wheel has a modified hub, which encapsulates inaddition to a standard one, an electric motor, and an ensemble of electronic components, both poweredby a battery. The system is capable of changing gears, adapting the motor’s speed and monitoring thetorque, all while gathering pollution, humidity, temperature data, and sending it to a server through amobile phone connected to the internet.
In terms of gathering data, which is a key concept of this research, Maurizio Di Paolo Emiliopresented in [20] the main concepts involved in the process. Therefore, he described a data acquisitionsystem as a mean of collecting information about a physical phenomenon through sensors and otherelectronic components. The sensors can be both digital (1/0, ON/OFF, etc.) and analog, the latter beingharder to quantify and needs additional sampling and conversion circuitry. Any data acquisitionsystem must have a computer or microcontroller as a core in charge of processing data and a mean oftransportation, storage and display for this data.
In [21], Sarah Al-Mutlaq briefly presented the working principle of a load cell. These sensorstranslate the load or force acting on it into an electric signal and can be of three types:
1. Hydraulic load cells—determines the applied force by measuring the displacement of a piston ina cylinder and the change of a diaphragm, which modifies the pressure inside the Bourdon tube
2. Pneumatic load cells—measures the force by determining the air pressure applied to one end ofthe diaphragm, which then leaves the cell through a nozzle on the other end.
3. Strain gauge load cells—mechanical elements, without moving parts that measure the forcethrough the deformation of one or more strain gauges.
All these ideas are embedded in the present paper, leading to an easy-to-use smart bike forpersonalized training. The novelty of the paper consists in the design and implementation of thissmart connected bike, using the interaction of future-oriented mobility and state-of-art data technology,but cheap and accessible elements. All steps are described in detail to be easy to reproduce by thereader. The presented solution has the potential to disrupt existing training solutions.
The paper is structured in three parts. After this short introductory part, Section 2 reveals theused materials and methods, divided in 12 subsections, for each discussed module. Section 3 presentsthe obtained results. The work ends with concluding remarks.

Sensors 2020, 20, 1473 3 of 27
2. Materials and Methods
The interface for monitoring the cyclist’s activity must have an increased portability and mustbe easy to access and interact. To meet these criteria, a web application was developed. This can beaccessed by trainers, as well as by cyclists, having pages and functionalities tailored for the specificuser type.
In the web application, a trainer has access to a list of the cyclists to whom they have connected,can select a rider for real time monitoring, or analyze any of the previous rides. They can also stop thecollaboration with any rider or establish a new collaboration with another. Last, but not least, the userhas access to a page from where they can view and modify their personal account’s data. The cyclistuser cannot see their performance in real time, having only access to the previous rides. However, theyhave the possibility to control the monitoring by creating a new ride, pausing or ending the currentone, through the help of a mobile phone application that acts as a remote for the module on the bicycle.
From the hardware point of view, the project consists of three modules: a microcontroller module,a microcomputer module and a mixed one. The first one is in charge of reading data from the loadcell, measuring the force applied to the pedal and sending the data to the second module through awireless channel.
The second module consists of a microcontroller, in charge of reading and processing data bothfrom sensors and from the first module and a microcomputer that receives this data, converts it intoa standardized message format, and sends it to the server via internet. It also retrieves the currentlocation in terms of latitude and longitude with the help of a GPS module.
Last, but not least, the third module is an always-on microcomputer which hosts the back-end ofthe web application and the MQTT broker. Two rechargeable batteries power the first two modules,and the mixed module requires internet access that is provided either by a mobile hotspot or by aninternet USB Stick.
Taking into account the multiple IoT specific architectures, described by P.P. Ray in [22] andpresented shortly in the previous section, the most suitable one for this research proved to be a hybridarchitecture, including the sensors, microcontrollers and the web and mobile applications.
As seen in Figure 1, the entire system is structured on three levels: the hardware level, theapplication level and the network level.
The hardware level consists of two modules that both have an Arduino microcontroller withseparate power banks and have wireless communication between each other. The first module is basedon an Arduino Micro, having connected an amplification module HX711 and a load cell. This modulereads data from the load cell and sends it to the other module via infrared communication. The secondmodule has an Arduino Mega with two Hall Effect sensors, used to determine the speed and cadence.The microcontroller performs data manipulation, afterwards converting it to byte array and sendingit to the Raspberry Pi through USB communication. Here, the data is converted again from binaryformat and is aggregated with latitude and longitude readings from the GPS module. The final dataformat is a JavaScript Object Notation (JSON) that is periodically published to the server.
The application level includes three main components in charge of the system’s business logic,establishing the way the application is handled and how data is stored and displayed. The firstcomponent is an Android App that is used to command the Raspberry Pi located on the bicycle, makingit easy to manage the ride monitoring. The second component is the Raspberry Pi module placed onthe bicycle that implements the system’s logic in the form of a state machine, deciding based on thecommands from the Android App if it should start reading, managing and sending data. Finally, thethird component of this layer is the web application, where users can register, login and view differentrides’ data, or monitor a ride in real time.

Sensors 2020, 20, 1473 4 of 27
Sensors 2020, 20, x FOR PEER REVIEW 4 of 27
Figure 1. Connected Bike system architecture.
The hardware level consists of two modules that both have an Arduino microcontroller with separate power banks and have wireless communication between each other. The first module is based on an Arduino Micro, having connected an amplification module HX711 and a load cell. This module reads data from the load cell and sends it to the other module via infrared communication. The second module has an Arduino Mega with two Hall Effect sensors, used to determine the speed and cadence. The microcontroller performs data manipulation, afterwards converting it to byte array and sending it to the Raspberry Pi through USB communication. Here, the data is converted again from binary format and is aggregated with latitude and longitude readings from the GPS module. The final data format is a JavaScript Object Notation (JSON) that is periodically published to the server.
The application level includes three main components in charge of the system’s business logic, establishing the way the application is handled and how data is stored and displayed. The first component is an Android App that is used to command the Raspberry Pi located on the bicycle, making it easy to manage the ride monitoring. The second component is the Raspberry Pi module placed on the bicycle that implements the system’s logic in the form of a state machine, deciding based on the commands from the Android App if it should start reading, managing and sending data. Finally, the third component of this layer is the web application, where users can register, login and view different rides’ data, or monitor a ride in real time.
The network level is made out of the actual communication between modules through internet. All the IoT-specific communication in this system is based on the MQTT, each component being
Figure 1. Connected Bike system architecture.
The network level is made out of the actual communication between modules through internet.All the IoT-specific communication in this system is based on the MQTT, each component beingconnected through an Access Point as clients, except of a Raspberry Pi device, which is the actualserver, hosting both the MQTT broker and the HTTP RESTful API server for the web application. Thereis also HTTP protocol used to establish communication between the front-end and the back-end for theweb application.
Seen as a black box, the entire hardware scheme is described in Figure 2, making it easy to observethe way modules communicate with each other. The module blocks are highlighted with blue dottedlines. The communication between the Arduino Mega, Raspberry Pi and the GPS module is realizedvia USB (for the GPS module, an UART to USB converter was attached). Furthermore, because thereare two rotating joints from the pedal to the bicycle’s frame, making it harder to use wires, the infraredtransmission medium was chosen for its simplicity and robustness. The downside of this approachwas the addition of another microcontroller and an extra battery to power it.

Sensors 2020, 20, 1473 5 of 27
Sensors 2020, 20, x FOR PEER REVIEW 5 of 27
connected through an Access Point as clients, except of a Raspberry Pi device, which is the actual server, hosting both the MQTT broker and the HTTP RESTful API server for the web application. There is also HTTP protocol used to establish communication between the front-end and the back-end for the web application.
Seen as a black box, the entire hardware scheme is described in Figure 2, making it easy to observe the way modules communicate with each other. The module blocks are highlighted with blue dotted lines. The communication between the Arduino Mega, Raspberry Pi and the GPS module is realized via USB (for the GPS module, an UART to USB converter was attached). Furthermore, because there are two rotating joints from the pedal to the bicycle’s frame, making it harder to use wires, the infrared transmission medium was chosen for its simplicity and robustness. The downside of this approach was the addition of another microcontroller and an extra battery to power it.
Figure 2. The hardware scheme.
2.1. The Pedal Module
The main functionality of this module is reading the force applied to the pedal by a cyclist. This is possible thanks to a load cell, an amplifying driver, a microcontroller, and a Hall Effect sensor. The data is sent to the frame module with an infrared LED connected to the microcontroller. A rechargeable portable battery powers the entire module. The wiring diagram is shown in Figure 3.
Figure 2. The hardware scheme.
2.1. The Pedal Module
The main functionality of this module is reading the force applied to the pedal by a cyclist. This ispossible thanks to a load cell, an amplifying driver, a microcontroller, and a Hall Effect sensor. The datais sent to the frame module with an infrared LED connected to the microcontroller. A rechargeableportable battery powers the entire module. The wiring diagram is shown in Figure 3.Sensors 2020, 20, x FOR PEER REVIEW 6 of 27
Figure 3. Pedal module wiring diagram.
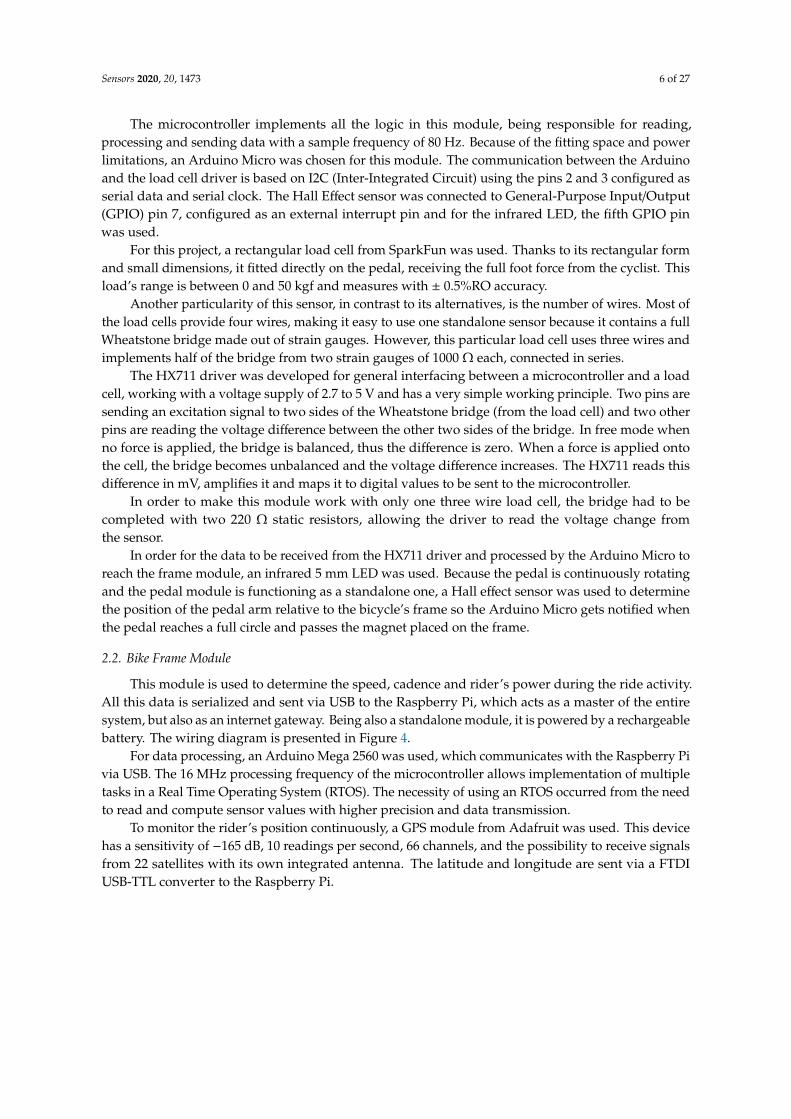
The microcontroller implements all the logic in this module, being responsible for reading, processing and sending data with a sample frequency of 80 Hz. Because of the fitting space and power limitations, an Arduino Micro was chosen for this module. The communication between the Arduino and the load cell driver is based on I2C (Inter-Integrated Circuit) using the pins 2 and 3 configured as serial data and serial clock. The Hall Effect sensor was connected to General-Purpose Input/Output (GPIO) pin 7, configured as an external interrupt pin and for the infrared LED, the fifth GPIO pin was used.
For this project, a rectangular load cell from SparkFun was used. Thanks to its rectangular form and small dimensions, it fitted directly on the pedal, receiving the full foot force from the cyclist. This load’s range is between 0 and 50 kgf and measures with ± 0.5%RO accuracy.
Another particularity of this sensor, in contrast to its alternatives, is the number of wires. Most of the load cells provide four wires, making it easy to use one standalone sensor because it contains a full Wheatstone bridge made out of strain gauges. However, this particular load cell uses three wires and implements half of the bridge from two strain gauges of 1000 Ω each, connected in series.
The HX711 driver was developed for general interfacing between a microcontroller and a load cell, working with a voltage supply of 2.7 to 5 V and has a very simple working principle. Two pins are sending an excitation signal to two sides of the Wheatstone bridge (from the load cell) and two other pins are reading the voltage difference between the other two sides of the bridge. In free mode when no force is applied, the bridge is balanced, thus the difference is zero. When a force is applied onto the cell, the bridge becomes unbalanced and the voltage difference increases. The HX711 reads this difference in mV, amplifies it and maps it to digital values to be sent to the microcontroller.
In order to make this module work with only one three wire load cell, the bridge had to be completed with two 220 Ω static resistors, allowing the driver to read the voltage change from the sensor.
In order for the data to be received from the HX711 driver and processed by the Arduino Micro to reach the frame module, an infrared 5 mm LED was used. Because the pedal is continuously rotating and the pedal module is functioning as a standalone one, a Hall effect sensor was used to determine the position of the pedal arm relative to the bicycle’s frame so the Arduino Micro gets notified when the pedal reaches a full circle and passes the magnet placed on the frame.
Figure 3. Pedal module wiring diagram.
Sensors 2020, 20, 1473 6 of 27
The microcontroller implements all the logic in this module, being responsible for reading,processing and sending data with a sample frequency of 80 Hz. Because of the fitting space and powerlimitations, an Arduino Micro was chosen for this module. The communication between the Arduinoand the load cell driver is based on I2C (Inter-Integrated Circuit) using the pins 2 and 3 configured asserial data and serial clock. The Hall Effect sensor was connected to General-Purpose Input/Output(GPIO) pin 7, configured as an external interrupt pin and for the infrared LED, the fifth GPIO pinwas used.
For this project, a rectangular load cell from SparkFun was used. Thanks to its rectangular formand small dimensions, it fitted directly on the pedal, receiving the full foot force from the cyclist. Thisload’s range is between 0 and 50 kgf and measures with ± 0.5%RO accuracy.
Another particularity of this sensor, in contrast to its alternatives, is the number of wires. Most ofthe load cells provide four wires, making it easy to use one standalone sensor because it contains a fullWheatstone bridge made out of strain gauges. However, this particular load cell uses three wires andimplements half of the bridge from two strain gauges of 1000 Ω each, connected in series.
The HX711 driver was developed for general interfacing between a microcontroller and a loadcell, working with a voltage supply of 2.7 to 5 V and has a very simple working principle. Two pins aresending an excitation signal to two sides of the Wheatstone bridge (from the load cell) and two otherpins are reading the voltage difference between the other two sides of the bridge. In free mode whenno force is applied, the bridge is balanced, thus the difference is zero. When a force is applied ontothe cell, the bridge becomes unbalanced and the voltage difference increases. The HX711 reads thisdifference in mV, amplifies it and maps it to digital values to be sent to the microcontroller.
In order to make this module work with only one three wire load cell, the bridge had to becompleted with two 220 Ω static resistors, allowing the driver to read the voltage change fromthe sensor.
In order for the data to be received from the HX711 driver and processed by the Arduino Micro toreach the frame module, an infrared 5 mm LED was used. Because the pedal is continuously rotatingand the pedal module is functioning as a standalone one, a Hall effect sensor was used to determinethe position of the pedal arm relative to the bicycle’s frame so the Arduino Micro gets notified whenthe pedal reaches a full circle and passes the magnet placed on the frame.
2.2. Bike Frame Module
This module is used to determine the speed, cadence and rider’s power during the ride activity.All this data is serialized and sent via USB to the Raspberry Pi, which acts as a master of the entiresystem, but also as an internet gateway. Being also a standalone module, it is powered by a rechargeablebattery. The wiring diagram is presented in Figure 4.
For data processing, an Arduino Mega 2560 was used, which communicates with the Raspberry Pivia USB. The 16 MHz processing frequency of the microcontroller allows implementation of multipletasks in a Real Time Operating System (RTOS). The necessity of using an RTOS occurred from the needto read and compute sensor values with higher precision and data transmission.
To monitor the rider’s position continuously, a GPS module from Adafruit was used. This devicehas a sensitivity of −165 dB, 10 readings per second, 66 channels, and the possibility to receive signalsfrom 22 satellites with its own integrated antenna. The latitude and longitude are sent via a FTDIUSB-TTL converter to the Raspberry Pi.

Sensors 2020, 20, 1473 7 of 27
Sensors 2020, 20, x FOR PEER REVIEW 7 of 27
2.2. Bike frame module
This module is used to determine the speed, cadence and rider’s power during the ride activity. All this data is serialized and sent via USB to the Raspberry Pi, which acts as a master of the entire system, but also as an internet gateway. Being also a standalone module, it is powered by a rechargeable battery. The wiring diagram is presented in Figure 4.
Figure 4. Bike frame module wiring diagram.
For data processing, an Arduino Mega 2560 was used, which communicates with the Raspberry Pi via USB. The 16 MHz processing frequency of the microcontroller allows implementation of multiple tasks in a Real Time Operating System (RTOS). The necessity of using an RTOS occurred from the need to read and compute sensor values with higher precision and data transmission.
To monitor the rider’s position continuously, a GPS module from Adafruit was used. This device has a sensitivity of -165 dB, 10 readings per second, 66 channels, and the possibility to receive signals from 22 satellites with its own integrated antenna. The latitude and longitude are sent via a FTDI USB-TTL converter to the Raspberry Pi.
2.3. Software
Figure 4. Bike frame module wiring diagram.
2.3. Software
This project was built using multiple programming languages and technologies, addressingdifferent parts and modules.
The users can interact with the system using two applications: An Android app and a web app.Riders can only use the first application while both riders and trainers can use the second app. Theuser’s use cases diagram is presented in Figure 5.
In the following sections, the software implementation is explained, alongside the usedtechnologies for each module.

Sensors 2020, 20, 1473 8 of 27
Sensors 2020, 20, x FOR PEER REVIEW 8 of 27
This project was built using multiple programming languages and technologies, addressing different parts and modules.
The users can interact with the system using two applications: An Android app and a web app. Riders can only use the first application while both riders and trainers can use the second app. The user’s use cases diagram is presented in Figure 5.
Figure 5. Connected bike use cases.
In the following sections, the software implementation is explained, alongside the used technologies for each module.
2.4. The Pedal Software Module
The main component for this module is an Arduino Micro, detailed in the previous hardware chapter. The open source libraries used to implement the software for this microcontroller are HX711.h and IRemote.h. The first one allows interfacing with the HX711 load cell driver while the second one was used for sending encoded message with the infrared LED. The setup function from the Arduino sketch initializes the pin connected to the IR LED and attaches a rising edge interrupt as well as an interrupt service routine to be dispatched on each event. Following this, a HX711 driver initialization and calibration sequence is executed.
Once the setup is complete, the loop function is called, reading the sensors in an infinite loop. The load cell reading is performed by the get_units function from the library mentioned above. The returned value of this function is converted from lbs. to kg and scaled by 10 for a single decimal precision as seen in equation (1). val kg = (val lbs ∙ 0.453592) ∙ 0.4 (1)
The readings are stored in a three values circular buffer holding the highest values read during a complete pedal cycle. Once the pedal reaches a full rotation and comes next to the magnet placed
Figure 5. Connected bike use cases.
2.4. The Pedal Software Module
The main component for this module is an Arduino Micro, detailed in the previous hardwarechapter. The open source libraries used to implement the software for this microcontroller are HX711.hand IRemote.h. The first one allows interfacing with the HX711 load cell driver while the second onewas used for sending encoded message with the infrared LED. The setup function from the Arduinosketch initializes the pin connected to the IR LED and attaches a rising edge interrupt as well as aninterrupt service routine to be dispatched on each event. Following this, a HX711 driver initializationand calibration sequence is executed.
Once the setup is complete, the loop function is called, reading the sensors in an infinite loop.The load cell reading is performed by the get_units function from the library mentioned above. Thereturned value of this function is converted from lbs. to kg and scaled by 10 for a single decimalprecision as seen in Equation (1).
val[kg] = (val[lbs]·0.453592)·0.4 (1)
The readings are stored in a three values circular buffer holding the highest values read during acomplete pedal cycle. Once the pedal reaches a full rotation and comes next to the magnet placed onthe frame, the Hall Effect sensor triggers an interrupt on pin 7, therefore triggering the correspondinginterrupt routine. This function computes the average between the values from the buffer, sets thetransmission flag and clears the buffer. In the loop function, on each iteration, the transmission flag ischecked and if it is set, then the previously computed average is serialized and sent via USB to theRaspberry Pi.

Sensors 2020, 20, 1473 9 of 27
2.5. The Frame Module
The code for the Arduino Mega 2560 in this module is structured in multiple files with the .cppand .h extensions. The software architecture for the frame module is presented in Figure 6.
Sensors 2020, 20, x FOR PEER REVIEW 9 of 27
on the frame, the Hall Effect sensor triggers an interrupt on pin 7, therefore triggering the corresponding interrupt routine. This function computes the average between the values from the buffer, sets the transmission flag and clears the buffer. In the loop function, on each iteration, the transmission flag is checked and if it is set, then the previously computed average is serialized and sent via USB to the Raspberry Pi.
2.5. The Frame Module
The code for the Arduino Mega 2560 in this module is structured in multiple files with the .cpp and .h extensions. The software architecture for the frame module is presented in Figure 6.
Figure 6. Software architecture.
The code structure and the data manipulation follow a custom-made structure, following guides and patterns from an automotive. Thus, as seen in the above figure, the data transmission and the functionalities are decoupled, data travelling from one component to another through a virtual medium named the Runtime Environment, implementing an AUTOSAR-like (Automotive Open System Architecture) architecture, adapted to the application’s context and simplified. The code is structured in four abstraction layers:
• Basic Software—this level is dedicated to hardware interaction between the microcontroller and its connected peripherals. Here can be found the libraries used to interface the sensors and drivers and also the interrupt service routines
• Runtime Environment—as the name suggests, this is a software medium, which only exists at runtime. This holds global variables and value buffers used to update and send data between abstraction layers creating the actual decoupling between layers
• Application Layer—represents the business logic of the program and includes all the functions for computing speed, cadence and pedal power. The raw sensor data is received via runtime environment from the hardware layer, and the computed values are returned back to the RTE from where will they be taken by the transmission function, sending them over USB to the Raspberry Pi
• RTOS (Real-Time Operating System)—is the component in charge of the entire program’s execution flow, triggering three periodic tasks based on the priority and task periodicity
Figure 6. Software architecture.
The code structure and the data manipulation follow a custom-made structure, following guidesand patterns from an automotive. Thus, as seen in the above figure, the data transmission andthe functionalities are decoupled, data travelling from one component to another through a virtualmedium named the Runtime Environment, implementing an AUTOSAR-like (Automotive OpenSystem Architecture) architecture, adapted to the application’s context and simplified. The code isstructured in four abstraction layers:
• Basic Software—this level is dedicated to hardware interaction between the microcontroller andits connected peripherals. Here can be found the libraries used to interface the sensors and driversand also the interrupt service routines
• Runtime Environment—as the name suggests, this is a software medium, which only exists atruntime. This holds global variables and value buffers used to update and send data betweenabstraction layers creating the actual decoupling between layers
• Application Layer—represents the business logic of the program and includes all the functionsfor computing speed, cadence and pedal power. The raw sensor data is received via runtimeenvironment from the hardware layer, and the computed values are returned back to the RTE fromwhere will they be taken by the transmission function, sending them over USB to the Raspberry Pi
• RTOS (Real-Time Operating System)—is the component in charge of the entire program’s executionflow, triggering three periodic tasks based on the priority and task periodicity
• When powering up the microcontroller, the infrared receiver library is instantiated and the setupfunction is called. Here the following functions are triggered:
• initPinout—initialize pins 48 and 49 for the two Hall effect sensors• set the pins as digital inputs• activate the pull-up resistor

Sensors 2020, 20, 1473 10 of 27
• initTimers—timers 4 and 5• reset the TCCRnA (n = 4,5) registers• set the prescaler to 1024• set the capture and overflow interrupt• reset the interrupt flag register• irrecv.enableIRIn—activate the infrared receiver• xTaskCreate—create three tasks for the RTOS and set the execution priority for each• sei—activate global interrupts• vTaskStartScheduler—start scheduling component from the RTOS in charge of periodically calling
the tasks based on the priority
The initPinout and initTimers macros initialize the pins and timers used by the program and areplaced in a separate header file called ucActuatorInit__hh.h using the #define directive.
The IRrecv library for the infrared receiver is instantiated at the beginning and is activated by theenableIRIn function. After creating an instance, the object reads in the background the data from theKY-022 module and updates the global results variable, of type decode_results.
In order to compute the speed and cadence, the timers four and five are used. When initialized,the timers are configured to use in normal mode and the capture mode is activated. This means thateach timer will increment the TCNTn (Timer Counter Register n = 4, 5) starting from 0 to the maximumvalue of 65535, and once it reaches this value, the register is reset. Each timer has an allocated pin forthe capture mode (pins 48 and 49). Thus, by enabling this mode, the pins’ functionality is also changed,allowing them to trigger interrupts on events such as a Hall Effect sensor’s impulse, capturing theTCNT’s current value in a separate register ICR (Interrupt Capture Register), and an interrupt serviceroutine is dispatched. The timer’s working principle is presented in Figure 7, presenting a normalmode of operation and three interrupts on Interrupt Capture Pin.
Sensors 2020, 20, x FOR PEER REVIEW 10 of 27
• When powering up the microcontroller, the infrared receiver library is instantiated and the setup function is called. Here the following functions are triggered:
• initPinout—initialize pins 48 and 49 for the two Hall effect sensors • set the pins as digital inputs • activate the pull-up resistor • initTimers—timers 4 and 5 • reset the TCCRnA (n = 4,5) registers • set the prescaler to 1024 • set the capture and overflow interrupt • reset the interrupt flag register • irrecv.enableIRIn—activate the infrared receiver • xTaskCreate—create three tasks for the RTOS and set the execution priority for each • sei—activate global interrupts • vTaskStartScheduler—start scheduling component from the RTOS in charge of
periodically calling the tasks based on the priority The initPinout and initTimers macros initialize the pins and timers used by the program and are
placed in a separate header file called ucActuatorInit__hh.h using the #define directive. The IRrecv library for the infrared receiver is instantiated at the beginning and is activated by
the enableIRIn function. After creating an instance, the object reads in the background the data from the KY-022 module and updates the global results variable, of type decode_results.
In order to compute the speed and cadence, the timers four and five are used. When initialized, the timers are configured to use in normal mode and the capture mode is activated. This means that each timer will increment the TCNTn (Timer Counter Register n = 4, 5) starting from 0 to the maximum value of 65535, and once it reaches this value, the register is reset. Each timer has an allocated pin for the capture mode (pins 48 and 49). Thus, by enabling this mode, the pins’ functionality is also changed, allowing them to trigger interrupts on events such as a Hall Effect sensor’s impulse, capturing the TCNT’s current value in a separate register ICR (Interrupt Capture Register), and an interrupt service routine is dispatched. The timer’s working principle is presented in Figure 7, presenting a normal mode of operation and three interrupts on Interrupt Capture Pin.
Figure 7. Timer’s working principle.
Both the timer 4 and timer 5 routines implement the same operations. First, the tick count is read, then using the tick count from the last interrupt, the elapsed ticks between two consecutive interrupts are determined, using equation (2), and the result is stored in a circular 10 values buffer from the runtime environment. = ( ) ( 1) (2)
where k refers to current ticks and (k-1) to previous ticks. In the case where the current timer value reading is lower than the previous one, the tick count
will be determined with equation (3). t = 65535 i (k 1) i (k) (3)
The SensorsModule.cpp file holds the functions to calculate the speed, cadence and power. These functions take the value buffers as parameters and compute the average for the entire set. The value
Figure 7. Timer’s working principle.
Both the timer 4 and timer 5 routines implement the same operations. First, the tick count is read,then using the tick count from the last interrupt, the elapsed ticks between two consecutive interruptsare determined, using Equation (2), and the result is stored in a circular 10 values buffer from theruntime environment.
ttimer = i2(k) − i1(k− 1) (2)
where k refers to current ticks and (k−1) to previous ticks.In the case where the current timer value reading is lower than the previous one, the tick count
will be determined with Equation (3).
ttimer = 65535− i2(k− 1) + i3(k) (3)
The SensorsModule.cpp file holds the functions to calculate the speed, cadence and power. Thesefunctions take the value buffers as parameters and compute the average for the entire set. The value

Sensors 2020, 20, 1473 11 of 27
buffers from RTE are defined as volatile ensuring atomic access and data consistency. The speedcomputing function determines the bicycle’s speed implementing as in Equation (4).
vwheel =Cwheel
t·3.6·10 (4)
where vwheel represents the actual wheel speed, Cwheel is the wheel circumference in [mm], and t is thetime necessary for rotation in [ms]. The value 3.6 is the 1 m/s converted in 3.6 km/h, and the value 10 isthe scaling preventing from working with float values.
Similar to the previous function, the cadence calculus follows Equation (5).
Cadence =time
(timerTicksAvg·64)1000
(5)
where time is measured in [ms], while timerTicksAvg in [µs].The power computing function, in contrast to the previous ones presented above, receives both
the 10 values buffer holding the load cell readings and the current cadence, necessary to determine theangular speed used in the final formula. The instantaneous power is determined with Equation (6).
Ppedal = Fpedal·l·Ω (6)
where Ppedal represents the pedal power, Ppedal the pedal force, l is the crank leg length measured in[cm], and Ω is the angular speed.
At the microcontroller side, the implementation of the power computation is presented in Figure 8.
Sensors 2020, 20, x FOR PEER REVIEW 11 of 27
buffers from RTE are defined as volatile ensuring atomic access and data consistency. The speed computing function determines the bicycle’s speed implementing as in equation (4). =C t ∙ 3.6 ∙ 10 (4)
where vwheel represents the actual wheel speed, Cwheel is the wheel circumference in [mm], and t is the time necessary for rotation in [ms]. The value 3.6 is the 1 m/s converted in 3.6 km/h, and the value 10 is the scaling preventing from working with float values.
Similar to the previous function, the cadence calculus follows equation (5). Cadence = time(timerTicksAvg ∙ 64)1000 (5)
where time is measured in [ms], while timerTicksAvg in [μs]. The power computing function, in contrast to the previous ones presented above, receives both the 10 values buffer holding the load cell readings and the current cadence, necessary to determine the angular speed used in the final formula. The instantaneous power is determined with equation (6). P = F ∙ l ∙ Ω (6)
where Ppedal represents the pedal power, Ppedal the pedal force, l is the crank leg length measured in [cm], and Ω is the angular speed.
At the microcontroller side, the implementation of the power computation is presented in Figure 8.
Figure 8. C code implementation of power computing.
The most important software part implemented on the Arduino Mega is the real time operating system. It completely replaces the implicit function loop with periodically executed tasks. At the core of this framework stands the task scheduler. This component dispatches tasks based on their period and priority.
For this project, the FreeRTOS library was used, developed as open source under the MIT license [23]. In order for the library to work on most microcontrollers available on the market, the timer used to determine when a task should be dispatched is the watchdog timer. In addition, because some of the microcontrollers including Arduino only have a single priority level, the library implemented an abstraction layer exposing four virtual priority levels.
In the ucActuator.ino file, inside the setup function, three tasks are created with different periods and priorities, using the xTaskCreate from the FreeRTOS library as follows: • shortTask
- 17.5 ms execution period - Highest priority - Continuously interrogates the infrared receiver and saves the values to the RTE buffer and
performs the same for the pedal load cell - Operations implemented in this task have the shortest execution time
• mediumTask
- 87.5 ms execution period - Medium priority - Calls the functions that compute the speed, cadence and power and returns the results back
to the RTE
Figure 8. C code implementation of power computing.
The most important software part implemented on the Arduino Mega is the real time operatingsystem. It completely replaces the implicit function loop with periodically executed tasks. At the coreof this framework stands the task scheduler. This component dispatches tasks based on their periodand priority.
For this project, the FreeRTOS library was used, developed as open source under the MITlicense [23]. In order for the library to work on most microcontrollers available on the market, the timerused to determine when a task should be dispatched is the watchdog timer. In addition, because someof the microcontrollers including Arduino only have a single priority level, the library implemented anabstraction layer exposing four virtual priority levels.
In the ucActuator.ino file, inside the setup function, three tasks are created with different periodsand priorities, using the xTaskCreate from the FreeRTOS library as follows:
• shortTask
- 17.5 ms execution period- Highest priority- Continuously interrogates the infrared receiver and saves the values to the RTE buffer and
performs the same for the pedal load cell- Operations implemented in this task have the shortest execution time
• mediumTask
Sensors 2020, 20, 1473 12 of 27
- 87.5 ms execution period- Medium priority- Calls the functions that compute the speed, cadence and power and returns the results
back to the RTE- Operations performed in this task have a medium execution time
• longTask
- 175 ms execution period- Lowest priority- Checks if the timers used for speed and cadence overflowed more than twice, meaning the
movement stopped and sets the corresponding values to 0- Calls the function that transmits the serialized data via USB to the Raspberry Pi- Data serialization to byte array and data transmission take the longest time
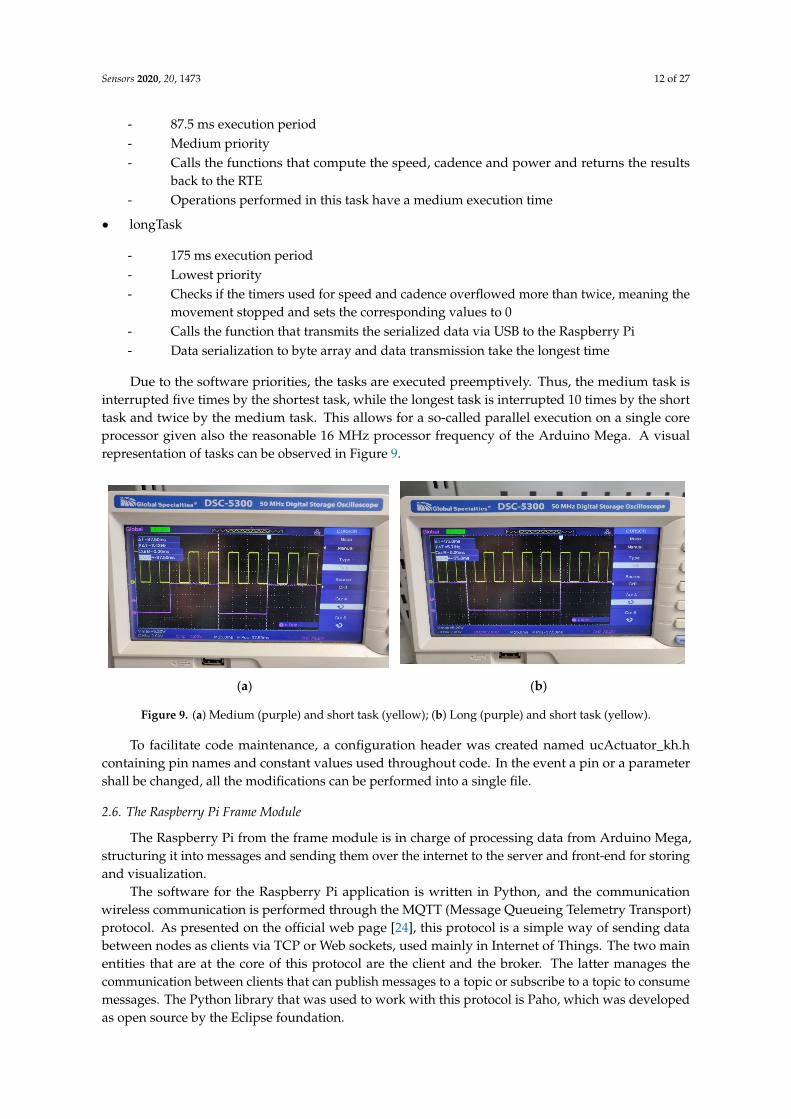
Due to the software priorities, the tasks are executed preemptively. Thus, the medium task isinterrupted five times by the shortest task, while the longest task is interrupted 10 times by the shorttask and twice by the medium task. This allows for a so-called parallel execution on a single coreprocessor given also the reasonable 16 MHz processor frequency of the Arduino Mega. A visualrepresentation of tasks can be observed in Figure 9.
Sensors 2020, 20, x FOR PEER REVIEW 12 of 27
- Operations performed in this task have a medium execution time
• longTask - 175 ms execution period - Lowest priority - Checks if the timers used for speed and cadence overflowed more than twice, meaning the
movement stopped and sets the corresponding values to 0 - Calls the function that transmits the serialized data via USB to the Raspberry Pi - Data serialization to byte array and data transmission take the longest time Due to the software priorities, the tasks are executed preemptively. Thus, the medium task is
interrupted five times by the shortest task, while the longest task is interrupted 10 times by the short task and twice by the medium task. This allows for a so-called parallel execution on a single core processor given also the reasonable 16 MHz processor frequency of the Arduino Mega. A visual representation of tasks can be observed in Figure 9.
(a) (b)
Figure 9. (a) Medium (purple) and short task (yellow); (b) Long (purple) and short task (yellow).
To facilitate code maintenance, a configuration header was created named ucActuator_kh.h containing pin names and constant values used throughout code. In the event a pin or a parameter shall be changed, all the modifications can be performed into a single file.
2.6. The Raspberry Pi Frame Module
The Raspberry Pi from the frame module is in charge of processing data from Arduino Mega, structuring it into messages and sending them over the internet to the server and front-end for storing and visualization.
The software for the Raspberry Pi application is written in Python, and the communication wireless communication is performed through the MQTT (Message Queueing Telemetry Transport) protocol. As presented on the official web page [24], this protocol is a simple way of sending data between nodes as clients via TCP or Web sockets, used mainly in Internet of Things. The two main entities that are at the core of this protocol are the client and the broker. The latter manages the communication between clients that can publish messages to a topic or subscribe to a topic to consume messages. The Python library that was used to work with this protocol is Paho, which was developed as open source by the Eclipse foundation.
The code was structured by functionalities, in multiple files with the .py extension, also called Python modules. The entry point of the application is the piBrain.py module where two methods are called from the beginning. The first one blocks the program’s execution waiting for an internet connection, returning when one is established. The next method is the main one, where the configuration file appconfig.cfg is parsed and the constants are retrieved. In addition, this method instantiates the MqttRemoteThread class and starts the thread.
The MqttRemote.py module contains the MqttRemoteThread class, which extends the Threading class, allowing it to run in a separate thread. The class implements a state machine, listens
Figure 9. (a) Medium (purple) and short task (yellow); (b) Long (purple) and short task (yellow).
To facilitate code maintenance, a configuration header was created named ucActuator_kh.hcontaining pin names and constant values used throughout code. In the event a pin or a parametershall be changed, all the modifications can be performed into a single file.
2.6. The Raspberry Pi Frame Module
The Raspberry Pi from the frame module is in charge of processing data from Arduino Mega,structuring it into messages and sending them over the internet to the server and front-end for storingand visualization.
The software for the Raspberry Pi application is written in Python, and the communicationwireless communication is performed through the MQTT (Message Queueing Telemetry Transport)protocol. As presented on the official web page [24], this protocol is a simple way of sending databetween nodes as clients via TCP or Web sockets, used mainly in Internet of Things. The two mainentities that are at the core of this protocol are the client and the broker. The latter manages thecommunication between clients that can publish messages to a topic or subscribe to a topic to consumemessages. The Python library that was used to work with this protocol is Paho, which was developedas open source by the Eclipse foundation.
Sensors 2020, 20, 1473 13 of 27
The code was structured by functionalities, in multiple files with the .py extension, also calledPython modules. The entry point of the application is the piBrain.py module where two methodsare called from the beginning. The first one blocks the program’s execution waiting for an internetconnection, returning when one is established. The next method is the main one, where the configurationfile appconfig.cfg is parsed and the constants are retrieved. In addition, this method instantiates theMqttRemoteThread class and starts the thread.
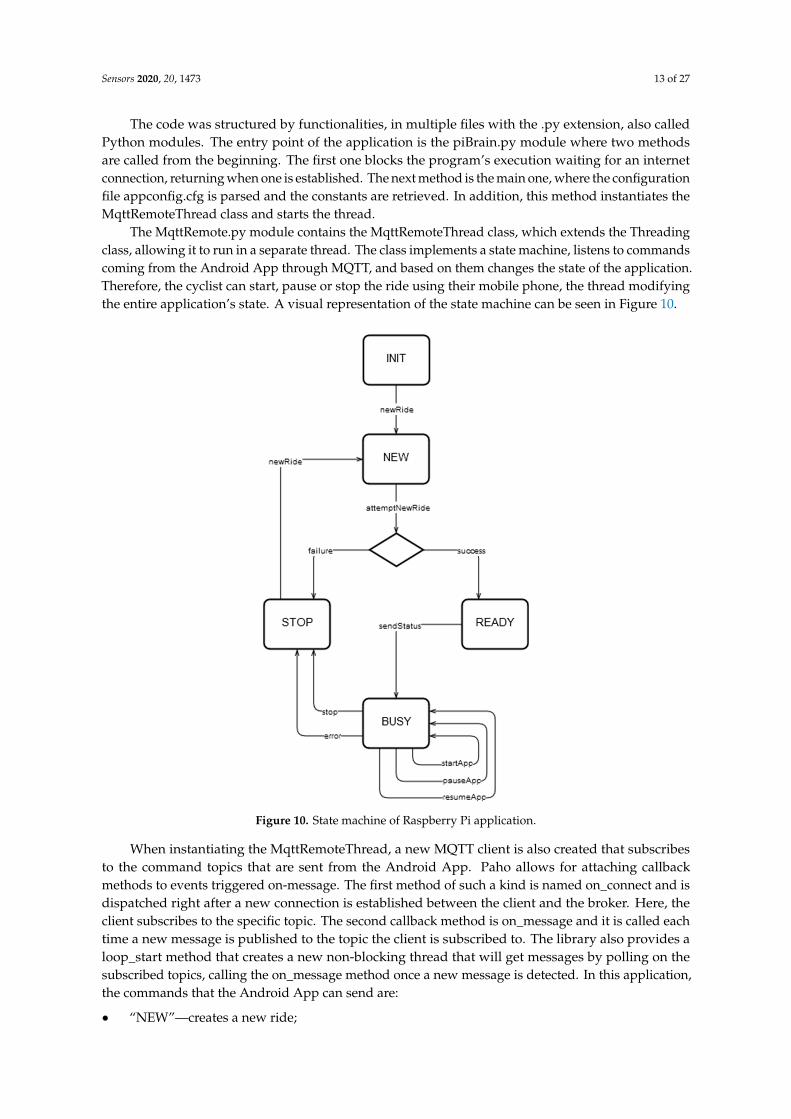
The MqttRemote.py module contains the MqttRemoteThread class, which extends the Threadingclass, allowing it to run in a separate thread. The class implements a state machine, listens to commandscoming from the Android App through MQTT, and based on them changes the state of the application.Therefore, the cyclist can start, pause or stop the ride using their mobile phone, the thread modifyingthe entire application’s state. A visual representation of the state machine can be seen in Figure 10.
Sensors 2020, 20, x FOR PEER REVIEW 13 of 27
to commands coming from the Android App through MQTT, and based on them changes the state of the application. Therefore, the cyclist can start, pause or stop the ride using their mobile phone, the thread modifying the entire application’s state. A visual representation of the state machine can be seen in Figure 10.
Figure 10. State machine of Raspberry Pi application.
When instantiating the MqttRemoteThread, a new MQTT client is also created that subscribes to the command topics that are sent from the Android App. Paho allows for attaching callback methods to events triggered on-message. The first method of such a kind is named on_connect and is dispatched right after a new connection is established between the client and the broker. Here, the client subscribes to the specific topic. The second callback method is on_message and it is called each time a new message is published to the topic the client is subscribed to. The library also provides a loop_start method that creates a new non-blocking thread that will get messages by polling on the subscribed topics, calling the on_message method once a new message is detected. In this application, the commands that the Android App can send are:
• “NEW”—creates a new ride; • “START”—starts the current ride; • “PAUSE” —pauses the current ride, • “RESUME”—resumes the current ride, • “STOP”—end the current ride
A new ride is created by the attemptNewRide method, which performs five tries as POST requests to the server. If the server returns 201 success codes together with the newly created ride’s primary key, then the program saves this id that is afterwards used to save the ride data to the corresponding ride id. If the server fails to create a new ride, then the application changes its state to
Figure 10. State machine of Raspberry Pi application.
When instantiating the MqttRemoteThread, a new MQTT client is also created that subscribesto the command topics that are sent from the Android App. Paho allows for attaching callbackmethods to events triggered on-message. The first method of such a kind is named on_connect and isdispatched right after a new connection is established between the client and the broker. Here, theclient subscribes to the specific topic. The second callback method is on_message and it is called eachtime a new message is published to the topic the client is subscribed to. The library also provides aloop_start method that creates a new non-blocking thread that will get messages by polling on thesubscribed topics, calling the on_message method once a new message is detected. In this application,the commands that the Android App can send are:
• “NEW”—creates a new ride;

Sensors 2020, 20, 1473 14 of 27
• “START”—starts the current ride;• “PAUSE” —pauses the current ride,• “RESUME”—resumes the current ride,• “STOP”—end the current ride
A new ride is created by the attemptNewRide method, which performs five tries as POST requeststo the server. If the server returns 201 success codes together with the newly created ride’s primarykey, then the program saves this id that is afterwards used to save the ride data to the correspondingride id. If the server fails to create a new ride, then the application changes its state to “STOP”, issuingan event through MQTT back to the Android App to inform the user about the failure.
The run method of the MqttRemoteThread class runs in an infinite loop and consists of if statementsthat check if a new command was received, changing the application’s state accordingly. Once in anew state, the application will perform the required operation and then enter a listening state, ready toaccept further commands. This thread is also responsible of sending information back to the AndroidApp to inform the user about the current application’s state.
When a user starts the application and sends the “START” command, the startApp method iscalled from the main thread, which starts three new threads and a thread safe queue object for passingdata between them: serialReadThread, gpsPollingThread, mqttPublisherThread.
The SerialReadThread is implemented in the SerialReader.py module, which extends the Threadingclass and serves the purpose of reading and decoding the data received on the USB bus. On each loopiteration, if the application’s state is “RUNNING”, the serReader method is called to read six bytesfrom the input buffer. The raw data is converted into the actual values for speed, cadence and power,which in turn are formatted into a dictionary object that is added to the thread safe queue from whereit can be read by other threads.
Inside the GpsPolling.py module there is the GpsPollingThread that is also a separateexecution thread where values for latitude and longitude are read using the gps library for Python.The values are updated periodically and stored into a dictionary object, being available through thegetLocation method.
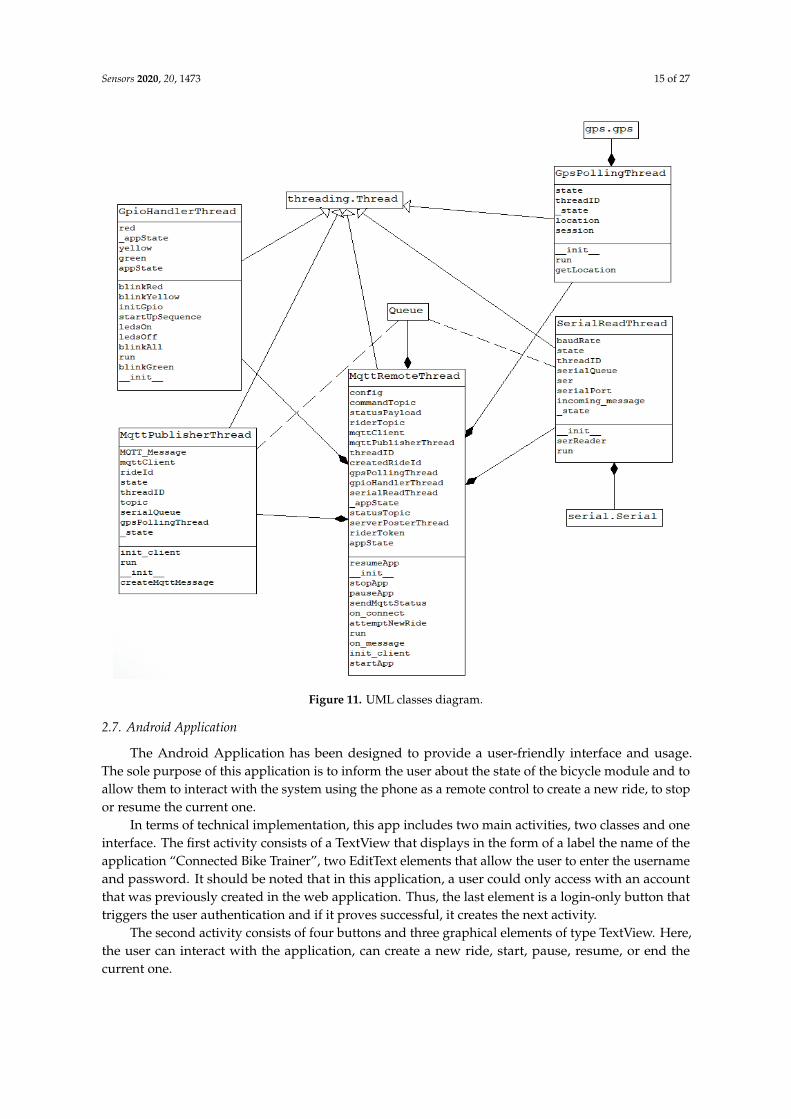
Last but not least, the MqttPublisherThread from the MqttPublisher.py module is the executionthread where the final message is created and is sent over MQTT. The speed, cadence and powervalues as well as the latitude, longitude and the current date-time are retrieved from the thread safequeue object and put together in a JSON message. This message is sent to the cyclist-dependent topic.The way this application’s classes interact is presented in Figure 11, which contains the UML classesdiagram in Pynthon, used in Raspberry Pi.
In order to start the application at boot time, a Linux shell script was created called raspmodule.sh.Here, the Python App’s main module, piBrain.py, is started using its own virtual environment, usingthe local interpreter and libraries. This shell script is triggered when the Raspberry Pi boots thanks theCron utility available also on Debian that reads a crontab file where the script was added.
Sensors 2020, 20, 1473 15 of 27
Sensors 2020, 20, x FOR PEER REVIEW 15 of 27
Figure 11. UML classes diagram.
2.7. Android Application
The Android Application has been designed to provide a user-friendly interface and usage. The sole purpose of this application is to inform the user about the state of the bicycle module and to allow them to interact with the system using the phone as a remote control to create a new ride, to stop or resume the current one.
In terms of technical implementation, this app includes two main activities, two classes and one interface. The first activity consists of a TextView that displays in the form of a label the name of the application “Connected Bike Trainer”, two EditText elements that allow the user to enter the username and password. It should be noted that in this application, a user could only access with an account that was previously created in the web application. Thus, the last element is a login-only button that triggers the user authentication and if it proves successful, it creates the next activity.
The second activity consists of four buttons and three graphical elements of type TextView. Here, the user can interact with the application, can create a new ride, start, pause, resume, or end the current one.
Of the two classes, MqttHandler is responsible for sending commands and receiving status messages from the Raspberry Pi, via the MQTT communication protocol, while the Service class is responsible for communicating with the server via HTTP protocol.
When a user accesses the application, the first activity to be started is the Login one. Attached to the login button in this activity, is a method that will be called when the button is pressed. This
Figure 11. UML classes diagram.
2.7. Android Application
The Android Application has been designed to provide a user-friendly interface and usage.The sole purpose of this application is to inform the user about the state of the bicycle module and toallow them to interact with the system using the phone as a remote control to create a new ride, to stopor resume the current one.
In terms of technical implementation, this app includes two main activities, two classes and oneinterface. The first activity consists of a TextView that displays in the form of a label the name of theapplication “Connected Bike Trainer”, two EditText elements that allow the user to enter the usernameand password. It should be noted that in this application, a user could only access with an accountthat was previously created in the web application. Thus, the last element is a login-only button thattriggers the user authentication and if it proves successful, it creates the next activity.
The second activity consists of four buttons and three graphical elements of type TextView. Here,the user can interact with the application, can create a new ride, start, pause, resume, or end thecurrent one.

Sensors 2020, 20, 1473 16 of 27
Of the two classes, MqttHandler is responsible for sending commands and receiving statusmessages from the Raspberry Pi, via the MQTT communication protocol, while the Service class isresponsible for communicating with the server via HTTP protocol.
When a user accesses the application, the first activity to be started is the Login one. Attached tothe login button in this activity, is a method that will be called when the button is pressed. This method,attemptLogin, performs the necessary operations to validate the account data end and prevents sendingerroneous data to the server such as blank credentials, or special characters. If the validation passes,the UserLoginTask class is instantiated and the execute method is called. This class, representing anasynchronous task, extends the AsyncTask class and contains four methods. The onPreExecute methodis automatically called first and it makes the loading component available on the phone’s screen. Next,the doInBackground method is called, which has the role of logging the user into the applicationasynchronously. This is the main component of this task, executing the instructions in a separatethread without blocking the main thread or the graphical user interface. Here, the RequestLoginmethod is called from the Services class, sending the username, password and an instance of theRestCallback as parameters. onSuccess, onFailure and onNotRider are the three interface methodsthat are asynchronously called based on the server’s response. If the login I is successful, the currentactivity is replaced by the RiderActivity, which is the core of this application.
The Services class is utilized just by the login activity, implementing the RequestLogin andRequestUserData methods. The first one creates a JSON object with the user’s credentials and makes aPOST request to the server. The returned response is valid and successful if it has the “token” field,representing the authorization key. Moreover, if the logged-in user is a cyclist, the onSuccess methodis called, otherwise the onNotRider is dispatched, displaying a message to inform the user that onlycyclists can use this Android Application to control their rides. The second method performs a GETrequest to the server, using the token received from the previous request and the response is valid if itcontains the “topic” field. The synchronization between the asynchronous tasks and the executionthreads is done with a CountDownLatch instance that has also been configured with a 5 s timeout toprevent blocking connections.
The methods by which the user can interact with the bicycle system are implemented inRiderActivity. The four buttons available to the user have those methods attached in order tosend messages and change the state of the frame module application, running on the Raspberry Pi.This is possible by calling the sendCommand method implemented in the MqttHandler class. Here,the command is converted to JSON and sent on the dedicated command topic to the frame module.Also, being a two-way communication between the Android App and the Raspberry Pi on the bicycle,in order to receive and display information about the state of the frame module, when the eclipse.paholibrary is initialized, event handlers are attached for events such as lost connection or successfulmessage delivery. When a new message is received from the frame module, the messageArrived iscalled, retrieving it and sending it for displaying in the RiderActivity to inform the cyclist regardingthe application’s state. The MQTT connection to the broker is established in the constructor of theMqttHandler class. For a better understanding of the Android Application, a UML class diagram wasdeveloped, shown in Figure 12.

Sensors 2020, 20, 1473 17 of 27
Sensors 2020, 20, x FOR PEER REVIEW 17 of 27
Figure 12. UML class diagram in Android application.
2.9. Back-End
The Back-End component is the one that directly accesses the database and implements the logic behind the web interface so that the data requested in the application is formatted and sent to the requester. In this project, the Back-End serves both the Front-End of the application and the Android Application. The communication protocol is HTTP, currently being one of the most used data transmission protocols over the internet.
The programming language in which the Back-End part was implemented is Python 3.6, using the open-source flask and flask-restful libraries. The design pattern used is Model-View-Controller (MVC), but only the Model and Controller are implemented on the Back-End side, because the Front-End is in charge of the View. In the development of the Back-End, the steps in the tutorial [25] have been followed and adapted.
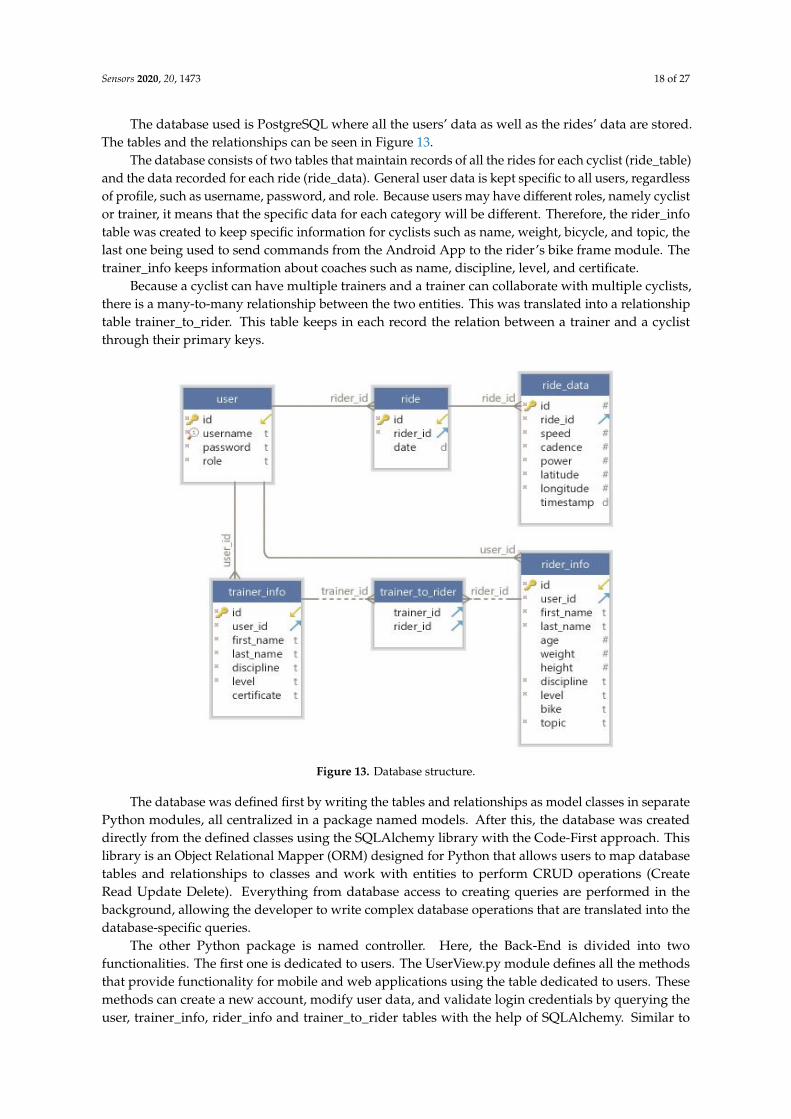
The database used is PostgreSQL where all the users’ data as well as the rides’ data are stored. The tables and the relationships can be seen in Figure 13.
The database consists of two tables that maintain records of all the rides for each cyclist (ride_table) and the data recorded for each ride (ride_data). General user data is kept specific to all users, regardless of profile, such as username, password, and role. Because users may have different roles, namely cyclist or trainer, it means that the specific data for each category will be different. Therefore, the rider_info table was created to keep specific information for cyclists such as name, weight, bicycle, and topic, the last one being used to send commands from the Android App to the rider’s bike frame module. The trainer_info keeps information about coaches such as name, discipline, level, and certificate.
Because a cyclist can have multiple trainers and a trainer can collaborate with multiple cyclists, there is a many-to-many relationship between the two entities. This was translated into a relationship table trainer_to_rider. This table keeps in each record the relation between a trainer and a cyclist through their primary keys.
Figure 12. UML class diagram in Android application.
2.8. The Server
As most IoT systems, the Connected Bike project also has a server, which in this case consistsof two main parts. The first part is the MQTT broker, which is necessary for the intermediation ofmessages between clients, while the second part is the Back-End for the web application, having boththe role of persisting data transmitted from the bicycle and providing functionality to the Front-End.
Being a vital component in the operation of the entire system, the server must be switched on andhave an uninterrupted Internet connection. The optimal solution was to use a Raspberry Pi 3 ModelB+ to host the server for this project, being both low-cost and reliable. It is always powered on andconnected to the internet, serving both the Back-End and the MQTT broker. In order to be accessible tothe other modules, port forwarding rules were set on the router to which the Raspberry Pi is connectedand the device received a static IP in the Local Area Network. Therefore, the other components ofthe system are able to access the services available on the server using the public IP of the router andthe specified port. Next, are presented the two components that run on the server explaining them inmore detail.
2.9. Back-End
The Back-End component is the one that directly accesses the database and implements thelogic behind the web interface so that the data requested in the application is formatted and sentto the requester. In this project, the Back-End serves both the Front-End of the application and theAndroid Application. The communication protocol is HTTP, currently being one of the most used datatransmission protocols over the internet.
The programming language in which the Back-End part was implemented is Python 3.6, using theopen-source flask and flask-restful libraries. The design pattern used is Model-View-Controller (MVC),but only the Model and Controller are implemented on the Back-End side, because the Front-End isin charge of the View. In the development of the Back-End, the steps in the tutorial [25] have beenfollowed and adapted.
Sensors 2020, 20, 1473 18 of 27
The database used is PostgreSQL where all the users’ data as well as the rides’ data are stored.The tables and the relationships can be seen in Figure 13.
The database consists of two tables that maintain records of all the rides for each cyclist (ride_table)and the data recorded for each ride (ride_data). General user data is kept specific to all users, regardlessof profile, such as username, password, and role. Because users may have different roles, namely cyclistor trainer, it means that the specific data for each category will be different. Therefore, the rider_infotable was created to keep specific information for cyclists such as name, weight, bicycle, and topic, thelast one being used to send commands from the Android App to the rider’s bike frame module. Thetrainer_info keeps information about coaches such as name, discipline, level, and certificate.
Because a cyclist can have multiple trainers and a trainer can collaborate with multiple cyclists,there is a many-to-many relationship between the two entities. This was translated into a relationshiptable trainer_to_rider. This table keeps in each record the relation between a trainer and a cyclistthrough their primary keys.Sensors 2020, 20, x FOR PEER REVIEW 18 of 27
Figure 13. Database structure
The database was defined first by writing the tables and relationships as model classes in separate Python modules, all centralized in a package named models. After this, the database was created directly from the defined classes using the SQLAlchemy library with the Code-First approach. This library is an Object Relational Mapper (ORM) designed for Python that allows users to map database tables and relationships to classes and work with entities to perform CRUD operations (Create Read Update Delete). Everything from database access to creating queries are performed in the background, allowing the developer to write complex database operations that are translated into the database-specific queries.
The other Python package is named controller. Here, the Back-End is divided into two functionalities. The first one is dedicated to users. The UserView.py module defines all the methods that provide functionality for mobile and web applications using the table dedicated to users. These methods can create a new account, modify user data, and validate login credentials by querying the user, trainer_info, rider_info and trainer_to_rider tables with the help of SQLAlchemy. Similar to UserView.py, the RideView.py module contains all the methods dedicated to rides and rides data respectively, performing queries on the ride and ride_data tables. All the functions described above have a decorator that specifies the URL path and the type of REST (Representational state transfer) method through which they can be accessed remotely. Also, some methods may have more decorators depending on the access level. For example, the delete_ride method has both the @Auth.auth_required decorator, which allows it to be called only if the request has a token corresponding to an authenticated user, and the @Auth.rider_required decorator, which checks if the requester is a cyclist. These decorators are in fact other methods called implicitly to verify various requirements, such as whether the user is authenticated or has a certain role to access a resource. If the access criteria are satisfied, the decorated method will perform its task. All the decorators as well as the methods used to generate and decode JWT tokens are in the Authentication.py module. The encryption algorithm is SHA-256 and the Unicode standard is UTF-8.
In order for all the Back-End methods written in Python and described above to be remotely accessible over the Internet, a Web Server Gateway Interface (WSGI) is required. This mechanism
Figure 13. Database structure.
The database was defined first by writing the tables and relationships as model classes in separatePython modules, all centralized in a package named models. After this, the database was createddirectly from the defined classes using the SQLAlchemy library with the Code-First approach. Thislibrary is an Object Relational Mapper (ORM) designed for Python that allows users to map databasetables and relationships to classes and work with entities to perform CRUD operations (CreateRead Update Delete). Everything from database access to creating queries are performed in thebackground, allowing the developer to write complex database operations that are translated into thedatabase-specific queries.
The other Python package is named controller. Here, the Back-End is divided into twofunctionalities. The first one is dedicated to users. The UserView.py module defines all the methodsthat provide functionality for mobile and web applications using the table dedicated to users. Thesemethods can create a new account, modify user data, and validate login credentials by querying theuser, trainer_info, rider_info and trainer_to_rider tables with the help of SQLAlchemy. Similar to

Sensors 2020, 20, 1473 19 of 27
UserView.py, the RideView.py module contains all the methods dedicated to rides and rides datarespectively, performing queries on the ride and ride_data tables. All the functions described abovehave a decorator that specifies the URL path and the type of REST (Representational state transfer)method through which they can be accessed remotely. Also, some methods may have more decoratorsdepending on the access level. For example, the delete_ride method has both the @Auth.auth_requireddecorator, which allows it to be called only if the request has a token corresponding to an authenticateduser, and the @Auth.rider_required decorator, which checks if the requester is a cyclist. These decoratorsare in fact other methods called implicitly to verify various requirements, such as whether the user isauthenticated or has a certain role to access a resource. If the access criteria are satisfied, the decoratedmethod will perform its task. All the decorators as well as the methods used to generate and decodeJWT tokens are in the Authentication.py module. The encryption algorithm is SHA-256 and theUnicode standard is UTF-8.
In order for all the Back-End methods written in Python and described above to be remotelyaccessible over the Internet, a Web Server Gateway Interface (WSGI) is required. This mechanismhandles all the HTTP requests coming from the Internet, routing them to the appropriate methodsfrom the local machine. For this application, a WSGI server called Gunicorn was used, which isspecifically designed to work with the Flask framework. It was configured to work as a daemon withthree workers, so it did not interfere with the other running processes on the machine. These workersare actually threads in a pool, that are assigned per request to route to the corresponding method.
2.10. MQTT Broker
The communication between the MQTT clients was made possible by the Mosquitto broker,developed by Eclipse Foundation and released for public use for free. Once installed and configured,the broker starts as a background process when the Raspberry Pi finishes booting. The settings wereconfigured in the mosquitto.conf file, enforcing the use of a username and password for all MQTTclients in this project for increased security. In addition, two listeners are configured here. The first usesthe 1883 port for TCP/IP connection, which is used both for communication with the frame module andfor sending commands and status information between the frame module and the Android Application.The second listener exposes the 8083 port for websockets connection, used by the Web Applicationfor receiving online ride data from the frame module. Moreover, in this configuration file, the SSLcertificates are also added for a more secure connection and the location where logs from Mosquittobroker will be stored.
2.11. Other Components
In addition to the Back-End and the MQTT broker, there are other auxiliary components thatfulfill various roles on the Raspberry Pi server.
The first component is the Python service that subscribes to the data topic and retrieves ride datamessages transmitted by the bicycle’s frame module and saves it to the database based on the rideid from the message. This service started at the Raspberry Pi’s boot time is waiting for the internetconnection to be established, then it initializes the MQTT client and starts an infinite loop threadwaiting for messages on the connectedbike/data/# topic. The hashtag character is a wildcard, meaningthat all messages that are sent on the topic connectedbike/data/user_id will be received, regardless of theuser id. This is advantageous as the ride_data table does not require a user id but only ride id, and thisid is sent along with the data in the MQTT message.
Another important part of running the Back-End is the reverse proxy component. Its purposeis to hide implementation details and protect the Back-End component. All requests from clientsare received by the reverse proxy that routes them to the WSGI and then routes back the responseto the caller. For this project, NGINX was used as a reverse proxy, being a free and open-sourcesoftware, supported by numerous contributors. After installation, it has been configured in theconnectedbike.conf. Here were defined the access domains, the path to the Back-End, the files for

Sensors 2020, 20, 1473 20 of 27
storing logs, and the server that contains the parameters and the proxy and access control headers.Certbot certificates for SSL encryption are also configured here. Thus, all requests received on thepublic domain connectedbike.cf or www.connectedbike.cf are forwarded by the proxy to the GunicornWSGI serving the Back-End. The operation of this assembly can be seen in Figure 14.
After installation, the NGINX server automatically starts as a daemon service when the RaspberryPi is turned on. Also, at the time of activation, NGINX takes over and sets all the configurationsidentified in the file with the .conf extension from the /etc/nginx/sites-available/ folder, in this casebeing connectedbike.conf.
The third server component is the Cron utility. This is a simple service offered on most Linuxoperating systems. To configure the crontab file, which the service uses as a look-up file for schedulingtasks, the crontab -e command line is called from the command line. For this application, a commandis added to the crontab to run at boot time on the Raspberry Pi and to call the mqttdataposter.shscript. This shell script changes the current working directory to the root of the Application foldercontaining the MqttDataPoster.py. Afterwards, the Application is started from inside its Pythonvirtual environment.Sensors 2020, 20, x FOR PEER REVIEW 20 of 27
Figure 14. NGINX reverse proxy operation scheme.
Both the MQTT Mosquitto broker and the NGINX reverse proxy server are automatically started at boot time and run as background services. Gunicorn, however, does not offer this possibility, which is why a forth auxiliary component is required, namely the creation of a Systemd unit with the .service extension, that handles the activation of the Gunicorn server at boot time. Systemd is a utility offered within the Debian operating system that allows the creation of user-defined services, running in the background. The service created for Gunicorn is called connectedbike.service and consists of three parts.
The first part, defined by the [Unit] tag, contains a description of the service and specifies the dependencies required to run the service. In this case, they are network-online.target and network.target.
The second part represented by the [Service] tag specifies the details for starting the service. Here the following are defined:
• User = pi: the Linux user running the service • Group = www-data: the user group that runs the process • PIDFile = /tmp/gunicorn.pid: the file that stores the process id • Environment=”PATH=/home/pi/Programming/licentabackend/venv/bin” ”FLASK_ENV=production”
”DATABASE_URL=postgres://user:password@localhost:5432/db_licenta_deployment” ”JWT_SECRET_KEY=encodingstring”: the virtual environment for the Back-End and the environment variables
• WorkingDirectory = /home/pi/Programming/licentabackend: the folder in which the Flask application is located
• ExecStart=path_to_directory/venv/bin/gunicorn –workers 3 – access-logfile path_to_directory/logs/gunicorn-access.log –error-logfile path_to_directory/logs/gunicorn-error.log -b localhost:5000 wsgi: the command to be executed when calling the service. This command calls the WSGI file that instantiates the Flask application, using Gunicorn and the virtual environment. The server will start running locally, serving port 5000 with three threads available for handling requests
• ExecReload = /bin/kill -s HUP $MAINPID: specifies how the service can be restarted • ExecStop = /bin/kill -s HUP $MAINPID: specifies how the service can be terminated
The third section defined by the [Install] tag allows the service to be enabled or disabled. So, using the WantedBy=multi-user.target directive, a folder with the same name is created that persists even if the device is restarted and activates the service at boot time. In order for the service to be active and running every time the Raspberry Pi is started, the shell command sudo systemctl enable connectedbike.service is required. The same command, but replacing the enable keyword with start or stop, can be called to begin or terminate the service.
Last but not least, the Raspberry Pi server has allowed firewall access to the ports required by the application. Also, for a more efficient and user-friendly use, a free domain name (connectedbike.cf) has been assigned to the server’s IP.
Figure 14. NGINX reverse proxy operation scheme.
Both the MQTT Mosquitto broker and the NGINX reverse proxy server are automatically startedat boot time and run as background services. Gunicorn, however, does not offer this possibility,which is why a forth auxiliary component is required, namely the creation of a Systemd unit with the.service extension, that handles the activation of the Gunicorn server at boot time. Systemd is a utilityoffered within the Debian operating system that allows the creation of user-defined services, runningin the background. The service created for Gunicorn is called connectedbike.service and consists ofthree parts.
The first part, defined by the [Unit] tag, contains a description of the service and specifiesthe dependencies required to run the service. In this case, they are network-online.target andnetwork.target.
The second part represented by the [Service] tag specifies the details for starting the service. Herethe following are defined:
• User = pi: the Linux user running the service• Group = www-data: the user group that runs the process• PIDFile = /tmp/gunicorn.pid: the file that stores the process id• Environment=”PATH=/home/pi/Programming/licentabackend/venv/bin”
”FLASK_ENV=production” ”DATABASE_URL=postgres://user:password@localhost:5432/db_licenta_deployment” ”JWT_SECRET_KEY=encodingstring”: the virtual environment for theBack-End and the environment variables
• WorkingDirectory = /home/pi/Programming/licentabackend: the folder in which the Flask applicationis located

Sensors 2020, 20, 1473 21 of 27
• ExecStart=path_to_directory/venv/bin/gunicorn –workers 3 – access-logfile path_to_directory/logs/gunicorn-access.log –error-logfile path_to_directory/logs/gunicorn-error.log -b localhost:5000 wsgi: the command to be executed when calling the service. This command calls the WSGIfile that instantiates the Flask application, using Gunicorn and the virtual environment. The serverwill start running locally, serving port 5000 with three threads available for handling requests
• ExecReload = /bin/kill -s HUP $MAINPID: specifies how the service can be restarted• ExecStop = /bin/kill -s HUP $MAINPID: specifies how the service can be terminated
The third section defined by the [Install] tag allows the service to be enabled or disabled. So,using the WantedBy=multi-user.target directive, a folder with the same name is created that persistseven if the device is restarted and activates the service at boot time. In order for the service to beactive and running every time the Raspberry Pi is started, the shell command sudo systemctl enableconnectedbike.service is required. The same command, but replacing the enable keyword with start orstop, can be called to begin or terminate the service.
Last but not least, the Raspberry Pi server has allowed firewall access to the ports required by theapplication. Also, for a more efficient and user-friendly use, a free domain name (connectedbike.cf)has been assigned to the server’s IP.
2.12. Web Application
In this project, the web application has the role of displaying in a clear and easy way the dataread by the module on the bicycle, giving the trainer the possibility to monitor the evolution of acyclist online. In addition, the application offers the possibility of both categories of users to analyzeprevious rides. Also from the app, users can register a new account, login or connect with each otherfor collaboration. To achieve this, the ReactJS Javascript framework, developed and released free byFacebook, was used.
The application uses multiple components and elements to achieve the desired graphical userinterface and user experience. For an easier state management, the react-redux library was used. Itallows for centralizing the state for the entire application and passing only parts of it to componentsthat specifically need them. The global application state can be modified only by functions namedreducers. They receive as a parameter the current state of the application and the action based onwhich the decision to change the global state is taken.
For the implementation of this application, the tutorial presented by Jason Watmore in [26] isfollowed. The structure is divided into pages, auxiliary components and Redux components. In total,there are five pages: LoginPage, RegisterPage, RiderPage, TrainerPage and MonitoringPage. Thesein turn contain sub-pages, components rendered in the main page, which change according to theselected tab in the left-side menu. This allows conditional display of several different information,using the same URL. The user interface (buttons, labels, graphic elements) was created with the help ofthe MaterialUI library, which offers a wide range of free graphic elements. The monitoring page isaccessible by both the trainer and the cyclist, being the place where the data is displayed, whetherthey come online or are uploaded from the Back-End. When the monitoring page is rendered in thebrowser, a props check is performed. If a ride id is found, then a function is called to bring the datathrough a GET request to the server. In the absence of a ride id, riderTopic is received in the props andthe component subscribes to this topic to receive the data from the bicycle frame module in real time.To receive data through MQTT, the paho-mqtt library for React is used and the protocol supported byJavaScript is Websockets, which is why the broker on the server exposes both TCP/IP connection portand a Websocket connection port.
Because the data from the bicycle is transmitted and records each second, the number of entriesin the database increases drastically. Thus, for the data to be fully displayed and analyzed, withoutoccupying a large portion of the graphical interface, the Highcharts library for React was used. ThreeHighcharts charts were configured with this, one for speed, one for cadence and one for power. To eachchart was attached a Navigator element available in the library that allows selection of a portion from a

Sensors 2020, 20, 1473 22 of 27
large data set and the graphical visualization of that part only, thus facilitating a thorough study of theride in more detail. Also on the monitoring page was added a map using the GoogleMaps library forReact, that displays markers with latitude and longitude received from the GPS module on the bicycle.
The components folder also includes AlertBar.js, which is used to display labels with varioususer information about in-app events such as failed login or failed connection to Back-End. Also herehave been defined a set of constants for enforcing private routes, respectively limiting access to theapplication for users who have not logged in. So, anyone can access the Login or Register page, butonly users who have logged in and received an authorization token from the server can navigatethrough the rest of the application. In addition, these constants decide based on the response from theserver whether the user is a cyclist or coach and redirects it to the appropriate page.
Finally, yet importantly, the Redux part is composed of three parts:
1. Actions—here are the functions that can be called to change the overall state of the application.These have been divided into functionalities for user, rider, trainer, and alert. Within them, inaddition to the implemented logic, is called the dispatch method in which a constant is sent as aparameter, which is respectively the part of the global state that must be modified;
2. Constants—here are defined the constants based on which the behavior of the global state isdecided. Similar to actions, constants are also divided into functionalities for user, trainer, rider,and alert;
3. Reducers—represent the functions that perform the actual change of the global state. They arecalled with the initial state or the action as parameters. Based on one of the constants in pointtwo, which is transmitted in the body of the action, the state is modified with the new value sentin the body of the action;
The engine behind these three parts is the store. It is created using the createStore function in theredux library. This function is called with a set of parameters such as persistedReducer or middleware.In order to maintain the entire state of the application, even after the user refreshes the browser page,the redux-persist library is used. With it, the entire status hierarchy of the application is saved in LocalStorage as JSON, where it can be retrieved again after refreshing the web page.
In the application development stage, the Node.js server was used. It has the role of running alocal instance (localhost) at a predefined port, in this case, port 3000, where the developer can observethe changes made to the code. To expose the application on the internet and for anyone to access it, thenpm run build command was run, creating a new build folder containing all the files and packagesneeded to run the application in production. This build was uploaded for free to Netlify, making itaccessible to everyone on the internet.
3. Results
The main distinguishing features of the system are presented in the following:
• The architecture of the project allows the system to be divided into dedicated modules, eachimplementing both data computing and transmission operations. This approach offers theadvantage of reducing computational demand on a single module by distributing specificoperations such as conversions or scaling to each module separately;
• By using a real-time operating system on the Arduino Mega from the bicycle frame module, aclear definition of the tasks and their separation according to the fixed duration are obtained;
• The data transmission between the pedal module to the frame module is done via infraredcommunication, overcoming the wires limitation imposed by the two rotational couplings frompedal to bike frame;
• In order to use a single three-wire load cell, it was necessary to close the Wheatstone bridge withthe resistors of equal value and minimum tolerances;
• The Raspberry Pi was turned into a control component capable of stopping or starting recordingride activity depending on the commands received from the Android App;

Sensors 2020, 20, 1473 23 of 27
• The MQTT Protocol was used as the main communication medium in the system, being used bothfor transmitting on-line data collected from sensors and for full-duplex communication betweenthe bicycle module and the mobile phone. This reduced the complexity of the transmission andincreased the robustness of the whole assembly;
• Multiple security levels were implemented such as password encryption with secret key, JWTauthorization tokens for Back-End, restricting access to MQTT channels by username and passwordand implementing SSL certificates on the server for both Back-End and MQTT broker;
• The Redux library was used to manage the entire state of the application and its persistence in thelocal memory of the browser so that it is not reset between refreshes.
The pedal module, as mounted on the bicycle, can be seen in Figure 15.Sensors 2020, 20, x FOR PEER REVIEW 23 of 27
Figure 15. The final pedal module.
Also, the frame module, consisting of Arduino Mega 2560, Raspberry Pi 3 Model B+, Hall sensors, infrared receiver, and GPS module from Adafruit is shown in Figure 16.
Figure 16. The resulted bicycle frame module.
In its final form, the hardware part of the frame module has been placed inside a bicycle water bottle and the connection with the sensors is made through an RS-232 connector as shown in Figure 17. This allows the bottle to be disconnected from the electronic components on the frame, leaving the sensors in place.
Figure 15. The final pedal module.
Also, the frame module, consisting of Arduino Mega 2560, Raspberry Pi 3 Model B+, Hall sensors,infrared receiver, and GPS module from Adafruit is shown in Figure 16.
Sensors 2020, 20, x FOR PEER REVIEW 23 of 27
Figure 15. The final pedal module.
Also, the frame module, consisting of Arduino Mega 2560, Raspberry Pi 3 Model B+, Hall sensors, infrared receiver, and GPS module from Adafruit is shown in Figure 16.
Figure 16. The resulted bicycle frame module.
In its final form, the hardware part of the frame module has been placed inside a bicycle water bottle and the connection with the sensors is made through an RS-232 connector as shown in Figure 17. This allows the bottle to be disconnected from the electronic components on the frame, leaving the sensors in place.
Figure 16. The resulted bicycle frame module.

Sensors 2020, 20, 1473 24 of 27
In its final form, the hardware part of the frame module has been placed inside a bicycle waterbottle and the connection with the sensors is made through an RS-232 connector as shown in Figure 17.This allows the bottle to be disconnected from the electronic components on the frame, leaving thesensors in place.
Sensors 2020, 20, x FOR PEER REVIEW 24 of 27
Figure 17. Final form of the Connected Bike
The Android App that allows the cyclist to manage the ride data monitoring is presented in Figure 18.
Figure 18. Android application interface
Last but not least, the web application by which users can create their account, monitor the rides or create connections with each other is shown in Figure 19.
Figure 17. Final form of the Connected Bike
The Android App that allows the cyclist to manage the ride data monitoring is presented inFigure 18.
Sensors 2020, 20, x FOR PEER REVIEW 24 of 27
Figure 17. Final form of the Connected Bike
The Android App that allows the cyclist to manage the ride data monitoring is presented in Figure 18.
Figure 18. Android application interface
Last but not least, the web application by which users can create their account, monitor the rides or create connections with each other is shown in Figure 19.
Figure 18. Android application interface
Last but not least, the web application by which users can create their account, monitor the ridesor create connections with each other is shown in Figure 19.

Sensors 2020, 20, 1473 25 of 27
Sensors 2020, 20, x FOR PEER REVIEW 25 of 27
Figure 19. Web application of the Connected Bike
Finally, using the above modules, both hardware and software, the following requirements were achieved:
• Collecting raw data from the two Hall sensors and from the load cell • Computing the riding speed [km/h] with a precision of two decimals, pedal cadence [rpm] and
instantaneous power from the cyclist [watt] • Track the cyclist’s position in real-time by reading latitude and longitude from the GPS module • Sending with a 1 s period the collected and processed data from sensors to the server to be stored
in the database and for online monitoring • Implementing an Android Application that allows the rider to create a new ride, start or
terminate the current one, and also receive information on the state of the bike’s frame module • Creating a Web Application through which the data sent from the bicycle can be viewed both in
real time and after the ride has been completed • Securing the application by working with sessions, authorization tokens, SSL certificates, and
credentials for the MQTT clients
4. Conclusions
This connected bike project was born out of a real issue encountered among both amateur and professional cyclists. This problem consists of the limitations existing in the current training methods. In this project, a wide range of technologies have been used, starting from the electronics and hardware side and to the web and mobile applications. Putting all these together, a prototype of a complete solution has been created to help cyclists and facilitate trainers.
Author Contributions: Conceptualization and methodology, G.C..; software, G.C.; validation, E.H.D..; formal analysis, L.C.M..; writing—original draft preparation, G.C..; writing—review and editing, E.H.D; supervision, E.H.D..; funding acquisition, L.C.M. All authors have read and agreed to the published version of the manuscript.
Funding: This work was supported by a grant of the Romanian Ministery of Research and Innovation, CCCDI – UEFISCDI, project number PN-III-P1-1.2-PCCDI-2017-0734 / ROBIN – “Roboții și Societatea: Sisteme Cognitive pentru Roboți Personali și Vehicule Autonome”, within PNCDI III. E.H.D. was funded by Hungarian Academy of Science, Janos Bolyai Grant (BO/ 00313/17) and the ÚNKP-19-4-OE-64 New National Excellence Program of the Ministry for Innovation and Technology.
Conflicts of Interest: The authors declare no conflict of interest
List of abbreviations
AUTOSAR-Automotive Open System Architecture
Figure 19. Web application of the Connected Bike
Finally, using the above modules, both hardware and software, the following requirementswere achieved:
• Collecting raw data from the two Hall sensors and from the load cell• Computing the riding speed [km/h] with a precision of two decimals, pedal cadence [rpm] and
instantaneous power from the cyclist [watt]• Track the cyclist’s position in real-time by reading latitude and longitude from the GPS module• Sending with a 1 s period the collected and processed data from sensors to the server to be stored
in the database and for online monitoring• Implementing an Android Application that allows the rider to create a new ride, start or terminate
the current one, and also receive information on the state of the bike’s frame module• Creating a Web Application through which the data sent from the bicycle can be viewed both in
real time and after the ride has been completed• Securing the application by working with sessions, authorization tokens, SSL certificates, and
credentials for the MQTT clients
4. Conclusions
This connected bike project was born out of a real issue encountered among both amateur andprofessional cyclists. This problem consists of the limitations existing in the current training methods.In this project, a wide range of technologies have been used, starting from the electronics and hardwareside and to the web and mobile applications. Putting all these together, a prototype of a completesolution has been created to help cyclists and facilitate trainers.
Author Contributions: Conceptualization and methodology, G.C.; software, G.C.; validation, E.-H.D.; formalanalysis, L.C.M.; writing—original draft preparation, G.C.; writing—review and editing, E.-H.D.; supervision,E.-H.D.; funding acquisition, L.C.M. All authors have read and agreed to the published version of the manuscript.
Funding: This work was supported by a grant of the Romanian Ministery of Research and Innovation, CCCDI –UEFISCDI, project number PN-III-P1-1.2-PCCDI-2017-0734 / ROBIN – “Robot, ii s, i Societatea: Sisteme Cognitivepentru Robot, i Personali s, i Vehicule Autonome”, within PNCDI III. E.H.D. was funded by Hungarian Academy ofScience, Janos Bolyai Grant (BO/ 00313/17) and the ÚNKP-19-4-OE-64 New National Excellence Program of theMinistry for Innovation and Technology.
Conflicts of Interest: The authors declare no conflict of interest
Sensors 2020, 20, 1473 26 of 27
Abbreviations
AUTOSAR Automotive Open System ArchitectureCRUD Create Read Update DeleteGPIO General-Purpose Input/OutputGPS Global Positioning SystemHTTP Hypertext Transfer ProtocolICR Interrupt Capture RegisterIoT Internet of thingsIP Internet ProtocolIR InfraredJSON JavaScript Object NotationJWT JSON Web TokenLED Light-Emitting DiodeMIT Massachusetts Institute of TechnologyMQTT Message Queues Telemetry TransportMVC Model-View-ControllerNGINX engine XORM Object Relational MapperRST Representational state transferRTE Runtime EnvironmentRTOS Real Time Operating SystemSEMS smart e-bike monitoring systemTCNT Timer Counter RegisterTCP Transmission Control ProtocolUART Universal Asynchronous Receiver-TransmitterUML Unified Modeling LanguageURL Uniform Resource LocatorUSB Universal Serial BusWSGI Web Server Gateway Interface
References
1. Salmeron-Manzano, E.; Manzano-Agugliaro, F. The Electric Bicycle: Worldwide Research Trends. Energies2018, 11, 1894. [CrossRef]
2. Zguira, Y.; Rivano, H.; Meddeb, A. Internet of Bikes: A DTN Protocol with Data Aggregation for Urban DataCollection. Sensors 2018, 18, 2819. [CrossRef] [PubMed]
3. Shen, S.; Wei, Z.; Sun, L.; Su, Y.; Wang, R.; Jiang, H. The Shared Bicycle and Its Network—Internet of SharedBicycle (IoSB): A Review and Survey. Sensors 2018, 18, 2581. [CrossRef] [PubMed]
4. Zguira, Y.; Rivano, H.; Meddeb, A. IoB-DTN: A lightweight DTN protocol for mobile IoT applications to smartbike sharing systems. In Proceedings of the 2018 IEEE Wireless Days (WD), Dubai, UAE, 3–5 April 2018.[CrossRef]
5. Nakamura, T.; Kikuya, Y.; Arakawa, Y.; Nakamura, M.; Higashijima, Y.; Maruo, Y.Y.; Nakamura, M. Proposalof web framework for ubiquitous sensor network and its trial application using no2 sensor mounted onbicycle. In Proceedings of the 12th International Symposium on Applications and the Internet (SAINT) 2012IEEE/IPSJ, Izmir, Turkey, 16–20 July 2012; pp. 83–90.
6. Qiu, P.; Liu, X.; Wen, S.; Zhang, Y.; Winfree, K.N.; Ho, C. The Development of an IoT Instrumented Bike:For Assessment of Road and Bike Trail Conditions. In Proceedings of the 2018 International Symposium inSensing and Instrumentation in IoT Era (ISSI), Shanghai, China, 6–7 September 2018. [CrossRef]
7. Archana, D.; Boomija, G.; Manisha, J.; Kalaiselvi, V.K.G. Mission on! Innovations in bike systems to providea safe ride based on IOT. In Proceedings of the 2017 2nd International Conference on Computing andCommunications Technologies (ICCCT), Chennai, Tamil Nadu, India, 23–24 February 2017. [CrossRef]
8. Chen, L.; Tsao, C.; Li, C.; Lo, Y.; Huang, W.; Chen, H. Demo: All-You-Can-Bike—A Street View and VirtualReality Based Cyber-Physical System for Bikers through IoT Technologies. In Proceedings of the 25th Annual

Sensors 2020, 20, 1473 27 of 27
International Conference on Mobile Computing and Networking, Los Cabos, Mexico, 21–25 October 2019;ACM Digital Library, Article No.: 60. pp. 1–3. [CrossRef]
9. Wang, C.; Kou, S.; Song, Y. Identify Risk Pattern of E-Bike Riders in China Based on Machine LearningFramework. Entropy 2019, 21, 1084. [CrossRef]
10. Danku, A.; Kovari, A.; Miclea, L.C.; Dulf, E.H. Intelligent Control of an Aerodynamical System. In Proceedingsof the 2019 IEEE 15th International Conference on Intelligent Computer Communication and Processing(ICCP), Cluj-Napoca, Romania, 5–7 September 2019.
11. Dulf, E.H.; Timis, D.D.; Szekely, L.; Miclea, L.C. Adaptive Fractional Order Control Applied to a Multi-rotorSystem. In Proceedings of the IEEE 2019 22nd International Conference on Control Systems and ComputerScience (CSCS), Bucharest, Romania, 28–30 May 2019.
12. Dulf, E.H.; Timis, D.; Muresan, C.I. Robust fractional order controllers for distributed systems.Acta Polytech. Hung. 2017, 14, 163–176.
13. Dong, J.L.; Hu, C.Q.; Tong, J.X.; Liu, F.Y. Velocity-free MS/AE source location method for three-dimensionalhole-containing structures. Engineering 2020. [CrossRef]
14. Dong, J.; Sun, D.J.; Han, G.J.; Li, X.B.; Hu, Q.C.; Shu, L. Velocity-free Localization of Autonomous DriverlessVehicles in Underground Intelligent Mines. IEEE Trans. Veh. Technol. 2020. [CrossRef]
15. Bao, Y.; Chen, Z.; Wei, S.; Xu, Y.; Tang, Z.; Li, H. The state of the art of data science and engineering instructural health monitoring. Engineering 2019, 5, 234–242. [CrossRef]
16. Li, D.; Gao, H. A hardware platform framework for an intelligent vehicle based on a driving brain. Engineering2018, 4, 464–470. [CrossRef]
17. Pan, Y. Heading toward artificial intelligence 2.0. Engineering 2016, 2, 409–413. [CrossRef]18. Frauke, B. Cycling the Smart and Sustainable City: Analyzing EC Policy Documents on Internet of Things,
Mobility and Transport, and Smart Cities. Sustainability 2019, 11, 763. [CrossRef]19. Savage, N. Cycling Through Data. Commun. ACM 2010, 53, 16–17. [CrossRef]20. Emilio, M.D.P. Data Acquisition Systems from Fundamentals to Applied Design; Springer: Pescara, Italy, 2013.21. Al-Mutlaq, S.; Tutorials, S. SparkFun Electronics [Interactive]. Available online: https://learn.sparkfun.com/
tutorials/getting-started-with-load-cells/all (accessed on 20 April 2019).22. Ray, P. A survey on Internet of Things architectures. J. King Saud Univ. Comput. Inf. Sci. 2018, 30, 291–319.23. The FreeRTOS Kernel [Interactive]. Available online: https://www.freertos.org/ (accessed on 5 June 2019).24. MQTT [Interactive]. Available online: http://mqtt.org/ (accessed on 5 June 2019).25. Aladeusi, O. Building a RESTful Blog APIs Using python and flask, 17 06 2018. [Interactive]. Available online:
https://www.codementor.io (accessed on 11 February 2019).26. Arduino Mega 2560 [Interactive]. Available online: https://store.arduino.cc/mega-2560-r3 (accessed on
3 June 2019).
© 2020 by the authors. Licensee MDPI, Basel, Switzerland. This article is an open accessarticle distributed under the terms and conditions of the Creative Commons Attribution(CC BY) license (http://creativecommons.org/licenses/by/4.0/).