Confidential & Proprietary Copyright © 2007 The Nielsen Company Summerfruit NZ Industry Review.
41
Confidential & Proprietary • Copyright © 2007 The Nielsen Company Summerfruit NZ Industry Review
-
Upload
jessie-reynolds -
Category
Documents
-
view
216 -
download
0
Transcript of Confidential & Proprietary Copyright © 2007 The Nielsen Company Summerfruit NZ Industry Review.

Confidential & Proprietary • Copyright © 2007 The Nielsen Company
Summerfruit NZIndustry Review

Confidential & ProprietaryCopyright © 2009 The Nielsen Company
Source: ACNielsen Homescan NZ
Summer fruit was the third fastest growing Fruit variety in value sales in the year to April 26th 2009, growing ahead of the Total Fruit category- which means Stone fruit is gaining in market share within the Fruit and Vegetable category.

Confidential & ProprietaryCopyright © 2009 The Nielsen Company
The 08-09 Summerfruit season…
…was a season of two halves.

Confidential & ProprietaryCopyright © 2009 The Nielsen Company
Summerfruit - National ViewSummerfruit performance November 08 - January 09 was stronger than the previous season. More households purchased Summerfruit, bought them more frequently and were willing to pay more each shopping trip.
Summerfruit Season (07-08) Summerfruit Season (08-09)

Confidential & ProprietaryCopyright © 2009 The Nielsen Company
Summerfruit - National ViewHowever, the 2nd half of the season, particularly February – March 09, saw weaker sales than the previous year. Average trip spend was up almost $1 - but this reduced Summerfruit buyer numbers.
Summerfruit Season (07-08) Summerfruit Season (08-09)

Confidential & ProprietaryCopyright © 2009 The Nielsen Company
Loose Stone Fruit- National ViewLoose Summerfruit sales were stronger in the first half of the season…….
Stone Fruit Season (07-08) Stone Fruit Season (08-09)

Confidential & ProprietaryCopyright © 2009 The Nielsen Company
Barcoded Summer Fruit- National ViewWhereas, Barcoded Summer fruit had a stronger second half of the season.
Stone Fruit Season (07-08) Stone Fruit Season (08-09)

Confidential & ProprietaryCopyright © 2009 The Nielsen Company
Summer Fruit Sales by Pack Type- Total New ZealandPre-packed (Barcoded) Summer Fruit sales may be driving the Supermarket growth- however Loose Stone Fruit sales in Independents are growing the Stone Fruit category
+25% +19% +12% +45%
+24%
+35%
+17%
+42%
+10%
+41%
+46%
-30%5 9 6 1
95 91 9499
NZ Foodstuffs Progressive Total F&V Outlets
Barcode Stone Fruit Share Loose Stone Fruit Share
Sales ($) Growth Rates
Time Period: 26 weeks to 26 April 2009
Source: Nielsen Homescan

Confidential & ProprietaryCopyright © 2009 The Nielsen Company
Barcoded Cherries- National ViewThough buyer numbers remain small- it is easy to see when the Cherry season peaks- December. And demand and sales spiked significantly in the 08-09 season.
Cherry Season –(07-08) Cherry Season –(08-09)

Confidential & ProprietaryCopyright © 2009 The Nielsen Company
Barcoded Apricots- National ViewThe demand and availability of Prepacked Apricots remains limited- and in the 08-09 season appears to have been less significant than the previous season
Apricot Season- (07-08) Apricot Season- (08-09)
Confidential & ProprietaryCopyright © 2009 The Nielsen Company
Barcoded Plums- National ViewAs with Prepacked Apricots, the demand and availability of Prepacked Plums is currently limited.
Plums Season- (07-08) Plums Season- (08-09)

Confidential & ProprietaryCopyright © 2009 The Nielsen Company
Barcoded Nectarines- National ViewOf all the Prepacked Summerfruit options, Barcoded Nectarines seems to be the one which has shown the most improvement/growth in the last year- is this linked to availability within the relevant Retail outlets.
Nectarines Season- (07-08) Nectarines Season- (08-09)
Confidential & ProprietaryCopyright © 2009 The Nielsen Company
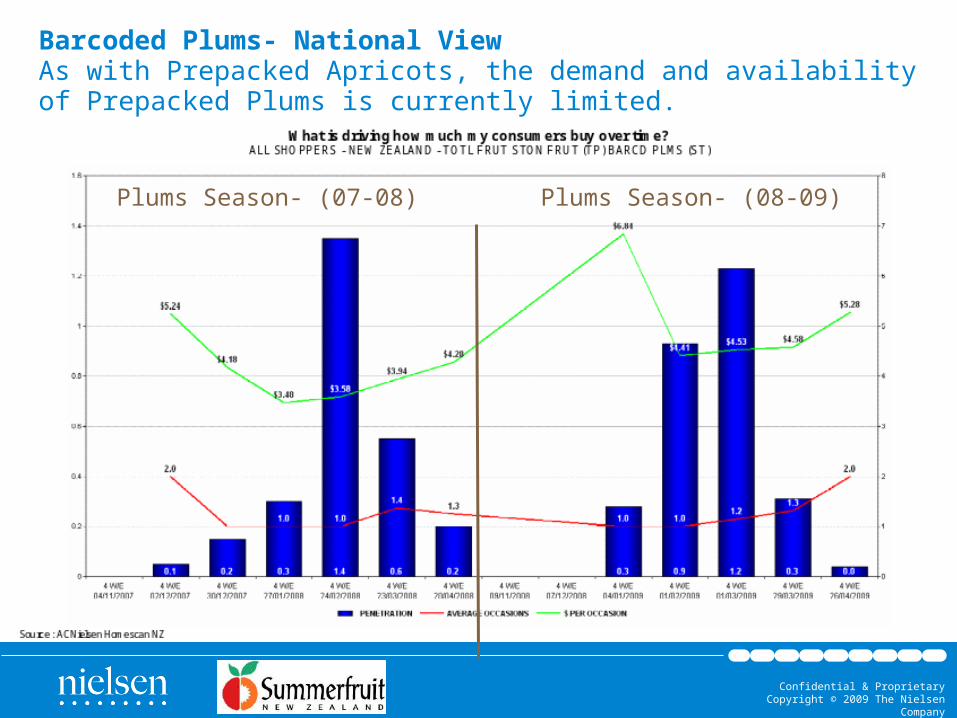
Barcoded Peaches- National ViewAvailability seems to be the clear reason behind the 8 week peak in demand for Prepacked Peaches in 08-09.
Peach Season (07-08) Peach Season (08-09)

Confidential & ProprietaryCopyright © 2009 The Nielsen Company
Nationally- 75% of all New Zealand households bought Summer Fruit in the Summer 08/09 Period and that remained stable. Interestingly, less than 70% of Lower North Island New Zealanders purchase Summer Fruit. And Summer Fruit is most popular amongst South Islanders- where 80% of the population purchase Summer Fruit- these regional variations can be seen as opportunities for market development …..
What are the key consumer drivers of sales? - Category HealthALL SHOPPERS - TOTAL STONE FRUIT (TP) - HALF YEAR TO 26/04/2009 - BASED ON VALUE ($000'S)/1000
Source : ACNielsen Homescan NZ

Confidential & ProprietaryCopyright © 2009 The Nielsen Company
The regional demand and purchasing trends for Loose Summer Fruit are similar to that of Total Summer Fruit sales- with low market penetration levels in the Lower North Island and higher market penetration levels in the South Island
What are the key consumer drivers of sales? - Category HealthALL SHOPPERS - TOTAL FRUIT STONE FRUIT (TP) LOOSE - HALF YEAR TO 26/04/2009 - BASED ON VALUE ($000'S)/1000
Source : ACNielsen Homescan NZ

Confidential & ProprietaryCopyright © 2009 The Nielsen Company
The regional picture for Barcoded or Prepacked sales of Summer Fruit is quite different from Loose sales- Barcoded Summer fruit is more popular amongst Upper North Island Shoppers. And Upper North Island Shoppers are also the heaviest purchasers spending on average $10.40 on Barcoded Summer fruit during the 08-09 Season.
What are the key consumer drivers of sales? - Category HealthALL SHOPPERS - TOTAL FRUIT STONE FRUIT (TP) BARCODE - HALF YEAR TO 26/04/2009 - BASED ON VALUE ($000'S)/1000
Source : ACNielsen Homescan NZ

Confidential & ProprietaryCopyright © 2009 The Nielsen Company
In February……
……the kids went back to school……

Confidential & ProprietaryCopyright © 2009 The Nielsen Company
And Summer Fruit went head to head with….
The Apple

Confidential & ProprietaryCopyright © 2009 The Nielsen Company
Monthly Household Penetration by Key Fruit Type In February 09- competition got tougher as Apple demand surged…..
0
10
20
30
40
50
60
70
80
4 W/E02/12/2007
4 W/E30/12/2007
4 W/E27/01/2008
4 W/E24/02/2008
4 W/E23/03/2008
4 W/E07/12/2008
4 W/E04/01/2009
4 W/E01/02/2009
4 W/E01/03/2009
4 W/E29/03/2009
APPLES BANANAS CITRUS STONE FRUIT
Citrus
Bananas
% of NZ Households buyer during month
Summerfruit
Apples
Source: Nielsen Homescan
Summerfruit
Apples

Confidential & ProprietaryCopyright © 2009 The Nielsen Company
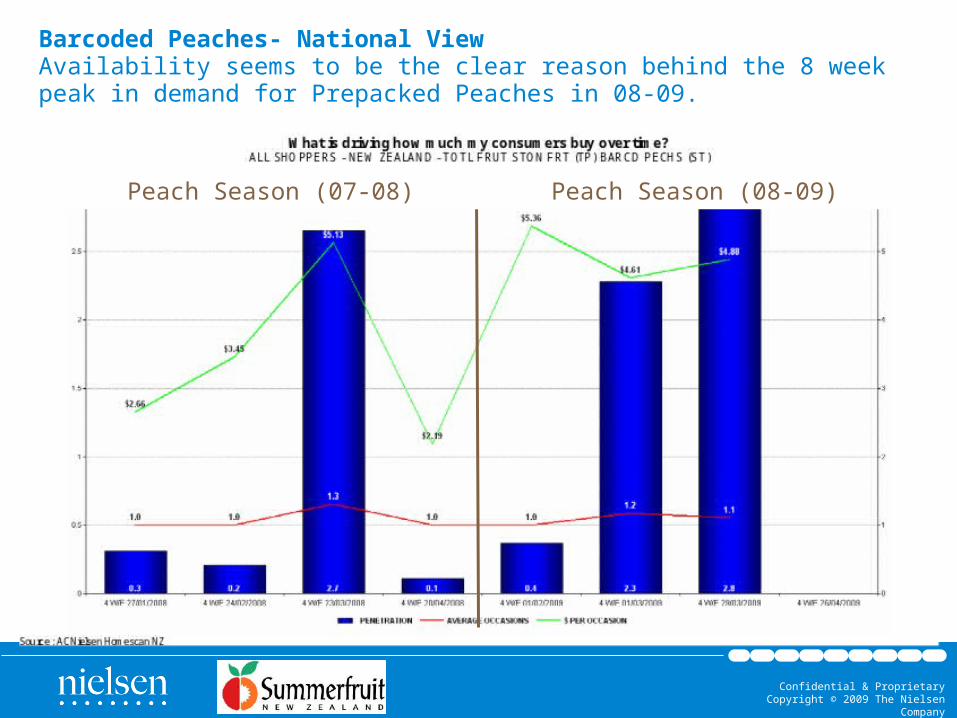
Summer Fruit was the second most popular fruit after Bananas amongst All New Zealanders….New Zealanders spent more money on Stone Fruit than they did on Apples over Summer 2008-09.
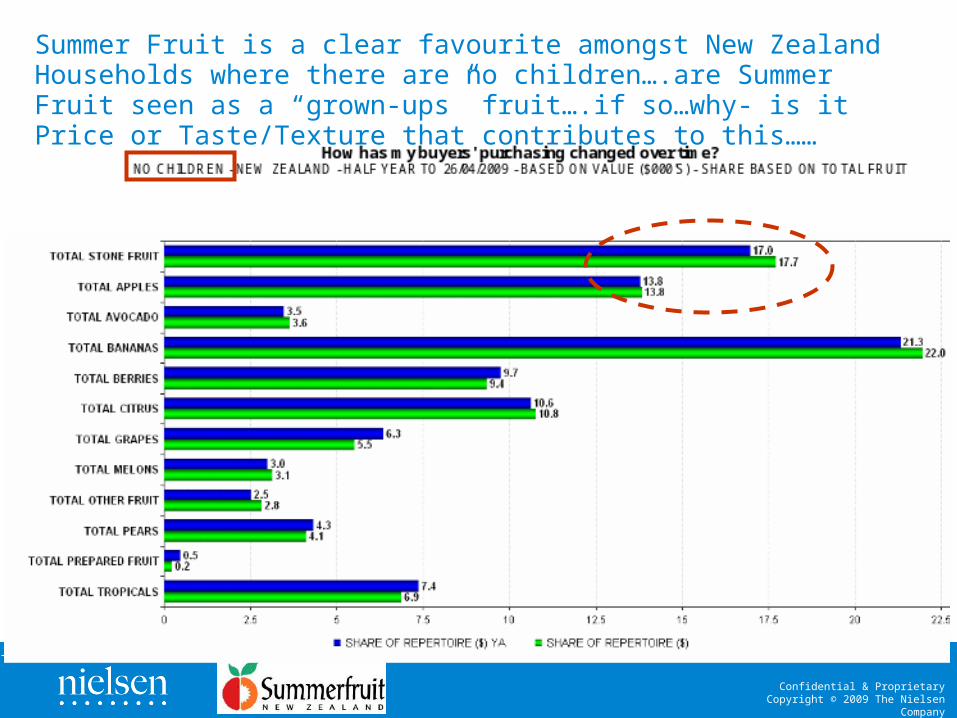
How has my buyers' purchasing changed over time?ALL SHOPPERS - NEW ZEALAND - HALF YEAR TO 26/04/2009 - BASED ON VALUE ($000'S) - SHARE BASED ON TOTAL FRUIT
Source : ACNielsen Homescan NZ
Confidential & ProprietaryCopyright © 2009 The Nielsen Company
Summer Fruit is a clear favourite amongst New Zealand Households where there are no children….are Summer Fruit seen as a “grown-ups” fruit….if so…why- is it Price or Taste/Texture that contributes to this……

Confidential & ProprietaryCopyright © 2009 The Nielsen Company
Apples are much preferred to Summer Fruit amongst Households with Children…..

Confidential & ProprietaryCopyright © 2009 The Nielsen Company
Apples are an important part of a Young Family’s Fruit Basket during Summer……

Confidential & ProprietaryCopyright © 2009 The Nielsen Company
As well as the Mixed Family……

Confidential & ProprietaryCopyright © 2009 The Nielsen Company
And Older Family.

Confidential & ProprietaryCopyright © 2009 The Nielsen Company
Average Trip Spend per Month by Fruit TypeWhen compared to the Average Trip spend on other Fruits during the Summer Fruit season- Summer Fruit appears to be significantly more expensive particularly in the second half of the season…..
Source: Nielsen Homescan
0
1
2
3
4
5
6
7
4 W/E02/12/2007
4 W/E30/12/2007
4 W/E27/01/2008
4 W/E24/02/2008
4 W/E23/03/2008
4 W/E07/12/2008
4 W/E04/01/2009
4 W/E01/02/2009
4 W/E01/03/2009
4 W/E29/03/2009
APPLES BANANAS CITRUS STONE FRUIT
Summer Fruit- Last Season Summer Fruit- This Season
Stone Fruit
Citrus
ApplesBananas
Average Trip Spend ($)

Confidential & ProprietaryCopyright © 2009 The Nielsen Company
Households with Children account for just over 1/3 of all Loose Fruit sales and all Loose Summer Fruit sales…….
HH WITH CHILDREN
36
42
3840
TOTAL FRUIT (LOOSE) TOTAL FRUIT (BARCODE) STONE FRUIT (LOOSE) STONE FRUIT (BARCODE)
% of Total Sales

Confidential & ProprietaryCopyright © 2009 The Nielsen Company
However, Households with Children- particularly Younger Children are larger buyers of Prepacked Fruit and this includes Prepacked Summerfruit.
HH WITH CHILDREN
36
42
3840
TOTAL FRUIT (LOOSE) TOTAL FRUIT (BARCODE) STONE FRUIT (LOOSE) STONE FRUIT (BARCODE)
% of Total Sales

Confidential & ProprietaryCopyright © 2009 The Nielsen Company
Nearly 70% of New Zealand Fruit buyer Households are Households without Children- and these Households account for 60% of all Fresh Fruit sales. Within the Summer Fruit category- Households with Children become more important in sales terms, the smaller the Summer Fruit variety- for examples- Households with Children account for a higher proportion of Apricot sales than they account for Nectarine sales.

Confidential & ProprietaryCopyright © 2009 The Nielsen Company
In particular, pre-packed Plums and Apricots are favoured by Households with Children, particularly younger children.
Is this because this group prefers a smaller sized fruit?

Confidential & ProprietaryCopyright © 2009 The Nielsen Company
Comparing Trip Spend for Barcoded v Loose Stone FruitNZers pay more per trip when they buy Loose Summer Fruit than when they buy Barcoded Summer Fruit packs.
2
3
4
5
6
7
8
9
10
4 W/E 30/12/2007 4 W/E 27/01/2008 4 W/E 24/02/2008 4 W/E 23/03/2008 4 W/E 04/01/2009 4 W/E 01/02/2009 4 W/E 01/03/2009 4 W/E 29/03/2009
$ PER OCCASION (Stone Fruit Barcode) $ PER OCCASION (Stone Fruit Loose)
Impact of 1kg Cherry packs in December
Average Spend Per Occasion ($)
Source: Nielsen Homescan
Barcode Summer FruitAverage $ per Trip
Loose Summer FruitAverage $ per Trip

Confidential & ProprietaryCopyright © 2009 The Nielsen Company
Strategies for market growth: Families
–Pack smaller size fruits in Family Packs or Value Packs in order to attract households with children.
– Can nectarines and peaches take advantage of the same strategy? Similar to Bobby Bananas and Bagged Gala Apples.
–Price Bagged/Punneted Plums and Apricots sharply in February/March.
– Communicate message of great for lunchbox, great for after school snacks

Confidential & ProprietaryCopyright © 2009 The Nielsen Company
Households without Children account for…..
…..62% of all Summer Fruit sales in NZ

Confidential & ProprietaryCopyright © 2009 The Nielsen Company
Fresh Fruit by Household LifestageIt is always a surprise to learn that 60% of Fresh Fruit sales in New Zealand are from Households without Children.

Confidential & ProprietaryCopyright © 2009 The Nielsen Company
An even greater proportion (62%) of Summer Fruit sales are from Households without Children. Though Families are important to some Fruit types….including Apples.
Summer Fruit Apples
62%

Confidential & ProprietaryCopyright © 2009 The Nielsen Company
Pre-Family Households spend 20% of their fruit budget on Summer Fruit during the Summer Fruit season.

Confidential & ProprietaryCopyright © 2009 The Nielsen Company
Summer Fruit is also a firm favourite amongst Empty Nesters-also the second most favourite fruit during the Summer Fruit season

Confidential & ProprietaryCopyright © 2009 The Nielsen Company
Empty Nesters account for ¼ of all pre-packed Fruit Sales and all pre-packed Summer Fruit sales…….
% of Total Sales
OLDER SINGLES & COUPLES
26
31
26
32
TOTAL FRUIT (BARCODE) TOTAL FRUIT (LOOSE) STONE FRUIT (BARCODE) STONE FRUIT (LOOSE)
Confidential & ProprietaryCopyright © 2009 The Nielsen Company
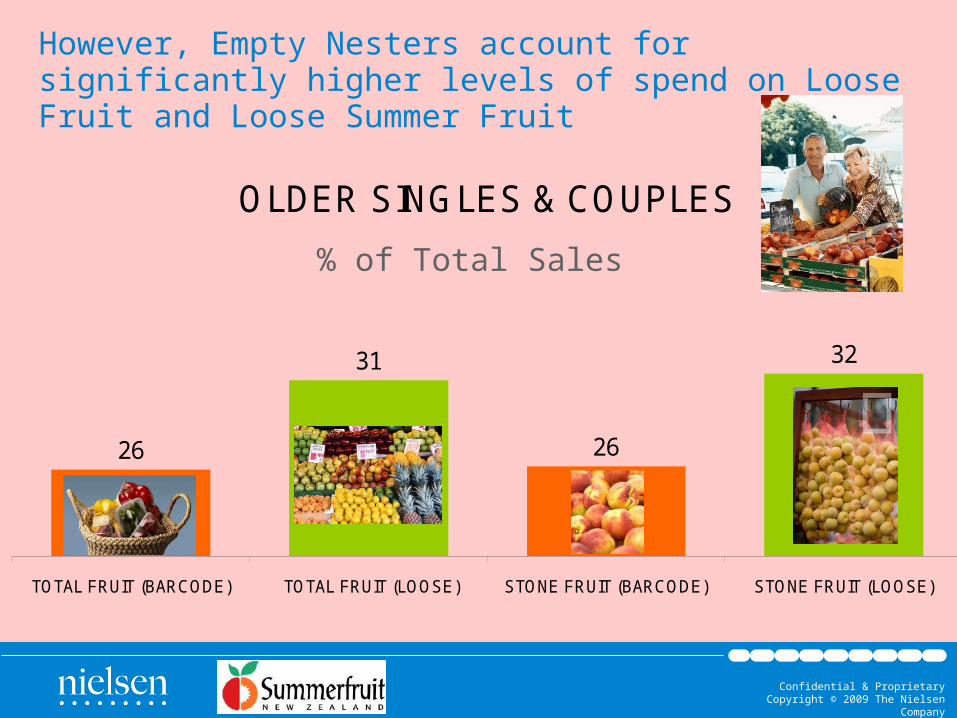
However, Empty Nesters account for significantly higher levels of spend on Loose Fruit and Loose Summer Fruit
% of Total Sales
OLDER SINGLES & COUPLES
26
31
26
32
TOTAL FRUIT (BARCODE) TOTAL FRUIT (LOOSE) STONE FRUIT (BARCODE) STONE FRUIT (LOOSE)

Confidential & ProprietaryCopyright © 2009 The Nielsen Company
Loose Stone Fruit sales do appeal to Higher Income Households, which adds weight to the suggestion that Loose Fruit could be positioned as more premium…..

Confidential & ProprietaryCopyright © 2009 The Nielsen Company
Strategies for market growth: Empty Nesters
•Demand and consumption for Summer Fruit are highest in December and January when competition from Apples is at its weakest.–Consumers are willing to pay more per trip for Loose Fruit–Empty Nesters are big purchasers of Loose Stone Fruit
–Summer Fruit must “own” Summer–Promote quality- taste, juiciness and provenance heavily during this time–Price in-season, high quality Loose Fruit relatively higher than Pre-packaged Fruit