
Confidential: For Review Only - BMJ...Confidential: For Review Only 3 CI, 0.99 to 1.56) and...
80
Confidential: For Review Only Sulfonylureas as second-line therapy in type 2 diabetes and the risk of cardiovascular and hypoglycaemic events: a cohort study Journal: BMJ Manuscript ID BMJ.2017.042934.R1 Article Type: Research BMJ Journal: BMJ Date Submitted by the Author: 09-Mar-2018 Complete List of Authors: Douros, Antonios; McGill University, Epidemiology Dell'Aniello, Sophie; Jewish General Hospital, Centre for Clinical Epidemiology Yu, Oriana; Jewish General Hospital; McGill University Filion, Kristian; McGill University, Centre for Clinical Epidemiology Azoulay, Laurent; McGill University, Department of Oncology Suissa, Samy; McGill University, Epidemiology and Biostatistics and Medicine; Lady Davis Institute, Centre for Clinical Epidemiology Keywords: Myocardial infarction, ischaemic stroke, oral antidiabetic drugs, prevalent new-user design, severe hypoglycaemia, population-based https://mc.manuscriptcentral.com/bmj BMJ
Transcript of Confidential: For Review Only - BMJ...Confidential: For Review Only 3 CI, 0.99 to 1.56) and...

Confidential: For Review Only
Sulfonylureas as second-line therapy in type 2 diabetes and
the risk of cardiovascular and hypoglycaemic events: a cohort study
Journal: BMJ
Manuscript ID BMJ.2017.042934.R1
Article Type: Research
BMJ Journal: BMJ
Date Submitted by the Author: 09-Mar-2018
Complete List of Authors: Douros, Antonios; McGill University, Epidemiology Dell'Aniello, Sophie; Jewish General Hospital, Centre for Clinical Epidemiology Yu, Oriana; Jewish General Hospital; McGill University Filion, Kristian; McGill University, Centre for Clinical Epidemiology Azoulay, Laurent; McGill University, Department of Oncology Suissa, Samy; McGill University, Epidemiology and Biostatistics and Medicine; Lady Davis Institute, Centre for Clinical Epidemiology
Keywords: Myocardial infarction, ischaemic stroke, oral antidiabetic drugs, prevalent new-user design, severe hypoglycaemia, population-based
https://mc.manuscriptcentral.com/bmj
BMJ

Confidential: For Review Only
Figure 1
Abbreviations: HES = Hospital Episode Statistics; ONS = Office for National Statistics
Patients with a first prescription of
metformin between April 1, 1998 and March 31, 2013
and linkable to HES and ONS (n = 137,043)
Exclusions:
Combination use at base cohort entry (n = 9707)
Base cohort entry before age 40 (n = 17,938)
Having <12 months of medical information prior to base cohort
entry or date inconsistencies (n = 31,263)
Women with polycystic ovary syndrome (n = 986)
Metformin monotherapy users
(n = 77,149)
Base cohort with metformin monotherapy users
(n = 77,138)
Study cohort for myocardial infarction (n = 23,551)
Study cohort for ischemic stroke (n = 23,636)
Study cohort for cardiovascular death (n = 23,548)
Study cohort for all-cause mortality (n = 23,592)
Study cohort for severe hypoglycaemia (n = 23,555)
Exclusions:
Trim in myocardial infarction cohort (n = 217)
No eligible matches in myocardial infarction cohort (n = 1931)
Trim in ischemic stroke cohort (n = 226)
No eligible matches in ischemic stroke cohort (n = 1837)
Trim in cardiovascular death cohort (n = 212)
No eligible matches in cardiovascular death cohort (n = 1938)
Trim in all-cause mortality cohort (n = 210)
No eligible matches in all-cause mortality cohort (n = 1897)
Trim in severe hypoglycaemia cohort (n = 213)
No eligible matches in severe hypoglycaemia cohort (n = 1931)
Exclusions:
No follow-up (n = 11)
Patients adding or switching to sulfonylureas
(n = 25,699)
Page 1 of 79
https://mc.manuscriptcentral.com/bmj
BMJ
123456789101112131415161718192021222324252627282930313233343536373839404142434445464748495051525354555657585960
Confidential: For Review OnlyFigure 2
Page 2 of 79
https://mc.manuscriptcentral.com/bmj
BMJ
123456789101112131415161718192021222324252627282930313233343536373839404142434445464748495051525354555657585960

Confidential: For Review Only
1
Sulfonylureas as second-line therapy in type 2 diabetes and the risk of
cardiovascular and hypoglycaemic events: a cohort study
Running title: Safety of sulfonylureas as second-line treatment
Antonios Douros, postdoctoral-fellow1,2,3
, Sophie Dell’Aniello, statistician1, Oriana Hoi Yun Yu,
endocrinologist1,4
, Kristian B. Filion, assistant professor of epidemiology and medicine1,2,5
,
Laurent Azoulay, associate professor of epidemiology and oncology1,2,6
, Samy Suissa, professor
of epidemiology and medicine1,2,5
1. Centre for Clinical Epidemiology, Lady Davis Institute, Jewish General Hospital, Montreal,
Quebec, Canada
2. Department of Epidemiology, Biostatistics, and Occupational Health, McGill University,
Montreal, Quebec, Canada
3. Institute of Clinical Pharmacology and Toxicology, Charité-Universitätsmedizin Berlin,
corporate member of Freie Universität Berlin, Humboldt-Universität zu Berlin, and Berlin
Institute of Health, Berlin, Germany
4. Division of Endocrinology, Jewish General Hospital, Montreal, Quebec, Canada
5. Division of Clinical Epidemiology, Department of Medicine, McGill University, Montreal,
Quebec, Canada
6. Gerald Bronfman Department of Oncology, McGill University, Montreal, Quebec, Canada
Correspondence:
Dr. Samy Suissa
Centre for Clinical Epidemiology, Lady Davis Institute – Jewish General Hospital
3755 Cote Ste-Catherine, H-461
Montreal, Québec, Canada H3T 1E2
Tel: 514-340-7593
Fax: 514-340-7564
E-mail: [email protected]
Word count main text: 3614
Word count abstract: 365
April 10, 2018
Page 3 of 79
https://mc.manuscriptcentral.com/bmj
BMJ
123456789101112131415161718192021222324252627282930313233343536373839404142434445464748495051525354555657585960

Confidential: For Review Only
2
ABSTRACT
Objective: To assess whether adding or switching to sulfonylureas is associated with an
increased risk of myocardial infarction (MI), ischaemic stroke, cardiovascular death, all-cause
mortality, and severe hypoglycaemia, compared to remaining on metformin monotherapy in
patients with type 2 diabetes.
Design: Population-based cohort study.
Setting: General practices contributing data to the United Kingdom Clinical Practice Research
Datalink.
Participants: Patients with type 2 diabetes initiating metformin monotherapy between 1998 and
2013.
Main outcome measures: Using the prevalent new-user cohort design we matched 1:1 patients
adding or switching to sulfonylureas with those remaining on metformin monotherapy on high-
dimensional propensity score, haemoglobin A1c, and number of previous metformin
prescriptions. The two groups were compared using Cox proportional hazards models to estimate
adjusted hazard ratios (HRs) and 95% confidence intervals (CIs) of the study outcomes. In a
secondary analysis, exposure was sub-classified as adding or switching to sulfonylureas.
Results: Among 77,138 metformin initiators, 25,699 added or switched to sulfonylureas during
study period. During a mean follow-up of 1.1 years, sulfonylureas were associated with an
increased risk of MI (incidence rate, 7.8 versus 6.2 per 1000/year; HR, 1.26; 95% CI, 1.01
to1.56), all-cause mortality (incidence rate, 27.3 versus 21.5 per 1000/year; HR, 1.28; 95% CI,
1.15 to 1.44), and severe hypoglycaemia (incidence rate, 5.5 versus 0.7 per 1000/year; HR, 7.60;
95% CI, 4.64 to 12.44) compared with metformin monotherapy. There was a trend towards
increased risks of ischaemic stroke (incidence rate, 6.7 versus 5.5 per 1000/year; HR, 1.24; 95%
Page 4 of 79
https://mc.manuscriptcentral.com/bmj
BMJ
123456789101112131415161718192021222324252627282930313233343536373839404142434445464748495051525354555657585960
Confidential: For Review Only
3
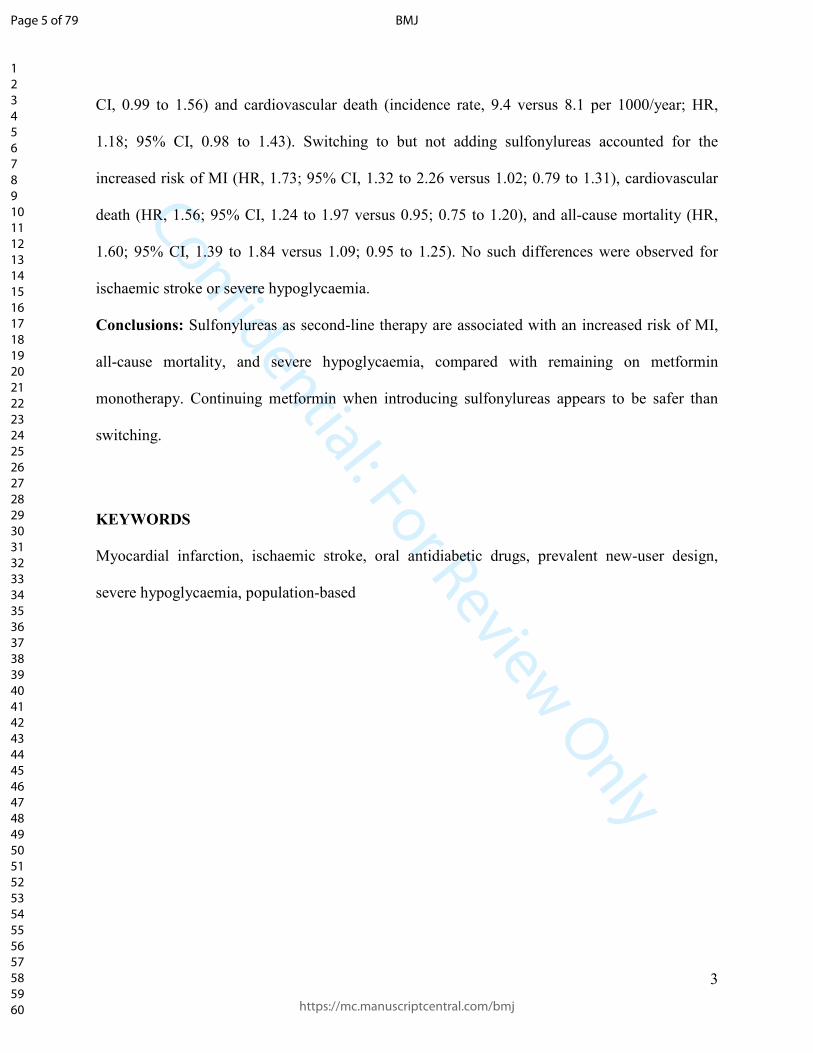
CI, 0.99 to 1.56) and cardiovascular death (incidence rate, 9.4 versus 8.1 per 1000/year; HR,
1.18; 95% CI, 0.98 to 1.43). Switching to but not adding sulfonylureas accounted for the
increased risk of MI (HR, 1.73; 95% CI, 1.32 to 2.26 versus 1.02; 0.79 to 1.31), cardiovascular
death (HR, 1.56; 95% CI, 1.24 to 1.97 versus 0.95; 0.75 to 1.20), and all-cause mortality (HR,
1.60; 95% CI, 1.39 to 1.84 versus 1.09; 0.95 to 1.25). No such differences were observed for
ischaemic stroke or severe hypoglycaemia.
Conclusions: Sulfonylureas as second-line therapy are associated with an increased risk of MI,
all-cause mortality, and severe hypoglycaemia, compared with remaining on metformin
monotherapy. Continuing metformin when introducing sulfonylureas appears to be safer than
switching.
KEYWORDS
Myocardial infarction, ischaemic stroke, oral antidiabetic drugs, prevalent new-user design,
severe hypoglycaemia, population-based
Page 5 of 79
https://mc.manuscriptcentral.com/bmj
BMJ
123456789101112131415161718192021222324252627282930313233343536373839404142434445464748495051525354555657585960

Confidential: For Review Only
4
WHAT IS ALREADY KNOWN ON THIS SUBJECT
• Sulfonylureas are widely used second-line oral antidiabetic drugs.
• Previous studies have assessed their cardiovascular and hypoglycaemic safety in the
setting of first-line treatment or in comparison with other second-line antidiabetic drugs.
• The specific risk of treatment intensification with sulfonylureas compared with staying
on metformin monotherapy has rarely been investigated.
WHAT THIS STUDY ADDS
• Our study suggests that sulfonylureas as second-line therapy are associated with a
modestly increased risk of myocardial infarction and all-cause mortality, and a strongly
increased risk of severe hypoglycaemia, compared with remaining on metformin
monotherapy.
• Continuation of metformin when introducing sulfonylureas appears to be safer than
switching.
Page 6 of 79
https://mc.manuscriptcentral.com/bmj
BMJ
123456789101112131415161718192021222324252627282930313233343536373839404142434445464748495051525354555657585960
Confidential: For Review Only
5
INTRODUCTION
Sulfonylureas are oral antidiabetic drugs recommended as second-line treatments in
patients with type 2 diabetes.1 Despite the recent approval of several new medications,
sulfonylureas remain the most commonly prescribed antidiabetic drugs after treatment failure
with the first-line agent metformin.2 While the safety of sulfonylureas with respect to adverse
cardiovascular and hypoglycaemic events has been studied extensively,3 4
studies focusing
specifically on their cardiovascular and hypoglycaemic safety as second-line therapy, in
individuals with poorly controlled diabetes in need of pharmacotherapy escalation, have been
sparse and limited.
The randomized controlled trials evaluating sulfonylureas as second-line treatment were
underpowered to assess cardiovascular complications of diabetes or severe hypoglycaemia,
which may contribute to the development of adverse cardiovascular events.5 6
In the setting of
real-world clinical practice, the majority of observational studies assessing these outcomes
compared sulfonylureas with other second-line antidiabetic drugs such as dipeptidyl peptidase-4
(DPP-4) inhibitors or insulin.7-9
Thus, the specific risk of treatment intensification with
sulfonylureas compared with staying on metformin monotherapy has rarely been investigated,
and several of the respective observational studies had methodological limitations such as
selection bias,10 11
exposure misclassification,12
and residual confounding.10 12
Since metformin has been associated with a decreased risk of cardiovascular events and
low rates of hypoglycaemia,13
intensifying treatment with sulfonylureas, a potentially cardiotoxic
class3 with high hypoglycaemic risk,
14 may reverse the positive effects of metformin. Thus, the
objective of our population-based study was to assess whether the use of second-line
sulfonylureas, after metformin, is associated with increased risks of myocardial infarction (MI),
Page 7 of 79
https://mc.manuscriptcentral.com/bmj
BMJ
123456789101112131415161718192021222324252627282930313233343536373839404142434445464748495051525354555657585960
Confidential: For Review Only
6
ischaemic stroke, cardiovascular death, all-cause mortality, and severe hypoglycaemia in patients
with type 2 diabetes, compared with continuation of metformin monotherapy.
Page 8 of 79
https://mc.manuscriptcentral.com/bmj
BMJ
123456789101112131415161718192021222324252627282930313233343536373839404142434445464748495051525354555657585960

Confidential: For Review Only
7
METHODS
Data sources
We used the United Kingdom (UK) Clinical Practice Research Datalink (CPRD) linked
to the Hospital Episode Statistics (HES) and Office for National Statistics (ONS) databases. The
CPRD is a large primary care database which contains the medical records for over 14 million
people enrolled in over 680 general practices.15
Medical diagnoses and procedures are recorded
using the Read code classification, and drugs prescribed by general practitioners are coded based
on the UK Prescription Pricing Authority dictionary. The CPRD contains information on
anthropometric variables such as body mass index (BMI), and lifestyle variables such as
smoking and alcohol use. CPRD data have been previously validated and shown to be of high
quality.16
The HES contains all inpatient and day case hospital admission information, including
primary and secondary diagnoses (coded using the International Statistical Classification of
Diseases and Health-Related Problems, Tenth Revision [ICD-10]), and hospital-related
procedures (coded using the Office of Population Censuses and Surveys classification of
interventions and procedures, 4th version [OPCS-4]). The ONS contains the electronic death
certificates of all citizens living in the UK and includes the underlying cause of death (coded
using the ICD-9 and ICD-10 classifications). The linkage of the HES and ONS to the CPRD is
possible from April 1, 1997, onward, and is limited to English general practices that have
consented to the linkage scheme (currently representing 75% of all English practices).16
Study population – Base cohort
We first formed a base cohort consisting of patients newly treated for type 2 diabetes
with metformin in monotherapy between April 1, 1998 and March 31, 2013, with follow-up until
Page 9 of 79
https://mc.manuscriptcentral.com/bmj
BMJ
123456789101112131415161718192021222324252627282930313233343536373839404142434445464748495051525354555657585960
Confidential: For Review Only
8
March 31, 2014. Base cohort entry was defined by the date of the first metformin prescription.
We excluded all patients less than 40 years of age, those with less than one year of medical
history in the CPRD before cohort entry, and women with a diagnosis of polycystic ovary
syndrome at any time before cohort entry. We also excluded patients prescribed any antidiabetic
drugs at any time before base cohort entry. Since this study aimed to be representative of real-
world practice, patients with a history of cardiovascular disease at cohort entry were not
excluded.
Study population – Study cohort
The study cohort was formed by identifying all subjects from the base cohort of
metformin initiators who subsequently added or switched to a sulfonylurea as second-line
treatment. Patients who added or switched to other antidiabetic drugs were censored. For each
one of the subjects adding or switching to a sulfonylurea, we identified a matched reference
subject who also was a metformin initiator but remained on metformin, using a prevalent new-
user design.17
The potential reference subjects were selected from the corresponding exposure
sets, namely from the metformin initiators in the base cohort who received a metformin
prescription within three months of the date the exposed subjects added or switched to a
sulfonylurea, and who received the same number of metformin prescriptions during time in the
base cohort as the exposed subjects (eFigure 1). Thus, the number of metformin prescriptions
between base cohort entry (monotherapy initiation) and study cohort entry (adding or switching
to a sulfonylurea or matched continuation) was inherently a matching covariate. Moreover,
exposed and reference subjects were matched on haemoglobin A1c (HbA1c) level (≤7%, 7.1-
8%, >8%, unknown) at study cohort entry. Finally, exposed and reference subjects were matched
Page 10 of 79
https://mc.manuscriptcentral.com/bmj
BMJ
123456789101112131415161718192021222324252627282930313233343536373839404142434445464748495051525354555657585960
Confidential: For Review Only
9
on high-dimensional propensity score (hdPS).18
The hdPS method empirically selects covariates
based on their prevalence and potential for confounding. For each member of each matched set,
we identified all available information from seven data dimensions (five dimensions from the
CPRD: drug prescriptions, procedures, diagnoses, disease history, administrative information;
two dimensions form the HES: diagnoses, procedures) in the one-year period prior to the date of
the matched set, and applied conditional logistic regression to estimate the propensity of
receiving a sulfonylurea treatment, thereby considering the 500 most likely confounders. Patients
with scores in non-overlapping hdPS regions were trimmed from the cohort. The hdPS procedure
was repeated for each outcome, since this method calculates a bias term that accounts for the
association with a specific outcome. Matched metformin patients were allowed to add or switch
to sulfonylureas later during follow-up. In this case, the follow-up for the metformin
monotherapy group was censored at the point of add-on or switch to sulfonylureas. Then, the
patient was included as a sulfonylurea user from that point onwards while identifying a matched
metformin patient at that point.
Patients meeting the study inclusion criteria were followed until the earliest of the
following events: treatment discontinuation (defined either by the absence of a new prescription
by the end of a 60-day period [30 days prescription duration plus 30 days grace period] or by the
addition or the switch to another, non-sulfonylurea antidiabetic drug), occurrence of one of the
study outcomes (defined in detail below), end of registration with the general practice, or end of
the study period (31 March 2014). For the metformin initiators adding or switching to
sulfonylureas, further switches within the sulfonylurea class were permitted.
Study outcomes
Page 11 of 79
https://mc.manuscriptcentral.com/bmj
BMJ
123456789101112131415161718192021222324252627282930313233343536373839404142434445464748495051525354555657585960
Confidential: For Review Only
10
We considered five outcomes: hospitalization for MI, hospitalization for ischaemic
stroke, cardiovascular death, all-cause mortality, and severe hypoglycaemia. Hospitalization for
MI and ischaemic stroke were identified using the HES and ONS (MI ICD-9 codes: 410.x; ICD-
10 codes: I21.x; ischaemic stroke ICD-9 codes: 433.x, 434.x, 436.x; ICD-10 codes: I63.x, I64.x;
in primary or secondary position). The diagnostic codes to identify MI in HES have been shown
to be highly valid (>90%),19
while the validity of stroke diagnoses in administrative data is also
high (>80%).20
Cardiovascular death was identified in ONS (underlying cause of death; ICD-9
codes: 390.x-398.x, 401.x-405.x, 410.x-417.x, 420.x-429.x [except 427.5], 430.x-438.x, 440.x-
447.x; ICD-10 codes: I00.x-I77.x [except I46.9]), and all-cause mortality was identified from all
three databases, with the date of death defined by the earliest recording of death in any database.
Severe hypoglycaemia was identified in HES (ICD-10 codes: E16.0, E16.1, E16.2; in primary or
secondary position).
Statistical analysis
We used descriptive statistics to summarize the characteristics of the patients in the
matched groups. Potential post-matching imbalances among covariates were assessed using
standardized mean differences. Incidence rates of each outcome were calculated based on the
Poisson distribution and expressed as number of events per 1000/year. Moreover, we constructed
a Cox proportional hazards regression model for each outcome that estimated the hazard ratio
(HR) and the 95% confidence intervals (CIs) for sulfonylurea therapy versus metformin therapy.
To maximize comparability between the two groups, the models for MI, ischaemic stroke,
cardiovascular death, and severe hypoglycaemia were additionally adjusted for age, sex, hdPS
deciles, and history of the respective outcome in the year prior to cohort entry (or, for the case of
Page 12 of 79
https://mc.manuscriptcentral.com/bmj
BMJ
123456789101112131415161718192021222324252627282930313233343536373839404142434445464748495051525354555657585960
Confidential: For Review Only
11
cardiovascular death, history of MI or ischaemic stroke). The model for all-cause mortality was
additionally adjusted for age, sex, and hdPS deciles.
Secondary analyses
We conducted three secondary analyses. First, we assessed the risk of the study outcomes
separately in case of addition of sulfonylureas to metformin and in case of switching to
sulfonylureas from metformin. For this analysis, we used a time-dependent exposure definition
subcategorizing the person-time of sulfonylurea use, which resulted in three mutually exclusive
categories: current use of metformin only (reference), current use of sulfonylureas only, and
concomitant current use of metformin and sulfonylureas. Thus, the same patient could contribute
person-time to different exposure categories. To further corroborate the results of this analysis,
we also conducted a head-to-head comparison between patients adding sulfonylureas and
patients switching to sulfonylureas (described in eMethods 1). Second, to assess a duration-
response relation between switching to or adding on sulfonylureas and the risk of each study
outcome, drug use was further categorized according to three predefined durations (≤3 months,
3.1-12 months, >12 months). Third, given the pharmacologic heterogeneity observed among
different sulfonylureas, the risk of each study outcome was assessed separately for two groups of
sulfonylureas classified by duration of action and pancreas specificity. The first group included
pancreas non-specific, long-acting compounds (i.e., glyburide and glimepiride), while the second
group included pancreas specific, short-acting compounds (i.e., gliclazide, glipizide,
tolbutamide).21-25
This analysis was based on the first sulfonylurea added or switched to.
Switches among sulfonylureas of the same group were allowed during follow-up.
Sensitivity analyses
Page 13 of 79
https://mc.manuscriptcentral.com/bmj
BMJ
123456789101112131415161718192021222324252627282930313233343536373839404142434445464748495051525354555657585960
Confidential: For Review Only
12
We performed four sensitivity analyses to assess the robustness of our findings. First, to
assess possible exposure misclassification, we repeated the analyses using a 60-day grace period
between non-overlapping successive prescriptions. Second, the analyses for MI, ischaemic
stroke, cardiovascular death, and severe hypoglycaemia were repeated after excluding patients
with a history of the outcome (or, for the case of cardiovascular death, history of MI or
ischaemic stroke) in the year prior to cohort entry. Third, to assess the potential impact of
residual confounding, we repeated the primary analysis after additionally adjusting for covariates
with a standardized mean difference >5%. Finally, to assess the potential impact of unmeasured
confounding, we conducted a post-hoc sensitivity analysis using the approach proposed by Ding
and VanderWeele (described in eMethods 2).26
Negative control analysis
To further assess the validity of our findings, we conducted an additional analysis using a
negative control outcome.27
Thus, we compared metformin initiators who added or switched to
sulfonylureas to metformin initiators who stayed on metformin monotherapy regarding the risk
of diabetic retinopathy (identified using Read codes from the CPRD and ICD-10 codes from the
HES), since no differential effects between metformin and sulfonylureas have been reported for
this outcome.28
For this analysis, we additionally excluded all patients with previous retinopathy
in order to assess incident disease. All analyses were conducted with SAS, version 9.4 (SAS
Institute, Cary, NC), NC) and R (R Foundation for Statistical Computing, Vienna, Austria;
http://www.r-project.org).
Patient involvement
Page 14 of 79
https://mc.manuscriptcentral.com/bmj
BMJ
123456789101112131415161718192021222324252627282930313233343536373839404142434445464748495051525354555657585960
Confidential: For Review Only
13
No patients were involved in setting the research question or the outcome measure, nor
were they involved in developing plans for design or implementation of the study. No patients
were asked to advise on interpretation or writing up of results. There are no plans to disseminate
the results of the research to study participants or the relevant patient community.
Page 15 of 79
https://mc.manuscriptcentral.com/bmj
BMJ
123456789101112131415161718192021222324252627282930313233343536373839404142434445464748495051525354555657585960

Confidential: For Review Only
14
RESULTS
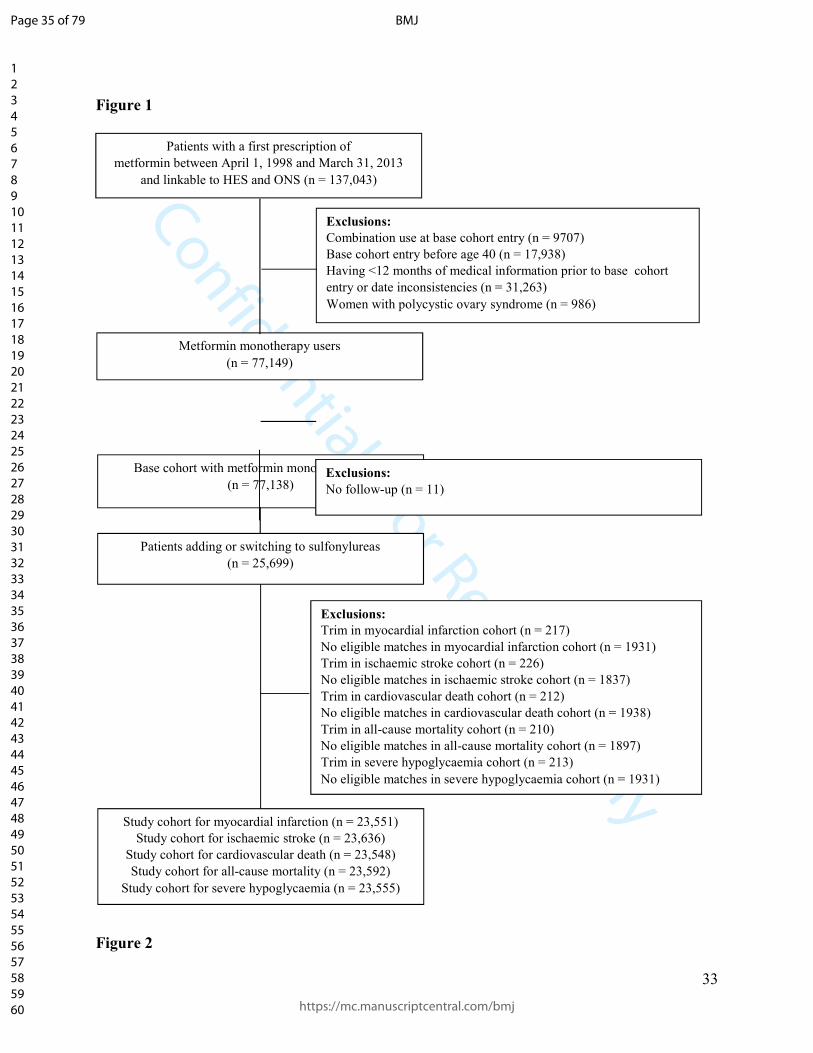
The base cohort included 77,138 patients with a first prescription for metformin between
April 1, 1998 and March 31, 2013 (Figure 1). A total of 25,699 patients added or switched to
sulfonylureas during follow-up. For the analysis on all-cause mortality, 2107 (8%) of these
patients were trimmed from the cohort due to non-overlapping hdPS distributions or did not have
any eligible matches. Therefore, the study cohort for this outcome comprised 23,592 patients
who added or switched to sulfonylureas and 23,592 matched patients who remained on
metformin monotherapy, with the size of the study cohorts for the other four outcomes being
similar (Figure 1).
The mean (standard deviation) follow-up was 1.1 (1.4) years, generating a total of
244,150 patient-years. During follow-up, there were 337 MIs (incidence rate: 6.9 per 1000/year,
95% CI: 6.2 to 7.7), 299 ischaemic strokes (incidence rate: 6.1 per 1000/year, 95% CI: 5.5 to
6.9), 429 cardiovascular deaths (incidence rate: 8.7 per 1000/year, 95% CI: 7.9 to 9.6), 1190
deaths from any cause (incidence rate: 24.4 per 1000/year, 95% CI: 23.0 to 25.8), and 150 severe
hypoglycaemic events (incidence rate: 3.1 per 1000/year, 95% CI: 2.6 to 3.6). The most frequent
causes of death were cancer (31%), cardiovascular diseases (31%), and respiratory diseases
(10%). The baseline characteristics of the matched cohorts for the analysis on all-cause mortality
are shown in Table 1. Corresponding tables for the other outcomes (MI, ischaemic stroke,
cardiovascular death, severe hypoglycaemia) were practically identical (eTables 1-4). After
hdPS matching, patients adding or switching to sulfonylureas had a similar baseline profile to
those remaining on metformin monotherapy.
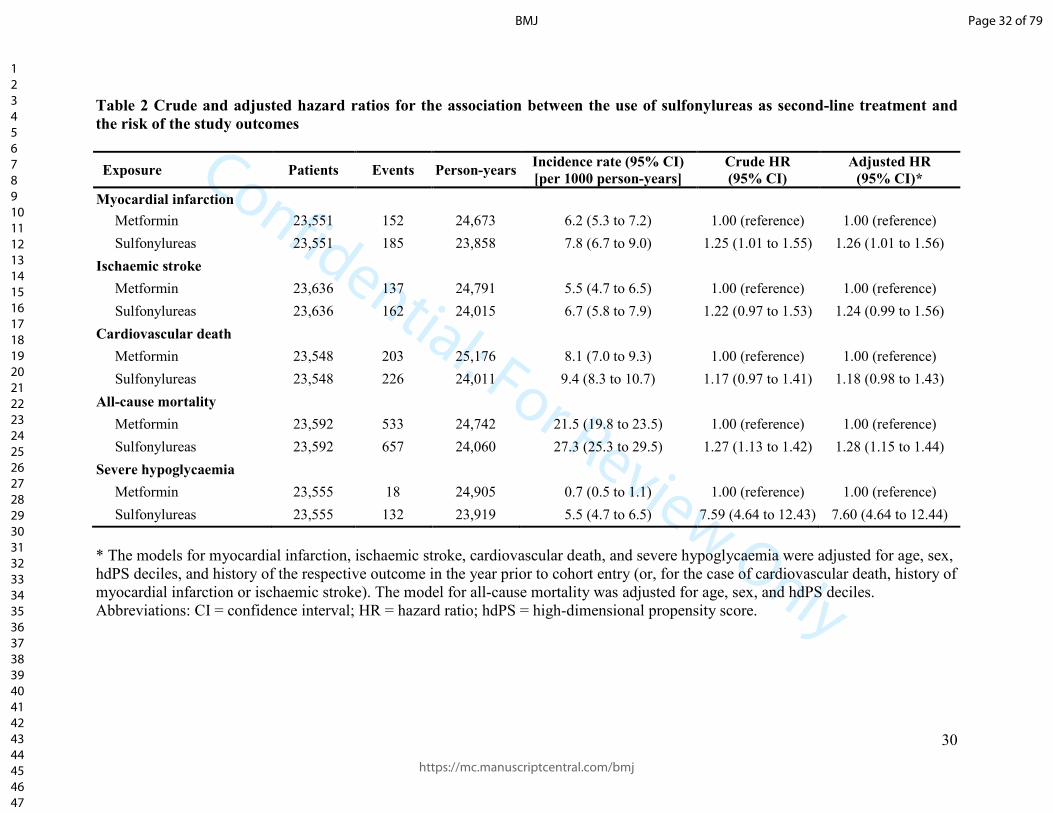
Table 2 and eFigures 2-6 show the results for the five outcomes. Compared with the use
of metformin monotherapy, adding or switching to sulfonylureas was associated with an
Page 16 of 79
https://mc.manuscriptcentral.com/bmj
BMJ
123456789101112131415161718192021222324252627282930313233343536373839404142434445464748495051525354555657585960

Confidential: For Review Only
15
increased risk of MI (7.8 versus 6.2 per 1000/year; HR 1.26; 95% CI 1.01 to 1.56), all-cause
mortality (27.3 versus 21.5 per 1000/year; HR 1.28; 95% CI 1.15 to 1.44), and severe
hypoglycaemia (5.5 versus 0.7 per 1000/year; HR 7.60; 95% CI 4.64 to 12.44). There was also a
trend towards increased risks of ischaemic stroke (6.7 versus 5.5 per 1000/year; HR 1.24; 95%
CI 0.99 to 1.56) and cardiovascular death (9.4 versus 8.1 per 1000/year; HR 1.18; 95% CI 0.98
to 1.43).
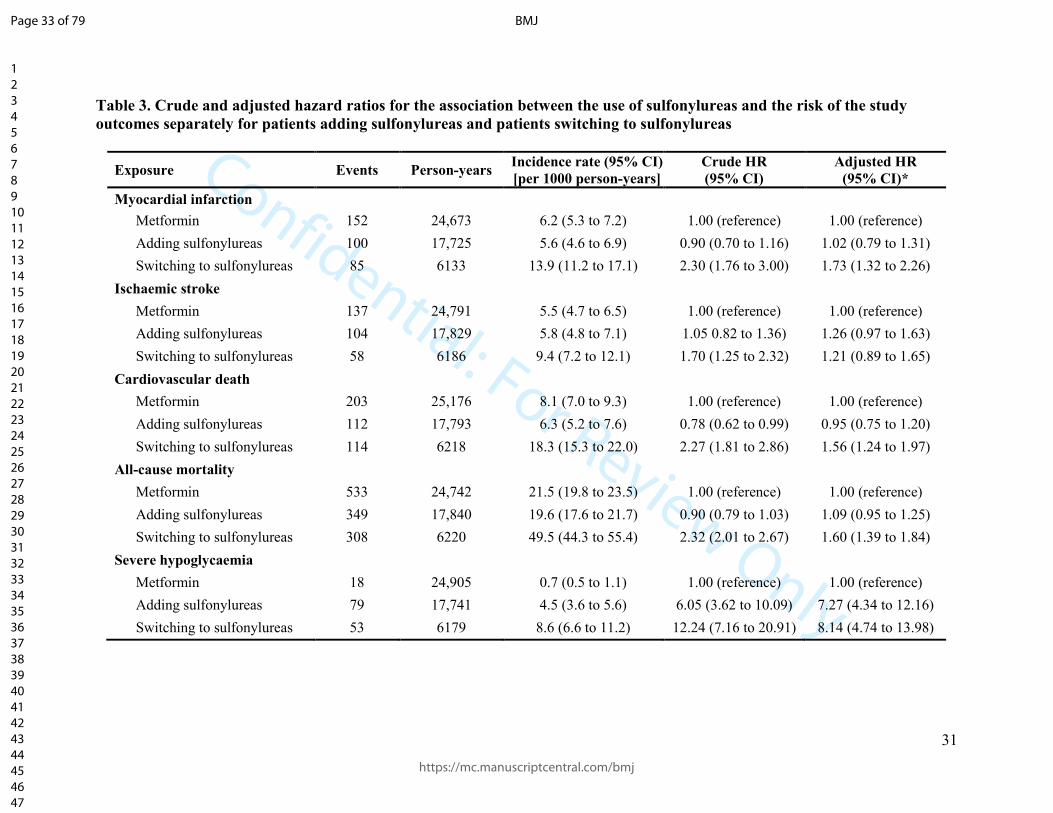
We also observed that the increase in the risk was driven by the switching to
sulfonylureas and not the addition of sulfonylureas for the outcomes of MI (HR, 1.73; 95% CI,
1.32 to 2.26 versus HR, 1.02; 95% CI, 0.79 to 1.31), cardiovascular death (HR, 1.56; 95% CI,
1.24 to 1.97 versus HR, 0.95; 95% CI, 0.75 to 1.20), and all-cause mortality (HR, 1.60; 95% CI,
1.39 to 1.84 versus HR, 1.09; 95% CI, 0.95 to 1.25) (Table 3). No such differences were
observed for ischaemic stroke (HR, 1.21; 95% CI, 0.89 to 1.65 versus HR, 1.26; 95% CI, 0.97 to
1.63) or severe hypoglycaemia (HR, 8.14; 95% CI, 4.74 to 13.98 versus HR, 7.27; 95% CI, 4.34
to 12.16) (Table 3). A head-to-head comparison between patients adding sulfonylureas to
metformin and patients switching to sulfonylureas from metformin led to similar results (patient
characteristics in eTables 5-9, results in eTable 10).
The analyses based on different durations of use yielded higher point estimates for all
five outcomes for shorter durations of use and especially for the ≤3 months category (eTables
11-15). Classifying sulfonylureas based on important pharmacologic properties provided similar
point estimates for the two sulfonylurea groups (eTable 16). The results of the primary analysis
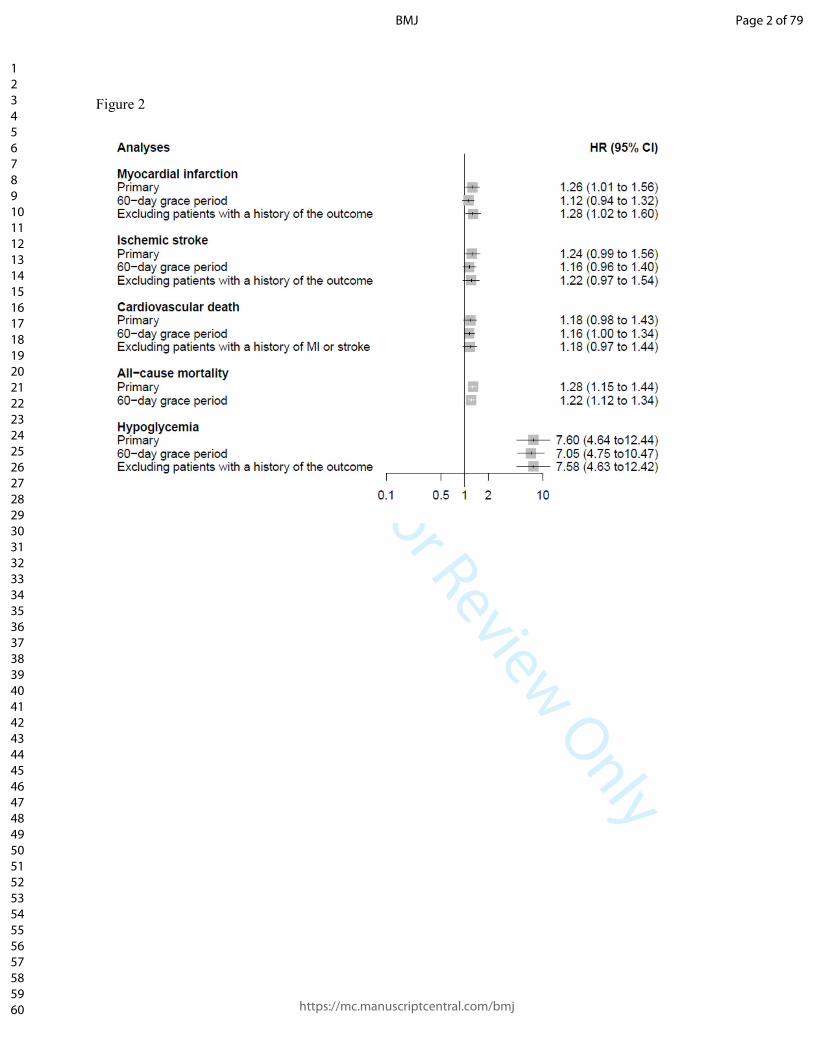
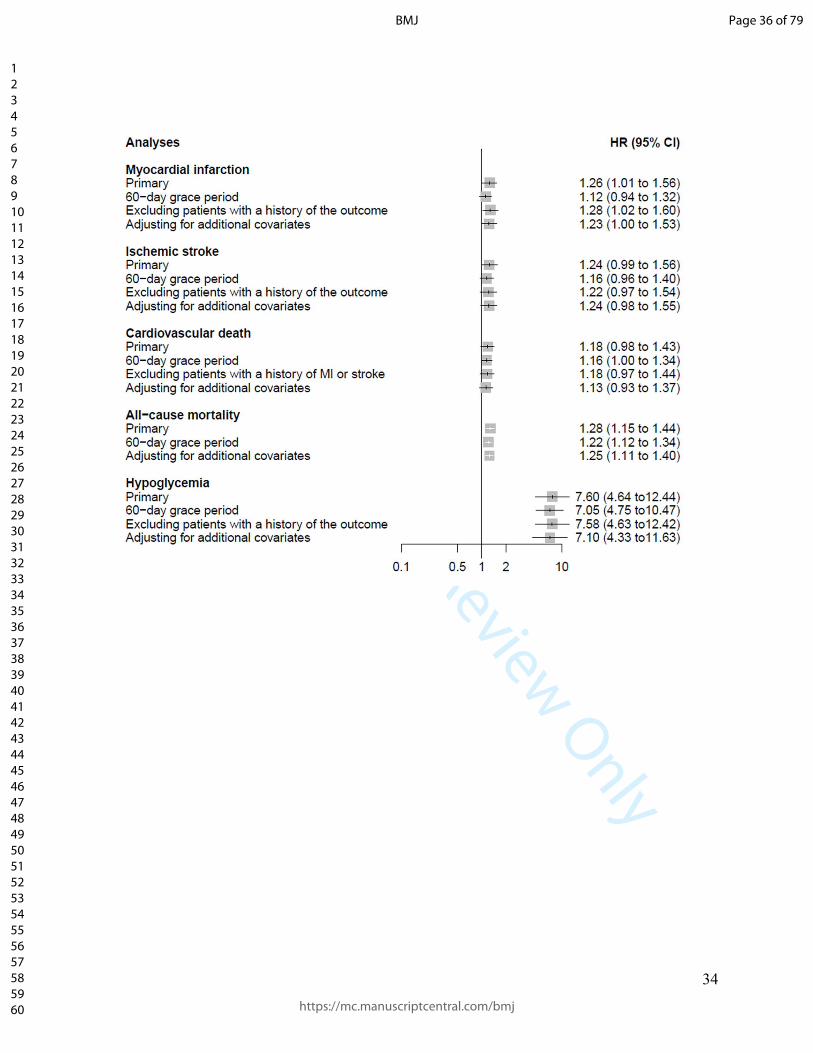
remained consistent in the sensitivity analyses (summarized in Figure 2 and presented in detail
in eTables 17-19). For MI, the extension of the grace period to 60 days led to a dilution of the
HR, resulting in a non-statistically significant association (HR 1.12; 95% CI 0.94 to 1.32). Based
Page 17 of 79
https://mc.manuscriptcentral.com/bmj
BMJ
123456789101112131415161718192021222324252627282930313233343536373839404142434445464748495051525354555657585960

Confidential: For Review Only
16
on a post-hoc analysis, the findings of the primary analysis on MI, all-cause mortality, and severe
hypoglycaemia are unlikely to be the result of an unmeasured confounder under most plausible
exposure-confounder and confounder-outcome associations (eTables 20-22). Finally, we
observed no difference in the risk among sulfonylurea and metformin patients regarding our
negative control outcome diabetic retinopathy (incidence rate 41.4 versus 40.4 per 1000/year;
HR 1.02; 95% CI 0.92 to 1.14).
Page 18 of 79
https://mc.manuscriptcentral.com/bmj
BMJ
123456789101112131415161718192021222324252627282930313233343536373839404142434445464748495051525354555657585960

Confidential: For Review Only
17
DISCUSSION
Principal findings
Our study assessed the cardiovascular and hypoglycaemic risk associated with the use of
sulfonylureas as second-line treatment. Among metformin initiators, adding or switching to
sulfonylureas was associated with an increased risk of MI, all-cause mortality and severe
hypoglycaemia, compared with patients remaining on metformin. Moreover, there was a trend
towards increased risks of ischaemic stroke and cardiovascular death. Importantly, the observed
associations with MI, cardiovascular death, and all-cause mortality were driven by the switching
to sulfonylureas and not the addition of sulfonylureas. The results of the primary analysis
remained consistent in sensitivity analyses, as well as after classifying sulfonylureas in two
different groups based on important pharmacologic properties.
Comparison with other studies
Numerous observational studies have evaluated sulfonylurea safety as first-line
treatment.3 However, their results cannot be directly extrapolated to patients having failed initial
monotherapy with metformin, since these patients probably have progressive disease and are
thus at a higher risk of adverse cardiovascular and hypoglycaemic events. Most of the studies
evaluating sulfonylurea safety as second-line treatment used other second-to-third line agents as
active comparators.7-9
Thus, no conclusions can be drawn on the risk of adding or switching to
sulfonylureas, which have been associated with an increased cardiovascular and hypoglycaemic
risk,3 14
as compared to remaining on monotherapy with metformin, a drug with potential
cardioprotective properties and low risk of hypoglycaemia.13
Moreover, among the few studies
assessing the latter risk several featured methodological limitations such as selection bias due to
Page 19 of 79
https://mc.manuscriptcentral.com/bmj
BMJ
123456789101112131415161718192021222324252627282930313233343536373839404142434445464748495051525354555657585960

Confidential: For Review Only
18
the inclusion of prevalent users,10 11
exposure misclassification,12
and confounding.10 12
For our
study, we used the recently developed prevalent new-user design.17
To emulate the randomized
controlled trial, this design identifies, at the physician visit that led to the patient on metformin
adding or being switched to sulfonylureas, a comparable patient with the same history of
metformin use and of other characteristics, but who on that visit continued on metformin. Thus,
we were able to specifically address the question of how pharmacotherapy escalation with
sulfonylureas performs in patients having failed metformin monotherapy.
To our knowledge, this is the first observational study assessing the risk of MI associated
with sulfonylureas as second-line treatment. Several potential mechanisms could account for the
increase in the risk as compared to patients remaining on metformin monotherapy. First,
sulfonylureas are associated with weight gain, which is an important risk factor for MI.25
Second,
since hypoglycaemia has been implicated in the development of arrhythmias and cardiac
ischemia,29
the hypoglycaemic propensity of sulfonylureas could have contributed to the
increased MI risk. The higher estimates observed for shorter durations of use argue for an
involvement of short-term mechanisms such as arrhythmias and against long-term mechanisms
such as weight gain. Moreover, the similar estimates obtained for the two sulfonylurea groups
classified by pancreas specificity indicate that this pharmacodynamic property does not
necessarily translate into improved clinical outcomes.22
Finally, the absence of an increased risk
of MI associated with the addition of sulfonylureas to metformin, i.e., in case of metformin
continuation, alludes to the established beneficial effects of the biguanide in this regard.13
Interestingly, metformin was recently shown to also positively modify the cardiovascular effects
of a newer class of antidiabetic drugs, the DPP-4 inhibitors.30
Page 20 of 79
https://mc.manuscriptcentral.com/bmj
BMJ
123456789101112131415161718192021222324252627282930313233343536373839404142434445464748495051525354555657585960

Confidential: For Review Only
19
Our results on all-cause mortality corroborate a previous study showing an increased risk
associated with use of sulfonylureas only, but not with concomitant use of sulfonylureas and
metformin, when compared to use of metformin only.31
Again, the absence of an increased risk
associated with the addition of sulfonylureas to metformin could reflect the beneficial effects of
the biguanide.13
Moreover, our higher point estimates for shorter durations of use indicate that
short-term mechanisms such as arrhythmias or seizures and falls potentially induced by severe
hypoglycaemia could be involved in the increased mortality risk.
Our results on severe hypoglycaemia are concordant with a recently published
observational study showing an increased risk for second-line sulfonylureas.11
Moreover, the
similar estimates we obtained for the two sulfonylurea groups classified by duration of action
argue against an effect of this pharmacokinetic property on the risk of severe hypoglycaemia in
the setting of second-line treatment. This is in contrast to our recent findings on sulfonylurea
safety in the setting of first-line treatment,22
and underscores the importance of diabetes severity
as a possible effect modifier on the risk of adverse events.
Strengths and weaknesses of our study
Our study has several strengths. First, the population-based design, the inclusion of
patients with previous events, and the few exclusion criteria make its results highly
generalizable. Second, the large sample size allowed the calculation of precise estimates even for
rare outcomes such as severe hypoglycaemia. Third, our separate analysis of two separate
sulfonylurea groups classified based on important pharmacologic properties was able to account
for the high pharmacologic heterogeneity observed this drug class.25
Page 21 of 79
https://mc.manuscriptcentral.com/bmj
BMJ
123456789101112131415161718192021222324252627282930313233343536373839404142434445464748495051525354555657585960
Confidential: For Review Only
20
Our study also has some limitations. First, due to its observational nature there is the
potential for residual confounding. However, we went to great lengths to minimize this potential
bias by matching on hdPS, the number of previous metformin prescriptions, and HbA1c level.
Moreover, we observed no difference in the risk regarding our negative control outcome diabetic
retinopathy. Second, due to the relatively short duration of follow-up, we were not able to assess
long-term risk differences between the two groups. However, the length of follow-up reflects
real-world practice of second-line sulfonylureas.7 Finally, since metformin use is contraindicated
in case of severe kidney disease and decompensated heart failure,32
we cannot exclude that such
conditions leading to metformin discontinuation and switching to sulfonylureas may also account
for the observed increased risks.
Conclusions
In summary, our study showed an increased risk of MI, all-cause mortality, and severe
hypoglycaemia associated with the use of second-line sulfonylureas compared to remaining on
metformin monotherapy. The associations with MI and all-cause mortality were driven by the
switching to sulfonylureas and not the addition of sulfonylureas. Thus, in line with current
recommendations on the treatment of type 2 diabetes,1 continuing metformin when introducing
sulfonylureas appears to be safer than switching.
Page 22 of 79
https://mc.manuscriptcentral.com/bmj
BMJ
123456789101112131415161718192021222324252627282930313233343536373839404142434445464748495051525354555657585960

Confidential: For Review Only
21
ACKNOWLEDGMENTS
A.D. is the recipient of a Research Fellowship from the German Research Foundation (Deutsche
Forschungsgemeinschaft). K.B.F. holds a a Chercheur Boursier award from the Fonds de
recherche du Québec–Santé (FRQS). L.A. holds a Chercheur Boursier award from the FRQS and
is the recipient of a William Dawson Scholar award. S.S. is the recipient of the James McGill
Professorship award.
COMPETING INTERESTS
“All authors have completed the ICMJE uniform disclosure form at
www.icmje.org/coi_disclosure.pdf and declare: this research was funded in part by grants from
the Canadian Institutes of Health Research, the Canadian Foundation for Innovation, and
Boehringer-Ingelheim. Boehringer-Ingelheim were provided with the opportunity to comment on
the manuscript, but they were not directly involved in the design and conduct of the study, the
collection, management, analysis, and interpretation of the data, or the preparation, review, or
approval of the manuscript; S.S. has received research grants and has participated in advisory
board meetings or as a speaker at conferences for AstraZeneca, Bayer, Boehringer-Ingelheim,
Bristol-Myers Squibb, Merck, and Novartis. No other potential conflicts of interest relevant to
this article were reported.
CONTRIBUTION STATEMENT
A.D., S.D., O.H.Y.Y., K.B.F., L.A., and S.S. contributed to study concept and design, analyzed
and interpreted the data, and critically revised the manuscript. A.D. drafted the manuscript. A.D.,
S.D., and S.S. conducted the statistical analysis. S.S. acquired the data, obtained funding, and
supervised the study.
Page 23 of 79
https://mc.manuscriptcentral.com/bmj
BMJ
123456789101112131415161718192021222324252627282930313233343536373839404142434445464748495051525354555657585960

Confidential: For Review Only
22
ETHICAL APPROVAL
The study protocol was approved by the Independent Scientific Advisory Committee of the
CPRD (protocol 14_019AMn) and by the Research Ethics Board of the Jewish General Hospital,
Montreal, Canada.
DATA SHARING
No additional data available.
TRANSPARENCY
The guarantor (S.S.) affirms that the manuscript is an honest, accurate, and transparent account
of the study being reported; that no important aspects of the study have been omitted; and that
any discrepancies from the study as planned (and, if relevant, registered) have been explained.
Page 24 of 79
https://mc.manuscriptcentral.com/bmj
BMJ
123456789101112131415161718192021222324252627282930313233343536373839404142434445464748495051525354555657585960
Confidential: For Review Only
23
REFERENCES
1. ADA. 7. Approaches to Glycemic Treatment. Diabetes care 2016;39 Suppl 1:S52-9. doi:
10.2337/dc16-S010 [published Online First: 2015/12/24]
2. Christensen DH, Rungby J, Thomsen RW. Nationwide trends in glucose-lowering drug use,
Denmark, 1999-2014. Clinical epidemiology 2016;8:381-87. doi: 10.2147/clep.s113211
[published Online First: 2016/10/30]
3. Azoulay L, Suissa S. Sulfonylureas and the Risks of Cardiovascular Events and Death: A
Methodological Meta-Regression Analysis of the Observational Studies. Diabetes care
2017;40(5):706-14. doi: 10.2337/dc16-1943 [published Online First: 2017/04/22]
4. Hemmingsen B, Schroll JB, Wetterslev J, et al. Sulfonylurea versus metformin monotherapy
in patients with type 2 diabetes: a Cochrane systematic review and meta-analysis of
randomized clinical trials and trial sequential analysis. CMAJ open 2014;2(3):E162-75.
doi: 10.9778/cmajo.20130073 [published Online First: 2014/10/09]
5. Dluhy RG, McMahon GT. Intensive glycemic control in the ACCORD and ADVANCE trials.
The New England journal of medicine 2008;358(24):2630-3. doi: 10.1056/NEJMe0804182
[published Online First: 2008/06/10]
6. CADTH Optimal Use Reports. Second- and Third-Line Pharmacotherapy for Type 2 Diabetes
- Update of CADTH 2010 Reviews - Project Protocol. Ottawa (ON): Canadian Agency for
Drugs and Technologies in Health 2012.
7. Roumie CL, Greevy RA, Grijalva CG, et al. Association between intensification of metformin
treatment with insulin vs sulfonylureas and cardiovascular events and all-cause mortality
among patients with diabetes. Jama 2014;311(22):2288-96. doi: 10.1001/jama.2014.4312
[published Online First: 2014/06/11]
Page 25 of 79
https://mc.manuscriptcentral.com/bmj
BMJ
123456789101112131415161718192021222324252627282930313233343536373839404142434445464748495051525354555657585960

Confidential: For Review Only
24
8. Roumie CL, Min JY, Greevy RA, et al. Risk of hypoglycemia following intensification of
metformin treatment with insulin versus sulfonylurea. CMAJ : Canadian Medical
Association journal = journal de l'Association medicale canadienne 2016;188(6):E104-12.
doi: 10.1503/cmaj.150904 [published Online First: 2016/01/27]
9. Yu OH, Yin H, Azoulay L. The combination of DPP-4 inhibitors versus sulfonylureas with
metformin after failure of first-line treatment in the risk for major cardiovascular events
and death. Canadian journal of diabetes 2015;39(5):383-9. doi: 10.1016/j.jcjd.2015.02.002
[published Online First: 2015/04/05]
10. Sillars B, Davis WA, Hirsch IB, et al. Sulphonylurea-metformin combination therapy,
cardiovascular disease and all-cause mortality: the Fremantle Diabetes Study. Diabetes,
obesity & metabolism 2010;12(9):757-65. doi: 10.1111/j.1463-1326.2010.01230.x
[published Online First: 2010/07/24]
11. Hippisley-Cox J, Coupland C. Diabetes treatments and risk of amputation, blindness, severe
kidney failure, hyperglycaemia, and hypoglycaemia: open cohort study in primary care.
BMJ (Clinical research ed) 2016;352:i1450. doi: 10.1136/bmj.i1450 [published Online
First: 2016/04/01]
12. Evans JM, Ogston SA, Emslie-Smith A, et al. Risk of mortality and adverse cardiovascular
outcomes in type 2 diabetes: a comparison of patients treated with sulfonylureas and
metformin. Diabetologia 2006;49(5):930-6. doi: 10.1007/s00125-006-0176-9 [published
Online First: 2006/03/10]
13. Effect of intensive blood-glucose control with metformin on complications in overweight
patients with type 2 diabetes (UKPDS 34). UK Prospective Diabetes Study (UKPDS)
Page 26 of 79
https://mc.manuscriptcentral.com/bmj
BMJ
123456789101112131415161718192021222324252627282930313233343536373839404142434445464748495051525354555657585960
Confidential: For Review Only
25
Group. Lancet (London, England) 1998;352(9131):854-65. [published Online First:
1998/09/22]
14. Risk of hypoglycaemia in types 1 and 2 diabetes: effects of treatment modalities and their
duration. Diabetologia 2007;50(6):1140-7. doi: 10.1007/s00125-007-0599-y [published
Online First: 2007/04/07]
15. Walley T, Mantgani A. The UK General Practice Research Database. Lancet (London,
England) 1997;350(9084):1097-9. doi: 10.1016/s0140-6736(97)04248-7 [published Online
First: 1999/04/23]
16. Herrett E, Thomas SL, Schoonen WM, et al. Validation and validity of diagnoses in the
General Practice Research Database: a systematic review. British journal of clinical
pharmacology 2010;69(1):4-14. doi: 10.1111/j.1365-2125.2009.03537.x [published Online
First: 2010/01/19]
17. Suissa S, Moodie EE, Dell'Aniello S. Prevalent new-user cohort designs for comparative
drug effect studies by time-conditional propensity scores. Pharmacoepidemiology and drug
safety 2017;26(4):459-68. doi: 10.1002/pds.4107 [published Online First: 2016/09/10]
18. Schneeweiss S, Rassen JA, Glynn RJ, et al. High-dimensional propensity score adjustment in
studies of treatment effects using health care claims data. Epidemiology (Cambridge,
Mass) 2009;20(4):512-22. doi: 10.1097/EDE.0b013e3181a663cc [published Online First:
2009/06/03]
19. Herrett E, Shah AD, Boggon R, et al. Completeness and diagnostic validity of recording
acute myocardial infarction events in primary care, hospital care, disease registry, and
national mortality records: cohort study. BMJ : British Medical Journal 2013;346 doi:
10.1136/bmj.f2350
Page 27 of 79
https://mc.manuscriptcentral.com/bmj
BMJ
123456789101112131415161718192021222324252627282930313233343536373839404142434445464748495051525354555657585960
Confidential: For Review Only
26
20. Andrade SE, Harrold LR, Tjia J, et al. A systematic review of validated methods for
identifying cerebrovascular accident or transient ischemic attack using administrative data.
Pharmacoepidemiology and drug safety 2012;21 Suppl 1:100-28. doi: 10.1002/pds.2312
[published Online First: 2012/01/25]
21. Abdelmoneim AS, Hasenbank SE, Seubert JM, et al. Variations in tissue selectivity amongst
insulin secretagogues: a systematic review. Diabetes, obesity & metabolism
2012;14(2):130-8. doi: 10.1111/j.1463-1326.2011.01496.x [published Online First:
2011/09/20]
22. Douros A, Yin H, Yu OHY, et al. Pharmacologic Differences of Sulfonylureas and the Risk
of Adverse Cardiovascular and Hypoglycemic Events. Diabetes care 2017 doi:
10.2337/dc17-0595
23. Gribble FM, Reimann F. Pharmacological modulation of K(ATP) channels. Biochemical
Society transactions 2002;30(2):333-9. doi: 10.1042/ [published Online First: 2002/05/25]
24. Gribble FM, Reimann F. Sulphonylurea action revisited: the post-cloning era. Diabetologia
2003;46(7):875-91. doi: 10.1007/s00125-003-1143-3 [published Online First: 2003/06/24]
25. Krentz AJ, Bailey CJ. Oral antidiabetic agents: current role in type 2 diabetes mellitus. Drugs
2005;65(3):385-411. [published Online First: 2005/01/27]
26. Ding P, VanderWeele TJ. Sensitivity Analysis Without Assumptions. Epidemiology
(Cambridge, Mass) 2016;27(3):368-77. doi: 10.1097/EDE.0000000000000457
27. Lipsitch M, Tchetgen Tchetgen E, Cohen T. Negative controls: a tool for detecting
confounding and bias in observational studies. Epidemiology (Cambridge, Mass)
2010;21(3):383-8. doi: 10.1097/EDE.0b013e3181d61eeb [published Online First:
2010/03/26]
Page 28 of 79
https://mc.manuscriptcentral.com/bmj
BMJ
123456789101112131415161718192021222324252627282930313233343536373839404142434445464748495051525354555657585960

Confidential: For Review Only
27
28. Solomon SD, Chew E, Duh EJ, et al. Diabetic Retinopathy: A Position Statement by the
American Diabetes Association. Diabetes care 2017;40(3):412-18. doi: 10.2337/dc16-2641
[published Online First: 2017/02/23]
29. Frier BM. Hypoglycaemia in diabetes mellitus: epidemiology and clinical implications.
Nature reviews Endocrinology 2014;10(12):711-22. doi: 10.1038/nrendo.2014.170
[published Online First: 2014/10/08]
30. Crowley MJ, Williams JW, Kosinski AS, et al. Metformin Use May Moderate the Effect of
DPP-4 Inhibitors on Cardiovascular Outcomes. Diabetes care 2017;40(12):1787-89. doi:
10.2337/dc17-1528
31. Azoulay L, Schneider-Lindner V, Dell'aniello S, et al. Combination therapy with
sulfonylureas and metformin and the prevention of death in type 2 diabetes: a nested case-
control study. Pharmacoepidemiology and drug safety 2010;19(4):335-42. doi:
10.1002/pds.1834 [published Online First: 2010/01/07]
32. Summary of product characteristics - Glucophage 2017 [updated 23.05.2017. Available
from: https://www.medicines.org.uk/emc/medicine/20952 accessed 06.12.2017.
Page 29 of 79
https://mc.manuscriptcentral.com/bmj
BMJ
123456789101112131415161718192021222324252627282930313233343536373839404142434445464748495051525354555657585960
Confidential: For Review Only
28
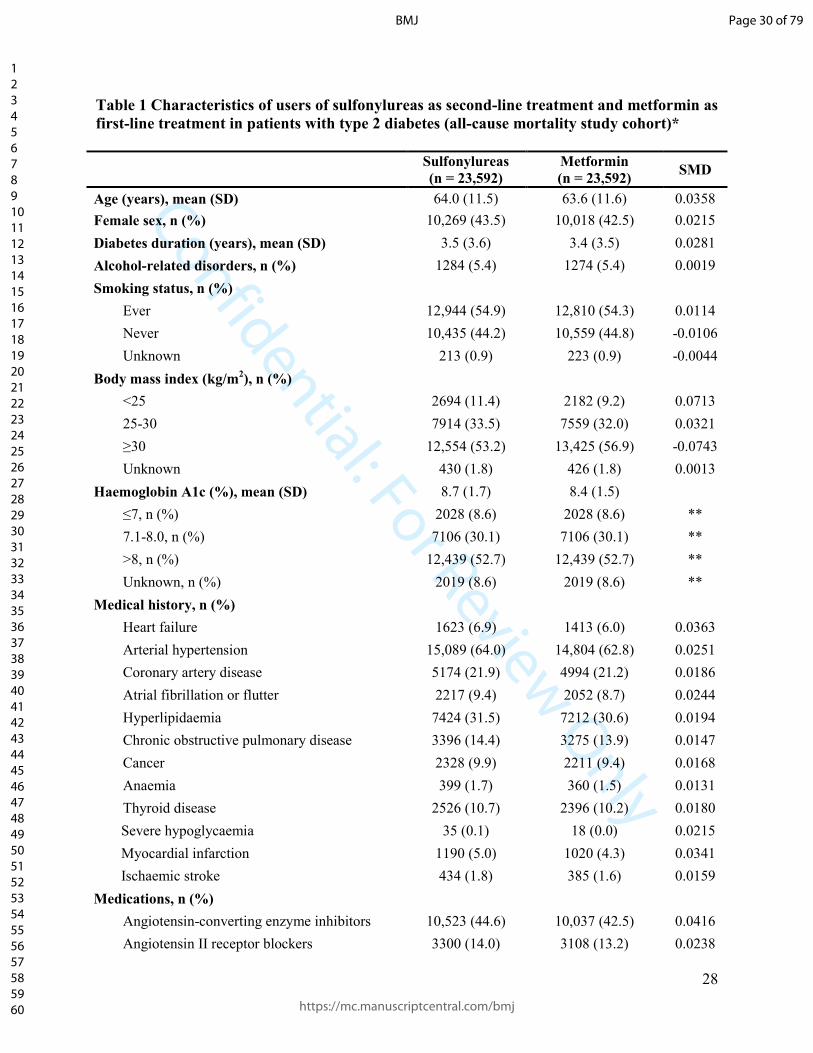
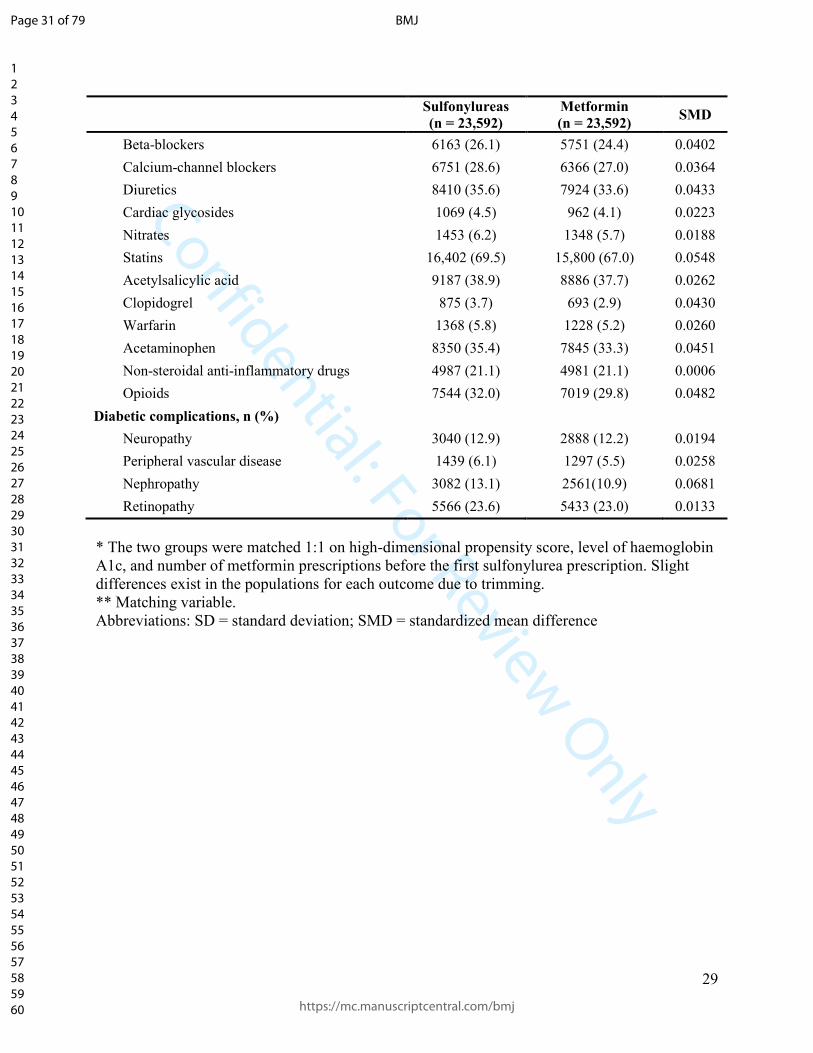
Table 1 Characteristics of users of sulfonylureas as second-line treatment and metformin as
first-line treatment in patients with type 2 diabetes (all-cause mortality study cohort)*
Sulfonylureas
(n = 23,592)
Metformin
(n = 23,592) SMD
Age (years), mean (SD) 64.0 (11.5) 63.6 (11.6) 0.0358
Female sex, n (%) 10,269 (43.5) 10,018 (42.5) 0.0215
Diabetes duration (years), mean (SD) 3.5 (3.6) 3.4 (3.5) 0.0281
Alcohol-related disorders, n (%) 1284 (5.4) 1274 (5.4) 0.0019
Smoking status, n (%)
Ever 12,944 (54.9) 12,810 (54.3) 0.0114
Never 10,435 (44.2) 10,559 (44.8) -0.0106
Unknown 213 (0.9) 223 (0.9) -0.0044
Body mass index (kg/m2), n (%)
<25 2694 (11.4) 2182 (9.2) 0.0713
25-30 7914 (33.5) 7559 (32.0) 0.0321
≥30 12,554 (53.2) 13,425 (56.9) -0.0743
Unknown 430 (1.8) 426 (1.8) 0.0013
Haemoglobin A1c (%), mean (SD) 8.7 (1.7) 8.4 (1.5)
≤7, n (%) 2028 (8.6) 2028 (8.6) **
7.1-8.0, n (%) 7106 (30.1) 7106 (30.1) **
>8, n (%) 12,439 (52.7) 12,439 (52.7) **
Unknown, n (%) 2019 (8.6) 2019 (8.6) **
Medical history, n (%)
Heart failure 1623 (6.9) 1413 (6.0) 0.0363
Arterial hypertension 15,089 (64.0) 14,804 (62.8) 0.0251
Coronary artery disease 5174 (21.9) 4994 (21.2) 0.0186
Atrial fibrillation or flutter 2217 (9.4) 2052 (8.7) 0.0244
Hyperlipidaemia 7424 (31.5) 7212 (30.6) 0.0194
Chronic obstructive pulmonary disease 3396 (14.4) 3275 (13.9) 0.0147
Cancer 2328 (9.9) 2211 (9.4) 0.0168
Anaemia 399 (1.7) 360 (1.5) 0.0131
Thyroid disease 2526 (10.7) 2396 (10.2) 0.0180
Severe hypoglycaemia 35 (0.1) 18 (0.0) 0.0215
Myocardial infarction 1190 (5.0) 1020 (4.3) 0.0341
Ischaemic stroke 434 (1.8) 385 (1.6) 0.0159
Medications, n (%)
Angiotensin-converting enzyme inhibitors 10,523 (44.6) 10,037 (42.5) 0.0416
Angiotensin II receptor blockers 3300 (14.0) 3108 (13.2) 0.0238
Page 30 of 79
https://mc.manuscriptcentral.com/bmj
BMJ
123456789101112131415161718192021222324252627282930313233343536373839404142434445464748495051525354555657585960
Confidential: For Review Only
29
Sulfonylureas
(n = 23,592)
Metformin
(n = 23,592) SMD
Beta-blockers 6163 (26.1) 5751 (24.4) 0.0402
Calcium-channel blockers 6751 (28.6) 6366 (27.0) 0.0364
Diuretics 8410 (35.6) 7924 (33.6) 0.0433
Cardiac glycosides 1069 (4.5) 962 (4.1) 0.0223
Nitrates 1453 (6.2) 1348 (5.7) 0.0188
Statins 16,402 (69.5) 15,800 (67.0) 0.0548
Acetylsalicylic acid 9187 (38.9) 8886 (37.7) 0.0262
Clopidogrel 875 (3.7) 693 (2.9) 0.0430
Warfarin 1368 (5.8) 1228 (5.2) 0.0260
Acetaminophen 8350 (35.4) 7845 (33.3) 0.0451
Non-steroidal anti-inflammatory drugs 4987 (21.1) 4981 (21.1) 0.0006
Opioids 7544 (32.0) 7019 (29.8) 0.0482
Diabetic complications, n (%)
Neuropathy 3040 (12.9) 2888 (12.2) 0.0194
Peripheral vascular disease 1439 (6.1) 1297 (5.5) 0.0258
Nephropathy 3082 (13.1) 2561(10.9) 0.0681
Retinopathy 5566 (23.6) 5433 (23.0) 0.0133
* The two groups were matched 1:1 on high-dimensional propensity score, level of haemoglobin
A1c, and number of metformin prescriptions before the first sulfonylurea prescription. Slight
differences exist in the populations for each outcome due to trimming.
** Matching variable.
Abbreviations: SD = standard deviation; SMD = standardized mean difference
Page 31 of 79
https://mc.manuscriptcentral.com/bmj
BMJ
123456789101112131415161718192021222324252627282930313233343536373839404142434445464748495051525354555657585960
Confidential: For Review Only
30
Table 2 Crude and adjusted hazard ratios for the association between the use of sulfonylureas as second-line treatment and
the risk of the study outcomes
Exposure Patients Events Person-years Incidence rate (95% CI)
[per 1000 person-years]
Crude HR
(95% CI)
Adjusted HR
(95% CI)*
Myocardial infarction
Metformin 23,551 152 24,673 6.2 (5.3 to 7.2) 1.00 (reference) 1.00 (reference)
Sulfonylureas 23,551 185 23,858 7.8 (6.7 to 9.0) 1.25 (1.01 to 1.55) 1.26 (1.01 to 1.56)
Ischaemic stroke
Metformin 23,636 137 24,791 5.5 (4.7 to 6.5) 1.00 (reference) 1.00 (reference)
Sulfonylureas 23,636 162 24,015 6.7 (5.8 to 7.9) 1.22 (0.97 to 1.53) 1.24 (0.99 to 1.56)
Cardiovascular death
Metformin 23,548 203 25,176 8.1 (7.0 to 9.3) 1.00 (reference) 1.00 (reference)
Sulfonylureas 23,548 226 24,011 9.4 (8.3 to 10.7) 1.17 (0.97 to 1.41) 1.18 (0.98 to 1.43)
All-cause mortality
Metformin 23,592 533 24,742 21.5 (19.8 to 23.5) 1.00 (reference) 1.00 (reference)
Sulfonylureas 23,592 657 24,060 27.3 (25.3 to 29.5) 1.27 (1.13 to 1.42) 1.28 (1.15 to 1.44)
Severe hypoglycaemia
Metformin 23,555 18 24,905 0.7 (0.5 to 1.1) 1.00 (reference) 1.00 (reference)
Sulfonylureas 23,555 132 23,919 5.5 (4.7 to 6.5) 7.59 (4.64 to 12.43) 7.60 (4.64 to 12.44)
* The models for myocardial infarction, ischaemic stroke, cardiovascular death, and severe hypoglycaemia were adjusted for age, sex,
hdPS deciles, and history of the respective outcome in the year prior to cohort entry (or, for the case of cardiovascular death, history of
myocardial infarction or ischaemic stroke). The model for all-cause mortality was adjusted for age, sex, and hdPS deciles.
Abbreviations: CI = confidence interval; HR = hazard ratio; hdPS = high-dimensional propensity score.
Page 32 of 79
https://mc.manuscriptcentral.com/bmj
BMJ
123456789101112131415161718192021222324252627282930313233343536373839404142434445464748495051525354555657585960
Confidential: For Review Only
31
Table 3. Crude and adjusted hazard ratios for the association between the use of sulfonylureas and the risk of the study
outcomes separately for patients adding sulfonylureas and patients switching to sulfonylureas
Exposure Events Person-years Incidence rate (95% CI)
[per 1000 person-years]
Crude HR
(95% CI)
Adjusted HR
(95% CI)*
Myocardial infarction
Metformin 152 24,673 6.2 (5.3 to 7.2) 1.00 (reference) 1.00 (reference)
Adding sulfonylureas 100 17,725 5.6 (4.6 to 6.9) 0.90 (0.70 to 1.16) 1.02 (0.79 to 1.31)
Switching to sulfonylureas 85 6133 13.9 (11.2 to 17.1) 2.30 (1.76 to 3.00) 1.73 (1.32 to 2.26)
Ischaemic stroke
Metformin 137 24,791 5.5 (4.7 to 6.5) 1.00 (reference) 1.00 (reference)
Adding sulfonylureas 104 17,829 5.8 (4.8 to 7.1) 1.05 0.82 to 1.36) 1.26 (0.97 to 1.63)
Switching to sulfonylureas 58 6186 9.4 (7.2 to 12.1) 1.70 (1.25 to 2.32) 1.21 (0.89 to 1.65)
Cardiovascular death
Metformin 203 25,176 8.1 (7.0 to 9.3) 1.00 (reference) 1.00 (reference)
Adding sulfonylureas 112 17,793 6.3 (5.2 to 7.6) 0.78 (0.62 to 0.99) 0.95 (0.75 to 1.20)
Switching to sulfonylureas 114 6218 18.3 (15.3 to 22.0) 2.27 (1.81 to 2.86) 1.56 (1.24 to 1.97)
All-cause mortality
Metformin 533 24,742 21.5 (19.8 to 23.5) 1.00 (reference) 1.00 (reference)
Adding sulfonylureas 349 17,840 19.6 (17.6 to 21.7) 0.90 (0.79 to 1.03) 1.09 (0.95 to 1.25)
Switching to sulfonylureas 308 6220 49.5 (44.3 to 55.4) 2.32 (2.01 to 2.67) 1.60 (1.39 to 1.84)
Severe hypoglycaemia
Metformin 18 24,905 0.7 (0.5 to 1.1) 1.00 (reference) 1.00 (reference)
Adding sulfonylureas 79 17,741 4.5 (3.6 to 5.6) 6.05 (3.62 to 10.09) 7.27 (4.34 to 12.16)
Switching to sulfonylureas 53 6179 8.6 (6.6 to 11.2) 12.24 (7.16 to 20.91) 8.14 (4.74 to 13.98)
Page 33 of 79
https://mc.manuscriptcentral.com/bmj
BMJ
123456789101112131415161718192021222324252627282930313233343536373839404142434445464748495051525354555657585960
Confidential: For Review Only
32
* The models for myocardial infarction, ischaemic stroke, cardiovascular death, and severe hypoglycaemia were adjusted for age, sex,
hdPS deciles, and history of the respective outcome in the year prior to cohort entry (or, for the case of cardiovascular death, history of
myocardial infarction or ischaemic stroke). The model for all-cause mortality was adjusted for age, sex, and hdPS deciles.
Abbreviations: CI = confidence interval; HR = hazard ratio; hdPS = high-dimensional propensity score.
Page 34 of 79
https://mc.manuscriptcentral.com/bmj
BMJ
123456789101112131415161718192021222324252627282930313233343536373839404142434445464748495051525354555657585960
Confidential: For Review Only
33
Figure 1
Figure 2
Patients with a first prescription of
metformin between April 1, 1998 and March 31, 2013
and linkable to HES and ONS (n = 137,043)
Exclusions:
Combination use at base cohort entry (n = 9707)
Base cohort entry before age 40 (n = 17,938)
Having <12 months of medical information prior to base cohort
entry or date inconsistencies (n = 31,263)
Women with polycystic ovary syndrome (n = 986)
Metformin monotherapy users
(n = 77,149)
Base cohort with metformin monotherapy users
(n = 77,138)
Study cohort for myocardial infarction (n = 23,551)
Study cohort for ischaemic stroke (n = 23,636)
Study cohort for cardiovascular death (n = 23,548)
Study cohort for all-cause mortality (n = 23,592)
Study cohort for severe hypoglycaemia (n = 23,555)
Exclusions:
Trim in myocardial infarction cohort (n = 217)
No eligible matches in myocardial infarction cohort (n = 1931)
Trim in ischaemic stroke cohort (n = 226)
No eligible matches in ischaemic stroke cohort (n = 1837)
Trim in cardiovascular death cohort (n = 212)
No eligible matches in cardiovascular death cohort (n = 1938)
Trim in all-cause mortality cohort (n = 210)
No eligible matches in all-cause mortality cohort (n = 1897)
Trim in severe hypoglycaemia cohort (n = 213)
No eligible matches in severe hypoglycaemia cohort (n = 1931)
Exclusions:
No follow-up (n = 11)
Patients adding or switching to sulfonylureas
(n = 25,699)
Page 35 of 79
https://mc.manuscriptcentral.com/bmj
BMJ
123456789101112131415161718192021222324252627282930313233343536373839404142434445464748495051525354555657585960
Confidential: For Review Only
34
Page 36 of 79
https://mc.manuscriptcentral.com/bmj
BMJ
123456789101112131415161718192021222324252627282930313233343536373839404142434445464748495051525354555657585960
Confidential: For Review Only
35
FIGURE LEGENDS
Figure 1
Flowchart describing the construction of base and study cohorts.
Abbreviations: HES = Hospital Episode Statistics; ONS = Office for National Statistics
Figure 2
Forest plot summarizing the primary analysis and all sensitivity analyses.
Abbreviations: HR = hazard ratio; CI = confidence interval; MI = myocardial infarction
Page 37 of 79
https://mc.manuscriptcentral.com/bmj
BMJ
123456789101112131415161718192021222324252627282930313233343536373839404142434445464748495051525354555657585960

Confidential: For Review Only
1
Table of contents
eMethods 1. Head-to-head comparison between patients adding sulfonylureas and patients
switching to sulfonylureas .............................................................................................................. 3
eMethods 2. Sensitivity analysis without assumptions ................................................................... 3
eFigure 1. Illustration of the prevalent new-user study design ....................................................... 5
eFigure 2. Cumulative incidence of myocardial infarction among users of sulfonylureas and
metformin. ....................................................................................................................................... 6
eFigure 3. Cumulative incidence of ischemic stroke among users of sulfonylureas and
metformin. ....................................................................................................................................... 7
eFigure 4. Cumulative incidence of cardiovascular death among users of sulfonylureas and
metformin. ....................................................................................................................................... 8
eFigure 5. Cumulative incidence of all-cause mortality among users of sulfonylureas and
metformin. ....................................................................................................................................... 9
eFigure 6. Cumulative incidence of severe hypoglycaemia among users of sulfonylureas and
metformin. ..................................................................................................................................... 10
eTable 1. Characteristics of users of sulfonylureas as second-line treatment and metformin as
first-line treatment in patients with type 2 diabetes (myocardial infarction study cohort)* ......... 11
eTable 2. Characteristics of users of sulfonylureas as second-line treatment and metformin as
first-line treatment in patients with type 2 diabetes (ischemic stroke study cohort)* .................. 13
eTable 3. Characteristics of users of sulfonylureas as second-line treatment and metformin as
first-line treatment in patients with type 2 diabetes (cardiovascular death study cohort)* .......... 15
eTable 4. Characteristics of users of sulfonylureas as second-line treatment and metformin as
first-line treatment in patients with type 2 diabetes (severe hypoglycaemia study cohort)* ........ 17
eTable 5. Characteristics of patients adding sulfonylureas to metformin and patients switching to
sulfonylureas from metformin (myocardial infarction study cohort) ........................................... 19
eTable 6. Characteristics of patients adding sulfonylureas to metformin and patients switching to
sulfonylureas from metformin (ischaemic stroke study cohort) ................................................... 21
eTable 7. Characteristics of patients adding sulfonylureas to metformin and patients switching to
sulfonylureas from metformin (cardiovascular death study cohort) ............................................. 23
eTable 8. Characteristics of patients adding sulfonylureas to metformin and patients switching to
sulfonylureas from metformin (all-cause mortality study cohort) ................................................ 25
eTable 9. Characteristics of patients adding sulfonylureas to metformin and patients switching to
sulfonylureas from metformin (severe hypoglycaemia study cohort) .......................................... 27
eTable 10. Crude and adjusted hazard ratios for the association between switching versus adding
sulfonylureas and the risk of the study outcomes ......................................................................... 29
Page 38 of 79
https://mc.manuscriptcentral.com/bmj
BMJ
123456789101112131415161718192021222324252627282930313233343536373839404142434445464748495051525354555657585960
Confidential: For Review Only
2
eTable 11. Crude and adjusted hazard ratios for the association between the use of sulfonylureas
and the risk of myocardial infarction according to duration of use .............................................. 30
eTable 12. Crude and adjusted hazard ratios for the association between the use of sulfonylureas
and the risk of ischaemic stroke according to duration of use ...................................................... 31
eTable 13. Crude and adjusted hazard ratios for the association between the use of sulfonylureas
and the risk of cardiovascular death according to duration of use ................................................ 32
eTable 14. Crude and adjusted hazard ratios for the association between the use of sulfonylureas
and the risk of all-cause mortality according to duration of use ................................................... 33
eTable 15. Crude and adjusted hazard ratios for the association between the use of sulfonylureas
and the risk of severe hypoglycaemia according to duration of use ............................................. 34
eTable 16. Crude and adjusted hazard ratios for the association between the use of different
sulfonylureas classified by duration of action and pancreas specificity and the risk of the study
outcomes ....................................................................................................................................... 35
eTable 17. Crude and adjusted hazard ratios for the association between the use of sulfonylureas
and the risk of the study outcomes (60-day grace period) ............................................................ 37
eTable 18. Crude and adjusted hazard ratios for the association between the use of sulfonylureas
and the risk of the study outcomes (exclusion of previous outcomes) ......................................... 38
eTable 19. Crude and adjusted hazard ratios for the association between the use of sulfonylureas
and the risk of the study outcomes (adjusting for additional covariates) ..................................... 39
eTable 20. Bounds on corrected estimates and 95% confidence intervals for unmeasured
confounding for the analysis on the risk of myocardial infarction (sensitivity analysis without
assumptions)* ............................................................................................................................... 40
eTable 21. Bounds on corrected estimates and 95% confidence intervals for unmeasured
confounding for the analysis on the risk of all-cause mortality (sensitivity analysis without
assumptions)* ............................................................................................................................... 41
eTable 22. Bounds on corrected estimates and 95% confidence intervals for unmeasured
confounding for the analysis on the risk of severe hypoglycaemia (sensitivity analysis without
assumptions)* ............................................................................................................................... 42
Page 39 of 79
https://mc.manuscriptcentral.com/bmj
BMJ
123456789101112131415161718192021222324252627282930313233343536373839404142434445464748495051525354555657585960
Confidential: For Review Only
3
eMethods 1. Head-to-head comparison between patients adding sulfonylureas and patients
switching to sulfonylureas
For this analysis, we further classified patients initiating sulfonylureas as second-line treatment
either as ‘adders’ or switchers. We defined addition of sulfonylureas as a metformin prescription
in the first month after the first sulfonylurea prescription. Switching to sulfonylureas was defined
by the absence of a metformin prescription in the same period. Next, we performed a
multivariate logistic regression to estimate the probability (propensity score) of switching to
sulfonylureas versus adding sulfonylureas conditional on all variables listed in the manuscript.
We then trimmed patients with non-overlapping propensity score distributions. The remaining
patients were followed from one month after the initial sulfonylurea prescription until they added
or switched to a non-metformin, non-sulfonylurea antidiabetic drug or experienced one of the
study outcomes, whichever occurred earlier. ‘Adders’ were additionally censored at metformin
or sulfonylurea discontinuation, and switchers were additionally censored in case of metformin
re-initiation or sulfonylurea discontinuation.
Finally, the hazard ratio of the study outcomes was estimated using a Cox proportional hazards
model adjusted for age, sex, history of the outcome in the year prior to cohort entry (in the case
of cardiovascular death it was defined as history of myocardial infarction or ischaemic stroke; in
the case of all-cause mortality this variable was not included in the model), propensity score
deciles, and for variables with a standardized mean differences >5% in Table 1 (body mass
index, diuretics, statins, acetaminophen, opioids, and nephropathy).
Patient characteristics and standardized mean differences before trimming are presented in
eTables 5-9 and the results of the risk analysis are presented in eTable 10.
eMethods 2. Sensitivity analysis without assumptions
We performed a post-hoc sensitivity analysis to assess the impact of unmeasured confounding on
our point estimates using the approach proposed by Ding and VanderWeele.1 This approach does
not impose any assumptions on the unmeasured confounder or confounders; such as having an
unmeasured confounder that is binary or having no interaction between the effects of the
exposure and the confounder on the outcome or having only one unmeasured confounder. The
analysis derives a ‘joint bounding factor’ and a sharp inequality such that the sensitivity analysis
parameters must satisfy the inequality if an unmeasured confounder is to explain away the
observed effect estimate or reduce it to a particular level. We found that in order to completely
explain away the observed increased risks of myocardial infarction, all-cause mortality, and
severe hypoglycaemia associated with sulfonylureas as second-line treatment (i.e., to reduce the
observed risks to hazard ratio = 1), an unmeasured confounder would need to be strongly
associated with both the exposure and the outcome (eTables 20-22). For example, with respect
to myocardial infarction, given an association between a potential unmeasured confounder and
the exposure of 1.5, the association between this confounder and the outcome would need to be
at least 2.5 (eTable 20).
Reference
Page 40 of 79
https://mc.manuscriptcentral.com/bmj
BMJ
123456789101112131415161718192021222324252627282930313233343536373839404142434445464748495051525354555657585960

Confidential: For Review Only
4
1. Ding P, VanderWeele TJ. Sensitivity Analysis Without Assumptions. Epidemiology
(Cambridge, Mass). 2016;27(3):368-377.
Page 41 of 79
https://mc.manuscriptcentral.com/bmj
BMJ
123456789101112131415161718192021222324252627282930313233343536373839404142434445464748495051525354555657585960
Confidential: For Review Only
5
Time in base cohort
Time in study cohort
Metformin prescription
Sulfonylurea prescription
Patient 1
Patient 3
Patient 2
Patient 5
Patient 4
Patient 6
Patient 7
Patient 8
Metformin prescription
from the exposure set
1 2 7 5 3 6 4
Number of prescriptions
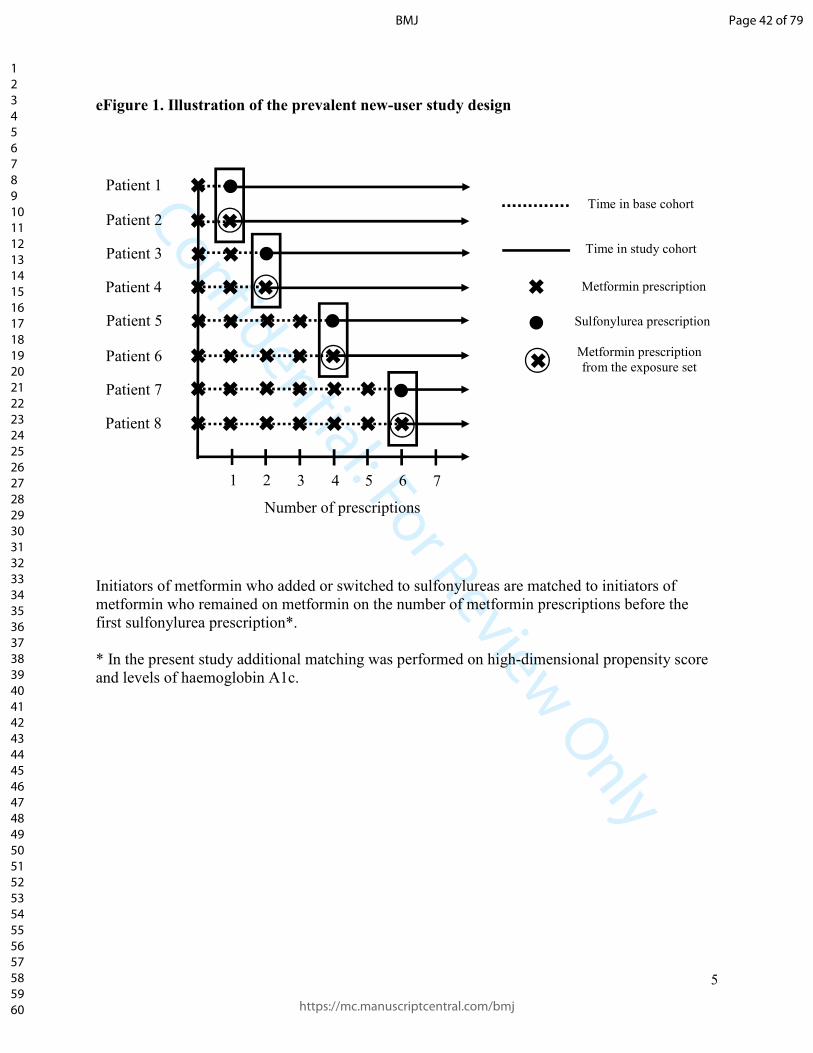
eFigure 1. Illustration of the prevalent new-user study design
Initiators of metformin who added or switched to sulfonylureas are matched to initiators of
metformin who remained on metformin on the number of metformin prescriptions before the
first sulfonylurea prescription*.
* In the present study additional matching was performed on high-dimensional propensity score
and levels of haemoglobin A1c.
Page 42 of 79
https://mc.manuscriptcentral.com/bmj
BMJ
123456789101112131415161718192021222324252627282930313233343536373839404142434445464748495051525354555657585960

Confidential: For Review Only
6
eFigure 2. Cumulative incidence of myocardial infarction among users of sulfonylureas and
metformin.
Page 43 of 79
https://mc.manuscriptcentral.com/bmj
BMJ
123456789101112131415161718192021222324252627282930313233343536373839404142434445464748495051525354555657585960
Confidential: For Review Only
7
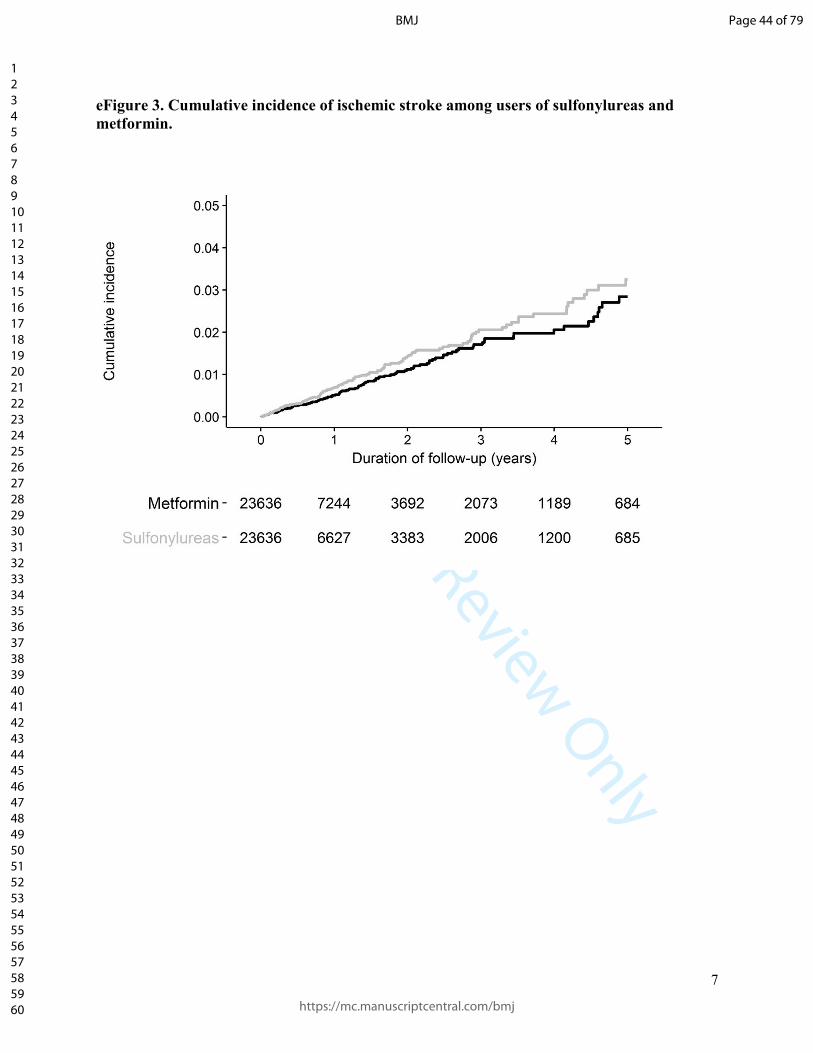
eFigure 3. Cumulative incidence of ischemic stroke among users of sulfonylureas and
metformin.
Page 44 of 79
https://mc.manuscriptcentral.com/bmj
BMJ
123456789101112131415161718192021222324252627282930313233343536373839404142434445464748495051525354555657585960
Confidential: For Review Only
8
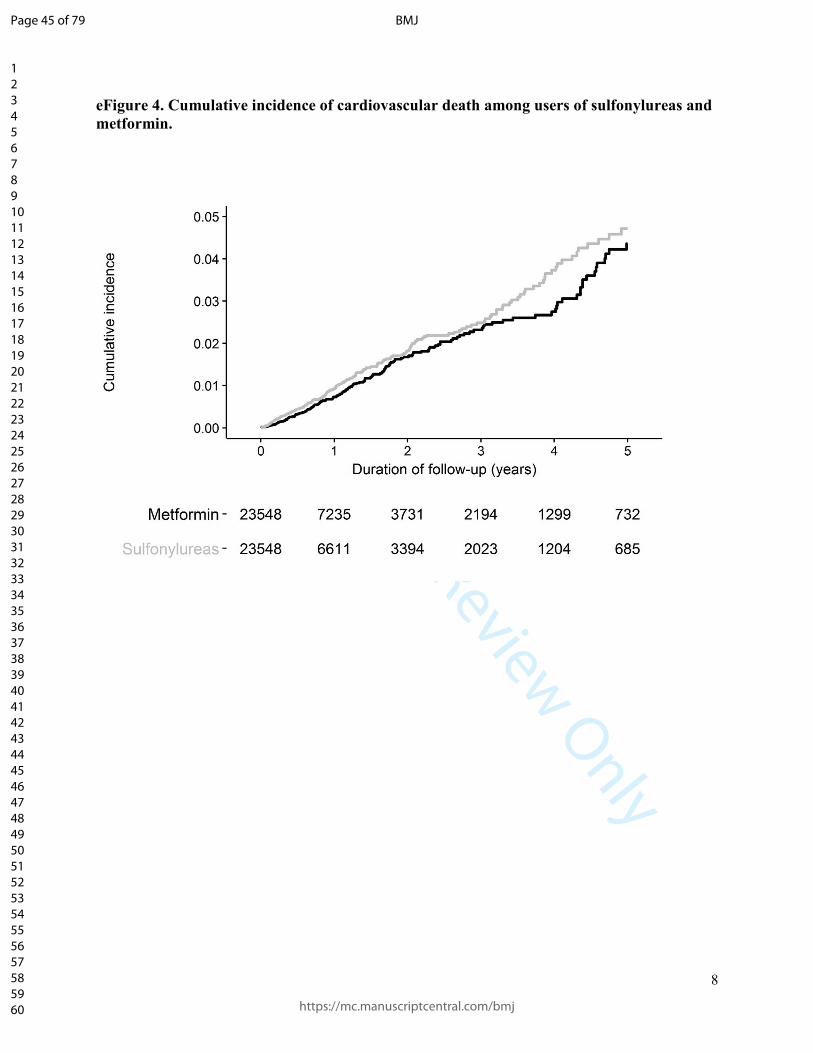
eFigure 4. Cumulative incidence of cardiovascular death among users of sulfonylureas and
metformin.
Page 45 of 79
https://mc.manuscriptcentral.com/bmj
BMJ
123456789101112131415161718192021222324252627282930313233343536373839404142434445464748495051525354555657585960
Confidential: For Review Only
9
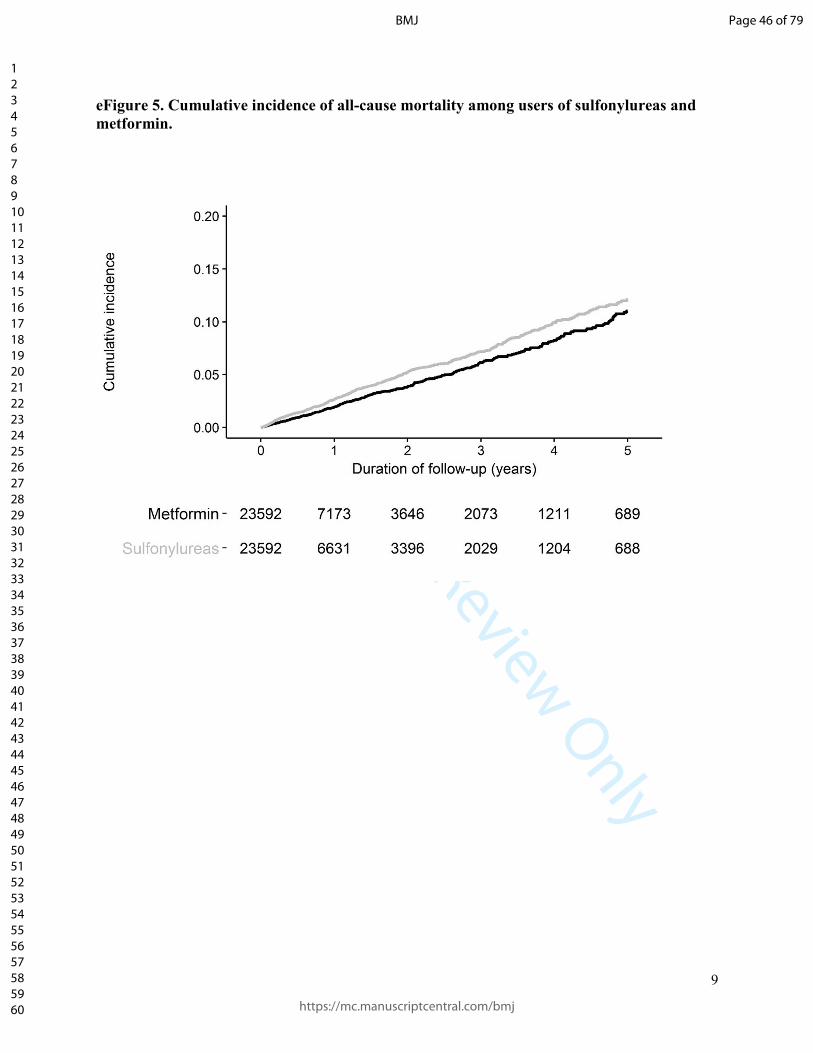
eFigure 5. Cumulative incidence of all-cause mortality among users of sulfonylureas and
metformin.
Page 46 of 79
https://mc.manuscriptcentral.com/bmj
BMJ
123456789101112131415161718192021222324252627282930313233343536373839404142434445464748495051525354555657585960

Confidential: For Review Only
10
eFigure 6. Cumulative incidence of severe hypoglycaemia among users of sulfonylureas and
metformin.
Page 47 of 79
https://mc.manuscriptcentral.com/bmj
BMJ
123456789101112131415161718192021222324252627282930313233343536373839404142434445464748495051525354555657585960

Confidential: For Review Only
11
eTable 1. Characteristics of users of sulfonylureas as second-line treatment and metformin
as first-line treatment in patients with type 2 diabetes (myocardial infarction study
cohort)*
Sulfonylureas
(n = 23,551)
Metformin
(n = 23,551) SMD
Age (years), mean (SD) 64.0 (11.5) 63.6 (11.7) 0.0328
Female sex, n (%) 10,229 (43.4) 10,111 (42.9) 0.0101
Diabetes duration (years), mean (SD) 3.5 (3.6) 3.4 (3.6) 0.0307
Alcohol-related disorders, n (%) 1293 (5.5) 1362 (5.8) -0.0127
Smoking status, n (%)
Ever 12,923 (54.9) 12,840 (54.5) 0.0071
Never 10,415 (44.2) 10,482 (44.5) -0.0057
Unknown 213 (0.9) 229 (1.0) -0.0070
Body mass index (kg/m2), n (%)
<25 2692 (11.4) 2222 (9.4) 0.0653
25-30 7903 (33.6) 7570 (32.1) 0.0301
≥30 12,522 (53.2) 13,315 (56.5) -0.0677
Missing 434 (1.8) 444 (1.9) -0.0031
Haemoglobin A1c (%), mean (SD) 8.7 (1.7) 8.4 (1.5)
≤7%, n (%) 2036 (8.6) 2036 (8.6) **
7.1-8.0%, n (%) 7107 (30.2) 7107 (30.2) **
>8%, n (%) 12,378 (52.6) 12,378 (52.6) **
Unknown, n (%) 2030 (8.6) 2030 (8.6) **
Medical history, n (%)
Heart failure 1641 (7.0) 1440 (6.1) 0.0345
Arterial hypertension 15,058 (63.9) 14,875 (63.2) 0.0161
Coronary artery disease 5171 (22.0) 4953 (21.0) 0.0225
Atrial fibrillation or flutter 2220 (9.4) 2098 (8.9) 0.0180
Hyperlipidaemia 7432 (31.6) 7186 (30.5) 0.0226
Chronic obstructive pulmonary disease 3389 (14.4) 3271 (13.9) 0.0144
Cancer 2349 (10.0) 2210 (9.4) 0.0200
Anaemia 392 (1.7) 386 (1.6) 0.0020
Thyroid disease 2509 (10.7) 2405 (10.2) 0.0144
Severe hypoglycaemia 36 (0.2) 18 (0.1) 0.0226
Myocardial infarction 1184 (5.0) 1040 (4.4) 0.0288
Ischaemic stroke 437 (1.9) 400 (1.7) 0.0119
Medications, n (%)
Angiotensin-converting enzyme inhibitors 10,506 (44.6) 10,143 (43.1) 0.0311
Page 48 of 79
https://mc.manuscriptcentral.com/bmj
BMJ
123456789101112131415161718192021222324252627282930313233343536373839404142434445464748495051525354555657585960

Confidential: For Review Only
12
Sulfonylureas
(n = 23,551)
Metformin
(n = 23,551) SMD
Angiotensin II receptor blockers 3296 (14.0) 3206 (13.6) 0.0111
Beta-blockers 6111 (25.9) 5768 (24.5) 0.0335
Calcium-channel blockers 6704 (28.5) 6271 (26.6) 0.0412
Diuretics 8388 (35.6) 7950 (33.8) 0.0391
Cardiac glycosides 1080 (4.6) 1006 (4.3) 0.0153
Nitrates 1446 (6.1) 1351 (5.7) 0.0171
Statins 16,363 (69.5) 15,761 (66.9) 0.0549
Acetylsalicylic acid 9161 (38.9) 8850 (37.6) 0.0272
Clopidogrel 873 (3.7) 718 (3.0) 0.0364
Warfarin 1374 (5.8) 1211 (5.1) 0.0304
Acetaminophen 8370 (35.5) 7739 (32.9) 0.0565
Non-steroidal anti-inflammatory drugs 4991 (21.2) 4945 (21.0) 0.0048
Opioids 7563 (32.1) 6959 (29.5) 0.0556
Diabetic complications, n (%)
Neuropathy 3033 (12.9) 2955 (12.5) 0.0099
Peripheral vascular disease 1441 (6.1) 1240 (5.3) 0.0368
Nephropathy 3109 (13.2) 2615 (11.1) 0.0642
Retinopathy 5542 (23.5) 5450 (23.1) 0.0092
* The two groups were matched 1:1 on high-dimensional propensity score, level of haemoglobin
A1c, and number of metformin prescriptions before the first sulfonylurea prescription. Slight
differences exist in the populations for each outcome due to trimming.
** Matching variable
Abbreviations: SD = standard deviation; SMD = standardized mean difference.
Page 49 of 79
https://mc.manuscriptcentral.com/bmj
BMJ
123456789101112131415161718192021222324252627282930313233343536373839404142434445464748495051525354555657585960

Confidential: For Review Only
13
eTable 2. Characteristics of users of sulfonylureas as second-line treatment and metformin
as first-line treatment in patients with type 2 diabetes (ischemic stroke study cohort)*
Sulfonylureas
(n = 23,636)
Metformin
(n = 23,636) SMD
Age (years), mean (SD) 64.0 (11.6) 63.7 (11.7) 0.0300
Female sex, n (%) 10,281 (43.5) 10,096 (42.7) 0.0158
Diabetes duration (years), mean (SD) 3.5 (3.6) 3.4 (3.5) 0.0265
Alcohol-related disorders, n (%) 1294 (5.5) 1273 (5.4) 0.0039
Smoking status, n (%)
Ever 12,957 (54.8) 12,875 (54.5) 0.0070
Never 10,466 (44.3) 10,552 (44.6) -0.0073
Unknown 213 (0.9) 209 (0.9) 0.0018
Body mass index (kg/m2), n (%)
<25 2698 (11.4) 2226 (9.4) 0.0654
25-30 7919 (33.5) 7608 (32.2) 0.0280
≥30 12,590 (53.3) 13367 (56.6) -0.0661
Missing 429 (1.8) 435 (1.8) -0.0019
Haemoglobin A1c (%), mean (SD) 8.7 (1.7) 8.4 (1.5)
≤7%, n (%) 2029 (8.6) 2029 (8.6) **
7.1-8.0%, n (%) 7107 (30.1) 7107 (30.1) **
>8%, n (%) 12,466 (52.7) 12,466 (52.7) **
Unknown, n (%) 2034 (8.6) 2034 (8.6) **
Medical history, n (%)
Heart failure 1638 (6.9) 1419 (6.0) 0.0377
Arterial hypertension 15,119 (64.0) 14,807 (62.6) 0.0274
Coronary artery disease 5206 (22.0) 4942 (20.9) 0.0272
Atrial fibrillation or flutter 2218 (9.4) 2080 (8.8) 0.0203
Hyperlipidaemia 7450 (31.5) 7176 (30.4) 0.0251
Chronic obstructive pulmonary disease 3429 (14.5) 3294 (13.9) 0.0164
Cancer 2351 (9.9) 2204 (9.3) 0.0211
Anaemia 397 (1.7) 391 (1.7) 0.0020
Thyroid disease 2530 (10.7) 2410 (10.2) 0.0166
Severe hypoglycaemia 34 (0.1) 17 (0.1) 0.0219
Myocardial infarction 1202 (5.1) 1042 (4.4) 0.0318
Ischaemic stroke 443 (1.9) 384 (1.6) 0.0190
Medications, n (%)
Angiotensin-converting enzyme inhibitors 10,541 (44.6) 10,102 (42.7) 0.0375
Angiotensin II receptor blockers 3304 (14.0) 3121 (13.2) 0.0226
Page 50 of 79
https://mc.manuscriptcentral.com/bmj
BMJ
123456789101112131415161718192021222324252627282930313233343536373839404142434445464748495051525354555657585960

Confidential: For Review Only
14
Sulfonylureas
(n = 23,636)
Metformin
(n = 23,636) SMD
Beta-blockers 6156 (26.0) 5761 (24.4) 0.0385
Calcium-channel blockers 6721 (28.4) 6357 (26.9) 0.0344
Diuretics 8427 (35.7) 7842 (33.2) 0.0521
Cardiac glycosides 1087 (4.6) 997 (4.2) 0.0185
Nitrates 1456 (6.2) 1314 (5.6) 0.0256
Statins 16,432 (69.5) 15,888 (67.2) 0.0495
Acetylsalicylic acid 9219 (39.0) 8807 (37.3) 0.0359
Clopidogrel 890 (3.8) 707 (3.0) 0.0429
Warfarin 1368 (5.8) 1255 (5.3) 0.0209
Acetaminophen 8386 (35.5) 7859 (33.3) 0.0470
Non-steroidal anti-inflammatory drugs 5008 (21.2) 4931 (20.9) 0.0080
Opioids 7596 (32.1) 7033 (29.8) 0.0515
Diabetic complications, n (%)
Neuropathy 3044 (12.9) 2957 (12.5) 0.0111
Peripheral vascular disease 1446 (6.1) 1287 (5.4) 0.0288
Nephropathy 3123 (13.2) 2605 (11.0) 0.0672
Retinopathy 5575 (23.6) 5431 (23.0) 0.0144
* The two groups were matched 1:1 on high-dimensional propensity score, level of haemoglobin
A1c, and number of metformin prescriptions before the first sulfonylurea prescription. Slight
differences exist in the populations for each outcome due to trimming.
** Matching variable
Abbreviations: SD = standard deviation; SMD = standardized mean difference.
Page 51 of 79
https://mc.manuscriptcentral.com/bmj
BMJ
123456789101112131415161718192021222324252627282930313233343536373839404142434445464748495051525354555657585960

Confidential: For Review Only
15
eTable 3. Characteristics of users of sulfonylureas as second-line treatment and metformin
as first-line treatment in patients with type 2 diabetes (cardiovascular death study cohort)*
Sulfonylureas
(n = 23,548)
Metformin
(n = 23,548) SMD
Age (years), mean (SD) 64.0 (11.5) 63.6 (11.7) 0.0384
Female sex, n (%) 10,263 (43.6) 10,099 (42.9) 0.0141
Diabetes duration (years), mean (SD) 3.5 (3.6) 3.4 (3.6) 0.0231
Alcohol-related disorders, n (%) 1291 (5.5) 1273 (5.4) 0.0034
Smoking status, n (%)
Ever 12,917 (54.9) 12,820 (54.4) 0.0083
Never 10,417 (44.2) 10,506 (44.6) -0.0076
Unknown 214 (0.9) 222 (0.9) -0.0035
Body mass index (kg/m2), n (%)
<25 2686 (11.4) 2156 (9.2) 0.0742
25-30 7914 (33.6) 7565 (32.1) 0.0316
≥30 12,518 (53.2) 13,410 (56.9) -0.0762
Missing 430 (1.8) 417 (1.8) 0.0042
Haemoglobin A1c (%), mean (SD) 8.7 (1.7) 8.4 (1.5)
≤7%, n (%) 2027 (8.6) 2027 (8.6) **
7.1-8.0%, n (%) 7112 (30.2) 7112 (30.2) **
>8%, n (%) 12,379 (52.6) 12,379 (52.6) **
Unknown, n (%) 2030 (8.6) 2030 (8.6) **
Medical history, n (%)
Heart failure 1641 (7.0) 1428 (6.1) 0.0367
Arterial hypertension 15,052 (63.9) 14,821 (62.9) 0.0204
Coronary artery disease 5158 (21.9) 5031 (21.4) 0.0131
Atrial fibrillation or flutter 2208 (9.4) 2096 (8.9) 0.0165
Hyperlipidaemia 7418 (31.5) 7189 (30.5) 0.0210
Chronic obstructive pulmonary disease 3416 (14.5) 3282 (13.9) 0.0163
Cancer 2323 (9.9) 2167 (9.2) 0.0226
Anaemia 387 (1.6) 386 (1.6) 0.0003
Thyroid disease 2523 (10.7) 2441 (10.4) 0.0113
Severe hypoglycaemia 32 (0.1) 15 (0.1) 0.0229
Myocardial infarction 1185 (5.0) 1090 (4.6) 0.0188
Ischaemic stroke 441 (1.9) 361 (1.5) 0.0263
Medications, n (%)
Angiotensin-converting enzyme inhibitors 10,516 (44.7) 10,077 (42.8) 0.0376
Angiotensin II receptor blockers 3281 (13.9) 3273 (13.9) 0.0010
Page 52 of 79
https://mc.manuscriptcentral.com/bmj
BMJ
123456789101112131415161718192021222324252627282930313233343536373839404142434445464748495051525354555657585960

Confidential: For Review Only
16
Sulfonylureas
(n = 23,548)
Metformin
(n = 23,548) SMD
Beta-blockers 6119 (26.0) 5836 (24.8) 0.0276
Calcium-channel blockers 6717 (28.5) 6269 (26.6) 0.0426
Diuretics 8364 (35.5) 7948 (33.8) 0.0371
Cardiac glycosides 1077 (4.6) 1038 (4.4) 0.0080
Nitrates 1446 (6.1) 1367 (5.8) 0.0142
Statins 16,358 (69.5) 15,730 (66.8) 0.0573
Acetylsalicylic acid 9166 (38.9) 8841 (37.5) 0.0284
Clopidogrel 879 (3.7) 716 (3.0) 0.0383
Warfarin 1368 (5.8) 1265 (5.4) 0.0190
Acetaminophen 8341 (35.4) 7784 (33.1) 0.0499
Non-steroidal anti-inflammatory drugs 4973 (21.1) 5075 (21.6) -0.0106
Opioids 7546 (32.0) 6930 (29.4) 0.0567
Diabetic complications, n (%)
Neuropathy 3025 (12.8) 2858 (12.1) 0.0215
Peripheral vascular disease 1437 (6.1) 1308 (5.6) 0.0234
Nephropathy 3098 (13.2) 2575 (10.9) 0.0683
Retinopathy 5540 (23.5) 5408 (23.0) 0.0133
* The two groups were matched 1:1 on high-dimensional propensity score, level of haemoglobin
A1c, and number of metformin prescriptions before the first sulfonylurea prescription. Slight
differences exist in the populations for each outcome due to trimming.
** Matching variable
Abbreviations: SD = standard deviation; SMD = standardized mean difference.
Page 53 of 79
https://mc.manuscriptcentral.com/bmj
BMJ
123456789101112131415161718192021222324252627282930313233343536373839404142434445464748495051525354555657585960

Confidential: For Review Only
17
eTable 4. Characteristics of users of sulfonylureas as second-line treatment and metformin
as first-line treatment in patients with type 2 diabetes (severe hypoglycaemia study
cohort)*
Sulfonylureas
(n = 23,555)
Metformin
(n = 23,555) SMD
Age (years), mean (SD) 64.0 (11.5) 63.7 (11.7) 0.0291
Female sex, n (%) 10,250 (43.5) 10,104 (42.9) 0.0125
Diabetes duration (years), mean (SD) 3.5 (3.6) 3.3 (3.6) 0.0336
Alcohol-related disorders, n (%) 1301 (5.5) 1316 (5.6) -0.0028
Smoking status, n (%)
Ever 12,928 (54.9) 12,874 (54.7) 0.0046
Never 10,413 (44.2) 10,472 (44.5) -0.0050
Unknown 214 (0.9) 209 (0.9) 0.0023
Body mass index (kg/m2), n (%)
<25 2704 (11.5) 2152 (9.1) 0.0771
25-30 7912 (33.6) 7659 (32.5) 0.0228
≥30 12,510 (53.1) 13,305 (56.5) -0.0679
Missing 429 (1.8) 439 (1.9) -0.0032
Haemoglobin A1c (%), mean (SD) 8.7 (1.7) 8.4 (1.5)
≤7%, n (%) 2040 (8.7) 2040 (8.7) **
7.1-8.0%, n (%) 7097 (30.1) 7097 (30.1) **
>8%, n (%) 12,396 (52.6) 12,396 (52.6) **
Unknown, n (%) 2022 (8.6) 2022 (8.6) **
Medical history, n (%)
Heart failure 1637 (6.9) 1377 (5.8) 0.0451
Arterial hypertension 15,065 (64.0) 14,741 (62.6) 0.0285
Coronary artery disease 5170 (21.9) 4986 (21.2) 0.0190
Atrial fibrillation or flutter 2235 (9.5) 2094 (8.9) 0.0207
Hyperlipidaemia 7422 (31.5) 7244 (30.8) 0.0163
Chronic obstructive pulmonary disease 3400 (14.4) 3327 (14.1) 0.0089
Cancer 2331 (9.9) 2211 (9.4) 0.0173
Anaemia 394 (1.7) 392 (1.7) 0.0007
Thyroid disease 2537 (10.8) 2395 (10.2) 0.0197
Severe hypoglycaemia 37 (0.2) 12 (0.1) 0.0329
Myocardial infarction 1174 (5.0) 1015 (4.3) 0.0321
Ischaemic stroke 436 (1.9) 397 (1.7) 0.0126
Medications, n (%)
Angiotensin-converting enzyme inhibitors 10,486 (44.5) 10,093 (42.8) 0.0336
Page 54 of 79
https://mc.manuscriptcentral.com/bmj
BMJ
123456789101112131415161718192021222324252627282930313233343536373839404142434445464748495051525354555657585960
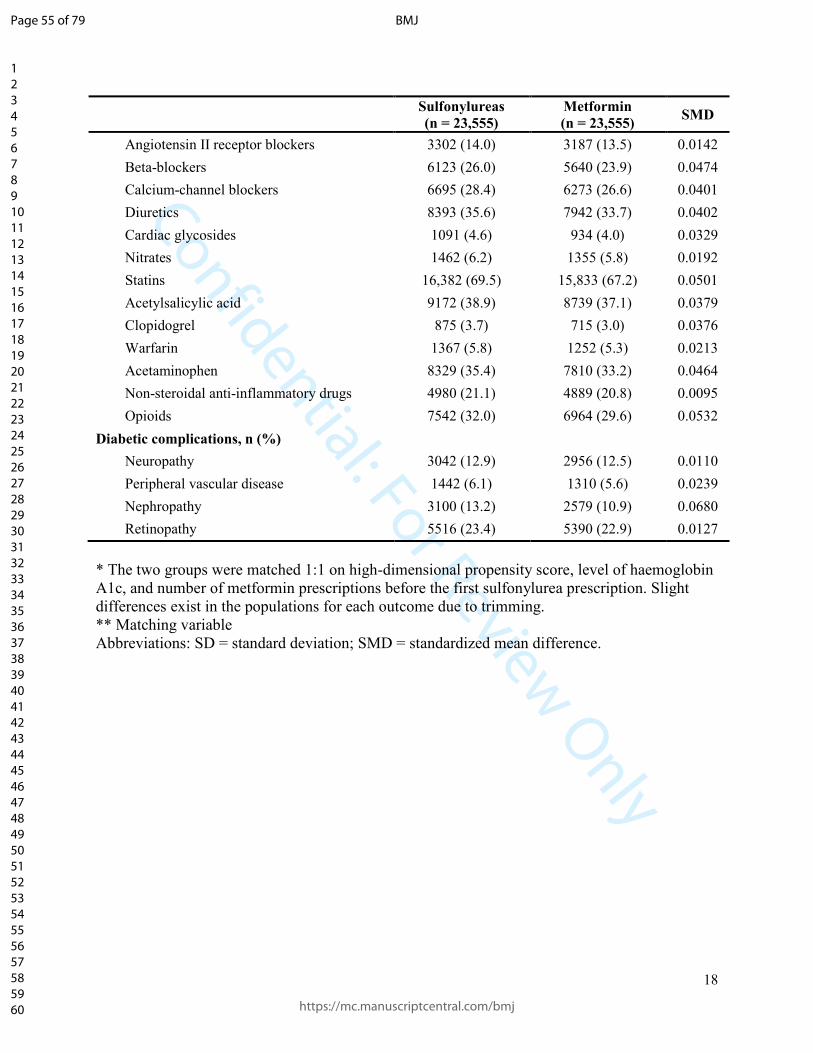
Confidential: For Review Only
18
Sulfonylureas
(n = 23,555)
Metformin
(n = 23,555) SMD
Angiotensin II receptor blockers 3302 (14.0) 3187 (13.5) 0.0142
Beta-blockers 6123 (26.0) 5640 (23.9) 0.0474
Calcium-channel blockers 6695 (28.4) 6273 (26.6) 0.0401
Diuretics 8393 (35.6) 7942 (33.7) 0.0402
Cardiac glycosides 1091 (4.6) 934 (4.0) 0.0329
Nitrates 1462 (6.2) 1355 (5.8) 0.0192
Statins 16,382 (69.5) 15,833 (67.2) 0.0501
Acetylsalicylic acid 9172 (38.9) 8739 (37.1) 0.0379
Clopidogrel 875 (3.7) 715 (3.0) 0.0376
Warfarin 1367 (5.8) 1252 (5.3) 0.0213
Acetaminophen 8329 (35.4) 7810 (33.2) 0.0464
Non-steroidal anti-inflammatory drugs 4980 (21.1) 4889 (20.8) 0.0095
Opioids 7542 (32.0) 6964 (29.6) 0.0532
Diabetic complications, n (%)
Neuropathy 3042 (12.9) 2956 (12.5) 0.0110
Peripheral vascular disease 1442 (6.1) 1310 (5.6) 0.0239
Nephropathy 3100 (13.2) 2579 (10.9) 0.0680
Retinopathy 5516 (23.4) 5390 (22.9) 0.0127
* The two groups were matched 1:1 on high-dimensional propensity score, level of haemoglobin
A1c, and number of metformin prescriptions before the first sulfonylurea prescription. Slight
differences exist in the populations for each outcome due to trimming.
** Matching variable
Abbreviations: SD = standard deviation; SMD = standardized mean difference.
Page 55 of 79
https://mc.manuscriptcentral.com/bmj
BMJ
123456789101112131415161718192021222324252627282930313233343536373839404142434445464748495051525354555657585960

Confidential: For Review Only
19
eTable 5. Characteristics of patients adding sulfonylureas to metformin and patients
switching to sulfonylureas from metformin (myocardial infarction study cohort)
Adding
sulfonylureas
(n = 13,210)
Switching to
sulfonylureas
(n = 9765)
SMD
Age (years), mean (SD) 62.3 (11.1) 66.4 (11.7) -0.3557
Female sex, n (%) 5256 (39.8) 4720 (48.3) -0.1728
Diabetes duration (years), mean (SD) 3.4 (3.4) 3.6 (3.8) -0.0502
Alcohol-related disorders, n (%) 769 (5.8) 488 (5.0) 0.0364
Smoking status, n (%)
Ever 7351 (55.6) 5239 (53.7) 0.0401
Never 5748 (43.5) 4427 (45.3) -0.0367
Unknown 111 (0.8) 99 (1.0) -0.0181
Body mass index (kg/m2), n (%)
<25 1303 (9.9) 1301 (13.3) -0.1082
25-30 4297 (32.5) 3429 (35.1) -0.0547
≥30 7392 (56.0) 4830 (49.5) 0.1304
Missing 218 (1.7) 205 (2.1) -0.0331
Haemoglobin A1c (%), mean (SD) 9.0 (1.7) 8.4 (1.6) 0.3120
≤7%, n (%) 644 (4.9) 1325 (13.6) -0.3039
7.1-8.0%, n (%) 3902 (29.5) 3099 (31.7) -0.0477
>8%, n (%) 7647 (57.9) 4412 (45.2) 0.2563
Unknown, n (%) 1017 (7.7) 929 (9.5) -0.0647
Medical history, n (%)
Heart failure 734 (5.6) 854 (8.7) -0.1240
Arterial hypertension 8142 (61.6) 6558 (67.2) -0.1155
Coronary artery disease 2675 (20.2) 2362 (24.2) -0.0948
Atrial fibrillation or flutter 1055 (8.0) 1094 (11.2) -0.1094
Hyperlipidaemia 4066 (30.8) 3172 (32.5) -0.0366
Chronic obstructive pulmonary disease 1770 (13.4) 1522 (15.6) -0.0622
Cancer 1122 (8.5) 1131 (11.6) -0.1029
Anaemia 186 (1.4) 192 (2.0) -0.0434
Thyroid disease 1291 (9.8) 1153 (11.8) -0.0656
Severe hypoglycaemia 16 (0.1) 15 (0.2) -0.0088
Myocardial infarction 619 (4.7) 534 (5.5) -0.0357
Ischaemic stroke 231 (1.7) 190 (1.9) -0.0146
Medications, n (%)
Angiotensin-converting enzyme inhibitors 5946 (45.0) 4311 (44.1) 0.0174
Page 56 of 79
https://mc.manuscriptcentral.com/bmj
BMJ
123456789101112131415161718192021222324252627282930313233343536373839404142434445464748495051525354555657585960

Confidential: For Review Only
20
Adding
sulfonylureas
(n = 13,210)
Switching to
sulfonylureas
(n = 9765)
SMD
Angiotensin II receptor blockers 1693 (12.8) 1538 (15.8) -0.0839
Beta-blockers 3199 (24.2) 2777 (28.4) -0.0960
Calcium-channel blockers 3630 (27.5) 2910 (29.8) -0.0514
Diuretics 4286 (32.4) 3880 (39.7) -0.1522
Cardiac glycosides 505 (3.8) 546 (5.6) -0.0836
Nitrates 708 (5.4) 707 (7.2) -0.0775
Statins 9520 (72.1) 6494 (66.5) 0.1208
Acetylsalicylic acid 5217 (39.5) 3746 (38.4) 0.0232
Clopidogrel 405 (3.1) 440 (4.5) -0.0755
Warfarin 647 (4.9) 689 (7.1) -0.0911
Acetaminophen 4363 (33.0) 3769 (38.6) -0.1164
Non-steroidal anti-inflammatory drugs 2734 (20.7) 2125 (21.8) -0.0260
Opioids 3979 (30.1) 3348 (34.3) -0.0892
Diabetic complications, n (%)
Neuropathy 1608 (12.2) 1361 (13.9) -0.0524
Peripheral vascular disease 739 (5.6) 665 (6.8) -0.0504
Nephropathy 1401 (10.6) 1627 (16.7) -0.1772
Retinopathy 3071 (23.2) 2353 (24.1) -0.0200
Abbreviations: SD = standard deviation; SMD = standardized mean difference.
Page 57 of 79
https://mc.manuscriptcentral.com/bmj
BMJ
123456789101112131415161718192021222324252627282930313233343536373839404142434445464748495051525354555657585960
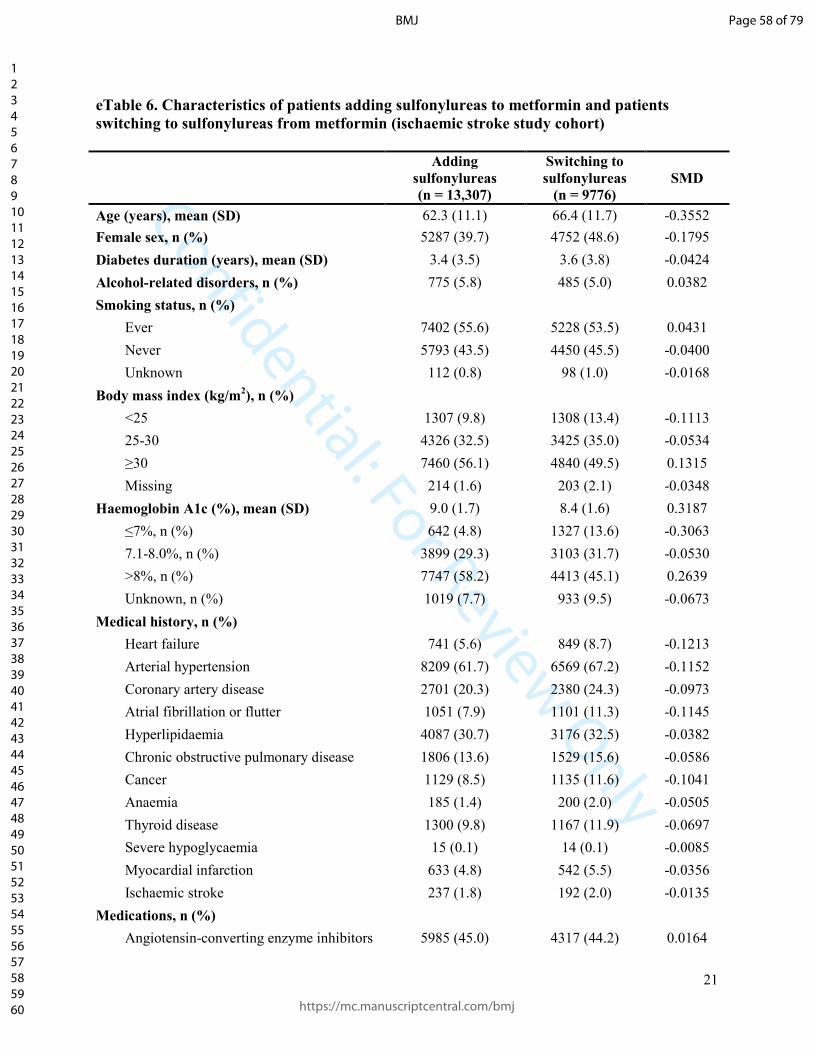
Confidential: For Review Only
21
eTable 6. Characteristics of patients adding sulfonylureas to metformin and patients
switching to sulfonylureas from metformin (ischaemic stroke study cohort)
Adding
sulfonylureas
(n = 13,307)
Switching to
sulfonylureas
(n = 9776)
SMD
Age (years), mean (SD) 62.3 (11.1) 66.4 (11.7) -0.3552
Female sex, n (%) 5287 (39.7) 4752 (48.6) -0.1795
Diabetes duration (years), mean (SD) 3.4 (3.5) 3.6 (3.8) -0.0424
Alcohol-related disorders, n (%) 775 (5.8) 485 (5.0) 0.0382
Smoking status, n (%)
Ever 7402 (55.6) 5228 (53.5) 0.0431
Never 5793 (43.5) 4450 (45.5) -0.0400
Unknown 112 (0.8) 98 (1.0) -0.0168
Body mass index (kg/m2), n (%)
<25 1307 (9.8) 1308 (13.4) -0.1113
25-30 4326 (32.5) 3425 (35.0) -0.0534
≥30 7460 (56.1) 4840 (49.5) 0.1315
Missing 214 (1.6) 203 (2.1) -0.0348
Haemoglobin A1c (%), mean (SD) 9.0 (1.7) 8.4 (1.6) 0.3187
≤7%, n (%) 642 (4.8) 1327 (13.6) -0.3063
7.1-8.0%, n (%) 3899 (29.3) 3103 (31.7) -0.0530
>8%, n (%) 7747 (58.2) 4413 (45.1) 0.2639
Unknown, n (%) 1019 (7.7) 933 (9.5) -0.0673
Medical history, n (%)
Heart failure 741 (5.6) 849 (8.7) -0.1213
Arterial hypertension 8209 (61.7) 6569 (67.2) -0.1152
Coronary artery disease 2701 (20.3) 2380 (24.3) -0.0973
Atrial fibrillation or flutter 1051 (7.9) 1101 (11.3) -0.1145
Hyperlipidaemia 4087 (30.7) 3176 (32.5) -0.0382
Chronic obstructive pulmonary disease 1806 (13.6) 1529 (15.6) -0.0586
Cancer 1129 (8.5) 1135 (11.6) -0.1041
Anaemia 185 (1.4) 200 (2.0) -0.0505
Thyroid disease 1300 (9.8) 1167 (11.9) -0.0697
Severe hypoglycaemia 15 (0.1) 14 (0.1) -0.0085
Myocardial infarction 633 (4.8) 542 (5.5) -0.0356
Ischaemic stroke 237 (1.8) 192 (2.0) -0.0135
Medications, n (%)
Angiotensin-converting enzyme inhibitors 5985 (45.0) 4317 (44.2) 0.0164
Page 58 of 79
https://mc.manuscriptcentral.com/bmj
BMJ
123456789101112131415161718192021222324252627282930313233343536373839404142434445464748495051525354555657585960
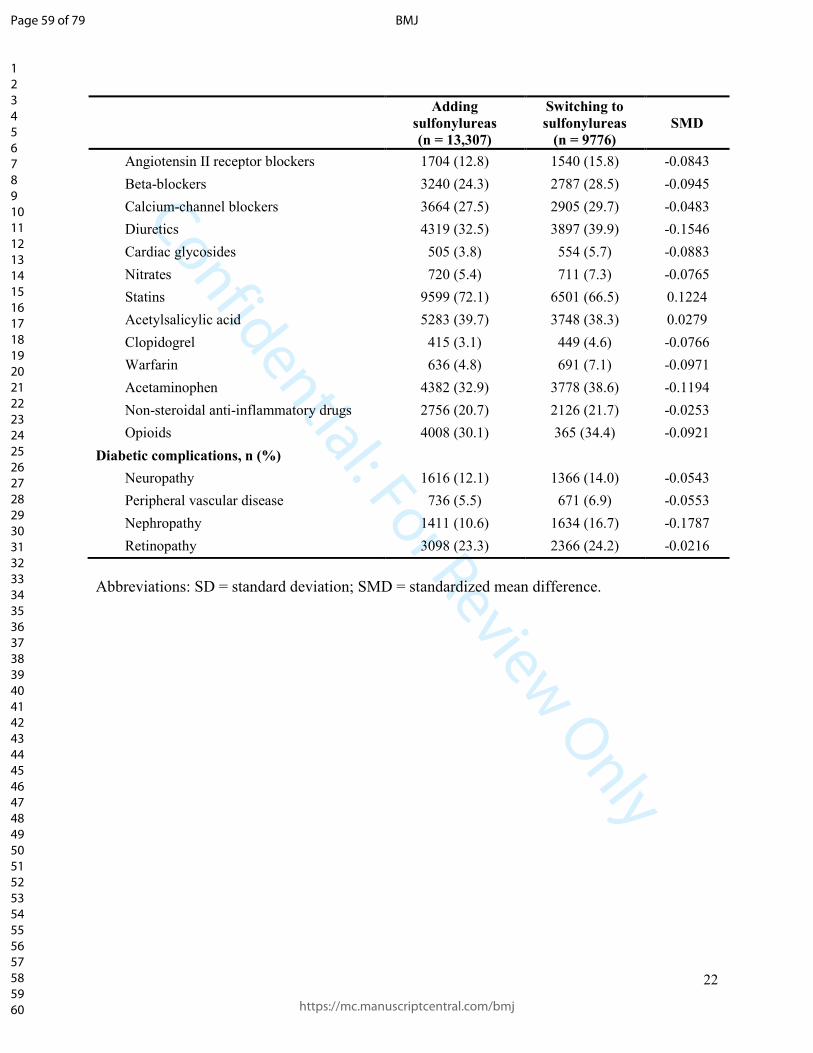
Confidential: For Review Only
22
Adding
sulfonylureas
(n = 13,307)
Switching to
sulfonylureas
(n = 9776)
SMD
Angiotensin II receptor blockers 1704 (12.8) 1540 (15.8) -0.0843
Beta-blockers 3240 (24.3) 2787 (28.5) -0.0945
Calcium-channel blockers 3664 (27.5) 2905 (29.7) -0.0483
Diuretics 4319 (32.5) 3897 (39.9) -0.1546
Cardiac glycosides 505 (3.8) 554 (5.7) -0.0883
Nitrates 720 (5.4) 711 (7.3) -0.0765
Statins 9599 (72.1) 6501 (66.5) 0.1224
Acetylsalicylic acid 5283 (39.7) 3748 (38.3) 0.0279
Clopidogrel 415 (3.1) 449 (4.6) -0.0766
Warfarin 636 (4.8) 691 (7.1) -0.0971
Acetaminophen 4382 (32.9) 3778 (38.6) -0.1194
Non-steroidal anti-inflammatory drugs 2756 (20.7) 2126 (21.7) -0.0253
Opioids 4008 (30.1) 365 (34.4) -0.0921
Diabetic complications, n (%)
Neuropathy 1616 (12.1) 1366 (14.0) -0.0543
Peripheral vascular disease 736 (5.5) 671 (6.9) -0.0553
Nephropathy 1411 (10.6) 1634 (16.7) -0.1787
Retinopathy 3098 (23.3) 2366 (24.2) -0.0216
Abbreviations: SD = standard deviation; SMD = standardized mean difference.
Page 59 of 79
https://mc.manuscriptcentral.com/bmj
BMJ
123456789101112131415161718192021222324252627282930313233343536373839404142434445464748495051525354555657585960

Confidential: For Review Only
23
eTable 7. Characteristics of patients adding sulfonylureas to metformin and patients
switching to sulfonylureas from metformin (cardiovascular death study cohort)
Adding
sulfonylureas
(n = 13,224)
Switching to
sulfonylureas
(n = 9784)
SMD
Age (years), mean (SD) 62.3 (11.1) 66.3 (11.7) -0.3516
Female sex, n (%) 5268 (39.8) 4754 (48.6) -0.1769
Diabetes duration (years), mean (SD) 3.4 (3.4) 3.6 (3.8) -0.0462
Alcohol-related disorders, n (%) 771 (5.8) 487 (5.0) 0.0377
Smoking status, n (%)
Ever 7349 (55.6) 5254 (53.7) 0.0376
Never 5764 (43.6) 4430 (45.3) -0.0340
Unknown 111 (0.8) 100 (1.0) -0.0190
Body mass index (kg/m2), n (%)
<25 1298 (9.8) 1305 (13.3) -0.1103
25-30 4310 (32.6) 3439 (35.1) -0.0540
≥30 7403 (56.0) 4834 (49.4) 0.1320
Missing 213 (1.6) 206 (2.1) -0.0366
Haemoglobin A1c (%), mean (SD) 9.0 (1.7) 8.4 (1.6) 0.3180
≤7%, n (%) 642 (4.9) 1325 (13.5) -0.3041
7.1-8.0%, n (%) 3895 (29.5) 3117 (31.9) -0.0522
>8%, n (%) 7671 (58.0) 4408 (45.1) 0.2614
Unknown, n (%) 1016 (7.7) 934 (9.5) -0.0664
Medical history, n (%)
Heart failure 738 (5.6) 858 (8.8) -0.1238
Arterial hypertension 8145 (61.6) 6574 (67.2) -0.1171
Coronary artery disease 2653 (20.1) 2381 (24.3) -0.1030
Atrial fibrillation or flutter 1046 (7.9) 1100 (11.2) -0.1134
Hyperlipidaemia 4058 (30.7) 3176 (32.5) -0.0382
Chronic obstructive pulmonary disease 1790 (13.5) 1534 (15.7) -0.0607
Cancer 1110 (8.4) 1131 (11.6) -0.1058
Anaemia 180 (1.4) 196 (2.0) -0.0499
Thyroid disease 1298 (9.8) 1164 (11.9) -0.0669
Severe hypoglycaemia 13 (0.1) 14 (0.1) -0.0129
Myocardial infarction 620 (4.7) 537 (5.5) -0.0364
Ischaemic stroke 234 (1.8) 193 (2.0) -0.0150
Medications, n (%)
Angiotensin-converting enzyme inhibitors 5956 (45.0) 4330 (44.3) 0.0158
Page 60 of 79
https://mc.manuscriptcentral.com/bmj
BMJ
123456789101112131415161718192021222324252627282930313233343536373839404142434445464748495051525354555657585960

Confidential: For Review Only
24
Adding
sulfonylureas
(n = 13,224)
Switching to
sulfonylureas
(n = 9784)
SMD
Angiotensin II receptor blockers 1688 (12.8) 1534 (15.7) -0.0835
Beta-blockers 3196 (24.2) 2795 (28.6) -0.1000
Calcium-channel blockers 3649 (27.6) 2921 (29.9) -0.0500
Diuretics 4267 (32.3) 3898 (39.8) -0.1582
Cardiac glycosides 503 (3.8) 550 (5.6) -0.0859
Nitrates 712 (5.4) 711 (7.3) -0.0774
Statins 9517 (72.0) 6515 (66.6) 0.1168
Acetylsalicylic acid 5220 (39.5) 3761 (38.4) 0.0212
Clopidogrel 405 (3.1) 448 (4.6) -0.0792
Warfarin 641 (4.8) 691 (7.1) -0.0937
Acetaminophen 4347 (32.9) 3774 (38.6) -0.1192
Non-steroidal anti-inflammatory drugs 2728 (20.6) 2120 (21.7) -0.0254
Opioids 3960 (29.9) 3366 (34.4) -0.0955
Diabetic complications, n (%)
Neuropathy 1602 (12.1) 1366 (14.0) -0.0549
Peripheral vascular disease 726 (5.5) 675 (6.9) -0.0585
Nephropathy 1400 (10.6) 1626 (16.6) -0.1766
Retinopathy 3067 (23.2) 2368 (24.2) -0.0238
Abbreviations: SD = standard deviation; SMD = standardized mean difference.
Page 61 of 79
https://mc.manuscriptcentral.com/bmj
BMJ
123456789101112131415161718192021222324252627282930313233343536373839404142434445464748495051525354555657585960

Confidential: For Review Only
25
eTable 8. Characteristics of patients adding sulfonylureas to metformin and patients
switching to sulfonylureas from metformin (all-cause mortality study cohort)
Adding
sulfonylureas
(n = 13,247)
Switching to
sulfonylureas
(n = 9805)
SMD
Age (years), mean (SD) 62.3 (11.1) 66.3 (11.7) -0.3497
Female sex, n (%) 5277 (39.8) 4756 (48.5) -0.1753
Diabetes duration (years), mean (SD) 3.4 (3.4) 3.6 (3.8) -0.0465
Alcohol-related disorders, n (%) 761 (5.7) 488 (5.0) 0.0341
Smoking status, n (%)
Ever 7352 (55.5) 5274 (53.8) 0.0344
Never 5784 (43.7) 4432 (45.2) -0.0310
Unknown 111 (0.8) 99 (1.0) -0.0180
Body mass index (kg/m2), n (%)
<25 1307 (9.9) 1304 (13.3) -0.1074
25-30 4310 (32.5) 3438 (35.1) -0.0535
≥30 7416 (56.0) 4858 (49.5) 0.1292
Missing 214 (1.6) 205 (2.1) -0.0352
Haemoglobin A1c (%), mean (SD) 9.0 (1.7) 8.4 (1.6) 0.3158
≤7%, n (%) 641 (4.8) 1327 (13.5) -0.3045
7.1-8.0%, n (%) 3885 (29.3) 3122 (31.8) -0.0546
>8%, n (%) 7707 (58.2) 4430 (45.2) 0.2623
Unknown, n (%) 1014 (7.7) 926 (9.4) -0.0640
Medical history, n (%)
Heart failure 733 (5.5) 844 (8.6) -0.1202
Arterial hypertension 8168 (61.7) 6592 (67.2) -0.1166
Coronary artery disease 2672 (20.2) 2380 (24.3) -0.0988
Atrial fibrillation or flutter 1053 (7.9) 1102 (11.2) -0.1119
Hyperlipidaemia 4070 (30.7) 3177 (32.4) -0.0361
Chronic obstructive pulmonary disease 1771 (13.4) 1535 (15.7) -0.0649
Cancer 1121 (8.5) 1126 (11.5) -0.1010
Anaemia 189 (1.4) 198 (2.0) -0.0456
Thyroid disease 1300 (9.8) 1167 (11.9) -0.0672
Severe hypoglycaemia 14 (0.1) 16 (0.2) -0.0157
Myocardial infarction 621 (4.7) 541 (5.5) -0.0377
Ischaemic stroke 227 (1.7) 192 (2.0) -0.0182
Medications, n (%)
Angiotensin-converting enzyme inhibitors 5959 (45.0) 4335 (44.2) 0.0155
Page 62 of 79
https://mc.manuscriptcentral.com/bmj
BMJ
123456789101112131415161718192021222324252627282930313233343536373839404142434445464748495051525354555657585960

Confidential: For Review Only
26
Adding
sulfonylureas
(n = 13,247)
Switching to
sulfonylureas
(n = 9805)
SMD
Angiotensin II receptor blockers 1697 (12.8) 1543 (15.7) -0.0837
Beta-blockers 3231 (24.4) 2806 (28.6) -0.0959
Calcium-channel blockers 3672 (27.7) 2934 (29.9) -0.0487
Diuretics 4307 (32.5) 3903 (39.8) -0.1522
Cardiac glycosides 503 (3.8) 541 (5.5) -0.0817
Nitrates 721 (5.4) 709 (7.2) -0.0735
Statins 9550 (72.1) 6529 (66.6) 0.1196
Acetylsalicylic acid 5243 (39.6) 3759 (38.3) 0.0255
Clopidogrel 406 (3.1) 443 (4.5) -0.0761
Warfarin 640 (4.8) 691 (7.0) -0.0939
Acetaminophen 4364 (32.9) 3770 (38.4) -0.1151
Non-steroidal anti-inflammatory drugs 2725 (20.6) 2138 (21.8) -0.0302
Opioids 3960 (29.9) 3371 (34.4) -0.0962
Diabetic complications, n (%)
Neuropathy 1610 (12.2) 1371 (14.0) -0.0543
Peripheral vascular disease 728 (5.5) 673 (6.9) -0.0568
Nephropathy 1383 (10.4) 1627 (16.6) -0.1807
Retinopathy 3087 (23.3) 2374 (24.2) -0.0214
Abbreviations: SD = standard deviation; SMD = standardized mean difference.
Page 63 of 79
https://mc.manuscriptcentral.com/bmj
BMJ
123456789101112131415161718192021222324252627282930313233343536373839404142434445464748495051525354555657585960
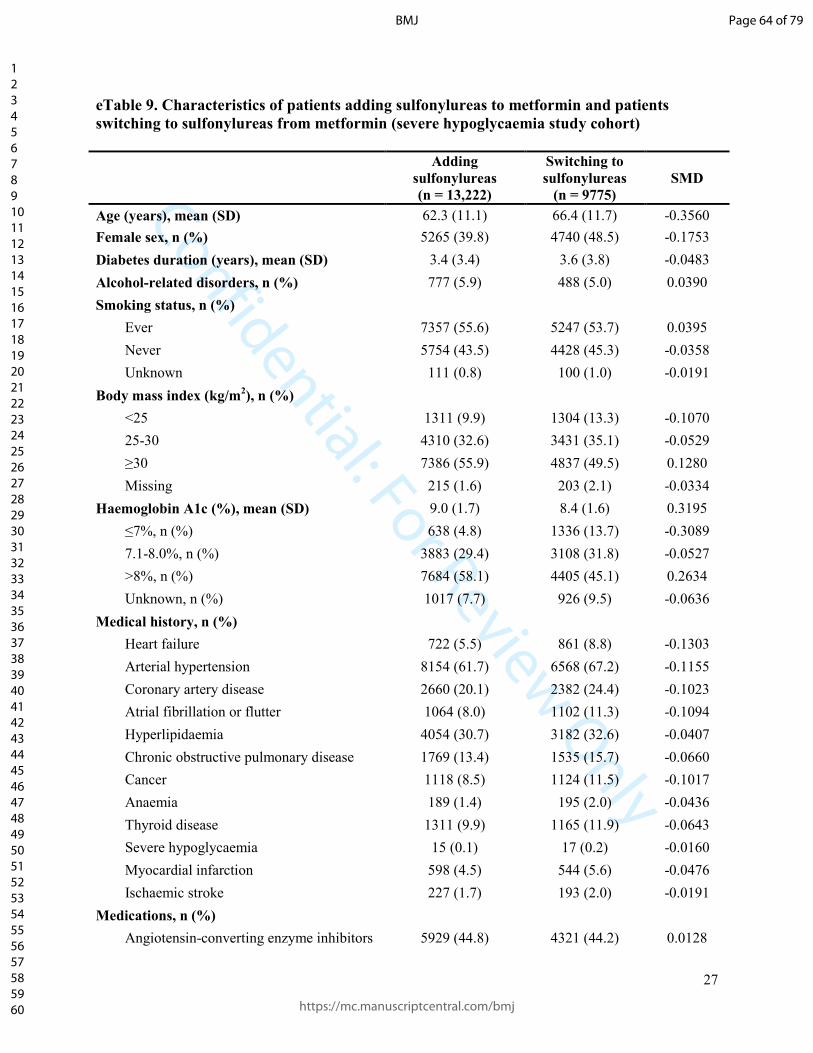
Confidential: For Review Only
27
eTable 9. Characteristics of patients adding sulfonylureas to metformin and patients
switching to sulfonylureas from metformin (severe hypoglycaemia study cohort)
Adding
sulfonylureas
(n = 13,222)
Switching to
sulfonylureas
(n = 9775)
SMD
Age (years), mean (SD) 62.3 (11.1) 66.4 (11.7) -0.3560
Female sex, n (%) 5265 (39.8) 4740 (48.5) -0.1753
Diabetes duration (years), mean (SD) 3.4 (3.4) 3.6 (3.8) -0.0483
Alcohol-related disorders, n (%) 777 (5.9) 488 (5.0) 0.0390
Smoking status, n (%)
Ever 7357 (55.6) 5247 (53.7) 0.0395
Never 5754 (43.5) 4428 (45.3) -0.0358
Unknown 111 (0.8) 100 (1.0) -0.0191
Body mass index (kg/m2), n (%)
<25 1311 (9.9) 1304 (13.3) -0.1070
25-30 4310 (32.6) 3431 (35.1) -0.0529
≥30 7386 (55.9) 4837 (49.5) 0.1280
Missing 215 (1.6) 203 (2.1) -0.0334
Haemoglobin A1c (%), mean (SD) 9.0 (1.7) 8.4 (1.6) 0.3195
≤7%, n (%) 638 (4.8) 1336 (13.7) -0.3089
7.1-8.0%, n (%) 3883 (29.4) 3108 (31.8) -0.0527
>8%, n (%) 7684 (58.1) 4405 (45.1) 0.2634
Unknown, n (%) 1017 (7.7) 926 (9.5) -0.0636
Medical history, n (%)
Heart failure 722 (5.5) 861 (8.8) -0.1303
Arterial hypertension 8154 (61.7) 6568 (67.2) -0.1155
Coronary artery disease 2660 (20.1) 2382 (24.4) -0.1023
Atrial fibrillation or flutter 1064 (8.0) 1102 (11.3) -0.1094
Hyperlipidaemia 4054 (30.7) 3182 (32.6) -0.0407
Chronic obstructive pulmonary disease 1769 (13.4) 1535 (15.7) -0.0660
Cancer 1118 (8.5) 1124 (11.5) -0.1017
Anaemia 189 (1.4) 195 (2.0) -0.0436
Thyroid disease 1311 (9.9) 1165 (11.9) -0.0643
Severe hypoglycaemia 15 (0.1) 17 (0.2) -0.0160
Myocardial infarction 598 (4.5) 544 (5.6) -0.0476
Ischaemic stroke 227 (1.7) 193 (2.0) -0.0191
Medications, n (%)
Angiotensin-converting enzyme inhibitors 5929 (44.8) 4321 (44.2) 0.0128
Page 64 of 79
https://mc.manuscriptcentral.com/bmj
BMJ
123456789101112131415161718192021222324252627282930313233343536373839404142434445464748495051525354555657585960

Confidential: For Review Only
28
Adding
sulfonylureas
(n = 13,222)
Switching to
sulfonylureas
(n = 9775)
SMD
Angiotensin II receptor blockers 1697 (12.8) 1540 (15.8) -0.0835
Beta-blockers 3194 (24.2) 2795 (28.6) -0.1008
Calcium-channel blockers 3626 (27.4) 2914 (29.8) -0.0528
Diuretics 4288 (32.4) 3894 (39.8) -0.1546
Cardiac glycosides 513 (3.9) 550 (5.6) -0.0822
Nitrates 716 (5.4) 720 (7.4) -0.0798
Statins 9537 (72.1) 6507 (66.6) 0.1209
Acetylsalicylic acid 5210 (39.4) 3769 (38.6) 0.0174
Clopidogrel 400 (3.0) 449 (4.6) -0.0820
Warfarin 638 (4.8) 686 (7.0) -0.0930
Acetaminophen 4333 (32.8) 3769 (38.6) -0.1210
Non-steroidal anti-inflammatory drugs 2740 (20.7) 2116 (21.6) -0.0226
Opioids 3955 (29.9) 3364 (34.4) -0.0965
Diabetic complications, n (%)
Neuropathy 1609 (12.2) 1374 (14.1) -0.0559
Peripheral vascular disease 733 (5.5) 671 (6.9) -0.0548
Nephropathy 1387 (10.5) 1630 (16.7) -0.1813
Retinopathy 3054 (23.1) 2356 (24.1) -0.0237
Abbreviations: SD = standard deviation; SMD = standardized mean difference.
Page 65 of 79
https://mc.manuscriptcentral.com/bmj
BMJ
123456789101112131415161718192021222324252627282930313233343536373839404142434445464748495051525354555657585960

Confidential: For Review Only
29
eTable 10. Crude and adjusted hazard ratios for the association between switching versus adding sulfonylureas and the risk of
the study outcomes
Exposure Patients Events Person-years Incidence rate (95% CI)
[per 1000 person-years]
Crude HR
(95% CI)
Adjusted HR
(95% CI)*
Myocardial infarction
Adding sulfonylureas 13,203 57 11,442 5.0 (3.8 to 6.5) 1.00 (reference) 1.00 (reference)
Switching to sulfonylureas 9759 68 5138 13.2 (10.4 to 16.8) 2.65 (1.86 to 3.78) 1.51 (1.03 to 2.24)
Ischaemic stroke
Adding sulfonylureas 13,300 63 11,542 5.5 (4.3 to 7.0) 1.00 (reference) 1.00 (reference)
Switching to sulfonylureas 9771 46 5185 8.9 (6.6 to 11.8) 1.60 (1.09 to 2.34) 0.88 (0.58 to 1.33)
Cardiovascular death
Adding sulfonylureas 13,217 75 11,464 6.5 (5.2 to 8.2) 1.00 (reference) 1.00 (reference)
Switching to sulfonylureas 9779 93 5204 17.9 (14.6 to 21.9) 2.70 (1.99 to 3.66) 1.22 (0.87 to 1.71)
Alltocause mortality
Adding sulfonylureas 13,242 217 11,504 18.9 (16.5 to 21.5) 1.00 (reference) 1.00 (reference)
Switching to sulfonylureas 9800 256 5216 49.1 (43.4 to 55.5) 2.57 (2.14 to 3.08) 1.23 (1.00 to 1.50)
Severe hypoglycaemia
Adding sulfonylureas 13,215 39 11440 3.4 (2.5 to 4.7) 1.00 (reference) 1.00 (reference)
Switching to sulfonylureas 9770 45 5177 8.7 (6.5 to 11.6) 2.61 (1.70 to 4.01) 1.06 (0.65 to 1.71)
* The models for myocardial infarction, ischaemic stroke, cardiovascular death, and severe hypoglycaemia were adjusted for age, sex,
propensity score deciles, history of the respective outcome in the year prior to cohort entry (or, for the case of cardiovascular death,
history of myocardial infarction or ischaemic stroke), body mass index category, diuretics, statins, acetaminophen, opioids, and
nephropathy. The model for all-cause mortality was adjusted for age, sex, propensity score deciles, body mass index category,
diuretics, statins, acetaminophen, opioids, and nephropathy.
Abbreviations: CI = confidence interval; HR = hazard ratio.
Page 66 of 79
https://mc.manuscriptcentral.com/bmj
BMJ
123456789101112131415161718192021222324252627282930313233343536373839404142434445464748495051525354555657585960
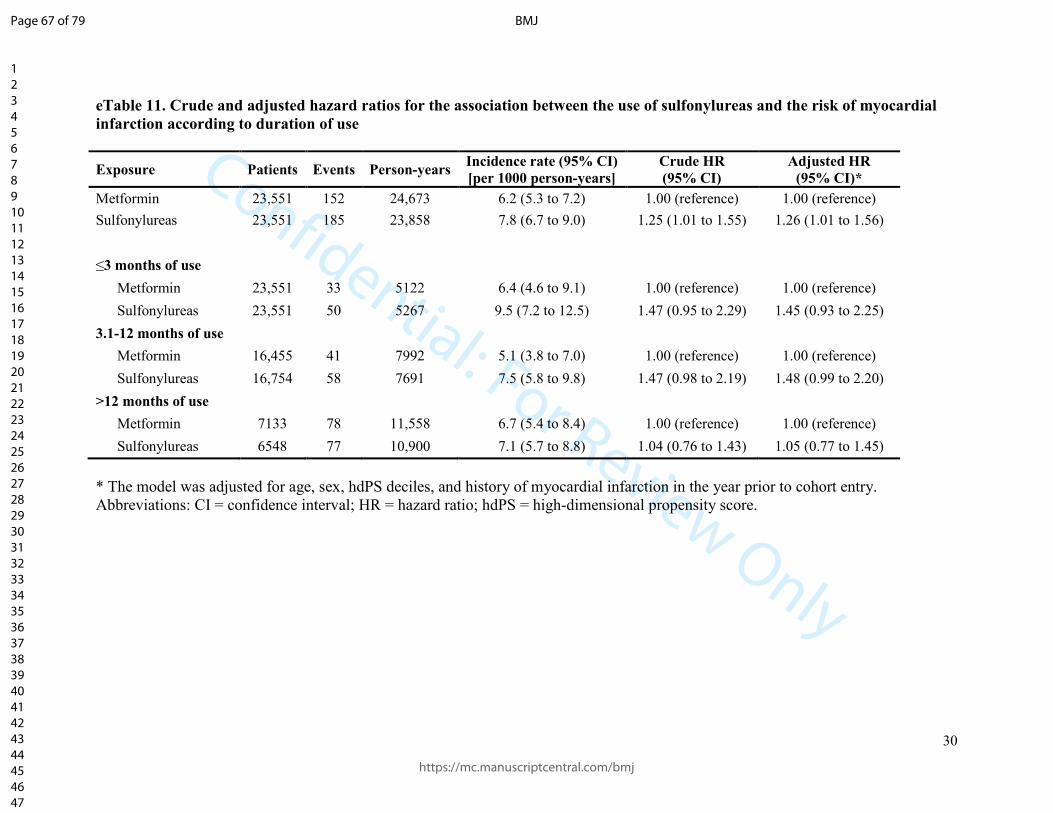
Confidential: For Review Only
30
eTable 11. Crude and adjusted hazard ratios for the association between the use of sulfonylureas and the risk of myocardial
infarction according to duration of use
Exposure Patients Events Person-years Incidence rate (95% CI)
[per 1000 person-years]
Crude HR
(95% CI)
Adjusted HR
(95% CI)*
Metformin 23,551 152 24,673 6.2 (5.3 to 7.2) 1.00 (reference) 1.00 (reference)
Sulfonylureas 23,551 185 23,858 7.8 (6.7 to 9.0) 1.25 (1.01 to 1.55) 1.26 (1.01 to 1.56)
≤3 months of use
Metformin 23,551 33 5122 6.4 (4.6 to 9.1) 1.00 (reference) 1.00 (reference)
Sulfonylureas 23,551 50 5267 9.5 (7.2 to 12.5) 1.47 (0.95 to 2.29) 1.45 (0.93 to 2.25)
3.1-12 months of use
Metformin 16,455 41 7992 5.1 (3.8 to 7.0) 1.00 (reference) 1.00 (reference)
Sulfonylureas 16,754 58 7691 7.5 (5.8 to 9.8) 1.47 (0.98 to 2.19) 1.48 (0.99 to 2.20)
>12 months of use
Metformin 7133 78 11,558 6.7 (5.4 to 8.4) 1.00 (reference) 1.00 (reference)
Sulfonylureas 6548 77 10,900 7.1 (5.7 to 8.8) 1.04 (0.76 to 1.43) 1.05 (0.77 to 1.45)
* The model was adjusted for age, sex, hdPS deciles, and history of myocardial infarction in the year prior to cohort entry.
Abbreviations: CI = confidence interval; HR = hazard ratio; hdPS = high-dimensional propensity score.
Page 67 of 79
https://mc.manuscriptcentral.com/bmj
BMJ
123456789101112131415161718192021222324252627282930313233343536373839404142434445464748495051525354555657585960

Confidential: For Review Only
31
eTable 12. Crude and adjusted hazard ratios for the association between the use of sulfonylureas and the risk of ischaemic
stroke according to duration of use
Exposure Patients Events Person-years Incidence rate (95% CI)
[per 1000 person-years]
Crude HR
(95% CI)
Adjusted HR
(95% CI)*
Metformin 23,636 137 24,791 5.5 (4.7 to 6.5) 1.00 (reference) 1.00 (reference)
Sulfonylureas 23,636 162 24,015 6.7 (5.8 to 7.9) 1.22 (0.97 to 1.53) 1.24 (0.99 to 1.56)
≤3 months of use
Metformin 23,636 29 5141 5.6 (3.9 to 8.1) 1.00 (reference) 1.00 (reference)
Sulfonylureas 23,636 38 5293 7.2 (5.2 to 9.9) 1.27 (0.79 to 2.06) 1.25 (0.77 to 2.03)
3.1-12 months of use
Metformin 16,501 40 8048 5.0 (3.6 to 6.8) 1.00 (reference) 1.00 (reference)
Sulfonylureas 16,865 52 7753 6.7 (5.1 to 8.8) 1.35 (0.89 to 2.04) 1.39 (0.92 to 2.10)
>12 months of use
Metformin 7222 68 11,602 5.9 (4.6 to 7.4) 1.00 (reference) 1.00 (reference)
Sulfonylureas 6606 72 10,969 6.6 (5.2 to 8.3) 1.12 (0.80 to 1.56) 1.15 (0.83 to 1.61)
* The model was adjusted for age, sex, hdPS deciles, and history of ischemic stroke in the year prior to cohort entry.
Abbreviations: CI = confidence interval; HR = hazard ratio; hdPS = high-dimensional propensity score.
Page 68 of 79
https://mc.manuscriptcentral.com/bmj
BMJ
123456789101112131415161718192021222324252627282930313233343536373839404142434445464748495051525354555657585960
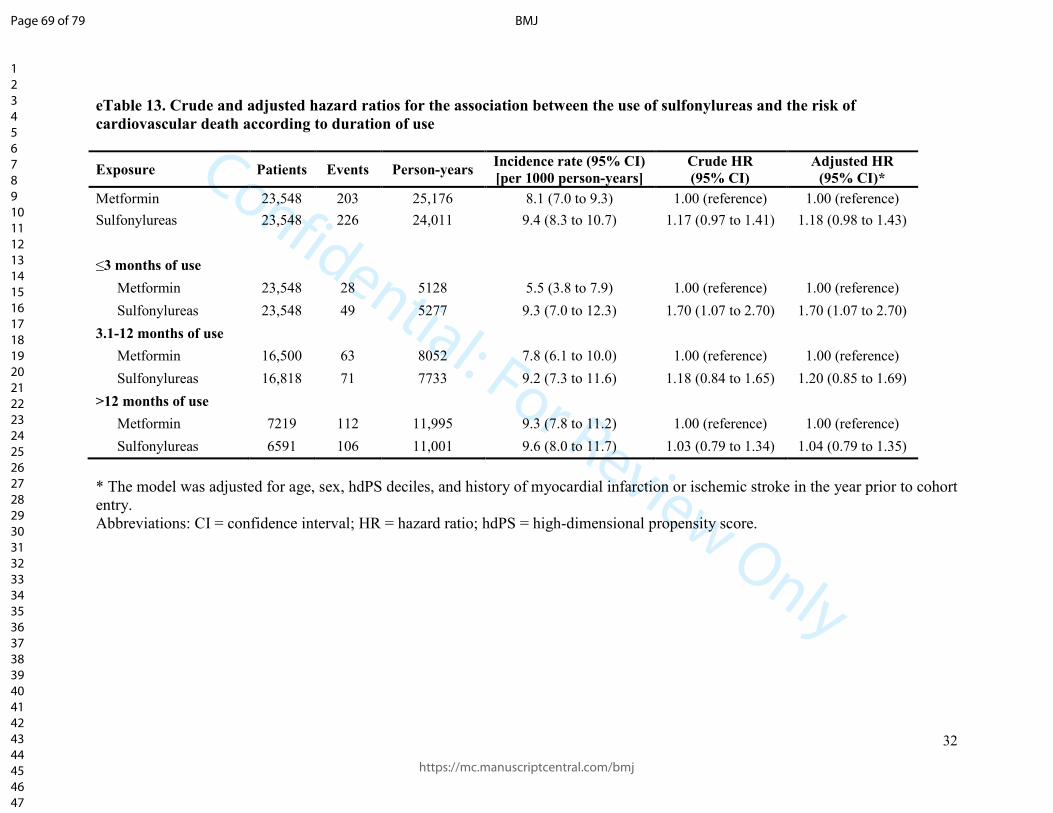
Confidential: For Review Only
32
eTable 13. Crude and adjusted hazard ratios for the association between the use of sulfonylureas and the risk of
cardiovascular death according to duration of use
Exposure Patients Events Person-years Incidence rate (95% CI)
[per 1000 person-years]
Crude HR
(95% CI)
Adjusted HR
(95% CI)*
Metformin 23,548 203 25,176 8.1 (7.0 to 9.3) 1.00 (reference) 1.00 (reference)
Sulfonylureas 23,548 226 24,011 9.4 (8.3 to 10.7) 1.17 (0.97 to 1.41) 1.18 (0.98 to 1.43)
≤3 months of use
Metformin 23,548 28 5128 5.5 (3.8 to 7.9) 1.00 (reference) 1.00 (reference)
Sulfonylureas 23,548 49 5277 9.3 (7.0 to 12.3) 1.70 (1.07 to 2.70) 1.70 (1.07 to 2.70)
3.1-12 months of use
Metformin 16,500 63 8052 7.8 (6.1 to 10.0) 1.00 (reference) 1.00 (reference)
Sulfonylureas 16,818 71 7733 9.2 (7.3 to 11.6) 1.18 (0.84 to 1.65) 1.20 (0.85 to 1.69)
>12 months of use
Metformin 7219 112 11,995 9.3 (7.8 to 11.2) 1.00 (reference) 1.00 (reference)
Sulfonylureas 6591 106 11,001 9.6 (8.0 to 11.7) 1.03 (0.79 to 1.34) 1.04 (0.79 to 1.35)
* The model was adjusted for age, sex, hdPS deciles, and history of myocardial infarction or ischemic stroke in the year prior to cohort
entry.
Abbreviations: CI = confidence interval; HR = hazard ratio; hdPS = high-dimensional propensity score.
Page 69 of 79
https://mc.manuscriptcentral.com/bmj
BMJ
123456789101112131415161718192021222324252627282930313233343536373839404142434445464748495051525354555657585960
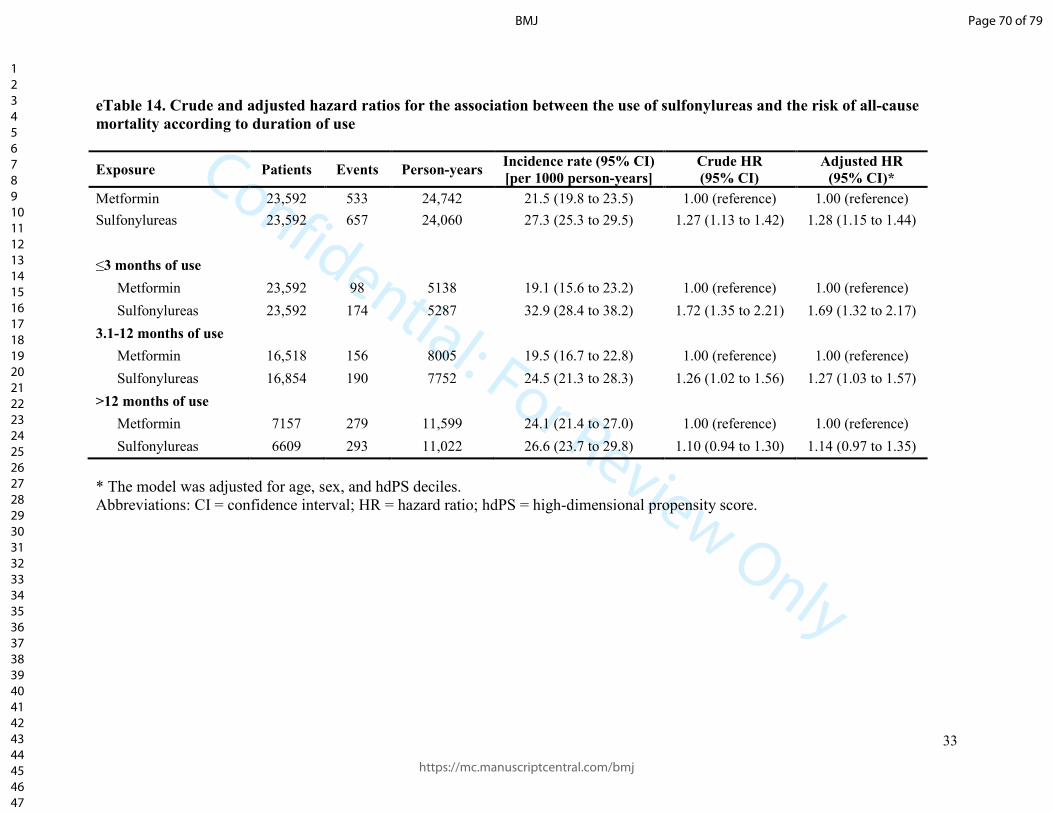
Confidential: For Review Only
33
eTable 14. Crude and adjusted hazard ratios for the association between the use of sulfonylureas and the risk of all-cause
mortality according to duration of use
Exposure Patients Events Person-years Incidence rate (95% CI)
[per 1000 person-years]
Crude HR
(95% CI)
Adjusted HR
(95% CI)*
Metformin 23,592 533 24,742 21.5 (19.8 to 23.5) 1.00 (reference) 1.00 (reference)
Sulfonylureas 23,592 657 24,060 27.3 (25.3 to 29.5) 1.27 (1.13 to 1.42) 1.28 (1.15 to 1.44)
≤3 months of use
Metformin 23,592 98 5138 19.1 (15.6 to 23.2) 1.00 (reference) 1.00 (reference)
Sulfonylureas 23,592 174 5287 32.9 (28.4 to 38.2) 1.72 (1.35 to 2.21) 1.69 (1.32 to 2.17)
3.1-12 months of use
Metformin 16,518 156 8005 19.5 (16.7 to 22.8) 1.00 (reference) 1.00 (reference)
Sulfonylureas 16,854 190 7752 24.5 (21.3 to 28.3) 1.26 (1.02 to 1.56) 1.27 (1.03 to 1.57)
>12 months of use
Metformin 7157 279 11,599 24.1 (21.4 to 27.0) 1.00 (reference) 1.00 (reference)
Sulfonylureas 6609 293 11,022 26.6 (23.7 to 29.8) 1.10 (0.94 to 1.30) 1.14 (0.97 to 1.35)
* The model was adjusted for age, sex, and hdPS deciles.
Abbreviations: CI = confidence interval; HR = hazard ratio; hdPS = high-dimensional propensity score.
Page 70 of 79
https://mc.manuscriptcentral.com/bmj
BMJ
123456789101112131415161718192021222324252627282930313233343536373839404142434445464748495051525354555657585960

Confidential: For Review Only
34
eTable 15. Crude and adjusted hazard ratios for the association between the use of sulfonylureas and the risk of severe
hypoglycaemia according to duration of use
Exposure Patients Events Person-years Incidence rate (95% CI)
[per 1000 person-years]
Crude HR
(95% CI)
Adjusted HR
(95% CI)*
Metformin 23,555 18 24,905 0.7 (0.5 to 1.1) 1.00 (reference) 1.00 (reference)
Sulfonylureas 23,555 132 23,919 5.5 (4.7 to 6.5) 7.59 (4.64 to 12.43) 7.60 (4.64 to 12.44)
≤3 months of use
Metformin 23,555 3 5128 0.6 (0.2 to 1.8) 1.00 (reference) 1.00 (reference)
Sulfonylureas 23,555 32 5274 6.1 (4.3 to 8.6) 10.38 (3.18 to 33.91) 10.29 (3.15 to 33.62)
3.1-12 months of use
Metformin 16,434 4 8051 0.5 (0.2 to 1.3) 1.00 (reference) 1.00 (reference)
Sulfonylureas 16,798 34 7715 4.4 (3.1 to 6.2) 8.93 (3.17 to 25.17) 8.96 (3.18 to 25.29)
>12 months of use
Metformin 7196 11 11,726 0.9 (0.5 to 1.7) 1.00 (reference) 1.00 (reference)
Sulfonylureas 6575 66 10,931 6.0 (4.7 to 7.7) 6.34 (3.35 to 11.99) 6.34 (3.34 to 12.01)
* The model was adjusted for age, sex, hdPS deciles, and history of severe hypoglycaemia in the year prior to cohort entry.
Abbreviations: CI = confidence interval; HR = hazard ratio; hdPS = high-dimensional propensity score.
Page 71 of 79
https://mc.manuscriptcentral.com/bmj
BMJ
123456789101112131415161718192021222324252627282930313233343536373839404142434445464748495051525354555657585960
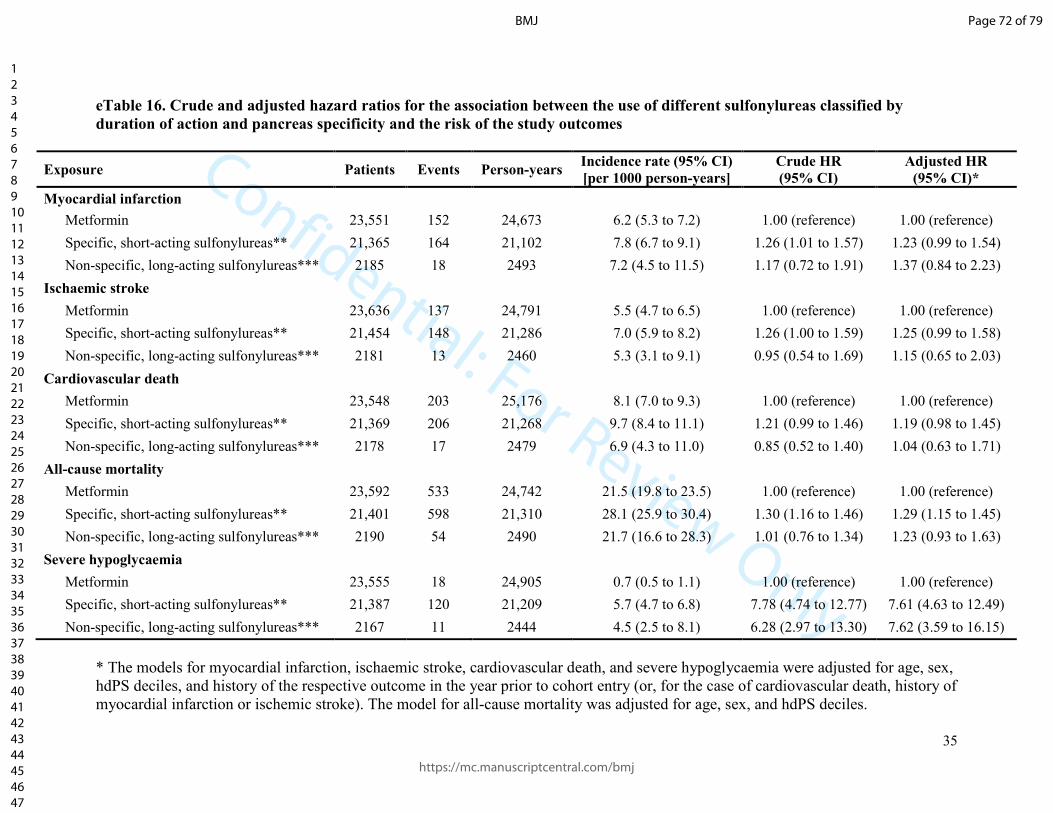
Confidential: For Review Only
35
eTable 16. Crude and adjusted hazard ratios for the association between the use of different sulfonylureas classified by
duration of action and pancreas specificity and the risk of the study outcomes
Exposure Patients Events Person-years Incidence rate (95% CI)
[per 1000 person-years]
Crude HR
(95% CI)
Adjusted HR
(95% CI)*
Myocardial infarction
Metformin 23,551 152 24,673 6.2 (5.3 to 7.2) 1.00 (reference) 1.00 (reference)
Specific, short-acting sulfonylureas** 21,365 164 21,102 7.8 (6.7 to 9.1) 1.26 (1.01 to 1.57) 1.23 (0.99 to 1.54)
Non-specific, long-acting sulfonylureas*** 2185 18 2493 7.2 (4.5 to 11.5) 1.17 (0.72 to 1.91) 1.37 (0.84 to 2.23)
Ischaemic stroke
Metformin 23,636 137 24,791 5.5 (4.7 to 6.5) 1.00 (reference) 1.00 (reference)
Specific, short-acting sulfonylureas** 21,454 148 21,286 7.0 (5.9 to 8.2) 1.26 (1.00 to 1.59) 1.25 (0.99 to 1.58)
Non-specific, long-acting sulfonylureas*** 2181 13 2460 5.3 (3.1 to 9.1) 0.95 (0.54 to 1.69) 1.15 (0.65 to 2.03)
Cardiovascular death
Metformin 23,548 203 25,176 8.1 (7.0 to 9.3) 1.00 (reference) 1.00 (reference)
Specific, short-acting sulfonylureas** 21,369 206 21,268 9.7 (8.4 to 11.1) 1.21 (0.99 to 1.46) 1.19 (0.98 to 1.45)
Non-specific, long-acting sulfonylureas*** 2178 17 2479 6.9 (4.3 to 11.0) 0.85 (0.52 to 1.40) 1.04 (0.63 to 1.71)
All-cause mortality
Metformin 23,592 533 24,742 21.5 (19.8 to 23.5) 1.00 (reference) 1.00 (reference)
Specific, short-acting sulfonylureas** 21,401 598 21,310 28.1 (25.9 to 30.4) 1.30 (1.16 to 1.46) 1.29 (1.15 to 1.45)
Non-specific, long-acting sulfonylureas*** 2190 54 2490 21.7 (16.6 to 28.3) 1.01 (0.76 to 1.34) 1.23 (0.93 to 1.63)
Severe hypoglycaemia
Metformin 23,555 18 24,905 0.7 (0.5 to 1.1) 1.00 (reference) 1.00 (reference)
Specific, short-acting sulfonylureas** 21,387 120 21,209 5.7 (4.7 to 6.8) 7.78 (4.74 to 12.77) 7.61 (4.63 to 12.49)
Non-specific, long-acting sulfonylureas*** 2167 11 2444 4.5 (2.5 to 8.1) 6.28 (2.97 to 13.30) 7.62 (3.59 to 16.15)
* The models for myocardial infarction, ischaemic stroke, cardiovascular death, and severe hypoglycaemia were adjusted for age, sex,
hdPS deciles, and history of the respective outcome in the year prior to cohort entry (or, for the case of cardiovascular death, history of
myocardial infarction or ischemic stroke). The model for all-cause mortality was adjusted for age, sex, and hdPS deciles.
Page 72 of 79
https://mc.manuscriptcentral.com/bmj
BMJ
123456789101112131415161718192021222324252627282930313233343536373839404142434445464748495051525354555657585960

Confidential: For Review Only
36
** Pancreas specific, short-acting sulfonylureas included gliclazide, glipizide, and tolbutamide.
*** Pancreas non-specific, long-acting sulfonylureas included glyburide and glimepiride.
Abbreviations: CI = confidence interval; HR = hazard ratio; hdPS = high-dimensional propensity score.
Page 73 of 79
https://mc.manuscriptcentral.com/bmj
BMJ
123456789101112131415161718192021222324252627282930313233343536373839404142434445464748495051525354555657585960
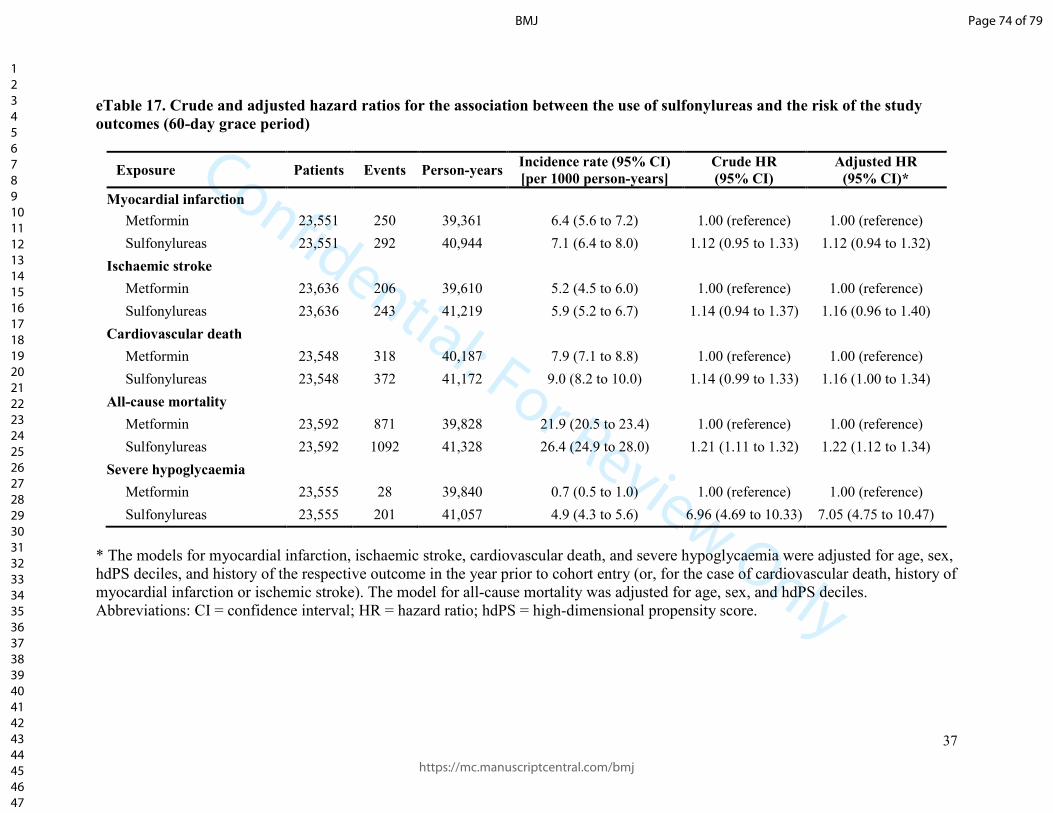
Confidential: For Review Only
37
eTable 17. Crude and adjusted hazard ratios for the association between the use of sulfonylureas and the risk of the study
outcomes (60-day grace period)
Exposure Patients Events Person-years Incidence rate (95% CI)
[per 1000 person-years]
Crude HR
(95% CI)
Adjusted HR
(95% CI)*
Myocardial infarction
Metformin 23,551 250 39,361 6.4 (5.6 to 7.2) 1.00 (reference) 1.00 (reference)
Sulfonylureas 23,551 292 40,944 7.1 (6.4 to 8.0) 1.12 (0.95 to 1.33) 1.12 (0.94 to 1.32)
Ischaemic stroke
Metformin 23,636 206 39,610 5.2 (4.5 to 6.0) 1.00 (reference) 1.00 (reference)
Sulfonylureas 23,636 243 41,219 5.9 (5.2 to 6.7) 1.14 (0.94 to 1.37) 1.16 (0.96 to 1.40)
Cardiovascular death
Metformin 23,548 318 40,187 7.9 (7.1 to 8.8) 1.00 (reference) 1.00 (reference)
Sulfonylureas 23,548 372 41,172 9.0 (8.2 to 10.0) 1.14 (0.99 to 1.33) 1.16 (1.00 to 1.34)
All-cause mortality
Metformin 23,592 871 39,828 21.9 (20.5 to 23.4) 1.00 (reference) 1.00 (reference)
Sulfonylureas 23,592 1092 41,328 26.4 (24.9 to 28.0) 1.21 (1.11 to 1.32) 1.22 (1.12 to 1.34)
Severe hypoglycaemia
Metformin 23,555 28 39,840 0.7 (0.5 to 1.0) 1.00 (reference) 1.00 (reference)
Sulfonylureas 23,555 201 41,057 4.9 (4.3 to 5.6) 6.96 (4.69 to 10.33) 7.05 (4.75 to 10.47)
* The models for myocardial infarction, ischaemic stroke, cardiovascular death, and severe hypoglycaemia were adjusted for age, sex,
hdPS deciles, and history of the respective outcome in the year prior to cohort entry (or, for the case of cardiovascular death, history of
myocardial infarction or ischemic stroke). The model for all-cause mortality was adjusted for age, sex, and hdPS deciles.
Abbreviations: CI = confidence interval; HR = hazard ratio; hdPS = high-dimensional propensity score.
Page 74 of 79
https://mc.manuscriptcentral.com/bmj
BMJ
123456789101112131415161718192021222324252627282930313233343536373839404142434445464748495051525354555657585960
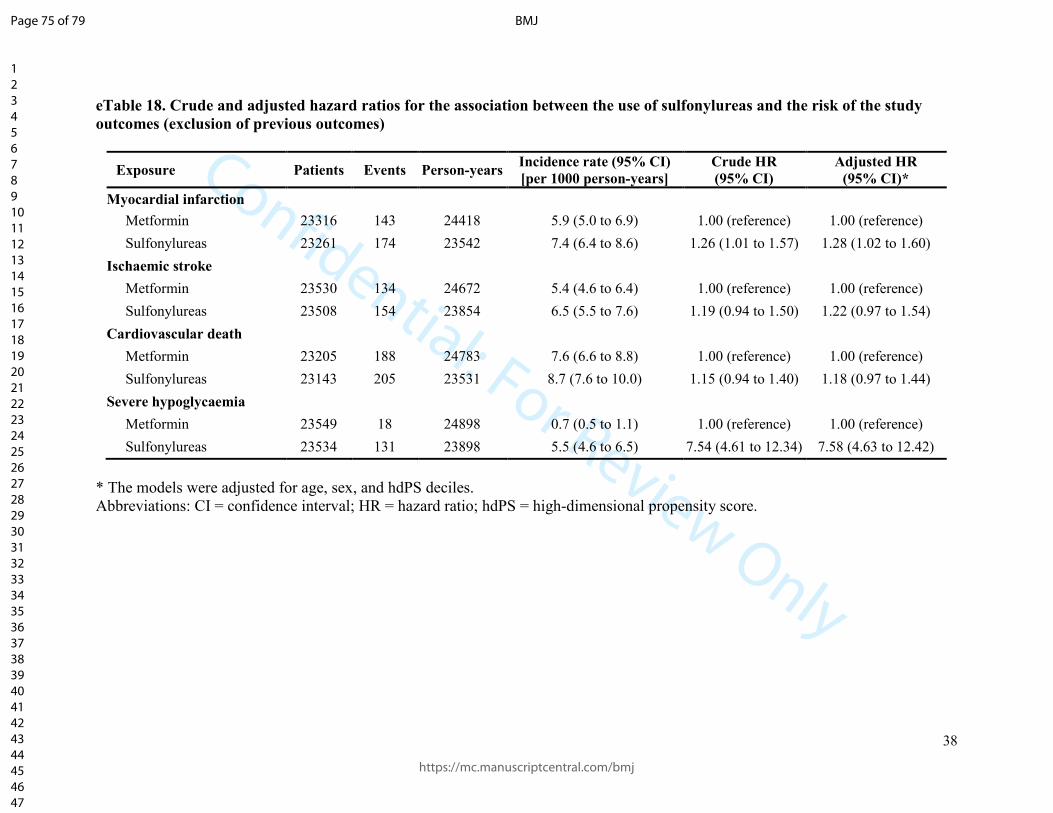
Confidential: For Review Only
38
eTable 18. Crude and adjusted hazard ratios for the association between the use of sulfonylureas and the risk of the study
outcomes (exclusion of previous outcomes)
Exposure Patients Events Person-years Incidence rate (95% CI)
[per 1000 person-years]
Crude HR
(95% CI)
Adjusted HR
(95% CI)*
Myocardial infarction
Metformin 23316 143 24418 5.9 (5.0 to 6.9) 1.00 (reference) 1.00 (reference)
Sulfonylureas 23261 174 23542 7.4 (6.4 to 8.6) 1.26 (1.01 to 1.57) 1.28 (1.02 to 1.60)
Ischaemic stroke
Metformin 23530 134 24672 5.4 (4.6 to 6.4) 1.00 (reference) 1.00 (reference)
Sulfonylureas 23508 154 23854 6.5 (5.5 to 7.6) 1.19 (0.94 to 1.50) 1.22 (0.97 to 1.54)
Cardiovascular death
Metformin 23205 188 24783 7.6 (6.6 to 8.8) 1.00 (reference) 1.00 (reference)
Sulfonylureas 23143 205 23531 8.7 (7.6 to 10.0) 1.15 (0.94 to 1.40) 1.18 (0.97 to 1.44)
Severe hypoglycaemia
Metformin 23549 18 24898 0.7 (0.5 to 1.1) 1.00 (reference) 1.00 (reference)
Sulfonylureas 23534 131 23898 5.5 (4.6 to 6.5) 7.54 (4.61 to 12.34) 7.58 (4.63 to 12.42)
* The models were adjusted for age, sex, and hdPS deciles.
Abbreviations: CI = confidence interval; HR = hazard ratio; hdPS = high-dimensional propensity score.
Page 75 of 79
https://mc.manuscriptcentral.com/bmj
BMJ
123456789101112131415161718192021222324252627282930313233343536373839404142434445464748495051525354555657585960

Confidential: For Review Only
39
eTable 19. Crude and adjusted hazard ratios for the association between the use of sulfonylureas and the risk of the study
outcomes (adjusting for additional covariates)
Exposure Patients Events Person-years Incidence rate (95% CI)
[per 1000 person-years]
Crude HR
(95% CI)
Adjusted HR
(95% CI)*
Myocardial infarction
Metformin 23,551 152 24,673 6.2 (5.3 to 7.2) 1.00 (reference) 1.00 (reference)
Sulfonylureas 23,551 185 23,858 7.8 (6.7 to 9.0) 1.25 (1.01 to 1.55) 1.23 (1.00 to 1.53)
Ischaemic stroke
Metformin 23,636 137 24,791 5.5 (4.7 to 6.5) 1.00 (reference) 1.00 (reference)
Sulfonylureas 23,636 162 24,015 6.7 (5.8 to 7.9) 1.22 (0.97 to 1.53) 1.24 (0.98 to 1.55)
Cardiovascular death
Metformin 23,548 203 25,176 8.1 (7.0 to 9.3) 1.00 (reference) 1.00 (reference)
Sulfonylureas 23,548 226 24,011 9.4 (8.3 to 10.7) 1.17 (0.97 to 1.41) 1.13 (0.93 to 1.37)
All-cause mortality
Metformin 23,592 533 24,742 21.5 (19.8 to 23.5) 1.00 (reference) 1.00 (reference)
Sulfonylureas 23,592 657 24,060 27.3 (25.3 to 29.5) 1.27 (1.13 to 1.42) 1.25 (1.11 to 1.40)
Severe hypoglycaemia
Metformin 23,555 18 24,905 0.7 (0.5 to 1.1) 1.00 (reference) 1.00 (reference)
Sulfonylureas 23,555 132 23,919 5.5 (4.7 to 6.5) 7.59 (4.64 to 12.43) 7.10 (4.33 to 11.63)
* The models for myocardial infarction, ischaemic stroke, cardiovascular death, and severe hypoglycaemia were adjusted for age, sex,
hdPS deciles, history of the respective outcome in the year prior to cohort entry (or, for the case of cardiovascular death, history of
myocardial infarction or ischemic stroke), body mass index category, diuretics, statins, acetaminophen, opioids, and nephropathy. The
model for all-cause mortality was adjusted for age, sex, hdPS deciles, body mass index category, diuretics, statins, acetaminophen,
opioids, and nephropathy.
Abbreviations: CI = confidence interval; HR = hazard ratio; hdPS = high-dimensional propensity score.
Page 76 of 79
https://mc.manuscriptcentral.com/bmj
BMJ
123456789101112131415161718192021222324252627282930313233343536373839404142434445464748495051525354555657585960
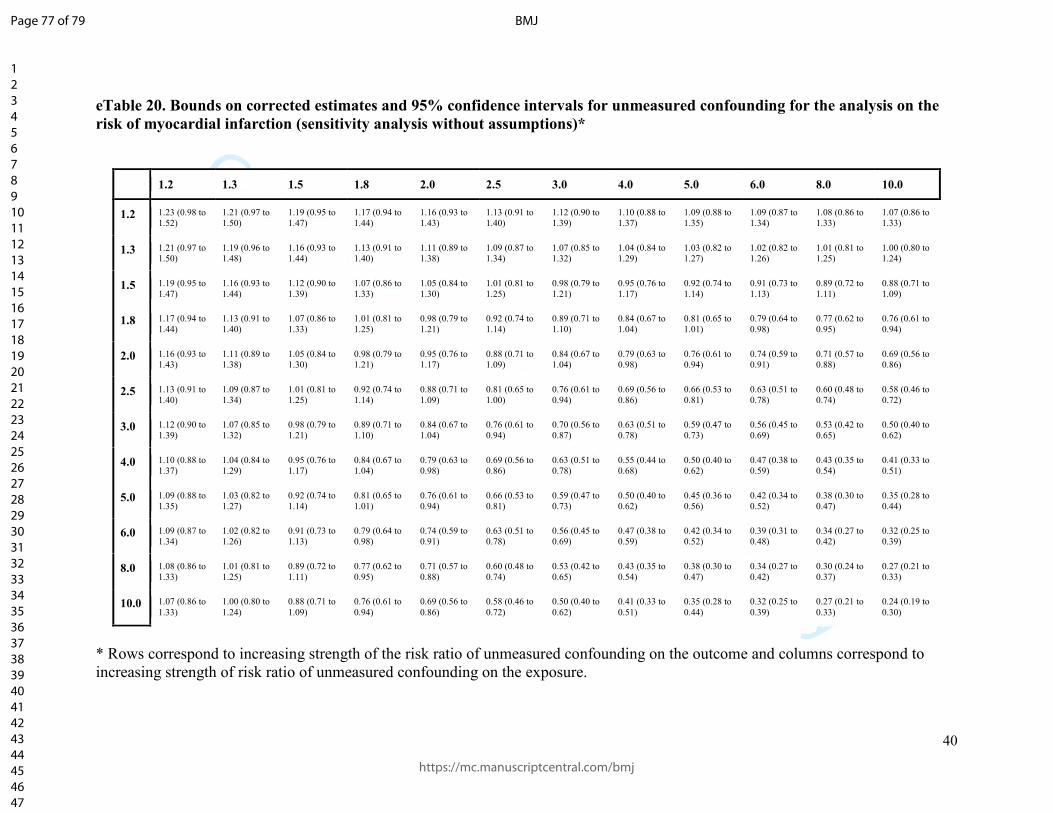
Confidential: For Review Only
40
eTable 20. Bounds on corrected estimates and 95% confidence intervals for unmeasured confounding for the analysis on the
risk of myocardial infarction (sensitivity analysis without assumptions)*
1.2 1.3 1.5 1.8 2.0 2.5 3.0 4.0 5.0 6.0 8.0 10.0
1.2 1.23 (0.98 to
1.52)
1.21 (0.97 to
1.50)
1.19 (0.95 to
1.47)
1.17 (0.94 to
1.44)
1.16 (0.93 to
1.43)
1.13 (0.91 to
1.40)
1.12 (0.90 to
1.39)
1.10 (0.88 to
1.37)
1.09 (0.88 to
1.35)
1.09 (0.87 to
1.34)
1.08 (0.86 to
1.33)
1.07 (0.86 to
1.33)
1.3 1.21 (0.97 to
1.50)
1.19 (0.96 to
1.48)
1.16 (0.93 to
1.44)
1.13 (0.91 to
1.40)
1.11 (0.89 to
1.38)
1.09 (0.87 to
1.34)
1.07 (0.85 to
1.32)
1.04 (0.84 to
1.29)
1.03 (0.82 to
1.27)
1.02 (0.82 to
1.26)
1.01 (0.81 to
1.25)
1.00 (0.80 to
1.24)
1.5 1.19 (0.95 to
1.47)
1.16 (0.93 to
1.44)
1.12 (0.90 to
1.39)
1.07 (0.86 to
1.33)
1.05 (0.84 to
1.30)
1.01 (0.81 to
1.25)
0.98 (0.79 to
1.21)
0.95 (0.76 to
1.17)
0.92 (0.74 to
1.14)
0.91 (0.73 to
1.13)
0.89 (0.72 to
1.11)
0.88 (0.71 to
1.09)
1.8 1.17 (0.94 to
1.44)
1.13 (0.91 to
1.40)
1.07 (0.86 to
1.33)
1.01 (0.81 to
1.25)
0.98 (0.79 to
1.21)
0.92 (0.74 to
1.14)
0.89 (0.71 to
1.10)
0.84 (0.67 to
1.04)
0.81 (0.65 to
1.01)
0.79 (0.64 to
0.98)
0.77 (0.62 to
0.95)
0.76 (0.61 to
0.94)
2.0 1.16 (0.93 to
1.43)
1.11 (0.89 to
1.38)
1.05 (0.84 to
1.30)
0.98 (0.79 to
1.21)
0.95 (0.76 to
1.17)
0.88 (0.71 to
1.09)
0.84 (0.67 to
1.04)
0.79 (0.63 to
0.98)
0.76 (0.61 to
0.94)
0.74 (0.59 to
0.91)
0.71 (0.57 to
0.88)
0.69 (0.56 to
0.86)
2.5 1.13 (0.91 to
1.40)
1.09 (0.87 to
1.34)
1.01 (0.81 to
1.25)
0.92 (0.74 to
1.14)
0.88 (0.71 to
1.09)
0.81 (0.65 to
1.00)
0.76 (0.61 to
0.94)
0.69 (0.56 to
0.86)
0.66 (0.53 to
0.81)
0.63 (0.51 to
0.78)
0.60 (0.48 to
0.74)
0.58 (0.46 to
0.72)
3.0 1.12 (0.90 to
1.39)
1.07 (0.85 to
1.32)
0.98 (0.79 to
1.21)
0.89 (0.71 to
1.10)
0.84 (0.67 to
1.04)
0.76 (0.61 to
0.94)
0.70 (0.56 to
0.87)
0.63 (0.51 to
0.78)
0.59 (0.47 to
0.73)
0.56 (0.45 to
0.69)
0.53 (0.42 to
0.65)
0.50 (0.40 to
0.62)
4.0 1.10 (0.88 to
1.37)
1.04 (0.84 to
1.29)
0.95 (0.76 to
1.17)
0.84 (0.67 to
1.04)
0.79 (0.63 to
0.98)
0.69 (0.56 to
0.86)
0.63 (0.51 to
0.78)
0.55 (0.44 to
0.68)
0.50 (0.40 to
0.62)
0.47 (0.38 to
0.59)
0.43 (0.35 to
0.54)
0.41 (0.33 to
0.51)
5.0 1.09 (0.88 to
1.35)
1.03 (0.82 to
1.27)
0.92 (0.74 to
1.14)
0.81 (0.65 to
1.01)
0.76 (0.61 to
0.94)
0.66 (0.53 to
0.81)
0.59 (0.47 to
0.73)
0.50 (0.40 to
0.62)
0.45 (0.36 to
0.56)
0.42 (0.34 to
0.52)
0.38 (0.30 to
0.47)
0.35 (0.28 to
0.44)
6.0 1.09 (0.87 to
1.34)
1.02 (0.82 to
1.26)
0.91 (0.73 to
1.13)
0.79 (0.64 to
0.98)
0.74 (0.59 to
0.91)
0.63 (0.51 to
0.78)
0.56 (0.45 to
0.69)
0.47 (0.38 to
0.59)
0.42 (0.34 to
0.52)
0.39 (0.31 to
0.48)
0.34 (0.27 to
0.42)
0.32 (0.25 to
0.39)
8.0 1.08 (0.86 to
1.33)
1.01 (0.81 to
1.25)
0.89 (0.72 to
1.11)
0.77 (0.62 to
0.95)
0.71 (0.57 to
0.88)
0.60 (0.48 to
0.74)
0.53 (0.42 to
0.65)
0.43 (0.35 to
0.54)
0.38 (0.30 to
0.47)
0.34 (0.27 to
0.42)
0.30 (0.24 to
0.37)
0.27 (0.21 to
0.33)
10.0 1.07 (0.86 to
1.33)
1.00 (0.80 to
1.24)
0.88 (0.71 to
1.09)
0.76 (0.61 to
0.94)
0.69 (0.56 to
0.86)
0.58 (0.46 to
0.72)
0.50 (0.40 to
0.62)
0.41 (0.33 to
0.51)
0.35 (0.28 to
0.44)
0.32 (0.25 to
0.39)
0.27 (0.21 to
0.33)
0.24 (0.19 to
0.30)
* Rows correspond to increasing strength of the risk ratio of unmeasured confounding on the outcome and columns correspond to
increasing strength of risk ratio of unmeasured confounding on the exposure.
Page 77 of 79
https://mc.manuscriptcentral.com/bmj
BMJ
123456789101112131415161718192021222324252627282930313233343536373839404142434445464748495051525354555657585960
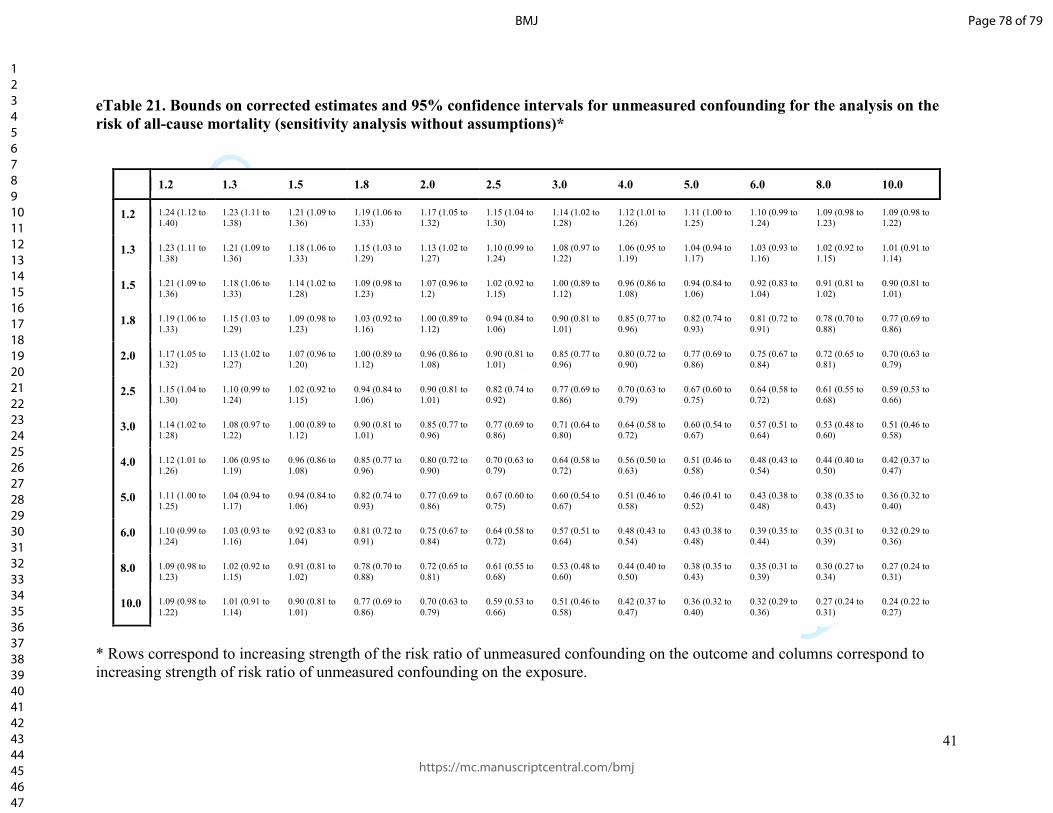
Confidential: For Review Only
41
eTable 21. Bounds on corrected estimates and 95% confidence intervals for unmeasured confounding for the analysis on the
risk of all-cause mortality (sensitivity analysis without assumptions)*
1.2 1.3 1.5 1.8 2.0 2.5 3.0 4.0 5.0 6.0 8.0 10.0
1.2 1.24 (1.12 to
1.40)
1.23 (1.11 to
1.38)
1.21 (1.09 to
1.36)
1.19 (1.06 to
1.33)
1.17 (1.05 to
1.32)
1.15 (1.04 to
1.30)
1.14 (1.02 to
1.28)
1.12 (1.01 to
1.26)
1.11 (1.00 to
1.25)
1.10 (0.99 to
1.24)
1.09 (0.98 to
1.23)
1.09 (0.98 to
1.22)
1.3 1.23 (1.11 to
1.38)
1.21 (1.09 to
1.36)
1.18 (1.06 to
1.33)
1.15 (1.03 to
1.29)
1.13 (1.02 to
1.27)
1.10 (0.99 to
1.24)
1.08 (0.97 to
1.22)
1.06 (0.95 to
1.19)
1.04 (0.94 to
1.17)
1.03 (0.93 to
1.16)
1.02 (0.92 to
1.15)
1.01 (0.91 to
1.14)
1.5 1.21 (1.09 to
1.36)
1.18 (1.06 to
1.33)
1.14 (1.02 to
1.28)
1.09 (0.98 to
1.23)
1.07 (0.96 to
1.2)
1.02 (0.92 to
1.15)
1.00 (0.89 to
1.12)
0.96 (0.86 to
1.08)
0.94 (0.84 to
1.06)
0.92 (0.83 to
1.04)
0.91 (0.81 to
1.02)
0.90 (0.81 to
1.01)
1.8 1.19 (1.06 to
1.33)
1.15 (1.03 to
1.29)
1.09 (0.98 to
1.23)
1.03 (0.92 to
1.16)
1.00 (0.89 to
1.12)
0.94 (0.84 to
1.06)
0.90 (0.81 to
1.01)
0.85 (0.77 to
0.96)
0.82 (0.74 to
0.93)
0.81 (0.72 to
0.91)
0.78 (0.70 to
0.88)
0.77 (0.69 to
0.86)
2.0 1.17 (1.05 to
1.32)
1.13 (1.02 to
1.27)
1.07 (0.96 to
1.20)
1.00 (0.89 to
1.12)
0.96 (0.86 to
1.08)
0.90 (0.81 to
1.01)
0.85 (0.77 to
0.96)
0.80 (0.72 to
0.90)
0.77 (0.69 to
0.86)
0.75 (0.67 to
0.84)
0.72 (0.65 to
0.81)
0.70 (0.63 to
0.79)
2.5 1.15 (1.04 to
1.30)
1.10 (0.99 to
1.24)
1.02 (0.92 to
1.15)
0.94 (0.84 to
1.06)
0.90 (0.81 to
1.01)
0.82 (0.74 to
0.92)
0.77 (0.69 to
0.86)
0.70 (0.63 to
0.79)
0.67 (0.60 to
0.75)
0.64 (0.58 to
0.72)
0.61 (0.55 to
0.68)
0.59 (0.53 to
0.66)
3.0 1.14 (1.02 to
1.28)
1.08 (0.97 to
1.22)
1.00 (0.89 to
1.12)
0.90 (0.81 to
1.01)
0.85 (0.77 to
0.96)
0.77 (0.69 to
0.86)
0.71 (0.64 to
0.80)
0.64 (0.58 to
0.72)
0.60 (0.54 to
0.67)
0.57 (0.51 to
0.64)
0.53 (0.48 to
0.60)
0.51 (0.46 to
0.58)
4.0 1.12 (1.01 to
1.26)
1.06 (0.95 to
1.19)
0.96 (0.86 to
1.08)
0.85 (0.77 to
0.96)
0.80 (0.72 to
0.90)
0.70 (0.63 to
0.79)
0.64 (0.58 to
0.72)
0.56 (0.50 to
0.63)
0.51 (0.46 to
0.58)
0.48 (0.43 to
0.54)
0.44 (0.40 to
0.50)
0.42 (0.37 to
0.47)
5.0 1.11 (1.00 to
1.25)
1.04 (0.94 to
1.17)
0.94 (0.84 to
1.06)
0.82 (0.74 to
0.93)
0.77 (0.69 to
0.86)
0.67 (0.60 to
0.75)
0.60 (0.54 to
0.67)
0.51 (0.46 to
0.58)
0.46 (0.41 to
0.52)
0.43 (0.38 to
0.48)
0.38 (0.35 to
0.43)
0.36 (0.32 to
0.40)
6.0 1.10 (0.99 to
1.24)
1.03 (0.93 to
1.16)
0.92 (0.83 to
1.04)
0.81 (0.72 to
0.91)
0.75 (0.67 to
0.84)
0.64 (0.58 to
0.72)
0.57 (0.51 to
0.64)
0.48 (0.43 to
0.54)
0.43 (0.38 to
0.48)
0.39 (0.35 to
0.44)
0.35 (0.31 to
0.39)
0.32 (0.29 to
0.36)
8.0 1.09 (0.98 to
1.23)
1.02 (0.92 to
1.15)
0.91 (0.81 to
1.02)
0.78 (0.70 to
0.88)
0.72 (0.65 to
0.81)
0.61 (0.55 to
0.68)
0.53 (0.48 to
0.60)
0.44 (0.40 to
0.50)
0.38 (0.35 to
0.43)
0.35 (0.31 to
0.39)
0.30 (0.27 to
0.34)
0.27 (0.24 to
0.31)
10.0 1.09 (0.98 to
1.22)
1.01 (0.91 to
1.14)
0.90 (0.81 to
1.01)
0.77 (0.69 to
0.86)
0.70 (0.63 to
0.79)
0.59 (0.53 to
0.66)
0.51 (0.46 to
0.58)
0.42 (0.37 to
0.47)
0.36 (0.32 to
0.40)
0.32 (0.29 to
0.36)
0.27 (0.24 to
0.31)
0.24 (0.22 to
0.27)
* Rows correspond to increasing strength of the risk ratio of unmeasured confounding on the outcome and columns correspond to
increasing strength of risk ratio of unmeasured confounding on the exposure.
Page 78 of 79
https://mc.manuscriptcentral.com/bmj
BMJ
123456789101112131415161718192021222324252627282930313233343536373839404142434445464748495051525354555657585960

Confidential: For Review Only
42
eTable 22. Bounds on corrected estimates and 95% confidence intervals for unmeasured confounding for the analysis on the
risk of severe hypoglycaemia (sensitivity analysis without assumptions)*
1.2 1.3 1.5 1.8 2.0 2.5 3.0 4.0 5.0 6.0 8.0 10.0
1.2 7.38 (4.51 to
12.08)
7.30 (4.46 to
11.95)
7.17 (4.38 to
11.74)
7.03 (4.30 to
11.51)
6.96 (4.25 to
11.39)
6.83 (4.18 to
11.19)
6.75 (4.12 to
11.05)
6.64 (4.06 to
10.88)
6.58 (4.02 to
10.77)
6.54 (4.00 to
10.70)
6.48 (3.96 to
10.62)
6.45 (3.94 to
10.57)
1.3 7.30 (4.46 to
11.95)
7.19 (4.39 to
11.77)
7.01 (4.28 to
11.47)
6.81 (4.16 to
11.16)
6.71 (4.10 to
11.00)
6.54 (4.00 to
10.71)
6.42 (3.93 to
10.52)
6.28 (3.84 to
10.28)
6.19 (3.78 to
10.14)
6.13 (3.75 to
10.04)
6.06 (3.70 to
9.92)
6.01 (3.68 to
9.85)
1.5 7.17 (4.38 to
11.74)
7.01 (4.28 to
11.47)
6.75 (4.12 to
11.05)
6.47 (3.95 to
10.59)
6.33 (3.87 to
10.36)
6.07 (3.71 to
9.94)
5.90 (3.61 to
9.67)
5.69 (3.48 to
9.32)
5.57 (3.40 to
9.12)
5.48 (3.35 to
8.98)
5.38 (3.29 to
8.80)
5.31 (3.25 to
8.70)
1.8 7.03 (4.30 to
11.51)
6.81 (4.16 to
11.16)
6.47 (3.95 to
10.59)
6.09 (3.72 to
9.97)
5.90 (3.61 to
9.67)
5.57 (3.40 to
9.12)
5.34 (3.27 to
8.75)
5.06 (3.09 to
8.29)
4.89 (2.99 to
8.01)
4.78 (2.92 to
7.83)
4.64 (2.84 to
7.60)
4.55 (2.78 to
7.46)
2.0 6.96 (4.25 to
11.39)
6.71 (4.10 to
11.00)
6.33 (3.87 to
10.36)
5.90 (3.61 to
9.67)
5.69 (3.48 to
9.32)
5.31 (3.25 to
8.70)
5.06 (3.09 to
8.29)
4.74 (2.90 to
7.77)
4.55 (2.78 to
7.46)
4.43 (2.71 to
7.25)
4.27 (2.61 to
6.99)
4.17 (2.55 to
6.84)
2.5 6.83 (4.18 to
11.19)
6.54 (4.00 to
10.71)
6.07 (3.71 to
9.94)
5.57 (3.40 to
9.12)
5.31 (3.25 to
8.70)
4.86 (2.97 to
7.96)
4.55 (2.78 to
7.46)
4.17 (2.55 to
6.84)
3.95 (2.41 to
6.46)
3.80 (2.32 to
6.22)
3.61 (2.20 to
5.90)
3.49 (2.13 to
5.72)
3.0 6.75 (4.12 to
11.05)
6.42 (3.93 to
10.52)
5.90 (3.61 to
9.67)
5.34 (3.27 to
8.75)
5.06 (3.09 to
8.29)
4.55 (2.78 to
7.46)
4.22 (2.58 to
6.91)
3.80 (2.32 to
6.22)
3.54 (2.17 to
5.80)
3.37 (2.06 to
5.52)
3.16 (1.93 to
5.18)
3.04 (1.86 to
4.97)
4.0 6.64 (4.06 to
10.88)
6.28 (3.84 to
10.28)
5.69 (3.48 to
9.32)
5.06 (3.09 to
8.29)
4.74 (2.90 to
7.77)
4.17 (2.55 to
6.84)
3.80 (2.32 to
6.22)
3.32 (2.03 to
5.44)
3.04 (1.86 to
4.97)
2.85 (1.74 to
4.66)
2.61 (1.60 to
4.27)
2.47 (1.51 to
4.04)
5.0 6.58 (4.02 to
10.77)
6.19 (3.78 to
10.14)
5.57 (3.40 to
9.12)
4.89 (2.99 to
8.01)
4.55 (2.78 to
7.46)
3.95 (2.41 to
6.46)
3.54 (2.17 to
5.80)
3.04 (1.86 to
4.97)
2.73 (1.67 to
4.47)
2.53 (1.55 to
4.14)
2.28 (1.39 to
3.73)
2.13 (1.30 to
3.48)
6.0 6.54 (4.00 to
10.70)
6.13 (3.75 to
10.04)
5.48 (3.35 to
8.98)
4.78 (2.92 to
7.83)
4.43 (2.71 to
7.25)
3.80 (2.32 to
6.22)
3.37 (2.06 to
5.52)
2.85 (1.74 to
4.66)
2.53 (1.55 to
4.14)
2.32 (1.42 to
3.80)
2.06 (1.26 to
3.37)
1.90 (1.16 to
3.11)
8.0 6.48 (3.96 to
10.62)
6.06 (3.70 to
9.92)
5.38 (3.29 to
8.80)
4.64 (2.84 to
7.60)
4.27 (2.61 to
6.99)
3.61 (2.20 to
5.90)
3.16 (1.93 to
5.18)
2.61 (1.60 to
4.27)
2.28 (1.39 to
3.73)
2.06 (1.26 to
3.37)
1.78 (1.09 to
2.91)
1.61 (0.99 to
2.64)
10.0 6.45 (3.94 to
10.57)
6.01 (3.68 to
9.85)
5.31 (3.25 to
8.70)
4.55 (2.78 to
7.46)
4.17 (2.55 to
6.84)
3.49 (2.13 to
5.72)
3.04 (1.86 to
4.97)
2.47 (1.51 to
4.04)
2.13 (1.30 to
3.48)
1.90 (1.16 to
3.11)
1.61 (0.99 to
2.64)
1.44 (0.88 to
2.36)
* Rows correspond to increasing strength of the risk ratio of unmeasured confounding on the outcome and columns correspond to
increasing strength of risk ratio of unmeasured confounding on the exposure.
Page 79 of 79
https://mc.manuscriptcentral.com/bmj
BMJ
123456789101112131415161718192021222324252627282930313233343536373839404142434445464748495051525354555657585960