Conference Call about the Results of the 1 st Quarter of 2004 May 05, 2004 Conference Call about the...
23
Conference Call about the Results of the 1 st Quarter of 2004 May 05, 2004 Conference Call about the Results of the 1 st Quarter of 2004 Banco Itaú Holding Financeira S.A.
-
Upload
melvyn-hall -
Category
Documents
-
view
215 -
download
0
Transcript of Conference Call about the Results of the 1 st Quarter of 2004 May 05, 2004 Conference Call about the...
Conference Call about the Results of the 1st Quarter of 2004
May 05, 2004
Conference Call about the Results of the 1st Quarter of 2004
Banco Itaú Holding Financeira S.A.
2Conference Call about the Results of the 1st Quarter of 2004
Banco Itaú Holding Financeira S.A.
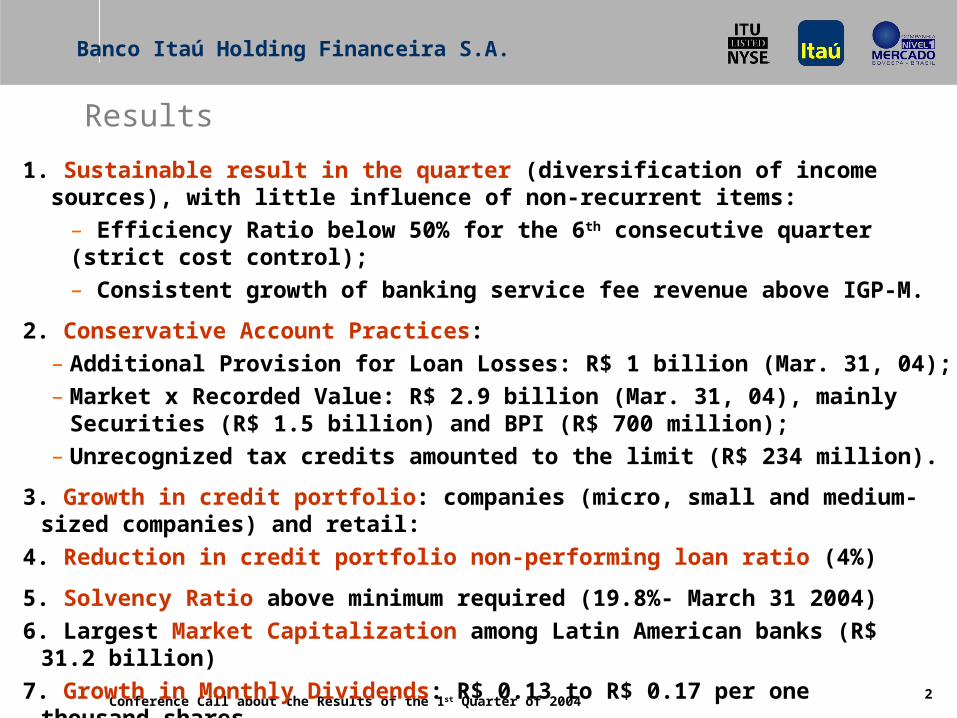
1. Sustainable result in the quarter (diversification of income sources), with little influence of non-recurrent items:
– Efficiency Ratio below 50% for the 6th consecutive quarter (strict cost control);
– Consistent growth of banking service fee revenue above IGP-M.
2. Conservative Account Practices:
– Additional Provision for Loan Losses: R$ 1 billion (Mar. 31, 04);
– Market x Recorded Value: R$ 2.9 billion (Mar. 31, 04), mainly Securities (R$ 1.5 billion) and BPI (R$ 700 million);
– Unrecognized tax credits amounted to the limit (R$ 234 million).
3. Growth in credit portfolio: companies (micro, small and medium-sized companies) and retail:
4. Reduction in credit portfolio non-performing loan ratio (4%)
5. Solvency Ratio above minimum required (19.8%- March 31 2004)
6. Largest Market Capitalization among Latin American banks (R$ 31.2 billion)
7. Growth in Monthly Dividends: R$ 0.13 to R$ 0.17 per one thousand shares
Results
3Conference Call about the Results of the 1st Quarter of 2004
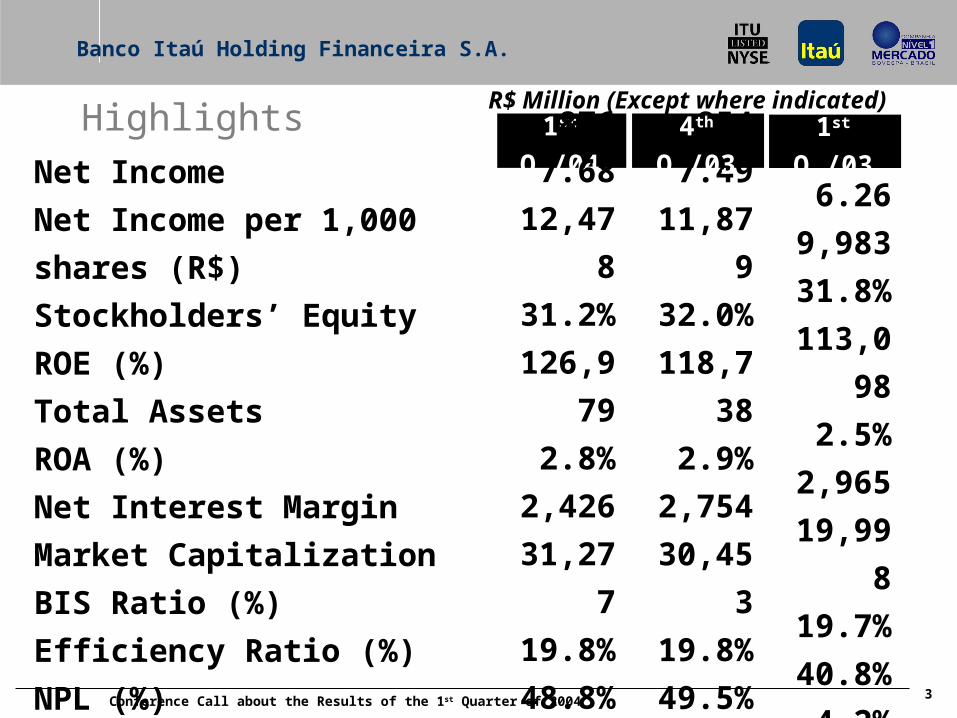
R$ Million (Except where indicated)
854
7.49
11,879
32.0%
118,738
2.9%
2,754
30,453
19.8%
49.5%
4.1%
Net Income
Net Income per 1,000 shares (R$)
Stockholders’ Equity
ROE (%)
Total Assets
ROA (%)
Net Interest Margin
Market Capitalization
BIS Ratio (%)
Efficiency Ratio (%)
NPL (%)
1st Q./04
876
7.68
12,478
31.2%
126,979
2.8%
2,426
31,277
19.8%
48.8%
4.0%
714
6.26
9,983
31.8%
113,098
2.5%
2,965
19,998
19.7%
40.8%
4.2%
4th Q./03 1st Q./03
Banco Itaú Holding Financeira S.A.
Highlights
4Conference Call about the Results of the 1st Quarter of 2004
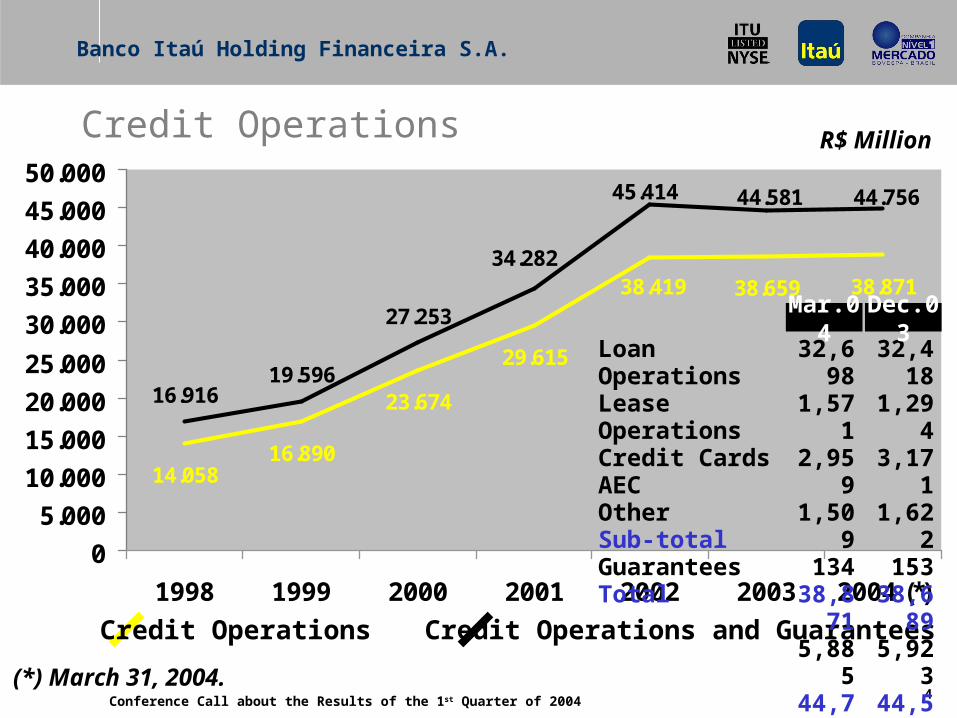
14.05816.890
23.674
29.615
38.659 38.871
16.91619.596
27.25338.419
44.75644.581
34.282
45.414
0
5.000
10.000
15.000
20.000
25.000
30.000
35.000
40.000
45.000
50.000
1998 1999 2000 2001 2002 2003 2004 (*)
Credit Operations Credit Operations and Guarantees
R$ Million
(*) March 31, 2004.
Banco Itaú Holding Financeira S.A.
Credit Operations
Loan OperationsLease OperationsCredit CardsAECOtherSub-totalGuaranteesTotal
32,4181,2943,1711,622
15338,6895,923
44,581
Dec.0332,6981,5712,9591,509
13438,8715,885
44,756
Mar.04
5Conference Call about the Results of the 1st Quarter of 2004
Banco Itaú Holding Financeira S.A.
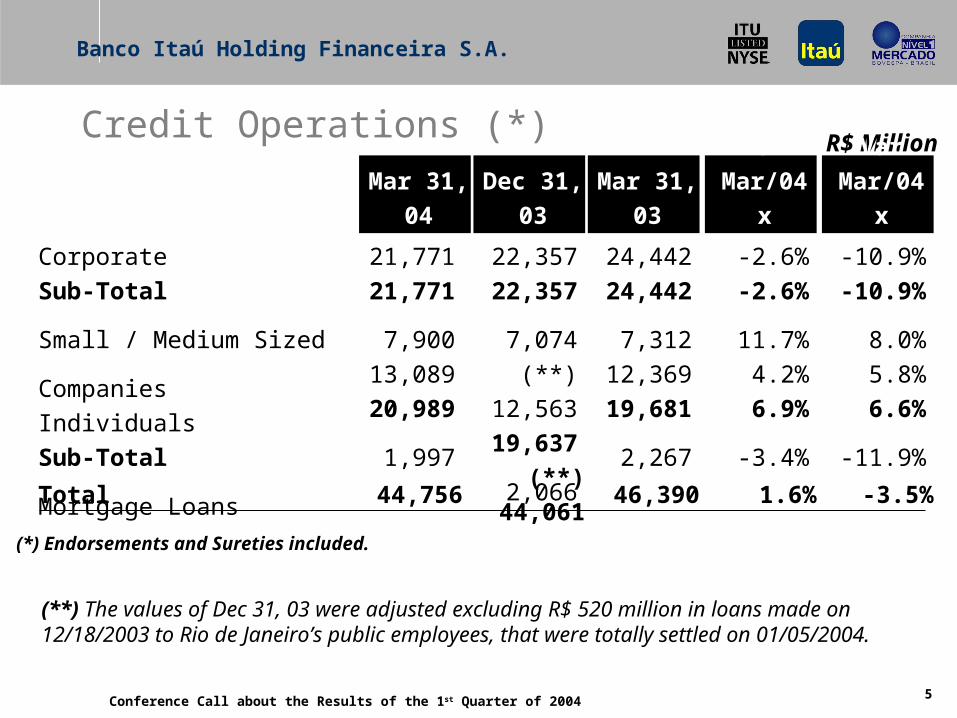
R$ Million
CorporateSub-Total
Small / Medium Sized CompaniesIndividualsSub-Total
Mortgage Loans
Total
24,44224,442
7,31212,36919,681
2,267
46,390
Var Mar/04
x Dec/03
-2.6%-2.6%
11.7%4.2%6.9%
-3.4%
1.6%
Dec 31, 03
22,35722,357
7,074(**) 12,563
19,637
2,066
(**) 44,061
Mar 31, 03
(*) Endorsements and Sureties included.
Mar 31, 04
21,77121,771
7,90013,08920,989
1,997
44,756
Var Mar/04
x Mar/03
-10.9%-10.9%
8.0%5.8%6.6%
-11.9%
-3.5%
Credit Operations (*)
(**) The values of Dec 31, 03 were adjusted excluding R$ 520 million in loans made on 12/18/2003 to Rio de Janeiro’s public employees, that were totally settled on 01/05/2004.
6Conference Call about the Results of the 1st Quarter of 2004
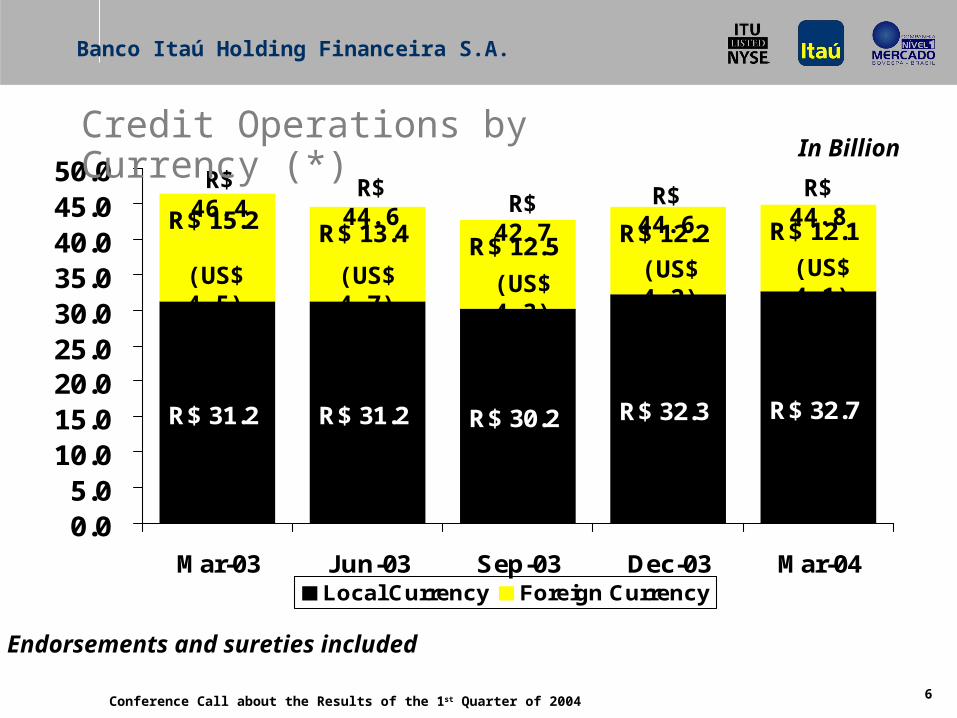
R$ 31.2 R$ 31.2 R$ 30.2 R$ 32.3 R$ 32.7
R$ 15.2 R$ 13.4 R$ 12.5 R$ 12.2 R$ 12.1
0.05.0
10.015.020.025.030.035.040.045.050.0
Mar-03 Jun-03 Sep-03 Dec-03 Mar-04Local Currency Foreign Currency
R$ 46.4 R$ 44.6R$ 42.7 R$ 44.6
In Billion
(US$ 4.5) (US$ 4.7) (US$ 4.3)(US$ 4.2)
(*) Endorsements and sureties included
(US$ 4.1)
R$ 44.8
Banco Itaú Holding Financeira S.A.
Credit Operations by Currency (*)
7Conference Call about the Results of the 1st Quarter of 2004
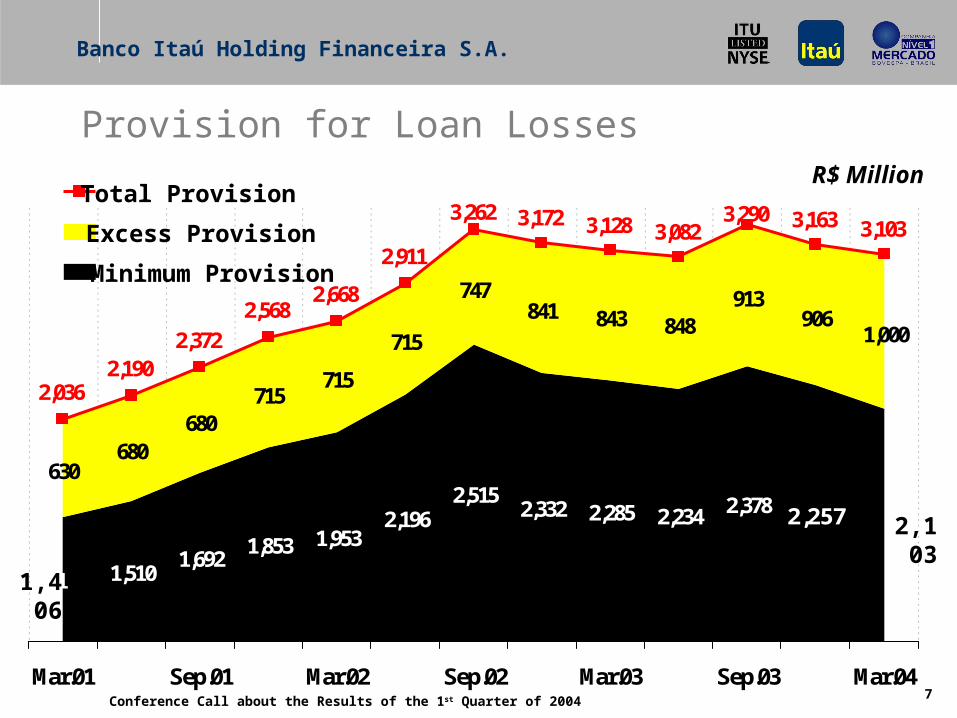
1,5101,692
1,853 1,9532,196
2,5152,332 2,285 2,234 2,378
630680
680715
715
715
747841 843 848
913906
1,000
2,257
1
3,172 3,128 3,0823,290 3,163 3,103
2,911
3,262
2,6682,568
2,3722,190
2,036
Mar.01 Sep.01 Mar.02 Sep.02 Mar.03 Sep.03 Mar.04
R$ Million
Minimum Provision
Excess Provision
Total Provision
1,406
2,103
Banco Itaú Holding Financeira S.A.
Provision for Loan Losses
8Conference Call about the Results of the 1st Quarter of 2004
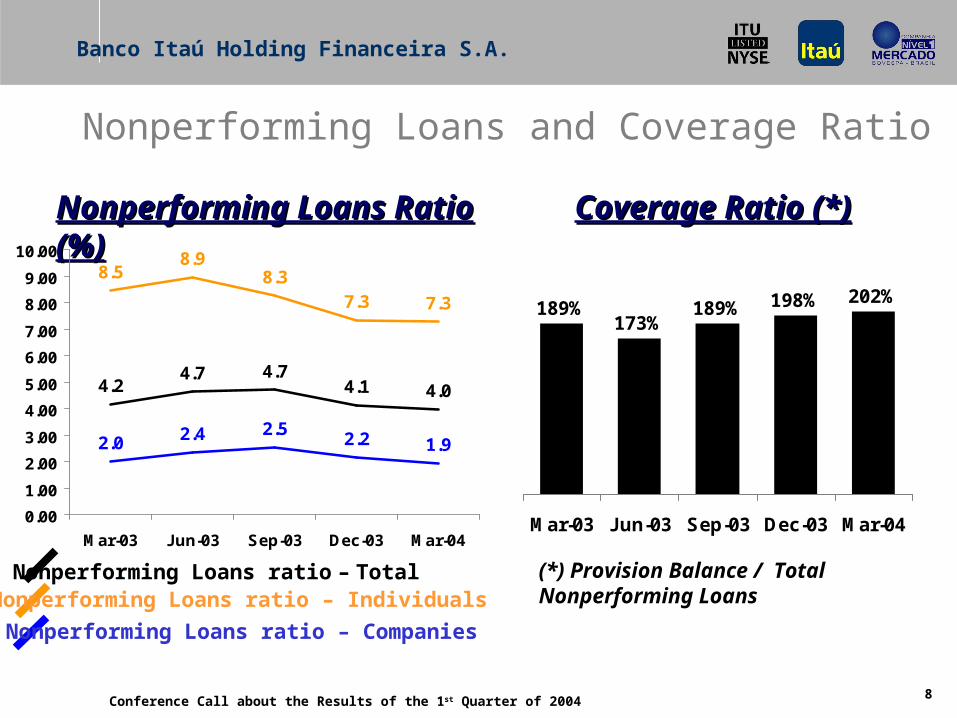
Nonperforming Loans and Coverage Ratio
Coverage Ratio (*)Coverage Ratio (*)
Nonperforming Loans ratio – TotalNonperforming Loans ratio – Individuals
Nonperforming Loans ratio – Companies
(*) Provision Balance / Total Nonperforming Loans
Nonperforming Loans Ratio (%)Nonperforming Loans Ratio (%)
4.24.7 4.7
4.1 4.0
8.58.9
7.3
8.37.3
2.0 2.4 2.52.2 1.9
0.00
1.00
2.00
3.00
4.00
5.00
6.00
7.00
8.00
9.00
10.00
Mar-03 Jun-03 Sep-03 Dec-03 Mar-04
189%173%
189% 198% 202%
Mar-03 Jun-03 Sep-03 Dec-03 Mar-04
Banco Itaú Holding Financeira S.A.

9Conference Call about the Results of the 1st Quarter of 2004
R$ Million
1st Q./04
3281792
2896257
16424424
129
1,405
4th Q./03
3351888
2593759
14425024
128
1,343
Mutual Funds Management Fees Consortium Administration Collection Checking Account Services Tax Collection Interbank Fees Credit Operation Fees Credit Card Income from Guarantees Provided Other
Total
1st Q./03
2821 73
2474649
13323629
116
1,212
Banking Service Fees
Banco Itaú Holding Financeira S.A.

10Conference Call about the Results of the 1st Quarter of 2004
R$ Million
Personnel Expenses
Other Administrative Expenses
Reorganization
Total
1st Q./04
694
1,235
79
2,009
Administrative Expenses
4th Q./03
725
1,277
104
2,107
Administrative Expenses under Strict Control
Banco Itaú Holding Financeira S.A.
11Conference Call about the Results of the 1st Quarter of 2004
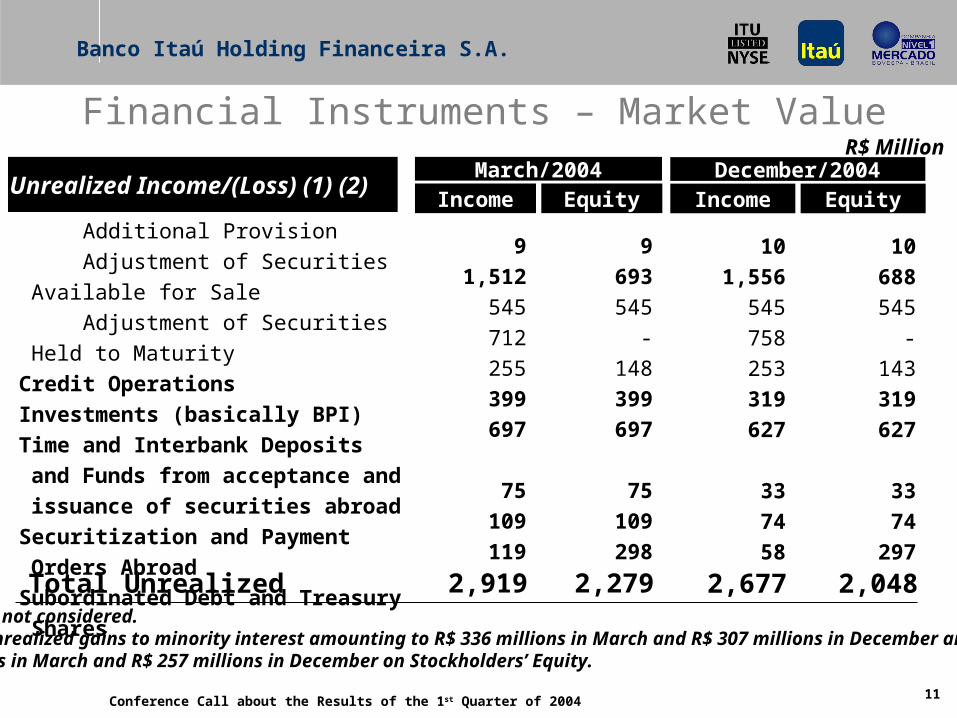
Financial Instruments – Market Value
Total Unrealized
Interbank Deposits
Securities and derivatives
Additional Provision Adjustment of Securities Available for Sale Adjustment of Securities Held to MaturityCredit Operations
Investments (basically BPI)
Time and Interbank Deposits and Funds from
acceptance and issuance of securities abroad
Securitization and Payment Orders Abroad
Subordinated Debt and Treasury Shares
R$ Million
Unrealized Income/(Loss) (1) (2)Income Equity
December/2004
2,677 2,048
10
1,556
545758253319
627
33
74
58
10
688
545-
143319
627
33
74
297
Income EquityMarch/2004
2,919 2,279
9
1,512
545712255399
697
75
109
119
9
693
545-
148399
697
75
109
298
(1) Tax effects not considered.(2) Includes unrealized gains to minority interest amounting to R$ 336 millions in March and R$ 307 millions in December andR$ 286 millions in March and R$ 257 millions in December on Stockholders’ Equity.
Banco Itaú Holding Financeira S.A.
12Conference Call about the Results of the 1st Quarter of 2004
. The following slides show the pro forma information about Banco Itaú and Banco Itaú BBA operations, using internal data for a better disclosure of the managerial performance of the business units.
. In 2003, it was considered as if the integration process between Banco Itaú BBA and the corporate segment of Banco Itaú occurred in the beginning of the year.
Pro Forma
Banco Itaú Holding Financeira S.A.

13Conference Call about the Results of the 1st Quarter of 2004
R$ Million
(*) Endorsements and sureties included.
Pro Forma
Banco Itaú Holding Financeira S.A.
Banco Itaú
601
7,213
37.7%
22,985
101,881
Banco Itaú-BBA
215
3,104
30.7%
22,030
31,130
Net Income
Allocated Capital Tier I
ROE (%)
Credit Operations (*)
Total Assets
Banco Itaú
651
6,479
46.7%
22,224
95,079
Banco Itaú-BBA
48
2,924
6.7%
22,468
30,233
March / 2004 December / 2003Corpo-ration
60
2,162
11.6%
-
4,620
Corpo-ration
155
2,477
27.4%
-
5,680Note: The Consolidated doesn’t represent the sum of the parts since there are operations among related parties, eliminated only in the Consolidated

14Conference Call about the Results of the 1st Quarter of 2004
Variation
-9.6%
30.9%
5.2%
-4.3%
30.8%
-39.0%
-7.7%
11.3%
-
R$ Million
Net Interest Margin
Result from Loan Losses
Banking Service Fees
Administrative Expenses
Income Tax and Social Contribution
Other
Net Income
Allocated Capital Tier I
ROE (%)
1st Q./04
2,047
(352)
1,356
(1,928)
(272)
(250)
601
7,213
37.7%
4th Q./03
2,264
(269)
1,289
(2,015)
(208)
(410)
651
6,479
46.7%
Banco Itaú S.A.
Pro Forma

15Conference Call about the Results of the 1st Quarter of 2004
Credit Cards21%
Mutual Funds and Managed
Portfolios6%
Insurance, Capitalization and Pension
Plans21%
Banco Itaú - Banking
52%
Diversification of income sourcesNot only restricted to interest rates
Banco Itaú - Banking
57%
Insurance, Capitalization and Pension
Plans16%
Mutual Funds and Managed
Portfolios7%
Credit Cards20%
11stst Quarter 2004 Quarter 2004 44thth Quarter 2003 Quarter 2003
Banco Itaú S.A.
Consolidated Net Income

16Conference Call about the Results of the 1st Quarter of 2004
Technical Provisions of Insurance,Capitalization and Pension Plans
2,821 3,3523,991
4,9075,526
612
923906
902927
977957
1,0211,077
1,1341,168
1,2361,225
2,459
569
Dec-02 Mar-03 Jun-03 Sep-03 Dec-03 Mar-04
Technical Provisions - Pension Plans AGF
Technical Provisions - Capitalization Technical Provisions - Insurance
R$ Million
7,689
4,4034,804
5,3886,086
Technical Provisions of Pension Plans – growth of 96% from March 2003 to March 2004
8,320
Banco Itaú S.A.
17Conference Call about the Results of the 1st Quarter of 2004
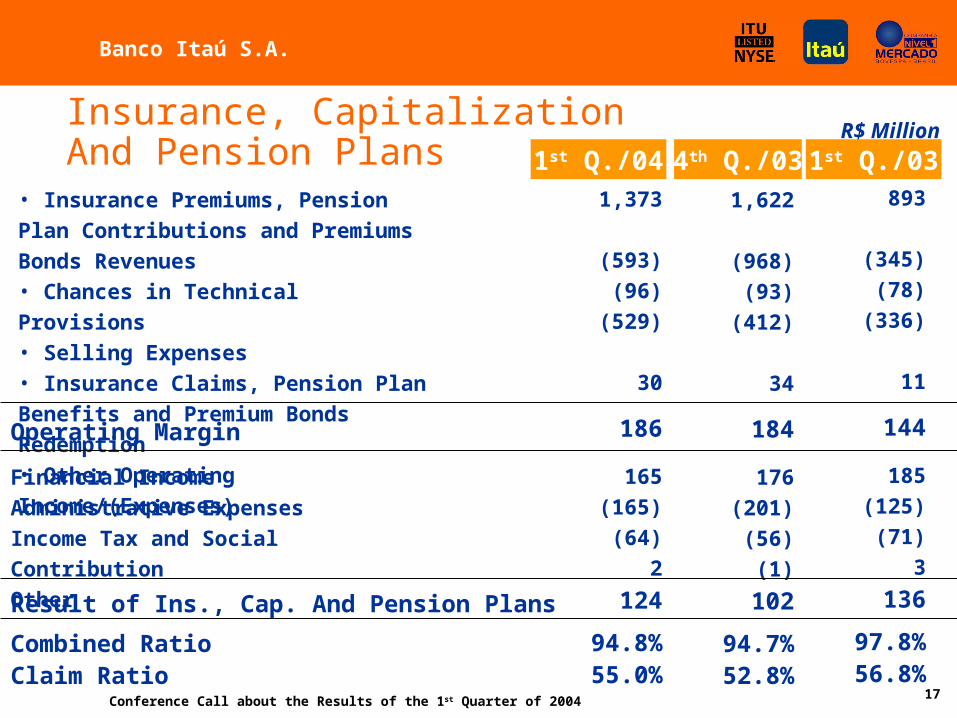
1st Q./034th Q./03
Result of Ins., Cap. And Pension Plans 102
Combined Ratio 94.7%Claim Ratio 52.8%
• Insurance Premiums, Pension Plan Contributions
and Premiums Bonds Revenues• Chances in Technical Provisions• Selling Expenses• Insurance Claims, Pension Plan Benefits and
Premium Bonds Redemption• Other Operating Income/(Expenses)
1,622
(968)
(93)
(412)
34
Operating Margin 184
Financial Income
Administrative Expenses
Income Tax and Social Contribution
Other
176
(201)
(56)
(1)
R$ Million
1st Q./04
124
94.8%55.0%
1,373
(593)
(96)
(529)
30
186
165
(165)
(64)
2
136
97.8%56.8%
893
(345)
(78)
(336)
11
144
185
(125)
(71)
3
Insurance, CapitalizationAnd Pension Plans
Banco Itaú S.A.

18Conference Call about the Results of the 1st Quarter of 2004
Mutual Funds and Managed Portfolios
59.2 62.9 67.1 71.886.480.1
Dec-02 Mar-03 Jun-03 Sep-03 Dec-03 Mar-04
Assets Under ManagementAssets Under ManagementR$ Billion
Growth of 37% in volume of Mutual Funds and Managed Portfolios in relation to March 2003
Banco Itaú S.A.
19Conference Call about the Results of the 1st Quarter of 2004
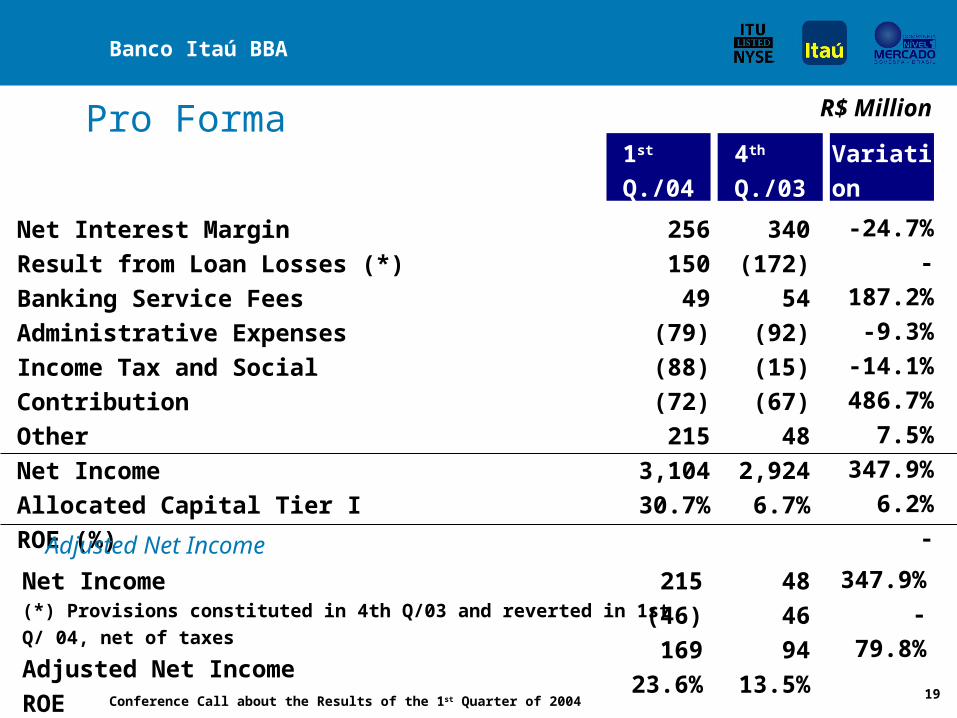
1st Q./04
256
150
49
(79)
(88)
(72)
215
3,104
30.7%
4th Q./03
340
(172)
54
(92)
(15)
(67)
48
2,924
6.7%
R$ Million
Net Interest Margin
Result from Loan Losses (*)
Banking Service Fees
Administrative Expenses
Income Tax and Social Contribution
Other
Net Income
Allocated Capital Tier I
ROE (%)
Variation
-24.7%
-187.2%
-9.3%
-14.1%
486.7%
7.5%
347.9%
6.2%
-
Banco Itaú BBA
Pro Forma
Net Income(*) Provisions constituted in 4th Q/03 and reverted in 1st Q/ 04, net of taxes
Adjusted Net Income
ROE
215
(46)
169
23.6%
48
46
94
13.5%
347.9%
-
79.8%
Adjusted Net Income

20Conference Call about the Results of the 1st Quarter of 2004
Nonperforming Loans
R$ Million
Dec 31, 03
211
17,864
1.2%
Nonperforming Loans (NPL)
Credit Operations
NPL Ratio (%)
Mar 31, 04 Variation
Itaú BBA has a high quality portfolio with 95.3% of volume classified as “AA”, “A” and “B”.
245
17,361
1.4%
34
(503)
Banco Itaú BBA

21Conference Call about the Results of the 1st Quarter of 2004
4.524.89
5.756.20 6.26
6.797.05
7.49 7.68
1st Q./02 2nd Q./02 3rd Q./02 4th Q./02 1st Q./03 2nd Q./03 3rd Q./03 4th Q./03 1st Q./04
CAGR = 30.4%
R$Evolution of Net Income per Thousand Shares
Banco Itaú Holding Financeira S.A.
22Conference Call about the Results of the 1st Quarter of 2004
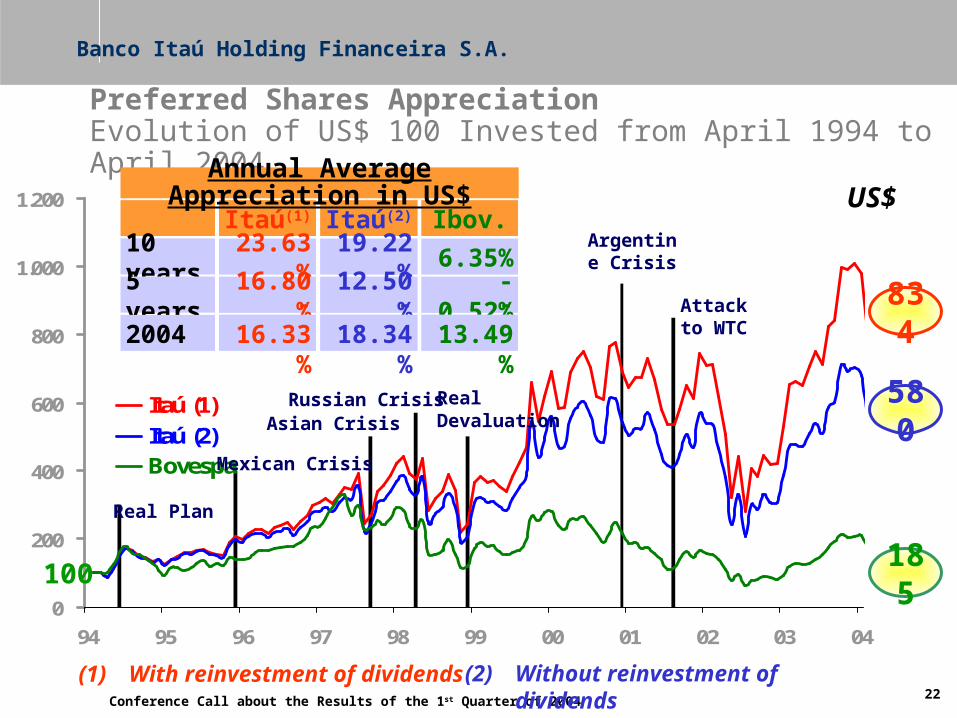
Preferred Shares AppreciationEvolution of US$ 100 Invested from April 1994 to April 2004
Banco Itaú Holding Financeira S.A.
0
200
400
600
800
1.000
1.200
94 95 96 97 98 99 00 01 02 03 04
Itaú (1)Itaú (2)Bovespa
Real Plan
Russian Crisis Real Devaluation
US$
Mexican Crisis
Asian Crisis
100
580
185
834
Argentine Crisis
Attack to WTC
Itaú(1) Itaú(2) Ibov.
10 years 23.63% 19.22% 6.35%
5 years 16.80% 12.50% -0.52%
2004 -16.33% -18.34% -13.49%
Annual Average Appreciation in US$
(1) With reinvestment of dividends (2) Without reinvestment of dividends

Conference Call about the Results of the 1st Quarter of 2004
May 05, 2004
Conference Call about the Results of the 1st Quarter of 2004
Banco Itaú Holding Financeira S.A.