Conditions for the Deployment of Alternative Drivetrains
34
19. September 2012 PSI, 19. September 2012 PSI, Martin Densing, Hal Turton, Georg Bäuml Conditions for the Deployment of Alternative Drivetrains A global energy system perspective Paul Scherrer Institute (Switzerland), VOLKSWAGEN AG
Transcript of Conditions for the Deployment of Alternative Drivetrains

19. September 2012 PSI, 19. September 2012 PSI,
Martin Densing, Hal Turton, Georg Bäuml
Conditions for the Deployment of Alternative Drivetrains
A global energy system perspective
Paul Scherrer Institute (Switzerland), VOLKSWAGEN AG

Seite 2
Framework
•Project: in cooperation with car manufacturer Volkswagen •Goal: to understand how the development of the global energy system influences the transport sector, focusing on • personal car technologies, and the corresponding • fuelling options, up to 2050
•Approach: Scenario Analysis with a detailed energy system model (GMM) sensitivity of the energy system and technology choice to some key
uncertainties: direction and magnitude of impact identification of robust trends ‘what-if’ assumptions about future, no forecast

Seite 3
Contents
• Introduction of the Energy System Model (GMM)
• Overview of Selected Uncertainties for the Scenario Analyses • Some Results of the Scenario Analyses
• for Personal Car Sector • for Other Sectors of the Energy System

Seite 4
Modeling Framework of Global Energy System
GMM (Global Multi-Regional MARKAL Model) • Bottom-up model: detailed representation of resources, technologies, energy flows, and
technological change/learning • Cost-optimization model: yields least-cost solutions for the global energy system under given sets
of assumptions and constraints • Solution is globally optimal allocation of society’s resources • Costs and “prices” in GMM represent cost of production, or the scarcity value based on the
cost of substitutes (not “real-world” market prices, e.g. for oil) • Long-term perspective: project reports results until 2050, but results until 2100 are available,
• addressing long-term energy issues, e.g., resource depletion, climate change policy, economic development and technology learning
• End-Use-Demand inputs: based on IPCC-SRES B2-scenario („middle-of-the-road“); exogenously given
• Endogenous Technology Learning (ETL): unit costs of key technology components decrease with increasing experience (cumulative installations); e.g. battery costs, fuel cell costs

Seite 5
Energy System in GMM (simplified)
approx. 400 technologies per world region T&D: Transport and Distribution
Conversion ProcessesResources End-Use
Oil
Natural Gas
Biomass
OtherRenewables
Uranium
Coal
Refinery
Heat Plants
Methanol fromNatural Gas
BiofuelsProduction
Power Plants
HydrogenProduction
T&D
T&D
T&D
CNG
Residential/Commercial
Thermal
Residential/Commercial
Specific
Industry Specific
Industry Thermal
PersonalTransport
Aviation
Other Transport
Non-commercialBiomass
Oil Products
Coal
T&D
T&D
T&D

Seite 6
World-Regions of GMM
North America(NAM)
Latin America,Middle Eastand Africa
(LAFM)
Other OECD(OOECD)
Former SovietUnion and
Eastern Europe(EEFSU)
ASIA
WesternEurope(WEUR)
WEUR := EU27 + Switzerland + Norway
• For each region: • Technology parameters: Costs, efficiencies, size, growth constraints etc. • Demands: E.g. km-demand growth for personal car transport • Policies, resources, renewable potential, etc.
• Inter-regional trade of energy carriers (limited by transaction costs) • Inter-regional technology diffusion of key components

Seite 7
Endogenous Technology Learning
t
t
t
t
ccbu
u ∆−=
∆
Source: IIASA-WEC 1995, Figure 4-7
Key components: Electric battery (in Battery Electric Vehicle, Hybrid Vehicles), Hydrogen FC, Gasifier,… • Learning-by-doing: Unit cost ut driven by cumulative capacity ct • Clustering: Key components can be part of several technologies Sum of global cumulative capacity
in all technologies determines ut • Exp.: Battery Storage (kWh): starts at 2010: 300$; 15% decrease by doubling capacity; lower bound: 100$
Empirically, unit production costs depend on cumulative capacity:

Seite 8 19. September 2012 PSI,
Car Technologies in GMM
19. September 2012 PSI,
ICEVs: • Liquid Fuel ICEVs: Fuels: Gasoline or Diesel, Ethanol, Methanol blending, FT-Diesel, Biodiesel • Advanced ICEV: Better efficiency*, no electric motor • Gas Fuel ICEV: Fuel is CNG; otherwise similar to Liquid Fuel ICEV Hybrids: • Liquid Fuel Electric Hybrid (HEV): Cars with ICE and a small auxiliary battery with electric motor. Fuel
choices similar to Liquid Fuel ICEV • Gas Fuel Hybrid: Fuel is CNG; otherwise similar to HEV • Hydrogen Fuel Cell Vehicle (HFCV, HFV): Cars with a fuel cell, buffer-battery, and electric motor • Hydrogen Hybrid: Cars with a hydrogen ICE; otherwise similar to HEV • Plugin-Hybrid Electric Vehicle (PHEV)
Battery-Electric Vehicle (BEV): with large battery (48kWh) (can substitute other demand technologies in range and power, as all car technologies)
*based on MIT Sloan Automotive Laboratory’s naturally-aspirated spark ignition (NA-SI) engine (no turbo, no hybrid)*. Ex. of efficiency measures: friction reduction (engine, tires, aerodynamics), smart cooling, variable engine geometries, reduced weight, intelligent gear shift, no stop-restart.

Seite 9
Short-Range Car
Vehicle Category Long-Range Market Short-Range Market Liquid Fuel ICEV all variants gasoline fuelled Advanced ICEV all variants gasoline fuelled Gas Fuel ICEV - Petroleum Electric Hybrid (subcategory of HEV)
Hydrogen Fuel Cell Vehicle (FCV) Hydrogen Hybrid - Gasoline Fuel Cell Vehicle - Plug-In-Hybrid Electric Vehicle (PHEV) Battery-Electric Vehicle (BEV)
Short-Range Car Parameters: • ~100 km actual drive range (identical mileage for all world-regions)
• short-range hybrids (HEV, plug-in, FCV) become relatively more efficient • e.g. plug-in HEV: 75% travel in electric mode (normal version: 50%)
• BEV: significantly smaller battery (18kWh) • Smaller (cheaper) engine/FC/storage/battery in other vehicles: e.g. Plug-In HEV, FCV
Empirically, mean car travel distance is short (work; shopping; future: emission-restricted city centres) Travel demand is split. Assumption: 10% of km-demand satisfied by Short Range Cars.
Seite 10
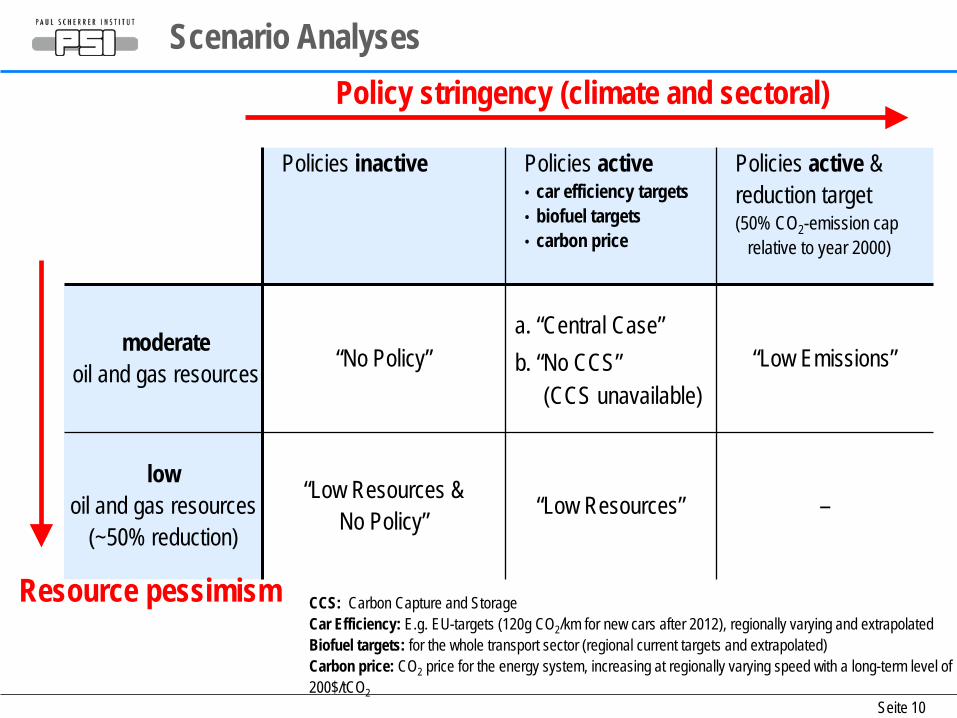
Scenario Analyses
Policies inactive
Policies active • car efficiency targets • biofuel targets • carbon price
Policies active & reduction target (50% CO2-emission cap
relative to year 2000)
moderate oil and gas resources “No Policy”
a. “Central Case” b. “No CCS” (CCS unavailable)
“Low Emissions”
low oil and gas resources
(~50% reduction)
“Low Resources & No Policy” “Low Resources” –
Policy stringency (climate and sectoral)
Resource pessimism CCS: Carbon Capture and Storage Car Efficiency: E.g. EU-targets (120g CO2/km for new cars after 2012), regionally varying and extrapolated Biofuel targets: for the whole transport sector (regional current targets and extrapolated) Carbon price: CO2 price for the energy system, increasing at regionally varying speed with a long-term level of 200$/tCO2

Seite 11
Some Results of “Central” scenario
• Renewables, biomass and coal (due to CCS) are expanding
• Developing countries increase share of energy use (and emissions) (dotted line, Asia + Latin Am. + Middle East + East Europe)
Global Primary Energy Supply
0
5000
10000
15000
20000
25000
30000
2000
2010
2020
2030
2040
2050
SR 2050
billi
on v
-km
/y
Global Car Technologies
Liquid Fuel ICEVLiquid Fuel HybridLiquid Fuel Plug-inGas Fuel ICEVGas Fuel HybridHydrogen HybridHydrogen Fuel CellElectric Vehicle
2000 2010 2020 2030 2040 2050 2050 (SR) • Hybrids dominate in 2050; natural gas cars are
attractive; electric and hydrogen vehicles play a small role (under these assumptions)
• Short-range market (SR): battery vehicles are cost-effective; conventional technology is replaced
0
200
400
600
800
1000
1200
2000 2010 2020 2030 2040 2050
EJ/y
RenewablesBiomassNuclearGasOilCoal

Seite 12
Car Technology and Fuel in year 2050 in Scenarios
No P
olicy
Low
Res.&
No
Pol
icy
Cent
ral
Low
Res.
No C
CS
Low
Emiss
.
Liquid Fuel ICEVLiquid Fuel HybridLiquid Fuel Plug-inGas Fuel ICEVGas Fuel HybridHydrogen HybridHydrogen Fuel CellGasoline Fuel CellElectric Vehicle
Petroleum Advanced ICEV
Short-Range Cars only:
0
5000
10000
15000
20000
25000
30000
billi
on v
-km
/y
0
5
10
15
20
25
30
35
40
45
EJ/y
Petroleum/SynfuelCNGMethanolEthanolBio-SNGBiofuel (Diesel)HydrogenElectricity
Central Case: electricity for cars in 2050 is 0.5% of total generation
Seite 13
0
10
20
30
40
50
60
70
2000 2010 2020 2030 2040 2050
PWh/
y
0.0
0.1
0.2
0.3
0.4
0.5
0.6
tCO
2/M
Wh
0
10
20
30
40
50
60
70
2000 2010 2020 2030 2040 2050
PWh/
y
0.0
0.1
0.2
0.3
0.4
0.5
0.6
tCO
2/M
wh
0
10
20
30
40
50
60
70
2000 2010 2020 2030 2040 2050
PWh/
y
0.0
0.1
0.2
0.3
0.4
0.5
0.6
tCO
2/M
Wh
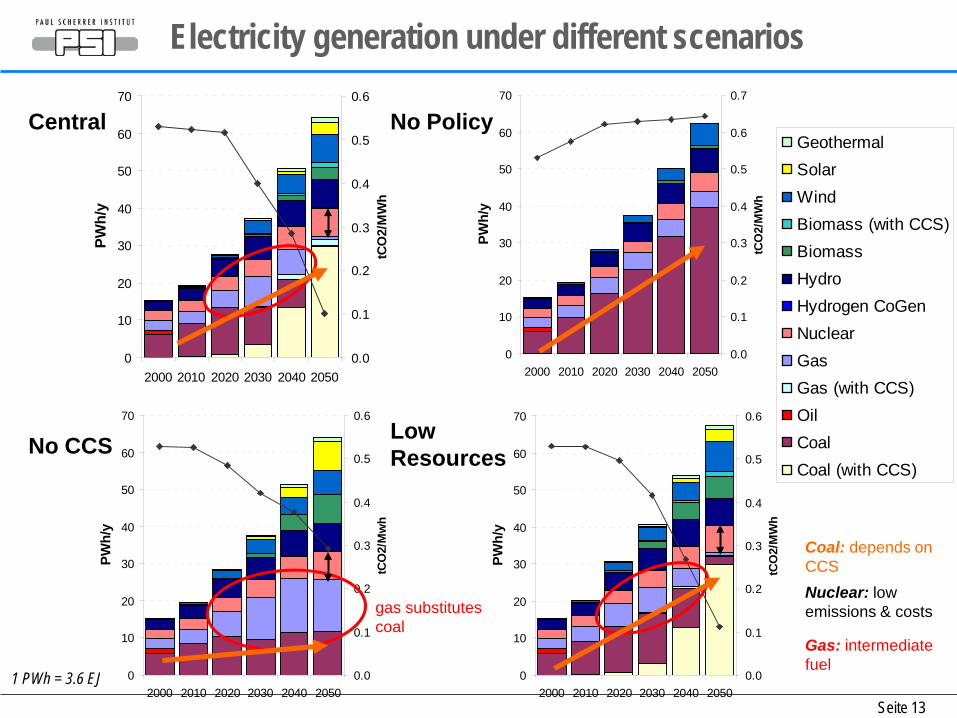
Electricity generation under different scenarios
No Policy
Low Resources
GeothermalSolarWindBiomass (with CCS)BiomassHydroHydrogen CoGenNuclearGasGas (with CCS)OilCoalCoal (with CCS)
0
10
20
30
40
50
60
70
2000 2010 2020 2030 2040 2050
PWh/
y
0.0
0.1
0.2
0.3
0.4
0.5
0.6
0.7
tCO
2/M
Wh
Central
No CCS
1 PWh = 3.6 EJ
Coal: depends on CCS
Gas: intermediate fuel
Nuclear: low emissions & costs gas substitutes
coal

Seite 14
Overall messages
• Depletion of cheap oil • is a major driver for many technology developments over the long term
(hybrids, CNG vehicles, alternative fuel production)
• Climate policy • drives earlier and additional deployment of hybrids and CNG • enables: BEVs, FCVs, biofuels, H2, more expensive renewables (e.g. solar), nuclear • stringent climate policy (50% target) further accelerates deployment of alternative transport
technologies
• CCS availability • crucial for decarbonizing electricity / hydrogen (in both cases, production primarily from coal) important for supporting new transport technologies • one implication is that more rapid deployment of nuclear would have a similar impact
• Car technology (under the above “ifs”)
• HEVs are generally attractive under all cases, short-to-long term • CNG vehicles may be interesting in short-medium term • BEVs are a mid- to long-term solution for short-range market (but less attractive for long-range) • H2 FCVs are most attractive over the very long-term (beyond 2050)

Seite 15
Selected References
• Azar et al. (2009): Global energy scenarios meeting stringent CO2 constraints – cost effective fuel choices in the transportation sector
• Hedenus et al. (2010): Cost-effective energy carriers for transport - the role of the energy supply system in a carbon-constrained world
• Grahn et al. (2009): Fuel and vehicle technology choices for passenger vehicles in achieving stringent CO2 targets: connections between transportation and other energy sectors
• Densing, Turton, Bäuml (2012): Conditions for the successful deployment of electric vehicles – a global energy system perspective, The Energy Journal, in press
…our group seeks a PhD Student and a Post-Doc… Thank you!

Seite 16
Long-Term Development of Global Car Sector (Central Scenario)
0
5000
10000
15000
20000
25000
30000
35000
40000
2000
2010
2020
2030
2040
2050
2060
2070
2080
2090
2100
billi
on v
-km
/y
Liquid Fuel ICEVLiquid Fuel HybridLiquid Fuel Plug-inGas Fuel ICEVGas Fuel HybridHydrogen HybridHydrogen Fuel CellElectric Vehicle
0
500
1000
1500
2000
2500
3000
3500
4000
2000
2010
2020
2030
2040
2050
2060
2070
2080
2090
2100
billi
on v
-km
/yLong-term drivers fo HFCVs:
• technology learning reduces FC stack costs • H2 is also used in non-car transport synergy in infrastructure build-up • cheap low-carbon H2 is crucial (CCS availability) • short-range car sector: BEVs are cost-competitive due to reduced investment costs
Short-Range Car Fleet Total Car Fleet
Petroleum Advanced ICEV
Seite 17
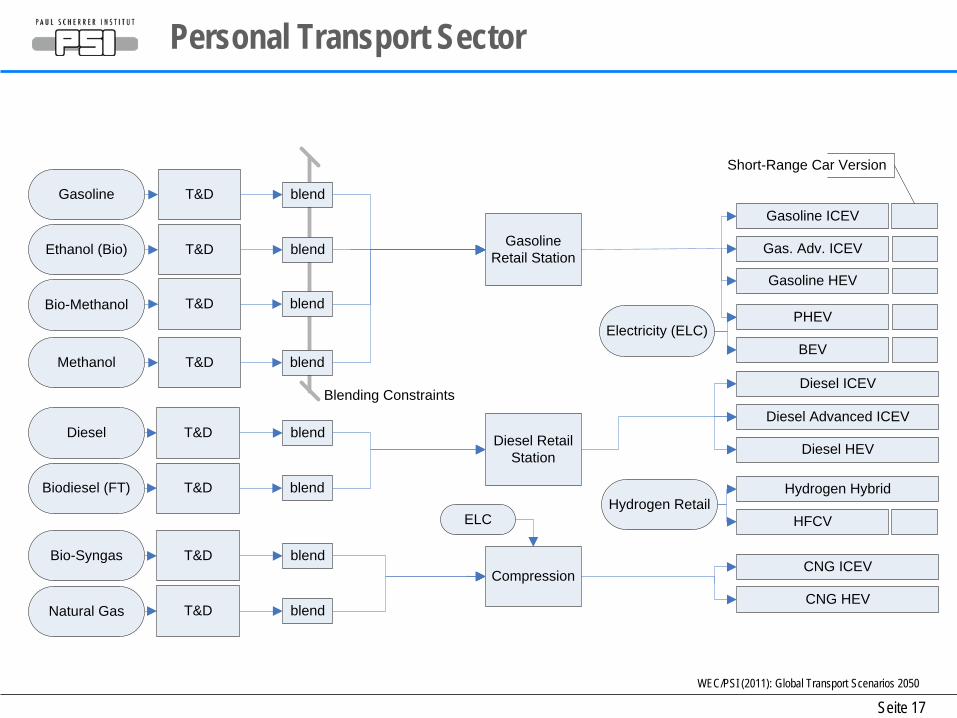
Personal Transport Sector
Gasoline ICEV
Gas. Adv. ICEV
Gasoline HEV
Diesel ICEV
Diesel Advanced ICEV
Diesel HEV
CNG ICEV
CNG HEV
BEV
PHEV
Hydrogen Hybrid
HFCVHydrogen Retail
Electricity (ELC)
Compression
Gasoline Retail Station
Diesel Retail Station
blend
blend
blend
blend
blend
blend
blend
blend
ELC
Blending Constraints
e so a a spo t Secto
Short-Range Car Version
T&D
T&D
T&D
T&DEthanol (Bio)
Bio-Methanol
Biodiesel (FT)
Bio-Syngas
T&DDiesel
T&DGasoline
T&DMethanol
T&DNatural Gas
WEC/PSI (2011): Global Transport Scenarios 2050
Seite 18
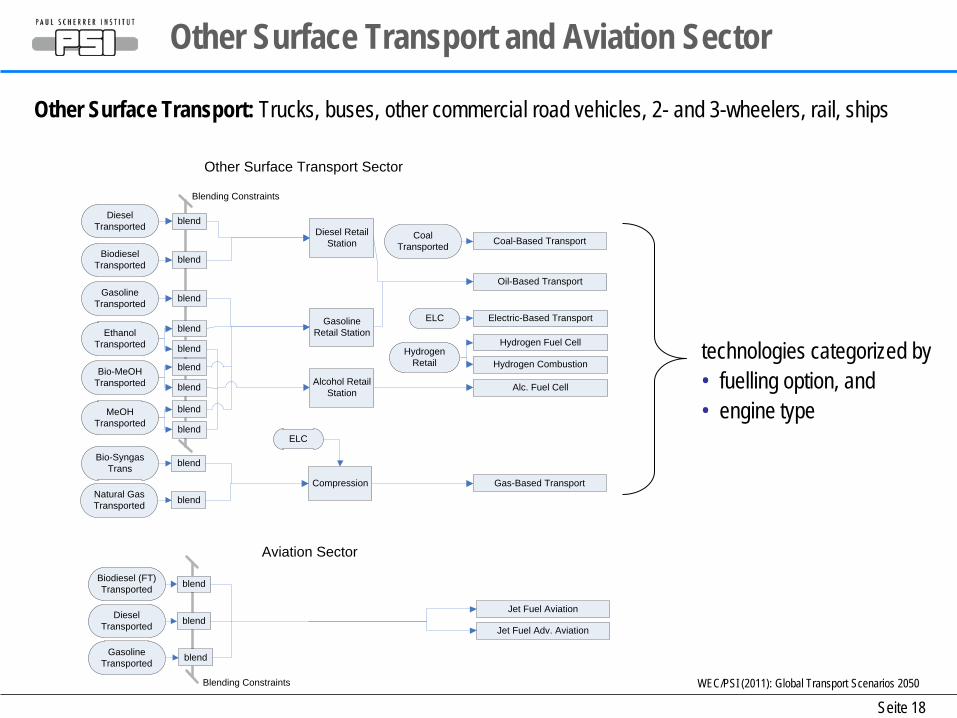
Other Surface Transport and Aviation Sector
Oil-Based Transport
Hydrogen Combustion
Electric-Based Transport
Gas-Based Transport
Alc. Fuel Cell
Hydrogen Fuel Cell
Jet Fuel Aviation
Jet Fuel Adv. Aviation
blend
blend
blend
Hydrogen Retail
ELC
blend
blend
blend
Coal-Based TransportCoal Transported
Blending Constraints
Ethanol Transported
Bio-MeOH Transported
MeOH Transported
Biodiesel Transported
Bio-Syngas Trans
Natural Gas Transported
Diesel Transported
Gasoline Transported blend
blend
blend
blend
blend
blend
blend
blend
Compression
ELC
Gasoline Transported
Diesel Transported
Biodiesel (FT) Transported
Other Surface Transport Sector
Aviation Sector
Gasoline Retail Station
Diesel Retail Station
Alcohol Retail Station
Blending Constraints
Other Surface Transport: Trucks, buses, other commercial road vehicles, 2- and 3-wheelers, rail, ships
technologies categorized by • fuelling option, and • engine type
WEC/PSI (2011): Global Transport Scenarios 2050

Seite 19
component initial cost (year) decline by capacity doubling floor
Battery Storage (kWh) 300$ (2010) 15% 100$
Mobile Fuel Cell (kW) 250$ (2010) 15% 50$
Solar PV (kW) 5500$ (2000) 18% 1000$
Comparison: Exogenous battery costs estimation in industry:
:
Some ETL Parameters
Some endogenous costs of key components in GMM:

Seite 20
Detailed Technology Options
Source: adapted from US DoE (2006) and Felder (2007)
0 10 20 30 40 50
Coal gasification
Coal gasification with CCS
Natural gas reforming
Natural gas reforming with CCS
Biomass gasification
Central wind + electrolysis
Electrolysis
Nuclear sulphur-iodine cycle
High-pressure (HP) electrolysis
Nuclear high-pressure electrolysis
Nuclear high-temperature electrolysis
Solar zinc/zinc-oxide cycle
Solar coke gasification
US$2000/GJ
Current Technology
Future Technology
Hydrogen Production Costs in GMM:
Note: • US Dollar based on year 2000 • investment costs annualised with 5% discount rate • feedstock costs constant in chart (GMM fuel costs are endogenously varying)

Seite 21
Emissions
Low oil and gas resources lead to slightly higher CO2 emissions with climate policy (higher use of coal slightly outweighs improvements in efficiency and increased use of renewables)
CO2 Emissions (energy-related)
0
10
20
30
40
50
60
2000 2005 2010 2015 2020 2025 2030 2035 2040 2045 2050
Gt C
O2/
y
GMM No PolicyGMM CentralGMM No CCSGMM Low ResourcesGMM Low Demand
Riahi, K et al. 2006: Scenarios of long-term socio-economic and environmental development under climate stabilization, Technological Forecasting and Social Change 74(7):887-935
Low Emissions

Seite 22
No Policy
0
10
20
30
40
50
60
70
80
90
100
2000 2010 2020 2030 2040 2050
Central Case
0
10
20
30
40
50
60
70 80
90
100
2000 2010 2020 2030 2040 2050
Hydrogen Biofuels Coal-to-Liquid Coal-to-MeOH
Alternative fuel production
Low Resources
0
10
20
30
40
50
60
70 80
90
100
2000 2010 2020 2030 2040 2050
EJ/y
Low Resources + No Policy
0
10
20
30
40
50
60
70
80
90
100
2000 2010 2020 2030 2040 2050
0
10
20
30
40
50
60
70
80
90
100
2000 2010 2020 2030 2040 2050
No CCS
HydrogenBiofuelsCoal-to-LiquidCoal-to-MeOH
EJ/y
• more H2 (from coal, gas, nuclear) • H2 can partially replace oil
H2 from coal discouraged
H2 enabled by: • Climate Policy, or • Low Resources

Seite 23
Car Technology and Fuel in year 2050
No P
olicy
Low
Res.&
No
Pol
icy
Cent
ral
Low
Res.
No C
CS
Low
Emiss
.
Liquid Fuel ICEVLiquid Fuel HybridLiquid Fuel Plug-inGas Fuel ICEVGas Fuel HybridHydrogen HybridHydrogen Fuel CellGasoline Fuel CellElectric Vehicle
Petroleum Advanced ICEV
Short-Range Cars:
0
5000
10000
15000
20000
25000
30000
billi
on v
-km
/y
0
5
10
15
20
25
30
35
40
45
e
s
S
d
EJ/y
Petroleum/SynfuelCNGMethanolEthanolBio-SNGBiofuel (Diesel)HydrogenElectricityBiofuel productionHydrogen production

Seite 24
Developing a scenario to analyse energy and transport
Population demographic development
GDP economic development, structural change, catch-up
Resource availability
Policies
Energy and Transport Demands • Industrial Sector • Commercial Sector • Residential Sector • Transport Sector (vehicle-km/year)
GMM
Global Optimization
Model
direct inputs
translated input
Technological Development uptake of new technologies, improvements to existing
Energy Intensity
Resource availability and cost
Policy constraints: vehicle emissions, biofuels, climate policy
Technology characteristics / specification, maximum rates of deployment
IPCC’s B2 scenario has ‘dynamics-as-usual’: e.g. GMM uses • avg. ann. income growth (1990 – 2050): 2.8%; historical (1950 – 1990): 2.2% • avg. ann. km-demand growth (2000 – 2050): 2.2% car transport, 2.9% air transport
B2 - Storyline

Seite 25
Central Case: Population and GDP drivers
* LAFM: Latin America, Africa, Middle East
Population
0
1
2
3
4
5
6
7
8
9
10
2000 2010 2020 2030 2040 2050
Popu
latio
n (b
illio
ns) LAFM*
Asia
Former Soviet Union
Other OECD
EU-29 (WEUR)
North America
GDP
0
20
40
60
80
100
120
2000 2010 2020 2030 2040 2050G
DP
(US$
90 tr
illio
ns -
MER
)
Energy demands derived from the IPCC’s B2 scenario (updated with Global Insight data): B2 scenario based on ‘dynamics-as-usual’: future rates of change (e.g. technological change, energy intensity) do not depart substantially from historical experience
• population stabilizes at about 10 billion by 2100 • largest increase in population and in GDP in the developing world popl.popl.
gdpgdp
energyenergy =

Seite 26
Central Case: Energy Demand, Car Travel Demand Industry demand
0
20
40
60
80
100
120
140
160
180
2000 2010 2020 2030 2040 2050
Use
ful e
nerg
y de
man
d (s
peci
fic +
ther
mal
) (EJ
)
LAFM*
Asia
Former Soviet Union
Other OECD
EU-29 (WEUR)
North America
Residential and services demand
0
50
100
150
200
250
2000 2010 2020 2030 2040 2050
Use
ful e
nerg
y de
man
d (s
peci
fic +
ther
mal
) (EJ
)
LAFM*
Asia
Former Soviet Union
Other OECD
EU-29 (WEUR)
North America
Car travel demand
0
5
10
15
20
25
30
2000 2010 2020 2030 2040 2050
Car
trav
el d
eman
d(t
rillio
n vk
m)
LAFM*
Asia
Former Soviet Union
Other OECD
EU-29 (WEUR)
North America
Other transport demand
0
20
40
60
80
100
120
140
2000 2010 2020 2030 2040 2050
Oth
er tr
ansp
ort d
eman
d (E
J)
LAFM*
Asia
Former Soviet Union
Other OECD
EU-29 (WEUR)
North America
Car travel demand (vehicle-km per year) is calibrated to year 2000 statistics, and projected using the v-km growth rates from the IEA/SMP model*. *IEA/SMP Model Documentation and Reference Case Projection; L. Fulton
(IEA) and G. Eads (CRA); July 2004, p.34

Seite 27
Climate Change Policy
* LAFM: Latin America, Africa, Middle East “$” refers to US dollar with base year 2000
Climate change policy (carbon tax proxy)
0
100
200
300
400
500
600
700
800
2000 2010 2020 2030 2040 2050
Car
bon
pric
e ($
/tC)
0
30
60
90
120
150
180
210
240
CO
2 pr
ice
($/tC
O2)
North AmericaEU-29 (WEUR)Other OECDFormer Soviet UnionAsiaLAFM*all regions: long-term price
• Biofuels: have no emissions in GMM • CCS potential until 2100: approx. 2500 Gt CO2
Carbon-Emission-Tax Proxy

Seite 28
Biofuel Targets in the Transport Sector
Biofuel targets (absolute)
0
1000
2000
3000
4000
5000
6000
2000 2010 2020 2030 2040 2050PJ
North America
Asia
LAFM*
Biofuel targets (relative)
0
5
10
15
20
25
30
2000 2010 2020 2030 2040 2050
perc
enta
ge o
f tra
nspo
rtatio
n fu
els EU-29 (WEUR)
Other OECD
Former Soviet Union
*LAFM: Latin America, Africa, Middle East
• EU-29: Directive 2009/28/EC until 2020 • North America: USA Energy Independence and Security Act 2007 (until 2022) • Asia: China NDRC targets (until 2020) • LAFM: projection of historical production in Brazil
relative targets: absolute targets:

Seite 29
Scenarios of Oil & Gas Resource Availability
• Central Case: Conventional oil & gas in line with IEA and BGR estimates, Some unconventional oil & gas reserves and resources also included
• Low Resources: - Gas: unconventional resources are assumed to be unavailable
- Oil: no unconventional reserves or resources, reduced conventional resources (total approx. 50% less than Central Case, guided by estimates of the EWG, but still higher)
Category I: Proven reserves (discovered and high probability that they can be extracted)
Category II: Estimated additional reserves (additional volumes that are thought to exist and to be extractable, but with higher costs)
Category III: Additional speculative resources (resources are occurrences with less-certain geological assurance and/or with doubtful economic feasibility)
Category IV: Enhanced recovery of existing reserves (e.g. by solvents, steam injection)
Category V: Unconventional reserves (oil shales, tar sands, bitumen, and heavy oils)
Category VI: Unconventional resources Rogner 1997: An Assessment of World Hydrocarbon Resources. Annu. Rev.
Energy Environ. 1997. 22:217-62
0 2,000 4,000 6,000 8,000
Cat.I
Cat.II
Cat.III
Cat.IV
Cat.V
Cat.VI
Oil
Res
erve
s &
Res
ourc
es
EJ
Low Scenario
Central Scenario

Seite 30
Production of Oil under different scenarios
No policy assumes the same resources as Central case, but without any policy measures
• The applied policy measures have a minor impact on production before 2040/2050. (increase in aviation*, decrease in car transport)
• Oil production peaks in 2030 or before in all scenarios (depletion of cheap reserves and resources) • In Low Resources Scenario (around ~1500 billion bbl), production is already declining from 2000.
* some studies see potential for biofuel: Air Transport Action Group, Beginner’s Guide to Aviation Biofuels, 2009 , 50% will be reached by 2040
0
20
40
60
80
100
120
140
160
180
2000 2010 2020 2030 2040 2050
EJ/y Central
No PolicyNo CCSLow ResourcesLow Res. & No PolicyLow DemandLow Emissions

Seite 31
Hydrogen in the Energy System (Central Scenario)
• The major share of hydrogen is used in non-car surface transport
Consumption of H2
• Coal Gasification uses CCS • Nuclear technologies: high-pressure / high-
temperature electrolysis, and chemical heat cycles
0
1
2
3
4
5
6
2000 2010 2020 2030 2040 2050
EJ/y
0
20
40
60
80
100
120
140
mto
e/y
Solar HydrolysisElectricity MixWind ElectrolysisBiomass GasificationNuclearNatural Gas ReformingLiquid Fuel Gasif.Coal Gasification
0
1
2
3
4
5
6
2000 2010 2020 2030 2040 20500
20
40
60
80
100
120
140
Car TransportOther Surface TransportStationary SectorFuel Cell Cogen
Production of H2

Seite 32
Alternative fuel production (all energy demand sectors) EJ
/y
Total
0
5
10
15
20
25
30
35
2000 2010 2020 2030 2040 2050
Hydrogen
Biofuels
Coal-to-Liquid
Coal-to-MeOH
• Alternative fuels derived from coal play a transitory role and are phased out due to the climate policy.
• Biofuels become cost competitive especially due to the assumed carbon price, with second generation being cost-competitive.
Biofuel Production (Central Case)
0
5
10
15
20
25
30
35
2000 2010 2020 2030 2040 2050
EJ/y
0
100
200
300
400
500
600
700
mto
e/y
Biofuel (Diesel) from OilCropsBiofuel (Diesel) fromWoodEthanol fromCellulose/StoverEthanol from Corn
Ethanol from SugarCropsMethanol from Wood
SNG from AnaerobicWasteSNG from Wood

Seite 33
Car Fuels
• Petroleum/Synfuel: gasoline (allowed to be blended with low percentage of bio- and non-bio-methanol); diesel; and Fischer-Tropsch-liquids (F-T-diesel). Note, the current representation of refineries in the model means that the shares of diesel and gasoline in ICEVs should not be relied upon.
• CNG: compressed natural gas • Methanol, Ethanol: bio-methanol and bio-ethanol; may be used as a blend • Bio-SNG: biogas, i.e., bio-synthetic gas from biomass, produced e.g. by
fermentation of manure or waste, or by gasification of wood • Biofuel (Diesel): biodiesel (FAME), produced e.g. from oil crops or by pyrolysis
from wood; and bio-F-T-diesel, e.g. produced from Bio-SNG • Hydrogen: hydrogen from fossil and from renewable sources • Electricity: Electricity from the electricity grid. In GMM, an electricity demand
from cars is spread equally over time, so night-time charging is supported (with simplification, see Open Issues).

Seite 34
Policy Scenario
• Other surface & aviation: biofuels are not cost-effective, efficiency improvements limited emissions increase in “Tollway”
• Developing world: increase in car-emissions (due to large increase in demand) is partially offset by mid- and long-term efficiency improvements
Well-to-Wheel CO2-Emission(cars by region; scenario "Tollway")
0
1
2
3
4
5
6
7
8
2005
2010
2015
2020
2025
2030
2035
2040
2045
2050
GtC
O2/
y
AviationOther SurfaceAFRICAASIABRAZILCANADACHINAEEURWEURFSUINDIALAMMEAMEXICOPACIFICRUSSIAUSA
WEC/PSI (2011): Global Transport Scenarios 2050