Condition Assessment of Concrete Bridge Decks Using Ground ...
254
Western University Western University Scholarship@Western Scholarship@Western Electronic Thesis and Dissertation Repository 2-26-2018 2:30 PM Condition Assessment of Concrete Bridge Decks Using Ground Condition Assessment of Concrete Bridge Decks Using Ground and Airborne Infrared Thermography and Airborne Infrared Thermography Tarek Omar, The University of Western Ontario Supervisor: Nehdi, Moncef, The University of Western Ontario A thesis submitted in partial fulfillment of the requirements for the Doctor of Philosophy degree in Civil and Environmental Engineering © Tarek Omar 2018 Follow this and additional works at: https://ir.lib.uwo.ca/etd Part of the Civil Engineering Commons, Construction Engineering and Management Commons, Structural Engineering Commons, and the Transportation Engineering Commons Recommended Citation Recommended Citation Omar, Tarek, "Condition Assessment of Concrete Bridge Decks Using Ground and Airborne Infrared Thermography" (2018). Electronic Thesis and Dissertation Repository. 5252. https://ir.lib.uwo.ca/etd/5252 This Dissertation/Thesis is brought to you for free and open access by Scholarship@Western. It has been accepted for inclusion in Electronic Thesis and Dissertation Repository by an authorized administrator of Scholarship@Western. For more information, please contact [email protected].
Transcript of Condition Assessment of Concrete Bridge Decks Using Ground ...

Western University Western University
Scholarship@Western Scholarship@Western
Electronic Thesis and Dissertation Repository
2-26-2018 2:30 PM
Condition Assessment of Concrete Bridge Decks Using Ground Condition Assessment of Concrete Bridge Decks Using Ground
and Airborne Infrared Thermography and Airborne Infrared Thermography
Tarek Omar, The University of Western Ontario
Supervisor: Nehdi, Moncef, The University of Western Ontario
A thesis submitted in partial fulfillment of the requirements for the Doctor of Philosophy degree
in Civil and Environmental Engineering
© Tarek Omar 2018
Follow this and additional works at: https://ir.lib.uwo.ca/etd
Part of the Civil Engineering Commons, Construction Engineering and Management Commons,
Structural Engineering Commons, and the Transportation Engineering Commons
Recommended Citation Recommended Citation Omar, Tarek, "Condition Assessment of Concrete Bridge Decks Using Ground and Airborne Infrared Thermography" (2018). Electronic Thesis and Dissertation Repository. 5252. https://ir.lib.uwo.ca/etd/5252
This Dissertation/Thesis is brought to you for free and open access by Scholarship@Western. It has been accepted for inclusion in Electronic Thesis and Dissertation Repository by an authorized administrator of Scholarship@Western. For more information, please contact [email protected].

i
Abstract
Applications of nondestructive testing (NDT) technologies have shown promise in assessing
the condition of existing concrete bridges. Infrared thermography (IRT) has gradually gained
wider acceptance as a NDT and evaluation tool in the civil engineering field. The high
capability of IRT in detecting subsurface delamination, commercial availability of infrared
cameras, lower cost compared with other technologies, speed of data collection, and remote
sensing are some of the expected benefits of applying this technique in bridge deck inspection
practices. The research conducted in this thesis aims at developing a rational condition
assessment procedure for concrete bridge decks based on IRT technology, and automating its
analysis process in order to add this invaluable technique to the bridge inspector’s tool box.
Ground penetrating radar (GPR) has also been vastly recognized as a NDT technique capable
of evaluating the potential of active corrosion. Therefore, integrating IRT and GPR results in
this research provides more precise assessments of bridge deck conditions. In addition, the
research aims to establish a unique link between NDT technologies and inspector findings by
developing a novel bridge deck condition rating index (BDCI). The proposed system captures
the integrated results of IRT and GPR techniques, along with visual inspection judgements,
thus overcoming the inherent scientific uncertainties of this process. Finally, the research aims
to explore the potential application of unmanned aerial vehicle (UAV) infrared thermography
for detecting hidden defects in concrete bridge decks.
The NDT work in this thesis was conducted on full-scale deteriorated reinforced concrete
bridge decks located in Montreal, Quebec and London, Ontario. The proposed models have
been validated through various case studies. IRT, either from the ground or by utilizing a UAV
with high-resolution thermal infrared imagery, was found to be an appropriate technology for
inspecting and precisely detecting subsurface anomalies in concrete bridge decks. The
proposed analysis produced thermal mosaic maps from individual IR images captured from
motion. The k-means clustering technique was utilized to segment the mosaics and identify
objective thresholds and, hence, to delineate different categories of delamination in the entire
bridge decks. The proposed integration methodology of NDT technologies and visual
inspection results provided more reliable BDCI. The information that was sought to identify

ii
the parameters affecting the integration process was gathered from bridge engineers with
extensive experience and intuition. The analysis process utilized the fuzzy set theory to account
for uncertainties and imprecision in the measurements of bridge deck defects detected by IRT
and GPR testing along with bridge inspector observations.
The developed analysis procedure should stimulate wider acceptance of IRT as a rapid,
systematic and cost-effective evaluation technique for detecting bridge deck delaminations.
The proposed combination of IRT and GPR results should expand their correlative use in
bridge deck inspection. Integrating the proposed BDCI procedure with existing bridge
management systems can provide a detailed and timely picture of bridge health, thus helping
transportation agencies in identifying critical deficiencies at various service life stages.
Consequently, this can yield sizeable reductions in bridge inspection costs, effective allocation
of limited maintenance and repair funds, and promote the safety, mobility, longevity, and
reliability of our highway transportation assets.
Keywords
Concrete bridge decks; deterioration; subsurface delamination; NDT; IRT; GPR; condition
assessment and rating models; threshold classification; segmentation; integration; thermal
mosaic maps; unmanned aerial vehicles; uncertainty; fuzzy modeling.
iii
Co-Authorship
This thesis has been prepared in accordance with the regulations for an Integrated-Article
format thesis stipulated by the Faculty of Graduate Studies at Western University, London,
Ontario, Canada. The in-situ bridge non-destructive testing, data analysis, modeling, and
writing of draft manuscripts for publication were carried out by the candidate under the close
guidance and direct supervision of his thesis advisor, who provided important comments,
helped to refine ideas, and provided recommendations for editing the texts. The role of any
other co-author, if applicable, was to provide general advice or contribute to the final version
of manuscripts. The following publications have been either accepted or submitted to peer-
reviewed technical journals and international conferences:
Refereed Journal Articles:
1. Omar, T., Nehdi, M., and Zayed, T. “Condition Assessment of Reinforced Concrete
Bridges: Current Practice and Research Challenges.” Canadian Journal of Civil
Engineering. (Chapter 2), Submitted.
2. Omar, T., Nehdi, M., and Zayed, T. “Performance of NDT Techniques in Appraising
Condition of Reinforced Concrete Bridge Decks.” J. of Performance of Constructed
Facilities. (Chapter 3), Published, DOI: 10.1061/(ASCE)CF.1943-5509.0001098.
3. Omar, T., Nehdi, M., and Zayed, T. “Infrared Thermography Model for Rational
Condition Assessment of Concrete Bridge Decks.” J. of Construction and Building
Materials. (Chapter 4), Published, DOI: 10.1016/j.conbuildmat.2018.02.126.
4. Omar, T., Nehdi, M., Zayed, T. “Rational Condition Assessment of Reinforced Concrete
Bridge Decks Subjected to Corrosion-Induced Delamination.” J. of Materials in Civil
Engineering. (Chapter 5), Published, DOI: 10.1061/(ASCE)MT.1943-5533.0002114.
5. Omar, T., Nehdi, M., and Zayed, T. “Integrated Condition Rating Model for Reinforced
Concrete Bridge Decks.” J. of Performance of Constructed Facilities. (Chapter 6),
Published, DOI: 10.1061/(ASCE)CF.1943-5509.0001084.

iv
6. Omar, T., and Nehdi, M. “Unmanned Aerial Vehicle Infrared Thermography Remote
Sensing for Condition Assessment of Concrete Bridge Decks.” J. of Automation in
Construction. (Chapter 7), Published, DOI: 10.1016/j.autcon.2017.06.024.
7. Omar, T., and Nehdi, M. (2015). “Data Acquisition Technologies for Construction
Progress Tracking.” J. of Automation in Construction. Published, DOI:
10.1016/j.autcon.2016.06.016.
Conference Proceedings:
1. Omar, T., and Nehdi, M. (2017). “Clustering-Based Threshold Model for Condition
Assessment of Concrete Bridge Decks Using Infrared Thermography.” Chapter. In book:
“Facing the Challenges in Structural Engineering, Sustainable Civil Infrastructures”, pp:
242-253. H. Rodrigues et al. (eds.), Springer International Publishing AG. Switzerland,
Published, DOI: 10.1007/978-3-319-61914-9_19.
2. Omar, T., and Nehdi, M. (2017). “Automated Data Collection for Progress Tracking
Purposes: A Review of Related Techniques." Chapter. In book: “Facing the Challenges in
Structural Engineering, Sustainable Civil Infrastructures”, pp: 391-405. H. Rodrigues et
al. (eds.), Springer International Publishing AG. Switzerland, Published, DOI:
10.1007/978-3-319-61914-9_30
3. Omar, T., and Nehdi, M. (2017). “Thermal Detection of Sub-Surface Defects in Concrete
Bridge Decks Using Unmanned Ariel Vehicle.” Special Publication on Durability of
Concrete Structures Incorporated with conventional and Advanced Materials. Kim et al.
(eds.), American Concrete Institute Publishing. USA. In Press.
4. Omar, T., and Nehdi, M. (2016) “Non-Destructive Testing of Bridge Deck Using Passive
Infrared Thermography and Ground Penetrating Radar.” In Proceedings, Annual
Conference of the Transportation Association of Canada (TAC), Toronto, Ontario, Canada,
Sep 25-28. Published.

v
5. Omar, T., and Nehdi, M. (2016) “Application of Passive Infrared Thermography for the
Detection of Defects in Concrete Bridge Elements.” In Proceedings, Annual Conference
of the Transportation Association of Canada (TAC), Toronto, Ontario, Canada, Sep 25–
28. Published.
6. Omar, T., and Nehdi, M. (2016) “Condition Assessment and Deterioration Prediction
Tools for Concrete Bridges: A New Look.” In Proceedings, Annual Conference of CSCE,
London, Ontario, Canada, June 1-4. Published.
7. Omar, T., and Nehdi, M. (2016) “Evaluation of NDT Techniques for Concrete Bridge
Decks Using Fuzzy Analytical Hierarchy.” In Proceedings, Annual Conference of CSCE,
London, Ontario, Canada, June 1-4. Published.
8. Omar, T., and Nehdi, M. (2015) “Learned Lessons from Adelaide Desalination Project.”
In Proceedings, Annual Conference of CSCE, Regina, Saskatchewan, Canada, May 27–30.
Published.

vi
Acknowledgments
First and foremost, I would like to thank Allah for all his blessings to me. He gave me each
day the power to undertake this work and complete it satisfactorily. I could never have done
this without his blessings, Almighty.
In completion of this thesis, I would like to express my sincere gratitude to my supervisor,
Professor Moncef L. Nehdi, who has been very supportive throughout the completion of this
thesis with his patience, valuable knowledge, feedback and guidance, while providing me
flexibility to work in my own way. Thank you for your confidence in me and giving me the
chance to develop my skills as an independent researcher. I am immensely grateful for studying
under your precious guidance throughout this research.
I would also like to express my deepest appreciation and gratitude to Professor Tarek Zayed,
Concordia University. He has helped the progression of my research by providing new ideas
and constructive suggestions over the years. His curiosity in this research project made me
think about different aspects of the research outcome. Thank you for your effective
contributions to my publications. This work could not have been done without your support.
I acknowledge the support of Radex Detection Inc, an industrial consultant, and to its president
Mr. Alex Tarussov for collaborating with Western University to conduct the full-scale bridge
survey. My thanks also go to Dr. Ken Maser, senior principal of Infrasense, an industrial
consultant, for providing the raw data of some bridges in Wisconsin, and for his valuable
advice. The Ministries of Transportation in Ontario and Quebec are acknowledged for their
permissions to survey the bridges in London and Montreal, respectively.
From the depths of my heart, I would like to thank my great parents for their sincere
encouragement and prayers. I would like to thank my faithful wife and my lovely children:
“Abdelrahman and Hebatallah” for all their endless encouragement while I worked on my
thesis. They have made every compromise and sacrifice required throughout this doctoral
journey. Without their love, tremendous support and patience, it would not have been possible
to accomplish my academic goals.

vii
Table of Contents
Abstract ............................................................................................................................... i
Co-Authorship .................................................................................................................. iii
Acknowledgments ............................................................................................................ vi
Table of Contents ............................................................................................................ vii
List of Tables .................................................................................................................. xiii
List of Figures .................................................................................................................. xv
Chapter 1 ........................................................................................................................... 1
Introduction ....................................................................................................................... 1
1.1 Background ............................................................................................................. 1
1.2 Research Motivation ............................................................................................... 4
1.3 Objectives of Thesis ................................................................................................ 5
1.4 Research Methodology and Organization of Thesis ............................................... 6
1.5 Main Contributions ................................................................................................. 9
1.6 References ............................................................................................................. 11
Chapter 2 ......................................................................................................................... 12
Current Practice for Condition Assessment of Reinforced Concrete Bridges .......... 12
2.1 Introduction ........................................................................................................... 12
2.2 Deterioration of Reinforced Concrete Bridges ..................................................... 14
2.2.1 Bridge Performance Indicators ................................................................. 18
2.3 Bridge Condition Assessment Approaches ........................................................... 20
2.3.1 Visual Inspection ...................................................................................... 22
2.3.2 Load Testing ............................................................................................. 24
2.3.3 Structural Health Monitoring .................................................................... 26
2.3.4 Non-Destructive Testing ........................................................................... 30

viii
2.3.5 Finite Element Modelling ......................................................................... 36
2.3.6 Advantages and Limitations ..................................................................... 37
2.4 Bridge Deterioration Prediction Tools .................................................................. 39
2.4.1 Deterministic Models ................................................................................ 39
2.4.2 Stochastic Models ..................................................................................... 40
2.4.3 Mechanistic Models .................................................................................. 42
2.4.4 Advantages and Limitations ..................................................................... 43
2.5 Bridge Condition Assessment and Artificial Intelligence .................................... 44
2.5.1 Artificial Neural Networks ....................................................................... 44
2.5.2 Fuzzy Set Theory ...................................................................................... 46
2.5.3 Evidential Reasoning ................................................................................ 48
2.5.4 Advantages and Limitations ..................................................................... 49
2.6 Challenges Requiring Further Research ............................................................... 51
2.6.1 Selection of Appropriate Condition Assessment Technique .................... 53
2.7 Conclusions ........................................................................................................... 54
2.8 References ............................................................................................................. 55
Chapter 3 ......................................................................................................................... 64
Performance of NDT Techniques in Appraising Condition of Reinforced Concrete
Bridge Decks .................................................................................................................... 64
3.1 Introduction ........................................................................................................... 64
3.2 Model Development.............................................................................................. 66
3.2.1 Selection of the Performance Measures .................................................... 66
3.2.2 Selection of the NDT Alternatives ............................................................ 68
3.2.3 Construction of Fuzzy Analytical Hierarchy Model ................................. 69
3.2.4 Data Collection ......................................................................................... 71
3.2.5 Data Analysis ............................................................................................ 75

ix
3.3 Model Implementation .......................................................................................... 79
3.4 Evaluation and Ranking of NDT Techniques ....................................................... 82
3.4.1 Weights of Main Performance Measures .................................................. 83
3.4.2 Overall Ranking of NDT Techniques ....................................................... 88
3.5 Validation of Model Results ................................................................................. 90
3.6 Evaluation of the Proposed Model ........................................................................ 93
3.7 Conclusions ........................................................................................................... 95
3.8 References ............................................................................................................. 96
Chapter 4 ......................................................................................................................... 99
Infrared Thermography Model for Rational Condition Assessment of Reinforced
Concrete Bridge Decks ................................................................................................... 99
4.1 Introduction ........................................................................................................... 99
4.2 Infrared Thermography Technology ................................................................... 101
4.2.1 Basic Principles of IRT ........................................................................... 101
4.2.2 Infrared Cameras ..................................................................................... 105
4.2.3 Application of IRT for Concrete Bridge Inspection ............................... 107
4.2.4 Interpretation of Passive IRT Data ......................................................... 109
4.3 Un-Supervised Machine Learning ...................................................................... 111
4.3.1 k-Means Clustering ................................................................................. 112
4.4 IRT Model Development .................................................................................... 113
4.4.1 Data Collection ....................................................................................... 114
4.4.2 Image Pre-Processing.............................................................................. 117
4.4.3 Image Registration .................................................................................. 118
4.4.4 Image Segmentation................................................................................ 121
4.4.5 IRT Condition Mapping .......................................................................... 124
4.5 IRT Model Implementation ................................................................................ 124

x
4.5.1 Bridge (A) ............................................................................................... 127
4.5.2 Bridge (B) ............................................................................................... 129
4.5.3 Bridge C .................................................................................................. 130
4.6 Evaluation of the Proposed IRT Model .............................................................. 131
4.7 Validation of IRT Model Results ........................................................................ 133
4.7.1 Hammer Sounding Test Results.............................................................. 133
4.7.2 GPR Test Results .................................................................................... 135
4.8 Further Research to Improve the Proposed IRT Analysis .................................. 138
4.9 Conclusions ......................................................................................................... 139
4.10 References ........................................................................................................... 140
Chapter 5 ....................................................................................................................... 143
Condition Assessment of Reinforced Concrete Bridge Decks Using Infrared
Thermography and Ground Penetrating Radar ........................................................ 143
5.1 Introduction ......................................................................................................... 143
5.2 Ground Penetrating Radar (GPR) ....................................................................... 145
5.2.1 Basic Principle of GPR ........................................................................... 145
5.2.2 Application of GPR for Concrete Bridge Inspection .............................. 147
5.2.3 Interpretation of GPR Scan Data ............................................................ 148
5.3 IRT/GPR Model Development ........................................................................... 150
5.3.1 Data Collection ....................................................................................... 150
5.3.2 Data Analysis .......................................................................................... 152
5.3.3 Deterioration Condition Maps ................................................................ 154
5.4 IRT/GPR Model Implementation on a Second Case Study ................................ 158
5.5 Evaluation of the Proposed IRT/GPR Model ..................................................... 161
5.6 Conclusions ......................................................................................................... 165
5.7 References ........................................................................................................... 166

xi
Chapter 6 ....................................................................................................................... 168
Integrated Condition Rating Model for Reinforced Concrete Bridge Decks Using
NDT and Visual Inspection .......................................................................................... 168
6.1 Introduction ......................................................................................................... 168
6.2 Existing Bridge Condition Rating Systems ........................................................ 170
6.2.1 Bridge Condition Rating Systems in Canada.......................................... 172
6.2.2 Bridge Condition Assessment Using IRT and GPR ............................... 172
6.3 Fuzzy Bridge Deck Condition Rating Model Development ............................... 173
6.3.1 Fuzzy Synthetic Evaluation (FSE) .......................................................... 173
6.3.2 Weighted Fuzzy Union (WFU) Operation .............................................. 179
6.4 Bridge Deck Condition Rating Model Implementation ...................................... 183
6.4.1 Data Collection and Analysis.................................................................. 183
6.4.2 Developing BDCI of Bridge Deck .......................................................... 184
6.5 Evaluation of the Proposed BDCI Model ........................................................... 186
6.6 Conclusions ......................................................................................................... 188
6.7 References ........................................................................................................... 189
Chapter 7 ....................................................................................................................... 191
Remote Sensing of Reinforced Concrete Bridge Decks Using Unmanned Aerial
Vehicle Infrared Thermography ................................................................................. 191
7.1 Introduction ......................................................................................................... 191
7.2 Unmanned Aerial Vehicle (UAV) ...................................................................... 193
7.2.1 Basic Principle of UAV .......................................................................... 193
7.2.2 UAV Applications in Civil Engineering ................................................. 194
7.2.3 Successful Application of UAV-IRT System ......................................... 195
7.3 UAV/IRT Model Development .......................................................................... 196
7.3.1 Planning and Preparation Phase .............................................................. 197
7.3.2 Data Acquisition Phase ........................................................................... 200

xii
7.3.3 Data Analysis Phase ................................................................................ 201
7.4 Validation of UAV/IRT Model Results .............................................................. 206
7.4.1 Hammer Sounding Test Results.............................................................. 206
7.4.2 Half-Cell Potential Test Results.............................................................. 207
7.5 Evaluation of the Proposed UAV/IRT Model .................................................... 210
7.6 Further Research to Improve the Proposed System ............................................ 211
7.7 Conclusions ......................................................................................................... 212
7.8 References ........................................................................................................... 213
Chapter 8 ....................................................................................................................... 215
Summary, Conclusions and Recommendations ......................................................... 215
8.1 Summary and Conclusions ................................................................................. 215
8.2 Recommendations for Future Research .............................................................. 217
Appendix A (Questionnaire Survey) ........................................................................... 220
Appendix B (Copyright Permissions)………………………………………………. 224
CURRICULUM VITAE ............................................................................................... 232

xiii
List of Tables
Table 2-1: Common defects in reinforced concrete bridges ................................................... 16
Table 2-2: Evaluation techniques for RC bridge performance indicators and the related
references ................................................................................................................................ 20
Table 2-3: Requirements of different assessment phases of existing bridges ........................ 21
Table 2-4: Summary of common structural health monitoring systems of bridges ................ 27
Table 2-5: Common NDT methods used to evaluate concrete bridge decks .......................... 33
Table 2-6: Studies utilized combined NDT techniques approach to evaluate bridges ........... 35
Table 2-7: Comparison of condition assessment techniques for RC bridges ......................... 38
Table 2-8: Comparison of deterioration model techniques for concrete bridges .................... 44
Table 2-9: Comparison of AI techniques for concrete bridges evaluation ............................. 50
Table 2-10: Appropriate investigation methods for some deterioration mechanisms in RC
bridges ..................................................................................................................................... 53
Table 3-1: Applicable NDT methods to detect specific deterioration types ........................... 68
Table 3-2: Organization and experience of participants in the survey questionnaire ............. 73
Table 3-3: Results of respondents using NDT techniques ...................................................... 73
Table 3-4: Linguistic comparison scales for importance ........................................................ 75
Table 3-5: Pairwise comparison matrix of main performance parameters with respect to the
selection of NDT technique .................................................................................................... 80
Table 3-6: Performance measures weights and ranking of NDT techniques .......................... 82
Table 3-7: Comparative studies which utilized several NDT techniques on RC bridge decks
................................................................................................................................................. 92

xiv
Table 4-1: Features and specifications of the utilized thermal camera ................................. 114
Table 4-2: Environmental conditions during IR surveys of Montreal bridge ....................... 116
Table 4-3: Features and specifications of the utilized thermal camera ................................. 127
Table 4-4: Environmental conditions during IR surveys of Wisconsin bridges ................... 127
Table 4-5: Percentage of defective areas in the investigated bridges ................................... 138
Table 5-1: Features and specifications of the utilized GPR equipment ................................ 152
Table 5-2: Percentage of defective areas in the analyzed bridge decks ................................ 163
Table 6-1: Example for a fuzzy pairwise comparison matrix of a participated expert ......... 177
Table 6-2: Final weights of bridge deck defects investigated in this study .......................... 177
Table 6-3: Experts’ replies for boundaries identification of the condition categories .......... 180
Table 6-4: Summary of severity and extent of defects in the inspected Montreal’s bridge deck
............................................................................................................................................... 184
Table 6-5: Recommended actions for the proposed BDCI in this study .............................. 187
Table 7-1: Features and specifications of the utilized camera (FLIR Vue Pro) .................... 197
Table 7-2: Features and specifications of the utilized UAV (Inspire 1 Pro) ......................... 198
Table 7-3: Statistical analysis for the influence of IR threshold on the identified defective
areas ...................................................................................................................................... 205
Table 7-4: Percentage of defective areas in the analyzed two bridge decks ......................... 207

xv
List of Figures
Figure 1-1: Basic components of a BMS. ................................................................................. 2
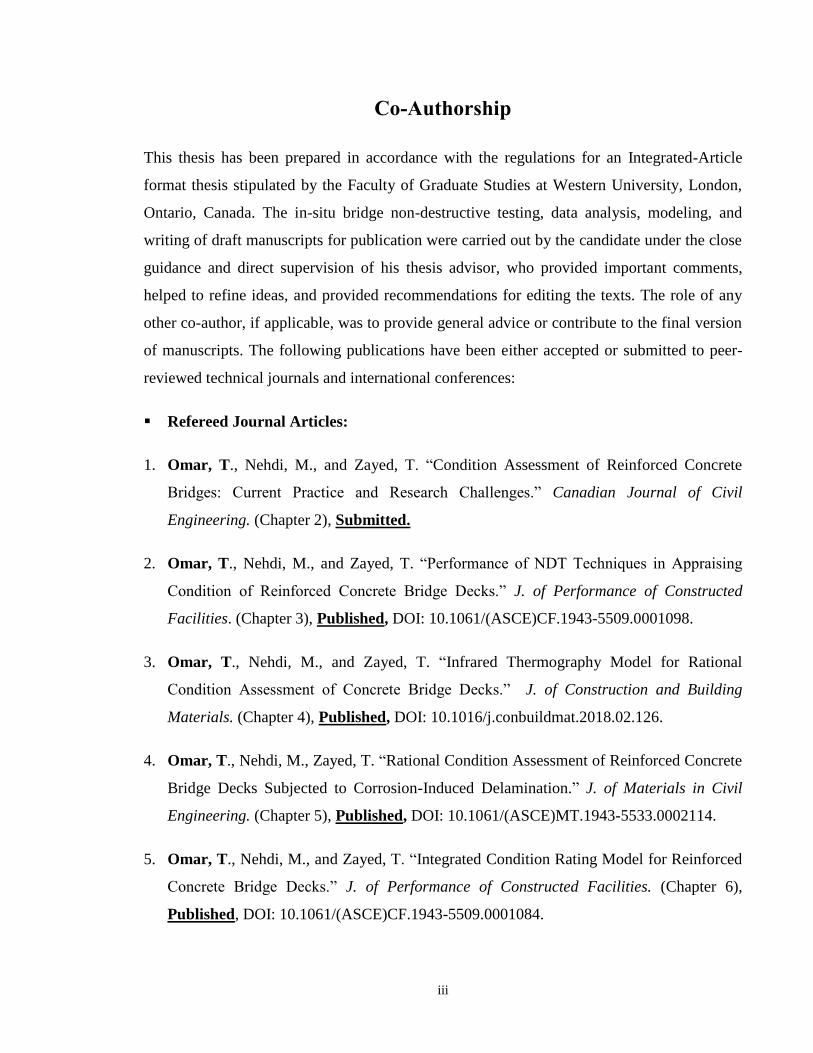
Figure 1-2: Schematic diagram of research methodology. ....................................................... 9
Figure 2-1: Methodological framework for literature review of BCA technologies. ............. 13
Figure 2-2: Corrosion-induced delamination and spalling in concrete bridge decks (Gucunski
et al., 2013). ............................................................................................................................ 17
Figure 2-3: Condition assessment mechanisms of reinforced concrete bridges. .................... 22
Figure 2-4: Visual inspection of concrete bridge decks and soffits (Gucunski et al., 2013). . 23
Figure 2-5: Non-destructive testing techniques for reinforced concrete bridges. ................... 30
Figure 2-6: Deterioration prediction models techniques. ....................................................... 39
Figure 2-7: Structure of an artificial neural network. ............................................................. 45
Figure 2-8: Basic configuration of fuzzy system with fuzzifier and defuzzifier (Senouci et al.,
2014, with permission from ASCE)........................................................................................ 47
Figure 2-9: Conceptual framework to identify challenges that require further research in
bridge condition assessment. .................................................................................................. 52
Figure 3-1: Methodology adopted for apprising and ranking NDT techniques. ..................... 66
Figure 3-2: Hierarchy framework for ranking NDT techniques. ............................................ 70
Figure 3-3: Snapshot of a question in the survey questionnaire. ............................................ 74
Figure 3-4: A triangular fuzzy number M. .............................................................................. 76
Figure 3-5: Weights and consistency index of the comparison matrix in Table 3-5. ............. 81
Figure 3-6: Evaluation of NDT technologies with respect to their capability of specific defect
detection. ................................................................................................................................. 84

xvi
Figure 3-7: Evaluation of NDT technologies with respect to their speed............................... 85
Figure 3-8: Evaluation of NDT technologies with respect to their simplicity. . ..................... 86
Figure 3-9: Evaluation of NDT technologies with respect to their accuracy. ........................ 87
Figure 3-10: Evaluation of NDT technologies with respect to their cost. .............................. 88
Figure 3-11: Overall evaluation of NDT technologies with respect to the main performance
criteria. .................................................................................................................................... 89
Figure 4-1: Methodology adopted in developing IRT model to detect and classify subsurface
delamination in RC bridge decks. ......................................................................................... 100
Figure 4-2: Infrared region in the electromagnetic spectrum (FLIR Guidebook). ............... 101
Figure 4-3: General configuration of a typical IR camera (FLIR Guidebook). .................... 105
Figure 4-4: Infrared energy emitted from concrete bridge deck during day and night. ........ 108
Figure 4-5: Illustration of the selected concrete bridge located in Montreal, Quebec. ......... 113
Figure 4-6: Illustration of the FLIR T650sc IR camera and vehicle mounted setup system
utilized to survey Montreal bridge. ....................................................................................... 115
Figure 4-7: Delamination at (a) daytime; and (b) nighttime surveys.................................... 117
Figure 4-8: Developed algorithm for condition assessment of concrete bridge decks. ........ 118
Figure 4-9: Flowchart for determining number of condition categories (k). ........................ 123
Figure 4-10: Condition map of the daytime IRT survey of bridge deck in Montreal indicating
the severity of the identified delaminated areas. ................................................................... 125
Figure 4-11: Condition map of the nighttime IRT survey of bridge deck in Montreal
indicating the severity of the identified delaminated areas. .................................................. 125
Figure 4-12: Thermal and digital images of potential delaminated areas in the bridge soffit.
............................................................................................................................................... 126

xvii
Figure 4-13: Condition map of bridge (A) indicating the identified delaminated areas using
the developed IRT system. .................................................................................................... 128
Figure 4-14: Condition map of bridge (A) indicating the identified delaminated area as per
the record of MOT, Wisconsin (Omar et al., 2018). ............................................................. 128
Figure 4-15: Condition map of bridge (B) indicating the identified delaminated areas using
the developed IRT system. .................................................................................................... 129
Figure 4-16: Condition map of bridge (B) indicating the identified delaminated area as per
the record of MOT, Wisconsin (Omar et al., 2018). ............................................................. 130
Figure 4-17: Condition map of bridge (C) indicating the severity of the identified
delaminated areas using the developed IRT system. ............................................................ 131
Figure 4-18: Condition map indicating the severity of corrosion for the surveyed bridge deck
in Montreal (Omar et al., 2018). ........................................................................................... 136
Figure 4-19: Corrosion map of bridge C as per the record of Wisconsin DOT (Omar et al.,
2018). .................................................................................................................................... 136
Figure 5-1: Methodology adopted to evaluate RC bridge deck condition using the integration
of IRT and GPR testing results. ............................................................................................ 145
Figure 5-2: Illustration of GPR travel paths and the utilized data acquisition unit. ............. 151
Figure 5-3: Picking top reinforcing bars in a B-scan profile. ............................................... 153
Figure 5-4: IRT condition map of Montreal’s bridge deck indicating different severity levels
of delaminations. ................................................................................................................... 155
Figure 5-5: GPR condition map of Montreal’s bridge deck indicating different severity levels
of potential active corrosion.................................................................................................. 156
Figure 5-6: GPR corrosion map of Montreal’s bridge deck as per the record of MOT, Quebec
(Omar et al., 2018) ................................................................................................................ 156

xviii
Figure 5-7: Integrated condition map of Montreal’s bridge deck based on the IRT and GPR
results. ................................................................................................................................... 158
Figure 5-8: IRT condition map of Wisconsin’s bridge deck indicating different severity levels
of delaminations. ................................................................................................................... 159
Figure 5-9: GPR condition map of Wisconsin’s bridge deck indicating different severity
levels of potential active corrosion. ...................................................................................... 160
Figure 5-10: GPR corrosion map of Wisconsin’s bridge deck as per the record of Wisconsin
DOT (Omar et al., 2018). ...................................................................................................... 160
Figure 5-11: Integrated condition map of Wisconsin’s bridge deck based on the IRT and GPR
results. ................................................................................................................................... 161
Figure 6-1: Methodology of model development adopted in this study. .............................. 170
Figure 6-2: Condition category’s map utilized for the construction of defects’ membership
functions (Omar et al., 2017). ............................................................................................... 174
Figure 6-3: Triangular fuzzy membership functions for various severity of bridge deck’s
defects. .................................................................................................................................. 175
Figure 6-4: Common bridge deck defects and related investigation techniques utilized in this
study. ..................................................................................................................................... 176
Figure 6-5: Conception of the proposed bridge deck condition index (BDCI). ................... 179
Figure 6-6: Histogram and normal distribution curve of k₁, k₂, and k₃. ................................ 180
Figure 6-7: Boundaries of condition categories membership functions using linear regression
method................................................................................................................................... 181
Figure 6-8: Condition categories membership functions based on k₁, k₂, and k₃. ................ 181
Figure 6-9: Aggregated condition categories of Montreal’s bridge deck based on defects
measured using different techniques. .................................................................................... 185

xix
Figure 6-10: Condition rating index of Montreal’s bridge deck based on the proposed model
in this study. .......................................................................................................................... 185
Figure 7-1: UAV-borne thermal survey methodology adopted in this study. ...................... 193
Figure 7-2: Illustration of the surveyed concrete bridge (A) and an overview of the deck
surface condition. .................................................................................................................. 196
Figure 7-3: Illustration of the UAV-borne thermal system utilized to scan two RC bridge
decks. .................................................................................................................................... 199
Figure 7-4: Snapshot of the UAV during the flight to scan bridge (A) and a captured thermal
image indicating potential delaminated areas. ...................................................................... 201
Figure 7-5: Condition map of bridge (A) indicating the severity of the identified delaminated
areas for the bridge deck and curbs using UAV-borne thermal imagery system. ................ 203
Figure 7-6: Condition map of bridge (B) indicating the severity of the identified delaminated
areas for the bridge deck and curbs using UAV-borne thermal imagery system. ................ 204
Figure 7-7: Condition map of bridge deck (A) indicating the potential corrosion readings for
the bridge deck and curbs using HCP testing (Omar and Nehdi, 2017). .............................. 208
Figure 7-8: Condition map of bridge deck (B) indicating the potential corrosion readings for
the bridge deck and curbs using HCP testing (Omar and Nehdi, 2017). .............................. 209

1
Chapter 1
1. Introduction
1.1 Background
Bridges represent critical infrastructure components within the transportation network. The
average age of bridges keeps going up and many are approaching the end of their design
lives. Structural problems created by corrosion, aggressive environments, material defects,
construction defaults, and unforeseen mechanical or seismic loads can compromise the
serviceability and safety of bridges. According to the Canadian infrastructure report card
(2016), 26% of bridges are in fair, poor or very poor condition and $50 billion needs to be
invested in their replacement and maintenance, spending $2 billion for bridges in poor and
(or) very poor condition, $11 billion for bridges in fair condition, and $37 billion for
bridges in good condition. Likewise, about 40% of the bridges in the USA are 50 years or
older, with 25% either structurally deficient or functionally obsolete. The most recent
estimate as per the United States’ 2017 infrastructure report card indicates that the backlog
of bridge rehabilitation needs $123 billion.
The importance of an effective bridge management system (BMS) cannot be overstated,
especially in light of recent collapses of bridges in North America and elsewhere. Bridge
failures can be catastrophic, both in terms of human life and economic loss, rendering the
task of managing this important asset a complex endeavour that attracts growing attention.
The basic components of a BMS are illustrated in Fig. 1-1. The architecture of a typical
BMS consists of a database, a condition assessment module, a structural assessment
module, a deterioration prediction module, a lifecycle cost module, and a maintenance
optimization module. The database stores the bridge inventory and appraisal data. The
condition assessment module evaluates the existing health condition of the bridge. The
structural assessment module determines the bridge load carrying capacity. The
deterioration prediction module estimates the future condition of bridge components. The
life-cycle cost module calculates agency and user costs for various maintenance
alternatives. The optimization module determines the most cost-effective maintenance
strategies (Hammad et al., 2007). Therefore, reliable bridge condition assessment has

2
become vital to predicting future performance and optimizing bridge maintenance,
rehabilitation and replacement needs and to mitigating socio-economic impacts associated
with bridge failures.
Figure 1-1: Basic components of a BMS.
Among all bridge components, the performance of bridge decks was identified as the most
important long-term bridge performance issue (Gucunski et al., 2015). While visual
inspection is the default bridge deck inspection methodology, it cannot yet detect
subsurface flaws such as voids, internal cracks, delamination, or reinforcing steel
corrosion. Therefore, there has been growing interest among bridge infrastructure
stakeholders in using non-destructive testing (NDT) methods for inspecting and evaluating
the condition of bridge decks. Such techniques enable the detection of deterioration
processes at their early stages and can be incorporated into the inspection process to
provide fast and reliable information about the “under-the-surface” deteriorated conditions.
However, NDT techniques have not been widely accepted, either due to unrealistic
expectations or improper use (Gucunski et al., 2013). Indeed, most related research efforts
still aim at verifying the capability, or comparing the accuracy, of NDT methods in
assessing subsurface conditions (Lounis, 2013).

3
Infrared thermography (IRT) is a remote sensing technology that allows for rapid bridge
inspection and visualization of the data in the form of real-time thermal images. Laboratory
and field studies of IRT technology for concrete slabs indicate that this NDT technique is
capable of detecting subsurface delaminations (Vaghefi et al., 2012). Consequently, it can
help bridge inspectors identify areas of unsound concrete before they turn into spalls, which
could threaten public safety and eventually reduce the load capacity of bridges. With the
advent of newer generations of infrared cameras, IRT is evolving as an accurate, reliable
and cost-effective technique that can yield both qualitative and quantitative indicators of a
bridge deck condition (Washer et al., 2013). The IRT testing can be broadly classified into
two major categories: passive and active. The source of heat is the main difference between
these two methods. Solar energy and ambient temperature changes are the main heat
sources in conducting a passive IRT test, while active IRT involves generating a
temperature gradient using an external source of heat other than the sun (Robert, 1982).
Although successful application of the IRT technique has been demonstrated through a
number of research projects, most of these efforts have aimed either at verifying the
capability of IRT for the detection of subsurface defects in bridge components, or studying
the environmental conditions for successful application of the technology.
For instance, Washer et al. (2009) studied the effect of environmental conditions on the
surface temperature of a concrete block containing subsurface anomalies at different
depths. They found that uninterrupted solar loading and low wind speeds provide a better
contrast on a thermal IR image and, hence, provide optimum conditions for detecting
delaminations in concrete surfaces directly exposed to the sun. High rates of change in
ambient temperature were needed to create thermal contrast for the concrete surfaces where
no solar loading was present. Clark et al. (2003) inspected bridge structures under low
ambient temperature and reported that the thermal contrast between the delaminated and
sound areas could be about 0.2 to 0.3 ⁰C. In addition, several studies have addressed the
effect of delamination depth on thermal contrast during IRT testing. For instance, Manning
and Holt (1982) found that the magnitude of thermal contrast correlates with the depth of
a delamination where shallower delaminations are associated with larger thermal contrasts
than deeper delaminations for the same environmental conditions. However, diurnal
temperature and solar loading effects can vary over the course of a day, with certain time

4
periods having deeper delaminations that present greater contrast than shallower features
(Washer et al., 2013). Maser and Roddis (1990) investigated the effects of variable
delamination thickness under a certain set of environmental variables using a thermal
model. The results revealed that the thickness of the delamination affects the magnitude of
the thermal contrast where increasing the delamination thickness increased the maximum
thermal contrast. In a study conducted by Washer et al. (2009), it was found that the
effective time to perform an IRT test depends on the depth of the delamination. The most
contrast appears on the IR image approximately four hours after sunrise for a 50 mm deep
delamination and seven hours after sunrise for a 75 mm deep delamination.
1.2 Research Motivation
The majority of passive IRT testing performed in previous research studies was based on
testing specimens prepared in the laboratory environment with simulated defects, then
exposing them to solar energy. Hence, several processing algorithms to extract information
were developed based on the temperature of the pre-defined defects’ locations and sizes
with respect to the temperature of the surrounding sound concrete. However, when
conducting passive IRT testing in-situ on full-scale bridges, the defects’ characteristics are
unknown and extracting quantitative measures of subsurface anomalies still relies on the
user interpretation of the images. Such qualitative and subjective analyses are rapid, but do
not warrant rigorous evaluation of the acquired thermal images. In addition, the severity of
delamination is commonly defined based on the pixels associated with temperatures higher
than predefined threshold values that are arbitrarily selected. Such a subjective scheme can
produce inconsistent results. Currently, limited research is available to automate the
thermal detection of subsurface damage: delaminations, internal horizontal cracks or voids
on full-scale concrete bridge decks exposed to harsh environments.
In addition, the majority of existing bridge deck condition rating models have been
developed based solely on data from visual inspection usually used as a basis for bridge
condition assessment. Such models do not take into account the inherent uncertainty
associated with inspection results. Consequently, existing BMSs still have shortcomings,
especially in the collection of inspection data dominated by subjective judgment, and
inaccurate and insufficient quantitative inputs. Indeed, it is critical in bridge condition

5
ratings to combine the results of several technologies to yield different deterioration
mechanisms. For instance, ground penetrating radar (GPR) has been recognized as a
sensing technology capable of evaluating deck thickness, concrete cover and rebar
configuration, and determining the potential for delamination and corrosive environments
in reinforced concrete bridge decks. Currently, there is no bridge condition rating system
that has adequately considered the results of NDT technologies. Therefore, there is an
essential need for developing an objective bridge condition assessment and rating system
based on the integration of commonly employed NDT techniques and taking into
consideration the visual inspection findings.
1.3 Objectives of Thesis
The main goal of this research is to develop a rational and scientific assessment and rating
process for ageing concrete bridge decks that yields: (1) objective detection of subsurface
deficient areas using either ground or aerial IRT technology; and (2) reliable rating index
by integrating the achieved IRT results with other NDT testing results and visual inspection
observations. To achieve this goal, the following tasks have been undertaken:
1. A critical overview of the state-of-the-art condition assessment and rating techniques
for concrete bridges, with emphasis on bridge decks.
2. A comparative analysis to evaluate and rank the most commonly used NDT techniques
for detecting defects in concrete bridge decks.
3. Development of an automated defect detection procedure to extract and classify sub-
surface delaminations in full-scale concrete bridge decks under IRT testing.
4. Development of a procedure for generating an overall condition map for concrete
bridge decks by uniting the analysis results of IRT and GPR testing techniques.
5. Development of an integrated condition rating system for concrete bridge decks
employing IRT, GPR, and visual inspection techniques.
6. Investigation of the feasibility of applying UAV - IRT technology for detecting
subsurface anomalies in concrete bridge decks.

6
1.4 Research Methodology and Organization of Thesis
Although the detailed research methodology of this study will be described in detail in each
chapter, the overall methodology is presented in the schematic diagram shown in Fig. 1-2.
The thesis has been prepared in an “Integrated-Article” format and contains eight chapters.
This chapter, Chapter 1, introduces the overall scope and objectives of the thesis. Then,
the methodology and structure of the thesis are outlined. The subsequent six chapters
present the thesis objectives.
Chapter 2 reviews the state of knowledge on bridge condition assessment approaches.
Bridge performance indicators and the deterioration mechanisms of concrete bridges are
outlined. The strengths, limitations and challenges associated with the application of each
bridge condition assessment technique, are discussed. The application of artificial
intelligence techniques in bridge assessment are examined and appraised. Bridge
deterioration prediction tools are presented and compared. The knowledge gaps for further
research are identified and recommendations towards the selection of appropriate
assessment techniques so as to identify specific deterioration types are formulated.
Chapter 3 presents a comparative analysis of the common NDT methods for detecting
subsurface defects in concrete bridge decks. The NDT techniques are evaluated and ranked
based on a set of flexible multi-attributed performance measures. A fuzzy hierarchical
decision-making model is developed. A structured survey questionnaire was conducted to
acquire an expert knowledge base through soliciting broad information about the
performance of NDT methods which have been implemented by several transportation
agencies. The fuzzy preference programme is utilized and a Matlab optimization function
is modified and adopted to accommodate the analysis process. The results of the developed
model are compared with the findings of a number of previous studies.
Chapter 4 proposes an objective analysis for detecting and classifying delaminations in
concrete bridge decks using passive IRT testing. The basic principles of thermal imaging,
application of IRT for concrete bridge inspection, and current analysis and interpretation
methods of IR image data are presented. A full-scale deteriorated bridge deck was surveyed

7
using an advanced thermal camera. The IRT model is developed through several stages of
image analysis: pre-processing, registration, and segmentation. A machine learning
unsupervised technique is utilized to classify the severity of the detected anomalies. A
framework is developed to determine the number of defect condition categories. The
developed model is implemented on four case studies and the findings are validated
through the results of other testing technologies obtained on the same bridges.
Chapter 5 integrates the results of two NDT techniques to produce an overall bridge deck
condition map, which defines the potential location and severity degree of delamination
and active corrosion. The basic principles of GPR, its application for concrete bridge
inspection, and current analysis and interpretation methods of GPR scan data are presented.
Two full-scale deteriorated bridge decks were surveyed using IR imagery and a GPR data
acquisition unit. The analysis of the captured IRT and GPR data is presented.
Computational equations to integrate the results are formulated as well as a Matlab code.
To validate the proposed integration procedure, the detected defects are quantified and
compared with results on the same bridge decks provided by other technologies.
Chapter 6 establishes a connection between the NDT technologies and the inspector
findings by integrating IRT and GPR results with the findings of the routine visual
inspections to provide a condition rating system of concrete bridge decks. Thus, the system
accounts for both surface and hidden defects in bridge decks. The condition rating systems
currently in use in Canada and the United States are discussed and appraised to highlight
their drawbacks. In-situ inspections on a full-scale deteriorated bridge deck using IRT,
GPR, and visual inspection were conducted. The collected data is analyzed and the detected
defects are quantified and converted into condition categories using fuzzy mathematics.
The inherent uncertainties in the NDT and visual inspection measurement are considered
using the fuzzy synthetic evaluation approach. Interviews with experts having
comprehensive bridge experience were carried out to obtain the degree of relative
importance for defects as well as the boundaries between the defects’ condition categories.
The proposed integration methodology is implemented in a case study and the results are
compared with the evaluation results obtained by employing each individual technology.

8
Chapter 7 investigates the feasibility of using an unmanned aerial vehicle to evaluate the
condition of bridge decks utilizing a high resolution thermal sensor. The principles of aerial
UAV remote sensing technology are discussed. Two in-service concrete bridge decks were
investigated using the proposed system. The planning, flight preparation, and setting up of
the proposed UAV-borne thermal system are discussed. The captured thermal data is
analyzed using the system developed in Chapter 4. The achieved results are validated using
data generated by other NDT technologies on the same bridge decks. Future improvements
for the proposed system are recommended.
Chapter 8 presents the conclusions from this study along with suggestions for further
research work. The background information and the related references are included in each
chapter.
Continue
9
Figure 1-2: Schematic diagram of research methodology.
1.5 Main Contributions
An innovative bridge deck condition assessment and rating system using a passive IRT
technique is proposed in this thesis. The research contributes evidence that supports
expanding the use of IRT as a reliable, safe, and rapid condition assessment tool for
accurate and consistent evaluation of the sub-surface conditions of reinforced concrete
bridge decks. Specific original contributions of this dissertation include:
Developing a rational decision-making methodology to evaluate the performance of
NDT techniques in assessing the conditions of concrete bridge decks. The proposed
model guides the bridge stockholders’ efforts to incorporate NDT techniques into
bridge inspection procedures and can be customized to accommodate different
transportation agency policies.
Developing a robust approach for analyzing IRT data for effective identification of
delaminated areas in full-scale reinforced concrete bridge decks. The proposed analysis
allows for the detection of subsurface anomalies regardless of the difference in the
temperature ranges between various IRT surveys taken at different times and
environmental conditions. The Matlab codes, specially written to develop a stitching

10
algorithm required to create a mosaicked thermogram of the entire bridge deck from a
large number of thermal images, were maintained with several input variables to
accommodate any other thermal survey data, and thus automate the detection process.
In addition, the proposed procedure clearly distinguishes the categories of identified
delaminations and presents the findings in terms of condition maps, which provide a
quantified basis for informed decision making.
Developing a rigorous integration procedure of IRT and GPR analysis results to
produce an overall bridge deck condition map that classifies the severity levels of
detected delaminations and the potential active corrosion areas. Combining the two
technologies in inspecting deteriorated concrete bridge decks maximizes the
capabilities of each method and compensates for their mutual limitations.
Consequently, adopting the proposed approach provides more precise assessments of
bridge deck conditions and important information for decision makers.
Developing an inventive condition rating system that yields both surface and
subsurface condition indicators of bridge deck condition. The condition rating models
currently in use do not account for subjective information in the assessment process
and employ solid linguistic grades that do not take into consideration gradual
transitions from one condition category to another. The fuzzy model proposed herein
for interpreting a new bridge deck condition index (BDCI) from IRT, GPR and visual
inspection techniques is, to the best of the author’s knowledge, the first model that
simultaneously considers the uncertainties in the NDT along with the visual inspection
measurement, thus providing a more reliable rating system. The model could also be
extended to accommodate other bridge components, to involve more defect types, and
to include the results of any other NDT technologies.
Developing a novel UAV-IRT system to evaluate the condition of bridge decks
without any traffic interruption. Only one previous research, to the best of the author’s
knowledge, investigated the application of UAV for in-situ assessment of full-scale
bridge decks. The proposed system offers a practical and rapid solution for frequent
bridge deck inspection and provides quantitative measurements of subsurface defects.

11
1.6 References
ASCE Infrastructure Report Card (2017), https://www.infrastructurereportcard.org/cat-
item/bridges/ [Accessed 21th February, 2017].
Canadian Infrastructure Report Card (2016), https://www.canadainfrastructure.ca.
[Accessed 2nd April, 2016].
Clark, M., McCann, D., and Forde, M. (2003). “Application of infrared thermography to
the non-destructive testing of concrete and masonry bridges.” NDT&E
International, Vol. 36 (4), 265-275.
Gucunski, N., Kee, S., La, H., Basily, B., Maher, A., and Ghasemi, H. (2015).
“Implementation of a Fully Autonomous Platform for Assessment of Concrete
Bridge Decks RABIT.” Proc., Structure Congress, ASCE, Reston, VA, 367-378.
Gucunski, N., Imani, A., Romero, F., Nazarian, S., Yuan, D., Wiggenhauser, H., Shokouhi,
P., Taffe, A., and Kutrubes, D. (2013). “Non-destructive testing to identify concrete
bridge deck deterioration.” Proc., 92nd Annual Meeting, TRB, Washington, D.C.
SHRP 2 Report, 96 p.
Hammad, A., Yan, J., and Mostofi, B. (2007). “Recent Development of Bridge
Management Systems in Canada.” Proc., Annual Conference of the Transportation
Association of Canada, Saskatchewan, 1-20.
Lounis, Z. (2013). “Critical concrete infrastructure: extending the life of Canada’s bridge
network.” Construction Innovation, NRC, Canada. Vol. 18 (1), 34-49.
Manning, D., and Holt, F. (1982). "Detecting Delaminations in Concrete Bridge Decks."
Concrete International, ACI, Vol. 2 (11), 1-8.
Maser, K., and Roddis, W. (1990). "Principles of Thermography and Radar for Bridge
Deck Assessment." Transportation Engineering. Vol. 116 (5), 583-601.
Robert, M. (1982). “Science behind Thermography-Thermal Infrared Sensing for
Diagnostics and Control.” Thermosense, Vol. 371, 2-9.
Vaghefi, K., Oats, R., Harris, D., Ahlborn, T., Brooks, C., Endsley, K., and Dobson, R.
(2012). “Evaluation of commercially available remote sensors for highway bridge
condition assessment.” Bridge Engineering, Vol. 17 (6), 886-895.
Washer, G., Fenwick, R., and Nelson, S. (2013). “Guidelines for the Thermographic
Inspection of Concrete Bridge Components in Shaded Conditions.” Proc., 92nd
Annual Meeting, TRB, Washington, D.C. 1-14.
Washer, G., Fenwick, R., and Harper, J. (2009). “Effects of Environmental Variables on
Infrared Imaging of Subsurface Features in Concrete Bridges.” Transportation
Research Board, Vol. No. 2108, 107-114.

12
Chapter 2
2. Current Practice for Condition Assessment of Reinforced
Concrete Bridges
2.1 Introduction
In view of the colossal backlog of ageing reinforced concrete (RC) bridges and the
considerable challenge it represents for transportation agencies, reliable bridge condition
assessment (BCA) has become essential, especially for creating BMSs required for
maintenance decisions and budget allocation. Visual inspection (VI) is the default bridge
inspection methodology, yet its results heavily depend on the expertise and judgment of
bridge inspectors, yielding primarily qualitative and subjective results. An extensive
literature survey indicates that there is a considerable number of studies on specific
assessment techniques. For instance, there has been significant focus in using non-
destructive testing (NDT) technologies for detecting several deterioration indicators. NDT
enables the detection of deterioration processes at their early stages and can be incorporated
into the inspection process to evaluate hidden defects such as reinforcing steel corrosion or
crack propagation. However, the use of NDT techniques is usually specified for special
assessment when severe deficiencies are observed. The term “structural health monitoring”
(SHM) encompasses a range of methods and practices designed to assess the condition of
a structure based on a combination of measurement, modelling and analysis. However,
SHM technology has not been widely adopted as a routine approach for bridge monitoring.
In addition, artificial intelligence (AI) techniques deal with intelligent behaviour, learning
and adaptation in machines and have been recognized as powerful tools for BCA.
Consequently, BCA techniques are evolving rapidly and have reached a certain level of
maturity. Therefore, it is important to understand how the assessment techniques, as they
pertain to decision-making, have evolved and what is their present state.
In this Chapter, a critical overview of the state of existing BCA, with emphasis on current
practices in North America, is presented in a systematic and rigorous manner to determine
prospects for improvement. Throughout the chapter sections, the recent research efforts on
the available techniques are delineated. The versatility of their potential applications is

13
discussed and they are compared, highlighting their primary advantages and limitations.
The challenges associated with the application of each technique are identified. The AI
techniques commonly utilized to develop effective BCA models are also examined and
appraised. To assist bridge owners in making informed decisions, this review suggests
some recommendations towards the selection of appropriate assessment techniques so as
to identify specific deterioration types in order to meet desired service goals. Furthermore,
knowledge gaps and needs in this field are outlined in order to motivate further research
and development of these technologies, which have been addressed in the present thesis.
The methodology adopted to achieve the aforementioned objectives is as follows: (1)
developing a structured framework for conducting a comprehensive literature review on
BCA based on the vast number of papers published; (2) using this framework to gain an
understanding of the current state of the BCA research field; and (3) developing a
conceptual framework identifying areas of concern with regard to BCA techniques. Figure
2-1 illustrates the developed methodological framework for implementing the review.
Figure 2-1: Methodological framework for literature review of BCA technologies.

14
It can be observed in this figure that the review consists of two phases in which the first
phase is the search for and selection of papers to include in the review and the second phase
is the classification of the papers. The first phase started by collecting a comprehensive
range of recent research on BCA. The articles were carefully selected from eight diverse
academic journals within the domain of bridge construction and management in an attempt
to capture recent and relevant developments. Leading research conferences on the topic
were also considered in a similar manner. The articles were searched using key phrases,
such as “RC bridge assessment” and “RC bridge evaluation”. This process initially
identified 197 papers. The retrieved articles were further examined to extract their main
findings and emphases. Articles whose primary focus was not based on quantitative
evaluation were discarded. Accordingly, the final survey qualitatively aggregates the
results of a selected set consisting of 158 research studies, among which 70% were
published over the last five years. The second phase started by overviewing the common
deterioration mechanisms and common defects occurring in concrete bridges as well as
exploring the performance indicators of RC bridges. The BCA techniques were then
classified into categories and each article was evaluated so as to be placed into the relevant
category. The techniques of each category were discussed to identify their key application
areas, principal strengths and limitations. The existing deterioration prediction models
were appraised and the achievements of AI technologies in the field of BCA were
evaluated. Finally, a conceptual framework was developed to address the challenges and
technology gap that need further research and development and to formulate
recommendations for the selection of appropriate technologies.
2.2 Deterioration of Reinforced Concrete Bridges
RC bridges are susceptible to various deterioration mechanisms. The distinction among
their major causes is purely qualitative since such mechanisms can act in synergy.
However, RC bridge deterioration mechanisms can be categorized as physical, chemical,
mechanical, and biological processes. Physically-induced deteriorations are caused by
factors such as freeze-thaw cycling, crystallization of salts in pores, non-uniform volume
changes, temperature gradients, abrasion, erosion and cavitation from water flow.
Chemically-induced deteriorations occur because of carbonation, chloride contamination,

15
sulfate and acid attacks, or alkali-aggregate reactions (Delatte, 2009). Mechanically-
induced deteriorations are generally caused by static and/or dynamic loads, or construction
faults such as those from premature loading during construction. Biologically-induced
deteriorations, such as fungi, moss, and microbials, can cause internal or external concrete
damage through physical and chemical interactions (Penttala, 2009). Different
deterioration processes lead to different types of defects and will have different effects on
the ability of the evaluation techniques to detect and characterize them (Gucunski and
Nazarian, 2010).
Damage mechanisms can primarily affect the steel reinforcement or the concrete itself.
Corrosion of the reinforcing steel often constitutes the primary deterioration mechanism
and major concern for RC bridges and can lead to structural and functional failures. The
reinforcing steel becomes susceptible to corrosion when the ingress of chloride ions
exceeds a threshold concentration level, which is dependent on factors such as the quality
of concrete, relative humidity, temperature and pH of the pore solution. In addition,
carbonation of the concrete resulting from the reaction between carbon dioxide and other
alkaline constituents of the cement paste reduces the alkalinity of the concrete. Thus, the
steel can be de-passivated. As the steel corrodes, rust occupied areas increase in volume,
creating internal tensile stresses in the surrounding concrete. Cracking in the concrete
surrounding the steel rebar is initiated when such tensile stresses exceed the tensile strength
of the concrete. Cracking accelerates the damage mechanisms by providing easy access for
chlorides, oxygen and moisture, resulting in subsurface fracture planes (delaminations),
which may be localized at the level of steel reinforcement or can extend over a substantial
area along different planes beneath the concrete surface (Penttala, 2009). As the
deterioration progresses, these fracture planes may become separated from the main
structural component, resulting in spalling of the concrete surfaces, which further exposes
the embedded steel to the corrosive environment, thus accelerating deterioration, and
possibly compromising the bridge’s structural integrity, safety and serviceability.
However, the common defects occurring in concrete bridges and their possible causes are
briefly described in Table 2-1. Such defects represent the main challenge in concrete
bridge inspection and repair programmes.

16
Table 2-1: Common defects in reinforced concrete bridges
Defect Description and Reason
Cracking
Description: partly or completely linear fracture. Classification:
geometrically (hairline, narrow, medium and wide) or structurally (shear,
and flexural cracks).
Reason: tensile and compressive stresses, shrinkage and expansion,
internal or external restraint, differential movements and settlements, rebar
corrosion.
Scaling Description: local flaking, or loss of surface portions of concrete.
Reason: de-icing chemicals, freeze-thaw cycles, high permeability, non-
air entrained, poor concrete consolidation, physical salt attack.
Disintegration
Description: starts in the form of scaling and progression of severe scaling
results in breaking down of concrete into small fragments or particles.
Reason: de-icing chemicals, strong alkalies, sulphate or chloride attack,
and/or frost action.
Abrasion
Description: as the outer paste of concrete wears, the fine and coarse
aggregate are exposed and abrasion and impact will cause additional
degradation that is related to aggregate-to-paste bond strength.
Reason: inability to resist wear caused by rubbing and friction, and wind-
borne particles.
Corrosion
Description: deterioration of steel bars by electrolysis. Starts with light
rust stain on concrete surface, localized pitting, very heavy rusting, and
loss of steel section.
Reason: ingress of chloride ions, use of de-icing salts, carbonation, using
high w/c ratio, wetting-drying cycles, lack of curing, low thickness of
concrete cover.
Delamination
Description: partial separation areas of the concrete cover at or near the
external layer of steel bars where concrete subsequently separates, but not
entirely detaches.
Reason: substantial and advanced corrosion in the top steel bars, which
swell and develop internal stress, leading to de-ponding between concrete
and steel bars.
Spalling
Description: fragment detached from a larger concrete mass. Common on
exposed concrete edges, deck joints or construction joints.
Reason: pressure exerted by corrosion, areas of localized high
compressive load concentrations, or by the formation of ice in the
delaminated areas.
Cavitation
Description: irregular concrete surface presented as small holes and pits.
Reason: abrupt change in direction of high-velocity flowing water creates
cavities at the concrete surface. When vapor cavities collapse, causing very
high instantaneous pressures that impact on the concrete surfaces, causing
pitting, noise, and vibration.

17
Scour
Description: the removal of material from the stream bed or bank due to
the erosive action of moving water in the stream. Measured as the average
depth below the original stream bed.
Reason: general scour is caused by the constriction to the natural flow
created by the structure, while local scour is caused by an obstruction to
the flow by a pier or an abutment.
Alkali-
Aggregate
Reaction
Description: expansion occurs under moist conditions, leading to
cracking and deterioration of concrete. Has two forms: alkali-silica
reaction (ASR) and alkali-carbonate reaction (ACR). ASR is more
common than ACR, but ACR tends to be more rapid and severe.
Reason (ASR): some aggregates react adversely with alkalis in concrete
to produce a highly expansive gel causing expansion and cracking usually
over a period of years,
The formation of corrosion-induced delamination and spalling in concrete bridge decks is
shown in Fig. 2-2. Such a deterioration mechanism has been a serious concern for
transportation agencies due to the related serviceability and safety considerations.
Figure 2-2: Corrosion-induced delamination and spalling in concrete bridge decks
(Gucunski et al., 2013).

18
2.2.1 Bridge Performance Indicators
Bridge performance indicators include scour assessment, fatigue and fracture assessment,
seismic assessment, and condition assessment, including load carrying capacity.
2.2.1.1 Scour Assessment
For a majority of RC bridges spanning watercourses or located in flood plains, failures are
attributed to scour damage, which is difficult to detect in real time. Scour is a common soil-
structure interaction problem that can occur in three main forms, namely, general scour,
contraction scour and local scour. Scour reduces the stiffness of foundation systems and
can cause bridge piers to fail without warning. Continuous changes in climate and the
increasing frequency of flooding has led to a higher risk of such bridge failures. Several
studies investigated scour mechanism and how to predict its depth (e.g. Jannaty et al., 2016;
Amini et al., 2014), and various types of instrumentation (e.g. tiltmeters and
accelerometers) have been developed to measure bridge response to scour. However, most
monitoring regimes are based on underwater instrumentation that requires expensive
installation and maintenance, and can often be subjected to damage during times of
flooding, when scour risk is at its highest. Consequently, appropriate preventive measures
are difficult to apply when scour damage is detected. Therefore, scour monitoring is an
important topic for transportation owners, especially during high-flood events and in
coastal areas. Currently, there are research efforts investigating scour monitoring using
changes in bridge structural dynamic properties to indicate the existence and severity of
the scour phenomenon affecting the bridge. Further details on scour assessment and
monitoring systems are reported in Prendergast and Gavin, (2014).
2.2.1.2 Fatigue and Fracture Assessment
Fatigue failure can occur in RC bridges when they are exposed to repetitive loading. Micro-
cracks in concrete commonly develop at the aggregate-cement paste transition zone due to
different thermal and shrinkage deformations. Repetitive loading extends the length and
size of the micro-cracks exacerbating stress concentration, which can lead to a fatigue
failure depending on the bridge’s geometry, material properties and applied loads. The
loads could be caused by short-term traffic, variable long-term loads and wind. Generally,
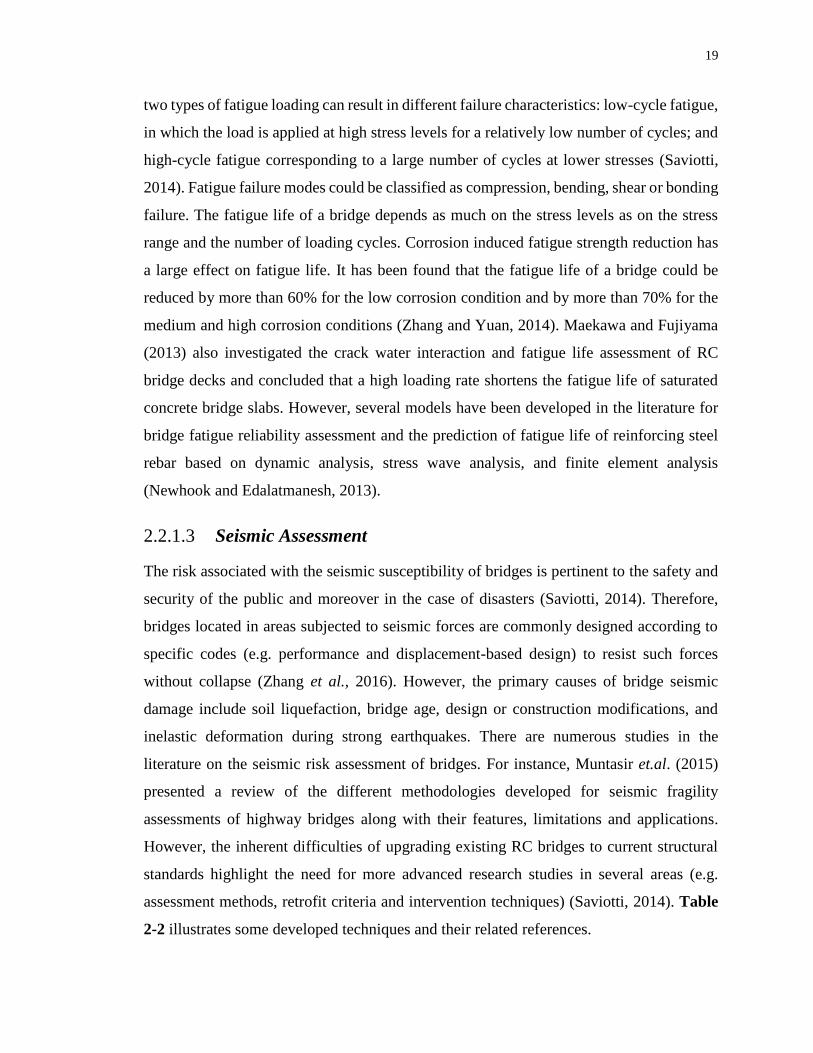
19
two types of fatigue loading can result in different failure characteristics: low-cycle fatigue,
in which the load is applied at high stress levels for a relatively low number of cycles; and
high-cycle fatigue corresponding to a large number of cycles at lower stresses (Saviotti,
2014). Fatigue failure modes could be classified as compression, bending, shear or bonding
failure. The fatigue life of a bridge depends as much on the stress levels as on the stress
range and the number of loading cycles. Corrosion induced fatigue strength reduction has
a large effect on fatigue life. It has been found that the fatigue life of a bridge could be
reduced by more than 60% for the low corrosion condition and by more than 70% for the
medium and high corrosion conditions (Zhang and Yuan, 2014). Maekawa and Fujiyama
(2013) also investigated the crack water interaction and fatigue life assessment of RC
bridge decks and concluded that a high loading rate shortens the fatigue life of saturated
concrete bridge slabs. However, several models have been developed in the literature for
bridge fatigue reliability assessment and the prediction of fatigue life of reinforcing steel
rebar based on dynamic analysis, stress wave analysis, and finite element analysis
(Newhook and Edalatmanesh, 2013).
2.2.1.3 Seismic Assessment
The risk associated with the seismic susceptibility of bridges is pertinent to the safety and
security of the public and moreover in the case of disasters (Saviotti, 2014). Therefore,
bridges located in areas subjected to seismic forces are commonly designed according to
specific codes (e.g. performance and displacement-based design) to resist such forces
without collapse (Zhang et al., 2016). However, the primary causes of bridge seismic
damage include soil liquefaction, bridge age, design or construction modifications, and
inelastic deformation during strong earthquakes. There are numerous studies in the
literature on the seismic risk assessment of bridges. For instance, Muntasir et.al. (2015)
presented a review of the different methodologies developed for seismic fragility
assessments of highway bridges along with their features, limitations and applications.
However, the inherent difficulties of upgrading existing RC bridges to current structural
standards highlight the need for more advanced research studies in several areas (e.g.
assessment methods, retrofit criteria and intervention techniques) (Saviotti, 2014). Table
2-2 illustrates some developed techniques and their related references.

20
Table 2-2: Evaluation techniques for RC bridge performance indicators and the
related references
Performance
Indicator Evaluation Technique Reference Year
Scour
Assessment
Bridge Dynamic Response.
Sound Wave Devices.
Driven Rod Devices.
Fibre-Optic Bragg Sensors.
Ultrasonic P-Wave.
Single-Use Devices.
Ground Penetrating Radar.
Electrical Conductivity Devices.
Elsaid and Seracino
Fisher et al.
Zarafshan et al.
Zarafshan et al.
Coe and Brandenburg
Briaud et al.
Anderson et al.
Anderson et al.
2014
2013
2012
2012
2011
2011
2007
2007
Fatigue and
Fracture
Assessment
Bridge Dynamic Response.
Vehicle-Bridge-Wind Dynamic S.
Corrosion-Fatigue Strength.
Integrating Reliability and SHM.
Crack Water Interaction.
Static Ultimate Testing.
Fatigue Damage Accumulation.
Acoustic Survey-Crack Monit.
Zanjani and Patnaik
Zhang et al.
Zhang and Yuan
Newhook and Edalatman
Maekawa and Fujiyama
Newhook et al.
Edalatmanesh Rahman
Butt et al.
2014
2014
2014
2013
2013
2011
2010
2007
Seismic
Assessment
Seismic Fragility Analysis.
Negative Stiffness Devices.
Probabilistic Time-variant Static.
Seismic Design of RC Bridges.
Probabilistic Performance Analy.
Target Damage Level.
Rubber-Based Isolation System.
Post Repair Response.
Muntasir et.al.
Attary et al.
Biondini and Frangopol
Nogami et al.
Lau et al.
Taner and Caner
Ozbulut and Hurlebaus
Do Hyung et al.
2015
2013
2013
2013
2012
2011
2011
2010
2.3 Bridge Condition Assessment Approaches
The condition assessment of an existing RC bridge aims at determining whether the bridge
will function safely over a specified residual service life. It is based on the results of
assessing hazards and load effects to be anticipated in the future. Guidelines for assessment
of existing bridges have been developed in many countries. They are commonly separated
in phases, starting with a preliminary evaluation, followed by a detailed investigation,
expert investigation, and finally an advanced assessment, depending on the structural
condition of the investigated bridge (Saviotti, 2014). The preliminary evaluation mainly
deals with bridge safety and identifying critical deteriorated bridge members. It should
include an intensive study of the original design and as-built documents, the maintenance
records, a visual inspection and a photographic survey. The detailed investigation focuses
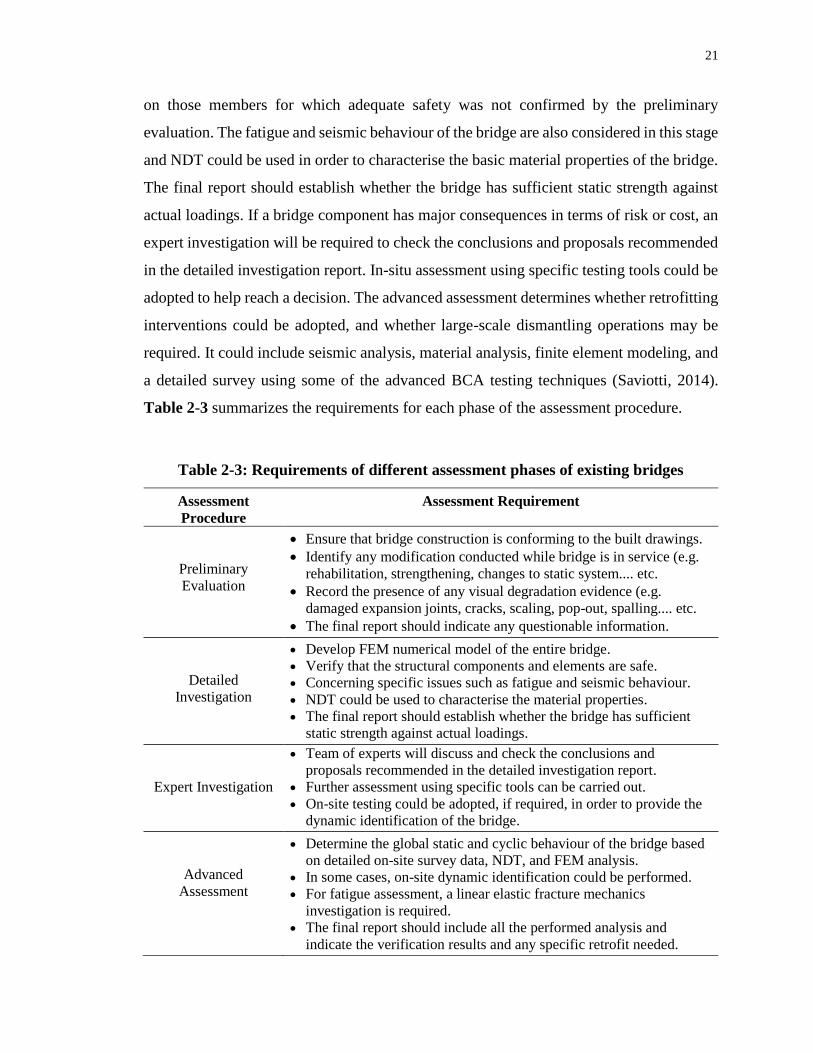
21
on those members for which adequate safety was not confirmed by the preliminary
evaluation. The fatigue and seismic behaviour of the bridge are also considered in this stage
and NDT could be used in order to characterise the basic material properties of the bridge.
The final report should establish whether the bridge has sufficient static strength against
actual loadings. If a bridge component has major consequences in terms of risk or cost, an
expert investigation will be required to check the conclusions and proposals recommended
in the detailed investigation report. In-situ assessment using specific testing tools could be
adopted to help reach a decision. The advanced assessment determines whether retrofitting
interventions could be adopted, and whether large-scale dismantling operations may be
required. It could include seismic analysis, material analysis, finite element modeling, and
a detailed survey using some of the advanced BCA testing techniques (Saviotti, 2014).
Table 2-3 summarizes the requirements for each phase of the assessment procedure.
Table 2-3: Requirements of different assessment phases of existing bridges
Assessment
Procedure
Assessment Requirement
Preliminary
Evaluation
Ensure that bridge construction is conforming to the built drawings.
Identify any modification conducted while bridge is in service (e.g.
rehabilitation, strengthening, changes to static system.... etc.
Record the presence of any visual degradation evidence (e.g.
damaged expansion joints, cracks, scaling, pop-out, spalling.... etc.
The final report should indicate any questionable information.
Detailed
Investigation
Develop FEM numerical model of the entire bridge.
Verify that the structural components and elements are safe.
Concerning specific issues such as fatigue and seismic behaviour.
NDT could be used to characterise the material properties.
The final report should establish whether the bridge has sufficient
static strength against actual loadings.
Expert Investigation
Team of experts will discuss and check the conclusions and
proposals recommended in the detailed investigation report.
Further assessment using specific tools can be carried out.
On-site testing could be adopted, if required, in order to provide the
dynamic identification of the bridge.
Advanced
Assessment
Determine the global static and cyclic behaviour of the bridge based
on detailed on-site survey data, NDT, and FEM analysis.
In some cases, on-site dynamic identification could be performed.
For fatigue assessment, a linear elastic fracture mechanics
investigation is required.
The final report should include all the performed analysis and
indicate the verification results and any specific retrofit needed.

22
The most significant challenge to BCA is the quantification of information on bridge
condition (Lounis, 2013). A comprehensive literature survey has shown that BCA
techniques can be classified into one (or a combination) of five categories including VI for
assessing the apparent condition, load testing (LT) techniques for determining safe loading
levels, NDT technologies for detecting deterioration indicators, SHM systems for sensing
structural performance, and finite element modelling (FEM) for numerically predicting
bridge reliability as shown in Fig. 2-3. Each category is investigated subsequently to frame
its knowledge gaps and highlight its research needs.
Figure 2-3: Condition assessment mechanisms of reinforced concrete bridges.
2.3.1 Visual Inspection
Visual Inspection (VI) is the primary component of all existing BMSs. In Canada and the
United States, routine VI is often conducted within 24-month intervals depending on the
condition of the bridge. Enhanced inspection to access all areas of bridges over 30 years
old are typically done with a maximum six years interval, while emergency detailed
inspection should be carried out immediately when a component contributing to overall
bridge stability has failed, in case of imminent failure, or when public safety is at risk. The
use of bridge inspection reporting software has been explored by several asset management

23
software developers. A bridge inspection software typically consists of interactive forms
that retrieve customized inspection guidelines and relevant historic bridge inspection data,
capture bridge evaluation data, and automatically associate the captured information with
the bridge components, making the bridge inspection records intuitive (Akula et al., 2014).
VI can only identify problems once they have progressed to a high level of severity and
reached the concrete surface. Furthermore, visual inspection requires lifting tools to gain
adequate access to some areas of the bridge as shown in Fig. 2-4.
Figure 2-4: Visual inspection of concrete bridge decks and soffits (Gucunski et al.,
2013).
Research results indicate that assessing a bridge’s condition by VI alone is unreliable, as it
is unable to identify correctly the repair priorities (Moore et al., 2001). Although the
qualifications and experience of those leading bridge inspection are recognized by most
inspection standards, the quality and consistency of visual inspection results greatly depend
on the motivation and equipment of those conducting such inspections. In spite of the fact
that VI is subjective and qualitative, it has been the dominant practice for BCA and for
input parameters in deterioration models. An advantage of VI is that it involves a broad
evaluation of the entire bridge and is not limited to the detection or assessment of a specific
type of damage or a component of the bridge. The VI costs depend on the characteristics
of the bridge and are positively correlated to the level of inspection details and frequency.
The major components of VI costs belong to traffic management and labour. VI costs

24
increase, for instance, in cases of underwater inspection to evaluate scour (Agdas et al.,
2015). Increased awareness of the shortcomings of visual inspection has motivated
advanced BCA approaches. Although more quantitative models of structural deterioration
have been developed, they have yet to be incorporated in existing BMSs. Thus, the review
reveals the need for unified guidelines and BCA procedures capable of using the accessible
data collected during the VI process and accounting for the uncertainty and complexity
associated with detailed inspection processes.
2.3.2 Load Testing
Condition assessments for the global structure integrity of existing concrete bridges are
commonly addressed through structural analysis, load testing, or a combination of
methods. For instance, the reliability bridge evaluation rating process described in the
AASHTO’s (American Association of State Highway and Transportation) manual is based
on load testing. Load testing is a procedure to determine the safe loading levels of a bridge,
leading to a load rating that indicates the capacity level of a bridge. Through forced static
and dynamic load testing in varied load patterns, the maximum response can be detected
using strain transducers placed at critical locations on the bridge. Forced vibration testing
combined with system identification has been used for many decades to determine the
dynamic characteristics of bridges. Load tests are broadly divided into two categories:
proving load tests, which are intended as self-supporting alternatives to theoretical
assessments, and supplementary load tests, which are intended to be used as an adjunct to
theoretical calculations (Zhang et al., 2016). However, the load ratings can be determined
by allowable stress, load factors, or load and resistance factor methods. Bridge ratings
performed by all three methods follow a similar basic procedure, differing primarily in the
load or resistance factors in the rating equation. Although the ratings are determined in
both inventory and operating load levels, these three competing rating methods may yield
different rated capacities for the same bridge (Wang et al., 2011).
Not only do older bridges deteriorate over time, but they may also not have been designed
for increased load demand. Therefore, the required load capacity of an existing bridge
should be determined according to the extreme load effects that the bridge will experience
from actual traffic during its remaining service life. Extreme vehicle loads have been

25
researched through methods such as probabilistic vehicle weight models, consecutive
traveling vehicle models, and simulation (Zanjani and Patnaik, 2014). Another practical
procedure of BCA via load testing is using B-WIM (bridge-weight in motion) monitoring
data where the strain measurements can evaluate the bridge condition, especially for
bridges under load restriction due to distress (Mosavi et al., 2014). However, it should be
noted that this testing is only confined to the elastic range (assuming a heavily overloaded
truck represents ultimate load), which gives no information on the non-elastic performance
at the ultimate limit state.
Bridge strains, displacements, and accelerations can be measured during load testing.
Vertical displacement has been considered the most important among various structural
health parameters that could be used for predicting consequent damage or deterioration in
RC bridges. For instance, deflection in RC bridges increases with reductions in stiffness
when cracking of the concrete occurs. Therefore, service limit states, specified in several
design codes and standards, indicate that deflections throughout the entire service life of a
bridge must not exceed acceptable limits. Measuring deflections during a load test can be
done using linear variable differential transducers-LVDTs, and fibre-optic or similar
sensors mounted on a fixed support. While these systems have high rates of data acquisition
and reasonable accuracy, it is usually difficult to install them on bridges spanning
waterways, bridges with heavy traffic, and when there is need of placing the sensors in
contact with an auxiliary frame linked to the ground. (Cruz et al., 2015). Other options
include topographical methods, hydraulic methods, and the radar interferometry system.
Generally, the topographical methods have low resolution and do not provide high rates of
readings, preventing their use in obtaining influence lines and accurate deflection
measures. The hydraulic methods have similar drawbacks in addition to the effects of
temperature on measurements, while the radar system does not directly measure
deflections, which makes it difficult to apply. However, applying the geodetic technique
using a robotic total station or a theodolite has been successfully used for bridges
characterized by large deflections (Cruz et al., 2015).
Bridge structural integrity can also be assessed by the most probable values of the structural
element properties, such as the stiffness obtained using vibration measurements. For

26
instance, Chen et al. (2009) applied image processing methods and utilized the data of
vibration measurements and video-based traffic monitoring to update the probability
distributions of the elements’ stiffness where the most probable values served as reliable
indicators of bridge structural integrity. Wang et al. (2011) assessed several existing bridge
structures and recommended guidelines, established by a coordinated load testing
programme and a FEM integrated within a structural reliability framework, to determine
practical bridge rating methods. However, loads experienced by bridges are often inferred
from limited measurements of external conditions (e.g. ambient temperature, wind
speed/direction, wave heights). Therefore, the monitoring of load testing can be combined
with other technologies, such as structural health monitoring methods, for improved
assessment of concrete bridges.
2.3.3 Structural Health Monitoring
Structural Health Monitoring (SHM) is a non-destructive in-situ sensing and evaluation
technique that uses multiple sensors embedded in a structure to monitor and analyze the
structural response and detect anomalous behaviour in order to estimate deterioration and
to evaluate its consequences regarding response, capacity, and service life. A SHM system
has the ability to detect damage at any point in time by its real time continuous monitoring.
In recent years, several SHM systems have been developed and implemented to provide
information for bridge maintenance strategies. Most SHM systems have similar
fundamental elements: (1) measurements by sensors and instrumentation, (2) structural
assessment (e.g. peak strains or modal analysis), and (3) BCA to support MR&R related
decision-making (Alampalli, 2012). The functionality of a SHM system depends on the
type and number of sensors used. A monitoring system may rely on single or multiple
sensor types, which can be tailored to capture a variety of physical measurements
associated with loads, environmental conditions, and bridge responses (Wong, 2007). A
SHM system with a variety of sensor types can identify material parameters such as
concrete creep, shrinkage and corrosion, environmental effects including temperature
gradients, and dynamic responses such as traffic-induced vibrations. Table 2-4 summarizes
some common SHM systems to identify the most important parameters in appraising the
overall stiffness and bearing capacity of a bridge structure.

27
Table 2-4: Summary of common structural health monitoring systems of bridges
Monitoring System Advantages and Limitations
Displacement Sensors
(Park et al., 2005)
Easy to use and can allow rapid collection of data from a large
number of points when connected to a data acquisition system.
Reference dependent and time consuming installation.
Cannot be installed under high bridge decks or bridges spanning
waterways.
Acceleration Sensors
(Park et al., 2005)
Have small size and low weight; mainly for vibration monitoring.
Identification effect is poor for low-frequency static displacement
Double integration is required to obtain the displacement. Thus,
has low accuracy.
Strain sensors
(Glisic et al., 2002)
Can measure vertical displacement of a bridge and the
deformation of a frame.
Cumbersome to apply and requires a data acquisition system.
Unsuitable for measuring the deformation of long-span bridges.
Robotic Total Station
(Palazzo et al., 2006)
High precision, automation and can measure the 3D coordinates.
Cannot complete multi-target tasks in a short time.
Due to its low measuring frequency, the requirement of dynamic
measurement cannot be satisfied.
GPS Satellite-Surveying
(Cosser et al., 2014)
Calculate displacement based on measuring the coordinate
changes in one, two or three dimensions.
Applicable to all-weather continuous monitoring.
Low measurement rate, high cost, requires skilled professionals.
Motion detection
cameras
(Chan et al., 2009)
Measure bridge displacement through analyzing photo frames.
Require a certain amount of light to achieve accurate results.
Accuracy may be compromised due to susceptibility to vibrations
from wind and vehicle loading when mounted on bridge.
Digital Image Cross-
Correlation
(Bell et al., 2012)
Optical measurement technique for collecting displacements.
Rapid testing of in-service bridges through digital photography.
Accuracy of deflection measurement should be verified.
Radar Sensors
(Guan et al., 2014)
Wireless and mounted sensors with relatively low cost.
Bridge motion can be extracted from the reflected wave signals.
Signal demodulation and data processing are difficult in the
presence of noise.
Laser Doppler
Vibrometer
(Raghavan, 2007)
Measure the vibration and displacement of bridges.
Provide accurate results but should be placed on the ground
underneath the bridge and cannot be left unattended.
Not suitable for long-term continuous monitoring (fixed position)
Terrestrial Laser Scan
(Gordon & Lichti, 2007)
Can rapidly build complex, irregular 3D visualization models.
Low monitoring accuracy; the post-processing is complicated.
Laser Projection-
Sensing
(Zhao et al., 2105)
High image acquisition frequency and able to reflect the variation
of structural dynamic displacement completely.
A feasible method to monitor bridge displacement.
Requires long-distance laser devices and high resolution
cameras.

28
2.3.3.1 Data Acquisition Using Sensors and Laser Scanning
SHM systems often rely on cables to connect sensors on bridges to a centralized power and
data acquisition source. These wired systems are usually very reliable and are capable of
high data collection rates. However, data and power cables, along with supporting conduit
installation, remain the primary implementation and cost obstacles for cabled monitoring
systems (Bao et al., 2013). Fibre-optical sensors (FOS) have been applied for strain,
temperature, and vibration measurement. FOS are less susceptible to electrical noise than
strain gauges and accelerometers and thus can provide distributed measurements along a
bridge but their accuracy is questionable (Higuera et al., 2011). With the increased
availability of wireless data networks, sustainable SHM systems have been developed so
that pervasive sensor networks allow more efficient monitoring of multiple bridges and
bridge segments across large areas. Wireless sensors have alleviated the cost and labour
associated with cabled monitoring systems. O’Connor et al. (2014) employed a wireless
sensor network to measure bridge accelerations, strains and temperatures. However,
limitations of using wireless sensors include constraints in power and transmission
bandwidth. Solar power supply, vibration, or wind could sustain long-term wireless sensor
network operations, while less relevant communication bandwidth constraints could be
made by conveying less data. For instance, O’Connor et al. (2012) introduced the
compressed sensing data acquisition approach to achieve energy efficiency in long-term
monitoring applications.
Laser scanning has been used in recent years for several health monitoring and damage
detection applications in order to capture the status of structures. The most common
application is tracking user-defined key-points on structures over a time period. Laser
scanning capabilities, such as texture mapped 3D point clouds, can be used effectively to
document quantitative information on present conditions of bridges where individual laser
scans of a scene may be captured from different viewpoints to permit the creation of a
complete 3D record of a damaged bridge (Olsen et al., 2013). Guldur et al. (2015)
developed a condition rating system of bridge components using detected and quantified
surface damage from texture-mapped laser point clouds. The severity of the detected
damage of each structural item was classified and assigned a numerical rating value based

29
on the AASHTO’s condition rating guidelines. The system provides structural evaluation,
giving an overall bridge condition based on major deficiencies, including its ability to carry
the required loads. Zhao et al. (2015) developed a bridge displacement monitoring system
based on laser projection-sensing and recommended the use of long-distance laser devices
with higher power and good collimation to monitor displacements in large-span bridges.
2.3.3.2 Common Applications of SHM Systems
SHM applications can be deployed for load rating, short-term assessment of a specific
bridge performance aspect (e.g. corrosion or scour) or for long-term monitoring to assess
and track a wide range of bridge health conditions. SHM can track previously identified
concerns or continuously monitor the bridge performance to detect damage before it
reaches critical levels through systems that are deployed pre-emptively during the
construction phase. Laory et al. (2012) discussed a systematic approach to determine the
appropriate number and location of sensors to configure measurement systems in which
static measurement data are interpreted for damage detection of continuously monitored
bridge structures. Many SHM systems have been deployed on a variety of bridge
components, such as long-term monitoring of bridge abutment piles, and remote sensing
of corrosion in bridge decks (Huntley and Valsangkar, 2014). Integration of different SHM
systems or combinations of them with other techniques can enhance the assessment
process. Generally, a monitoring system is designed as an integrated system with all data
flowing to a single database and presented through a single user interface.
For instance, Hu and Wang (2013) proposed an integrated SHM system which facilitates
the combination of data collection and data analysis. Wireless network sensors, including
accelerometers, strain gauges, and temperature sensors, were utilized in a system that can
continuously monitor a bridge performance under random loads, where static and dynamic
structural response parameters (e.g. vibration acceleration, dynamic displacement, and
dynamic strain) can be determined and analyzed. Agdas et al. (2015) utilized visual
inspection and wireless sensor networks and recommended a hybrid evaluation technique
that adopts both approaches for optimal functionality to optimize the efficiency of BCA.
Akula et al. (2014) introduced an integration BCA system through software called Toolkit,
which allows inspectors to have access to an intelligent interpretation of SHM obtained

30
data and to the BCA data corresponding to equivalent components recorded visually by
other respondents. However, while the SHM approach is promising as an effective bridge
management tool, it still needs further dedicated research to make it a simple, reliable and
low-cost option to become a standard aspect in BMSs.
2.3.4 Non-Destructive Testing
Non-destructive testing (NDT) techniques enable detection of deterioration processes at
their early stages. NDT methods can be incorporated into the bridge inspection process, for
example, to evaluate stiffness and strength, moisture content, and subsurface defects such
as reinforcing steel corrosion, delamination and crack propagation. NDT is specified in
some BMSs through periodical surveys or when visual inspection results indicate
irregularities within the bridge structure. Appropriate and effective use of NDT has three
requirements: (i) suitable understanding of the underlying phenomenon, (ii) the correct
deployment of testing methods, and (iii) the application of appropriate analysis models to
quantify the detected defects or variation of properties. The most commonly used NDT
methods in onsite assessment and evaluation of RC bridges are illustrated in Fig. 2-5.
Figure 2-5: Non-destructive testing techniques for reinforced concrete bridges.

31
Among all bridge components, the performance of bridge decks was identified as the most
important long-term bridge performance issue. Thus, to perform a practical review of the
existing literature on the wide range of NDT techniques, this section will focus only on
condition assessment of RC bridge decks.
2.3.4.1 Conventional NDT techniques
A number of hand tools, including hammers, steel rods, and chains, have been widely used
to detect subsurface anomalies (e.g. delamination, voids and cracks) in concrete bridge
decks. Hammer sounding involves tapping the surface of a concrete member with a
hammer at multiple locations, while chain dragging involves dragging a chain over the
bridge deck surface. In both cases, the user listens to and interprets the distinctive sounds
produced. A dull or hollow sound indicates delaminated concrete, and a distinct ringing
sound designates non-delaminated concrete. The advantages of these methods include
simplicity, portability and low operating cost. However, such techniques require hands-on
access and can be labor-intensive and time-consuming for large areas of concrete, while
being ineffective for detecting subsurface anomalies in decks having overlays. Traffic
control must also be in place so that inspectors can safely access the concrete element. In
addition, the interpretation of the sound produced is subject to the operator’s judgment and
experience. Likewise, initial or incipient delamination often produces oscillations outside
the audible range. Hence, delaminations cannot be detected by such methods (Yehia et al.,
2007). These limitations have motivated the pursuit of advanced NDT techniques for more
effective and reliable bridge inspection.
2.3.4.2 Advanced NDT Techniques
A number of NDT techniques that exploit various physical phenomena (acoustic, seismic,
electric, thermal, and electromagnetic, etc.), have been explored as a means of improving
the reliability of BCA. Generally, such techniques utilize an approach where the objective
is to learn about the characteristics of the medium from its response to an applied excitation
(Gucunski et al., 2013). For example, probability of active corrosion can be evaluated by
half-cell potential (e.g. Pradhan and Bhattacharjee, 2009), electrical resistivity (e.g. Brown,
1980), and ground penetrating radar (e.g. Varnavina et al., 2015), while the corrosion rate

32
can be identified by the polarization resistance method (e.g. Cady and Gannon, 1992). The
presence of vertical cracks leads to a reduced modulus of elasticity of concrete, which can
be captured using the ultrasonic surface wave method (e.g. Nazarian et al., 1993).
Delamination can be detected using impact echo (e.g. Kee et al., 2012; Parisa et al., 2013),
pulse echo (e.g. Krause et al., 2011); and infrared thermography tests (e.g. Washer et al.,
2009; Seong et al., 2012). Table 2-5 compares the advantages and limitations of the most
relevant NDT techniques for evaluation of concrete bridge decks. The half-cell potential
method will be presented in this section, and IRT and GPR techniques will be presented in
Chapters 4 and 5, respectively. However, further details about the theoretical bases,
instrumentations, applications, and data analysis of all NDT technologies are provided in
a variety of sources such as the AASHTO Manual for Bridge Evaluation (2011), and a
report by the American Concrete Institute (ACI 228.2R, 2013).
Half-Cell Potential (HCP)
Several researchers have applied Half-cell potential (HCP) to identify the potential of steel
corrosion in concrete bridge decks. HCP testing is a probabilistic measurement indicating
the probability of active corrosion. HCP measurements are conducted by electrically
connecting a reference electrode to the steel reinforcement and measuring the potential
voltage difference. The magnitude of the measured voltage indicates the corrosion activity.
If the potential is more positive than -200 mV, the corrosion activity is highly unlikely at
the time of the measurement. If the potential is more negative than -350 mV, there is a high
likelihood of active corrosion. Corrosion activity is uncertain when the voltage is in the
range of -200 to -350 mV. While the test is easy and inexpensive, it requires a moist
concrete cover and uncoated steel bars. Its results could be affected by the concrete
resistivity and cover thickness. It is to be noted that an increase in moisture and/or oxygen
contents of concrete will cause a negative shift in potential voltage measurement. HCP
results also vary with temperature and ion concentrations. Drilled concrete core specimens
for chloride ion concentration analysis are usually retrieved from bridge decks being
investigated using HCP. The accepted chloride threshold value necessary to de-passivate
reinforcement steel and to allow the onset of rebar corrosion (in the presence of oxygen
and moisture) is commonly taken as 0.025% by mass of concrete.

33
Table 2-5: Common NDT methods used to evaluate concrete bridge decks
Technique Physical Phenomena and
Description Applications
Advantages and
Limitations
Impact Echo
(IE)
Mechanical or seismic
stress wave method.
Short-duration stress pulse
using mechanical impact.
Compression waves reflect
at interfaces of different
acoustic impedance.
Monitoring the frequency
arrival of reflected waves
at a nearby location.
Detection of
cracks and
delamination.
Detection of
overlay de-
bonding.
Evaluate
concrete elastic
modulus.
Provides good
accuracy on depth and
extent of defects.
Impact duration
controls size of
detected defect.
Less reliable in the
presence of overlays.
Requires experienced
operator & analyzer.
Ultrasonic
Pulse Echo
(UPE)
Ultrasonic stress wave
method.
Transducer emits short
pulse, high amplitude of
ultrasonic waves.
Waves reflection at various
acoustic impedance.
Measuring the transit time
of the ultrasonic pulse.
Detection of
defects:
delamination,
cracks & voids.
Deck thickness
measurements.
Detection of
overlay de-
bonding.
Provides information
on the presence and
depth of defect.
Time-consuming, less
reliable in detecting
shallow defects.
Attenuation of
transmitted pulses has
scattering effect.
Half-Cell
Potential
(HCP)
Electrochemical reaction
technique.
Measures potential voltage
difference between steel
reinforcement and standard
reference electrode using a
voltmeter.
Identifies
probability of
active corrosion
of steel
reinforcement
at the time of
testing.
Results affected by
concrete resistivity,
moisture content and
cover thickness.
Cannot be used in
presence of overlays
or coated rebar.
Ground
Penetrating
Radar (GPR)
Electromagnetic (EM)
wave propagation method.
EM pulses are emitted via
a transmitter antenna.
The higher the frequency
of antenna, the better the
resolution but the lower the
depth of penetration.
Reflection at interface with
different electric properties
Evaluation of
deck thickness
and concrete
cover.
Description of
concrete as a
corrosive.
environment
Locating steel
reinforcement.
Rapidly survey with
100% coverage.
Cost-effective method
Not good to detect
delamination when no
moisture is present.
Cannot provide
information about
corrosion rates or
rebar section loss.
Infrared
Thermography
(IRT)
Electromagnetic surface
radiation in the IR region.
Utilizes the radiated heat
energy to characterize
subsurface conditions.
Anomalies interrupt heat
transfer and result in
surface temperature
differentials.
Detection of
defects:
delamination,
cracks & voids.
Detection of
layers and
overlay de-
bonding.
Remote sensing
technique, allows real
time visualization.
Rapid inspection with
minimum traffic
disruption.
Cost-effective method
Environmental
dependence.

34
2.3.4.3 NDT Using Remote Sensing Technologies
Remote sensing (RS) is gaining popularity for evaluation of bridge condition. The
commonly used RS technologies include 3D-optical bridge evaluation (3DOB), bridge
viewer remote camera (BVRC), GigaPan, LIDAR, digital image correlation (DIC), and
high resolution street view-style digital photography (Adhikari et al., 2012). These
technologies do not include emplaced sensors, such as strain gauges or temperature
sensors, and can be defined as a form of stand-off SHM and a form of NDT where the
device-gathering data are not in contact with the object (Vaghefi et al., 2012). Abudayyeh
et al. (2004) proposed a framework for automated bridge imaging system based on digital
image processing. Their models were capable of storing different surface defects in a
structured way and generated automated inspection reports. Ahlborn et al. (2012) applied
different image technologies in assessing the condition of concrete bridge decks and
reported that the 3DOB or BVCR techniques based on close range 3D photogrammetry
and the GigaPan technique based on street view-style photography are the best
technologies for defect measurement for bridge inspections. The DIC technology uses
mathematical algorithms to extract displacement information from a series of photographs
and can be used to calculate load rating of BCA throughout the service life of the bridge
(Sanayei et al., 2012). Hinzen (2013) demonstrated the feasibility of damage detection and
quantification based on Google street view images. However, these technologies should be
integrated for complete BCA.
2.3.4.4 NDT Application Approaches
NDT methods can be applied alone to evaluate certain defects, or can be combined to cover
a wider range of testing capabilities in a complementary manner. Although single NDT
approaches have their own merits, there is no single NDT technology that is capable of
identifying all of the complex deterioration phenomena that can affect a bridge. Many
structural problems will be best studied by a particular NDT method, depending upon
which physical properties of the construction materials offer the best scheme of reliable
defect detection. However, results of BCA from different NDT techniques do not
necessarily agree due to the uncertainty associated in data resulting from these techniques
(Yehia et al., 2007; Huston et al., 2011). Therefore, due to the composite nature of concrete

35
and the many causes of deterioration, a diverse set of NDT technologies could be employed
for a more complete conception of a bridge condition. Many case studies exist in which
different techniques have been combined. Table 2-6 illustrates some studies that adopted
the NDT combination approach and the objective of these studies. For example, the Federal
Highway Administration (FHWA) has recently developed the “RABIT” bridge deck
assessment device. RABIT (Robotics Assisted Bridge Inspection Tool) is a fully
autonomous robotic system for the condition assessment of concrete bridge decks using
the results of multi-model NDT, which utilizes the electrical resistivity, impact echo,
ultrasonic surface waves, and ground penetrating radar technologies. The robot’s data
visualization platform facilitates an intuitive 3-D presentation of three deterioration types
(rebar corrosion, delamination, and concrete degradation) and deck surface features
(Gucunski et al., 2015). Pailes (2014) developed a multi-NDT BCA model for concrete
bridge decks. He identified the correlations between the utilized methods and developed a
statistics-based approach to threshold identification for the utilized methods, which were
fused and converted into a deterioration based BCA that identifies locations of active
corrosion, delamination, and cracking. Results from multi-NDT surveys indicate a high
potential to develop more realistic deterioration models for bridges.
Table 2-6: Studies utilized combined NDT techniques approach to evaluate bridges
Techniques Utilized Objective of the Study Reference Year
IRT, GPR.
GPR, Chain Drag, HCP.
IE, GPR, Chain Drag.
IRT, Chain Drag.
GPR, IE, Dynamic Response.
GPR, UE, Hammer Sounding.
IE, GPR, IRT.
IE, UE.
UE, GPR, IRT, HCP.
IE, IRT, Chain Drag.
IE, GPR, HCP, IRT, Ultrasonic
Surface Waves, Electrical
Resistivity, Pulse Echo,
Impulse Response.
Delamination.
Damage Detection.
Comparative Study.
Delamination.
Damage Detection.
Comparative Study.
Comparative Study.
Measuring Thickness.
Comparative Study.
Damage Detection.
Comparative Study.
Alt and Meggers
Barnes & Trottier
Scott et al.
Clark et al.
Yong and Kee
Wood and Rens
Yehia et al.
Algernon et al.
Arndt et al.
Oh et al.
Gucunski et al.
1996
2000
2003
2003
2003
2006
2007
2011
2010
2013
2013

36
2.3.5 Finite Element Modelling
Another tool that is available for BCA is structural modelling. Finite-element modelling
(FEM) is a widely used method for the RC BCA. Research has shown that traditional
methods of assessing bridge health are conservative in some cases and that a calibrated
bridge FEM can provide a more accurate portrayal of bridge response and structural
condition. The construction process, erection methods, material properties, geometric
accuracy, and environmental conditions are key factors in the development of robust FE
models (Sousa et al., 2014). For instance, Xia et al. (2005) developed a FEM for the
quantitative condition assessment of a damaged RC bridge deck, including damage
location and extent, residual stiffness evaluation, and load-carrying capacity assessment.
The model was validated based on dynamically measured data from the undamaged and
damaged decks. The damage location and quantification of the damaged deck were then
identified, leading to residual stiffness and load-carrying capacity assessment. Wang et al.
(2011) developed a FEM to assist the design of load tests and the interpretation of their
results. The actual bridge test results, in turn, were used to validate the FE analysis. The
measured bridge deflections were found in good agreement with those computed by FE
analysis. Alani et al. (2013) proposed an integrated bridge health mechanism where a FEM
was developed using data from visual inspections and calibrated using NDT survey results.
Bell et al. (2012) developed a FEM to calculate the load rating and predict the bridge
structural performance, which was calibrated via the digital image correlation technique
utilized to measure bridge displacements. The system identifies the portion of the bridge
that had undergone the greatest amount of deterioration. Ghodoosi et al. (2015) evaluated
the system reliability of concrete bridges using a FEM and found that the estimated
element-level structural conditions degrade faster once corrosion is initiated. FEM can also
be used to evaluate the reliability of bridges that use nonconventional materials or structural
forms. For example, Ghodoosi et al. (2014) developed a FE BCA model for a restrained
bridge deck system and calibrated the model with experimental results of static deflection,
vibration characteristics, load distribution, and crack patterns. Sousa et al. (2014) utilized
FEM to assess the long-term performance of concrete bridges and suggested that data
collected using permanently installed monitoring systems is the most reliable strategy to

37
improve such assessments. Subsequently, an integrated framework consisting of both FE
modelling and structural monitoring can assist informed decisions.
2.3.6 Advantages and Limitations
The advantages and limitations of the commonly used BCA approaches, presented herein,
are summarized in Table 2-7. Generally, VI, the main tool for evaluating bridge condition,
suffers from limitations such as the required time of inspection, the assessment subjectivity,
a number of safety risks associated with field inspections, and the need for a clear line of
sight. This could affect the efficiency of decision-making and resource allocation. NDT
technology can enhance accuracy and yield more efficient BCA. Simultaneously deploying
multiple NDT technologies enables accurate detection and characterization of deterioration
and provides a better understanding of bridge conditions. This approach also makes the
assessment of a large population of bridges feasible. However, the practitioner must deal
with substantially larger and more complex data, understand how to properly fuse and
interpret the data fusion. Automated data collection and analysis using multiple NDT
methods integrated into robotic systems can overcome those obstacles. Integrated remote
sensing technologies are also gaining popularity as they provide higher evaluation details.
SHM is becoming common in bridge monitoring. For instance, using wireless SHM to
monitor the progression of deficiencies identified during a VI allows for continuous
monitoring of identified defects, while maintaining a safe use of the bridge. Yet, SHM
systems have some limitations which can hinder their adoption as part of BMSs. These
include system complexity, which relies on the desired functionality characteristics, system
maintenance to sustain long-term operation, and the requirement of automated data
analysis to locate potential damages. However, the use of compressed sensing can
simultaneously reduce data sampling rates, on-board storage requirements, and
communication data payloads. Using traffic-induced vibration response data has several
practical advantages: (i) it does not interrupt traffic; (ii) captures in-situ dynamic behaviour
of the bridge undergoing in its normal service; (iii) can be performed continuously,
scheduled periodically, or triggered automatically; and (iv) requires no special
experimental arrangements. It should be noted that data collected using either NDT or
SHM systems is the most reliable strategy to improve and update bridge FEM assessment.

38
Table 2-7: Comparison of condition assessment techniques for RC bridges
Technique Description, Advantages and Limitations
Visual
Inspection
(VI)
Description: trained engineers recognize, register, and evaluate the physical
condition of different bridge elements using inspection manuals and defined
codes. The primary and most common interval for inspections is 24 months.
Advantages: the most cost-effective means for bridge condition evaluation.
BMSs rely primarily on VI to record bridge component condition ratings, which
are quantified and standardized through a priority-ranking procedure.
Limitations: subjective evaluation; results greatly depend on the qualifications
of those conducting inspections; the findings may not be identical. Consider only
the observed physical health of the bridge and cannot detect the hidden defects.
Load Testing
(LT)
Description: determine the actual load the bridge can carry without distress
(load carrying capacity). Condition ratings can be determined by allowable
stress, load factor, or load and resistance factor methods.
Advantages: safe conservative analysis methods. The governing rating is the
lesser of the shear capacity of the critical bridge component. Development and
updating the load rating software is undertaken by AASHTO.
Limitations: costly and time consuming. The three rating methods may lead to
differently rated capacities and posting limits for the same bridge. No guidance
as to which method should be used for specific circumstances.
Structure
Health
Monitoring
(SHM)
Description: encompasses a range of methods and practices designed to capture
structural response, detect anomalous behaviour, and to assess the bridge
condition based on a combination of measurement, modelling and analysis.
Advantages: reliable and potentially real-time bridge assessment. More
meaningful than using load response data. Can be deployed for short-term and
long-term assessment. Appropriate for movable bridges than any other method.
Limitations: wireless sensors rely on battery power. The size and complexity of
the bridge could result in complex systems. SHM systems often create liability
issues. Require routine, on-site maintenance to sustain long-term operation.
Non-
Destructive
Testing
(NDT)
Description: a number of techniques introduced exploit various physical
phenomena (acoustic, seismic, electric, electromagnetic, and thermal, etc.) to
detect and characterize deterioration processes without damaging the elements.
Advantages: provide effective, and accurate condition assessment. Objectify the
inspection process and make it faster and more reliable. Integration of different
techniques is the best approach to identify several different damage states.
Limitations: applying only one technology provides limited information about
the bridge condition. No single technology is capable of identifying all of the
deterioration defects. Require trained personnel for data collection and analysis.
Finite
Element
Modelling
(FEM)
Description: numerical analysis to investigate the behaviour and response of a
bridge structural system. Usually updated or calibrated using results of field
inspection supported by NDT or by static and/or dynamic tests on the structure.
Advantages: allows detailed visualization, can be created using data from visual
inspection and then parameterised and calibrated using information from NDT
and SHM results. FEMs can satisfactorily capture short-term performance.
Limitations: FE models typically require calibration. Long-term assessment is
a challenge due to advances in structural materials and construction methods.

39
2.4 Bridge Deterioration Prediction Tools
A deterioration prediction model is a link between a measure of existing bridge conditions
and a vector of explanatory variables that represent the factors affecting bridge
deterioration (Black et al., 2005). Accurate prediction of the deterioration rate is crucial to
the success of any BMS. Deterioration models can be categorized according to different
mechanisms. For example: (i) linear or nonlinear, (ii) deterministic or stochastic, (iii)
aggregate or disaggregate, and (iv) mechanistic or empirical models. Several deterministic,
stochastic, and mechanistic models are widely used for predicting the macro and micro
responses of bridge components but the degree of efficiency of these models is a matter of
debate. These models and their techniques are summarized in Fig. 2-6. Each category
suffers from some limitations and is briefly discussed in this section.
Figure 2-6: Deterioration prediction models techniques.
2.4.1 Deterministic Models
Deterministic models use a single defined value to describe bridge elements’ conditions at
a certain given time. They utilize historical data to estimate the deterioration rate using the
available statistical techniques. Accordingly, the models can be categorized as straight-line

40
extrapolation, regression and curve-fitting models. For instance, straight-line extrapolation
models can be used to predict the material condition rating of a bridge given the assumption
that traffic loading and maintenance history follow a straight line. The models require an
initial condition that can be assumed at the time of construction and only one condition
measurement after construction at the time of the inspection. Although these models are
accurate enough for predicting short-term conditions, they are not appropriate for
conditions at long periods of time. They also cannot predict the rate of deterioration of a
bridge that has undergone some repair. Regression models depend on developing an
empirical relationship between two or more variables that affect the bridge condition: one
dependent variable and one or more independent variables. Several forms of regression
models are presented in the literature, including linear and non-linear regression. Linear
regression models do not provide sufficient accuracy and may underestimate or
overestimate the bridge condition at a specific time while the non-linear regression models
provide more adequate prediction accuracy (Morcous et al., 2010). Curve-fitting
techniques are mathematical methods that depend on constructing a polynomial that best
fits bridge condition data. A third order polynomial curve, based on the relationship of
bridge component condition rating versus age, was found as an accurate prediction model
for several concrete bridges (Elbehairy et al., 2006).
2.4.2 Stochastic Models
The deterioration process has a stochastic rather than a deterministic nature since several
complex mechanisms characterize the variability of a deteriorated element. The use of
stochastic models has contributed significantly to the field of modeling bridge deterioration
due to the high uncertainty and randomness involved in the deterioration process.
Generally, stochastic models can be categorized into probability distribution, simulation
and Markov chains models (Morcous et al., 2010). A probability distribution describes the
probabilities associated with all values of a random variable. For example, if the random
variable is the condition rating of an element in a bridge, then the probabilities associated
with all of its values are described by a probability distribution function rather than a
deterministic value. The use of probability distribution requires knowledge of the
distribution for the variables being predicted, which limits the use of this technique for

41
individual distress prediction (Abu Dabous et al., 2008). An effective way to deal with
uncertainties is through simulation, which can provide more accurate estimates using a
large number of “what if” scenarios. The Monte Carlo simulation method takes both
sensitivity and input variable probability distribution into consideration and has been
widely utilized in concrete bridge deterioration models. The deterioration can be simulated
if enough statistics on the transition times required for an element to change its condition
are available. The output of the simulation is a probabilistic deterioration profile in terms
of the time taken to change from one condition rating to another.
Markovian Models
A stochastic process is generally defined as the process in which the past behaviour
influences the future ones. A Markov process is a conditional stochastic process where the
transition probability from a given behaviour to a future behaviour is dependent only on
the present behaviour and not on the manner in which the current behaviour was reached
(Elbehairy et al., 2006). This assumption was made for simplicity and to facilitate
computations but not supported by mechanistic knowledge of material behaviours (Abu
Dabous et al., 2008). The Markovian models are the most common example of state-based
probabilistic deterioration models and have been employed in many advanced BMSs such
as Pontis, and OBMS. State-based probabilistic deterioration models are those used to
predict the probability distribution of transition states from one condition to another over
multiple discrete time intervals. The Markovian model takes advantage of the discrete
condition states identified for inspections, to provide a simple way of describing the
likelihood of each possible change in condition at evenly-spaced intervals.
The main challenge in Markovian models is the derivation of the transition probabilities.
Several methods have been adopted to estimate the transition probabilities, such as
percentage prediction method, expected-value method, ordered probit model, and
regression-based optimization methods. Those methods can be used when a statistically
significant number of consistent and complete sets of condition data are available,
otherwise the Monte Carlo method or expert judgment elicitation procedure may be applied
(Black et al., 2005). More improved and realistic models have been recently developed to
account for the effect of the time spent between the states on the transition probabilities

42
(e.g., Semi-Markov, Weibull Survival models, and Hybrid Markov-Weibull models) and
to relax the state independence assumption by accounting for the past condition among
other explanatory variables (Black et al., 2005). The Bayesian belief network (BBN)
models also offer a compact representation of a joint probability distribution, together with
a rigorous formalism for the construction of models relying on probabilistic knowledge.
The Bayesian procedure has great advantages that cover problems of insufficient data and
difficulty in estimating model parameters but it demands careful considerations for the
convergence process (Nasrollahi and Washer, 2014). If condition ratings are unavailable,
the backwards prediction models (BPM) can produce an estimated rating for the
unavailable components or data and use time delay analysis to predict the condition ratings
of future components.
2.4.3 Mechanistic Models
Mechanistic models describe the specific deterioration mechanisms of particular bridge
components where deterioration is described by quantitative performance indicators
through knowledge of the physical and chemical processes involved in the deterioration
process (Lu and Liu, 2010). Modeling of bridge load-capacity, chloride-induced corrosion,
and alkali-silica reaction (ASR) are some examples of research efforts towards the use of
mechanistic deterioration models. For instance, Wang et al. (2011) used load-carrying
capacity to predict bridge deterioration. Ian et al. (2015) modeled the deformation of
concrete bridges due to the effects of ASR, creep, and shrinkage. Lu and Liu (2010)
developed an analytical model that describes the mechanism of damage initiation and
accumulation to predict corrosion-induced cracking, spalling, and delamination of
reinforced concrete decks and performed numerical simulations, using a FEM, of the
condition evolution for different values of model parameters. Morcous et al. (2010) utilized
Monte Carlo simulation to generate the probability density function of the time to corrosion
initiation and to capture the stochastic nature of the deterioration process. Tarighat and
Miyamoto (2010) considered the spatial variability of the deterioration parameters across
the bridge components (the materials and geometrical properties) and developed a
deterioration model of concrete bridges exposed to corrosion. Shafei et al. (2014)
calculated the corrosion initiation time through a detailed computational model considering

43
the most influential parameters, including ambient temperature, relative humidity, chloride
binding capacity, and exposure conditions. They also provided a detailed mechanical
model that considers the effects of corrosion on decreasing the cross-sectional area of steel,
yield strength of steel and the loss of the concrete cover.
2.4.4 Advantages and Limitations
The advantages and limitations of the deterioration prediction models are summarized in
Table 2-8. Deterministic models are the simplest models where the deterioration rate of
one element is generalized to all similar elements. The main limitations of these models
are the failing to consider uncertainty and ignoring the effect of unobserved variables and
hence, the inherent stochastic nature of demands. The complexity and interaction of the
several deterioration mechanisms make it unrealistic to model the deterioration process
using a deterministic approach. Several advantages for stochastic models include: (1)
represent uncertainty in initial condition, assessment errors and deterioration process, (2)
provide an unbiased estimate of needs within any time frame, and (3) do not require long
time-series of data. However, they still suffer from several limitations: (1) future
deterioration depends only on the current or preceding condition state and does not relate
to the historical condition of a bridge or any other attribute (e.g. maintenance) of the bridge
elements, (2) assume discrete transition time intervals, a constant bridge population, and
stationary transition probabilities, and (3) transition probabilities are estimated in terms of
subjective engineering judgement and require frequent updating.
Mechanistic models embrace a reliability-based approach and focus on relevant failure
modes of the bridge in determining the reliability of the bridge over time. These models
are promising because they relate the qualitative measurement of the condition state to the
quantitative physical parameters of the bridge such as material properties, stress conditions,
structural behaviors, which are critical data for assessing the structural capacity of the
bridge. Although, these models have the ability to predict the deterioration with high
accuracy and efficiency, none of the transportation agencies incorporate them in their
BMSs as it is difficult to consider the various variables affecting the deterioration process.
Another key limitation to this approach is the associated cost to perform detailed condition
survey, using NDT techniques, for the network level analysis.

44
Table 2-8: Comparison of deterioration model techniques for concrete bridges
Technique Description Advantages & Limitations
Advantages Limitations
Deterministic
Models
Use a single condition
value of an element at
a certain given time.
Use historical data to
estimate the element
deterioration rate.
Simple and easy to
understand and
develop. Require only
one condition rating
after construction.
Assume that the
environment, structure
system, and material
properties exhibit the same
behaviour. Not accurate for
long-term prediction.
Stochastic
Models
Consider discrete
condition states for
inspections. Describe
the probabilities of all
variables by a
probability distribution
function.
Consider the inherent
uncertainty involved in
the deterioration
process. Can predict
condition within any
time frame. Require
two inspection cycles.
Condition distribution is
independent of the past
conditions or any other
attribute. Assume discrete
transition time intervals.
Subjective transition
probabilities.
Mechanistic
Models
Use quantitative
performance indicators
through detailed
condition surveys and
analytical assessments.
Can accurately predict
the initiation,
propagation, and
failure induced by
different damage
mechanisms.
Difficult to develop when
multiple types of
deterioration processes are
to be modeled together.
Costly for data collection,
analysis, and modeling.
2.5 Bridge Condition Assessment and Artificial Intelligence
Research in artificial intelligence (AI) has focused on using soft computing methods that
permit the creation of evaluation and prediction models based on processes found in nature,
such as the brain, or natural selection (Flintsch et al., 2004). In comparison with hard
computing, which is based on precise, definite, and rigorous data; soft computing
techniques allow for imprecise, uncertain, incomplete and subjective data. Because this
often describes bridge inventories and condition information, considerable research has
been dedicated to using AI techniques in bridge management. Artificial Neural Networks
(ANNs), Fuzzy Set Theory (FST), and Evidential Reasoning (ER) are the most common
models utilized in evaluating bridge condition and are briefly discussed subsequently.
2.5.1 Artificial Neural Networks
Neural networks are based on the principle that a highly interconnected system of simple
processing elements can learn complex interrelationships between independent and
dependent variables. ANN model is a parallel distributed processing system consisting of

45
an input layer, an output layer, and hidden layers connected by neurons. Each neuron is a
processing element that receives one or more inputs and produces an output, or value,
through a transfer function (activation function), which is passed on to the next neuron to
determine a final output (Wang and Elhag, 2008). There are several ANN software, which
have different scale options. For instance, the Matlab Neural Network toolbox can be used
to develop multilayer perceptron ANN models (Lee et al., 2015). Figure 2-7 illustrates an
ANN structure consisting of an input layer, an output layer and hidden layers.
Figure 2-7: Structure of an artificial neural network.
Sobanjo (1997) investigated using ANNs in modelling bridge deterioration where a multi-
layer ANN was utilized to relate the age of a bridge superstructure to its condition rating.
The model yielded 79% of the predicted values matching the actual values with a 15%
prediction error. Tokdemir et al. (2000) developed a more elaborate model that
incorporated additional factors such as highway class, design type, material type, and
traffic volume to predict a bridge sufficiency index. The ANN model resulted in 62.5%
correct solutions on average percentage with a prediction error of 3%. Huang (2010)
developed an ANN condition assessment model for concrete bridges based on statistical
analysis of the significant factors affecting the deterioration process. For example, the
maintenance history, age of the bridge, previous condition, district where bridge is located,
design load, bridge length, average daily traffic, environmental exposure, number of spans,
and degree of skew were used as input neurons.

46
Li and Wang (2011) compared several ANN methods to predict bridge condition ratings
based on physical and operational bridge parameters and produced related deterioration
curves. Emily (2011) developed two types of ANN, multi-layer perceptrons (MLPs) and
ensembles of neural networks (ENNs), to predict the condition ratings of concrete bridge
decks using historical condition assessments chronicled in the NBI database. It was
reported that ANNs can produce correct responses even in the presence of noise or
uncertainty in the training data, and can predict the outcome of complex deteriorations or
those with a high degree of nonlinear behaviour. Lee et al. (2012) proposed an ANN model
for bridge deterioration where a backwards prediction model (BPM) was used to fill in
gaps in historical data. The model subsequently uses time delay neural network modelling,
similar to the ANN model proposed by Huang (2010) to predict future condition ratings.
An advanced integrated model was further developed by Lee et al. (2015) that incorporates
a time-based model, a state-based model with the Elman neural network and a BPM to
predict long-term bridge performance where similar bridge components are grouped
together, thereby identifying the common deterioration patterns, achieving 75.4% accuracy
with 4% prediction error.
2.5.2 Fuzzy Set Theory
To deal with vagueness and uncertainty in modelling bridge condition, probabilistic
techniques are usually used, among which the Monte Carlo simulation is the most popular.
However, such methods are complex requiring large amounts of data (Kishk and Al-Hajj,
2002). Ross (2010) reported that the deterioration mechanisms and surrounding aggressive
environment of concrete cannot be simply identified by separate factors. Fuzzy sets, based
on the fuzzy set theory that was first introduced by Zadeh (1965), are developed for
handling uncertainties associated with vague, imprecise, qualitative, linguistic, or
incomplete data that play an important role in the case of evaluation and predication of
bridge conditions (Sasmal et al., 2009).
The vague data are generally represented by fuzzy numbers or fuzzy sets, which can be
processed using mathematical operations according to analysis requirements in a fuzzy
domain. The main components of building a fuzzy system include: (1) fuzzification:
converting input data into partial degrees of one or more membership functions of fuzzy

47
subsets, (2) inference: computing the true value for the premise of each fuzzy rule and
applying it to the conclusion part of each rule, (3) composition: assigning the fuzzy subsets
to each output variable and combining them to form a single fuzzy subset for each output
variable, and (4) defuzzification: converting the fuzzy output set to a crisp number.
Techniques for constructing fuzzy membership functions include pairwise comparison,
clustering, direct or reverse rating, polling, neural networks, relative preference, and
statistical regression. However, there is no single method that can work for all applications
(Sasmal et al., 2009). Figure 2-8 illustrates the basic configuration of a fuzzy system.
Figure 2-8: Basic configuration of fuzzy system with fuzzifier and defuzzifier
(Senouci et al., 2014, with permission from ASCE).
Extensive studies have been carried out to evaluate the condition of different bridge
components using FST as a potential substitute for probabilistic models (Tee et al., 1988;
Liang et al., 2002; Sasmal et al., 2009; Tarighat and Miyamoto, 2010; Chen and Fan, 2011;
Li and Wang, 2011; Hasan et al., 2013; Moufti et al., 2014). For example, Tee et al. (1988)
presented a bridge condition assessment model based on resolution identity of fuzzy sets.
They presented algorithms for fuzzy weighted average computation. Many bridge
condition rating methodologies have since adopted this approach. For instance, Liang et
al. (2002) used fuzzy mathematics and proposed regression models for predicting the
remaining service life of concrete bridges. Sasmal et al. (2009) developed a procedure for
condition assessment and rating of concrete bridges using fuzzy mathematics where the
entire bridge was divided into three major components: deck, superstructure, and

48
substructure. Each of which is further subdivided into a number of elements, while the
defuzzified value of the resultant rating fuzzy set becomes the rating value for the bridge
as a whole. Moufti et al. (2014) proposed a fuzzy based framework through a detailed
bridge condition assessment incorporating a weighted set of possible bridge defects. Li and
Wang (2011) developed a fuzzy model to predict the condition rating of concrete bridges
where ANN with back-propagation algorithm was applied. The results indicated that the
model improved the performance of the knowledge representation system based on
enhanced fuzzy inference rules.
2.5.3 Evidential Reasoning
Uncertainties can be classified into two main classes: ignorance (incompleteness) and
fuzziness (vagueness). The ER approach is characterised by a distributed modelling
framework capable of modelling ignorance, whilst fuzziness can be well treated using the
fuzzy set theory. The ER approach deals with a wide range of decision problems having
precise data, random numbers and subjective judgments with probabilistic uncertainty in a
way that is rational, transparent, reliable, systematic and consistent (Yang et al., 2006). The
ER approach applies the evidence combination rule of the theory of evidence (D-S),
(Dempster, 1967; Shafer, 1976). The theory has the ability of combining pairs of bodies of
evidence or belief functions to derive a combining evidence or belief function (Deng et al.,
2014). The ER approach for bridge assessment consists of five main parts: (1) identification
of bridge condition assessment factors, (2) determination of weights and assessment grades
for each factor, (3) distributed modeling framework for the assessment factors, (4)
recursive or analytical ER algorithm for aggregating multiple assessment factors, and (5)
utility interval based ER ranking, which is required to prioritize bridges in terms of their
overall condition assessments (Wang and Elhag, 2008).
ER has been recently used by several researchers to assess and predict bridge condition
rating (e.g. Wang and Elhag, 2008; Bolar et al., 2013; Deng et al., 2014; Moufti et al.,
2014). For example, Bolar et al. (2013) proposed a bridge condition assessment using the
hierarchical ER methodology to model the uncertainties inherent in bridge evaluation
where bridge data are classified in their respective order of importance into primary,
secondary, tertiary and life safety-critical elements to capture both structural importance

49
and data reliability. The data were combined using D-S evidence theory to obtain
respective condition indices and finally grouped to predict the overall bridge condition
index. Moufti et al. (2014) proposed a fuzzy hierarchical ER approach for condition
assessment of concrete bridges under uncertainty based on a multi-level evaluation and
aggregation of the detected bridge defect measurement. Deng et al. (2014) developed
hierarchical ER model for bridge condition assessment, which can handle incomplete basic
probability assignment expressing the uncertainty of judgement in the process of
assessment. The model extends the D-S evidence theory where the uncertain information
was represented and called D-numbers, based on reasonable removal for some of the
hypotheses of D-S theory. It is to be noted that the combination of the belief structure
generated by the D-S theory and the fuzzy modeling by the fuzzy set theory would be able
to handle both fuzzy uncertainty and ignorance concepts.
2.5.4 Advantages and Limitations
The merits and demerits of ANN, FST, and the ER approaches are summarized in Table
2-9. The ANN models can learn from existing data and gather knowledge, and perform
complex activities. However, ANN have some drawbacks: (i) the individual relations
between the input variables and the output variables are not developed by engineering
judgment or based on analytical basis; (ii) the conversion to numbers may lead to the loss
of information that was contained in the original representation; and (iii) ANNs work well
when the input and output variables are numerical values. Fuzzy logic is a means for
modelling the uncertainty involved in describing an event/result and is organized as a
powerful modelling technique designed to handle natural language and approximate
reasoning. Fuzzifying uncertain variables in bridge evaluation has the benefits of
enhancing the ability to model real bridge deterioration problems. It is also easier to define
fuzzy variables than random variables when no information or limited information is
available. Furthermore, mathematical concepts and operations within the framework of the
fuzzy set theory are much simpler than those within the probability theory and can easily
be updated with new data or modified to accommodate future findings. ER is capable of
aggregating both numerical input and qualitative data with uncertainty as evidences
towards a comprehensive BCA. The (D-S) evidence theory has an advantage of directly

50
expressing “uncertainty” by assigning probability that is limited by a lower and an upper
bound, which, respectively, measures the total belief for the objects. ER has produced
promising results, and thus needs concerted research efforts.
Table 2-9: Comparison of AI techniques for concrete bridges evaluation
Technique Description, Advantages and Limitations
Artificial
Neural
Networks
(ANNs )
Description: ANNs are based on: a highly interconnected system of processing
elements (neurons); can learn interrelationships between independent and
dependent variables. Each neuron receives multiple inputs through weighted
connections from previous neurons, performs computations, and transmits the
output to other neurons.
Advantages: can satisfactorily predict nonlinear behaviour even in the presence
of uncertainty in the training data. No requirement of predetermining the
relationships between inputs and outputs. High capability of self-learning and self-
updating. Using optimization algorithms in the learning process reduces error.
Limitations: relations between the input variables and the output variables are not
based on analytical basis. Conversion of input data to numbers may lead to loss
of information that was contained in the original representation. Needs training
process, which is time consuming and requires large amounts of data.
Fuzzy Set
Theory
(FST)
Description: FST can model vague linguistic variables using the concept of
partial membership and approximate reasoning. Involves three steps:
fuzzification, aggregation, and defuzzification. Fuzzy sets are processed
according to analysis requirements.
Advantages: most appropriate where human judgment, perception, or decision
making are inextricably involved. It is easier to define fuzzy variables than
random variables when no information or limited information is available. Allows
applying mathematical operations and programming to the fuzzy domain.
Limitations: cannot provide a full description of the overall assessment of a
bridge structure. Triangular fuzzy membership functions give a single value as a
full membership function, for each linguistic input variable. A fuzzy set must be
adjusted using the normalization operation.
Evidential
Reasoning
(ER)
Description: established on the basis of Dempster-Shafer (D-S) theory of
evidence. Assign belief/credibility to the evaluation of the various assessment
attributes. Aggregate the multiple attributes based on the distributed assessment
and the evidence combination rule.
Advantages: ER is able to combine both numerical input and qualitative data with
uncertainty such as incomplete information, and total ignorance. The final overall
assessment of a bridge is a distributed assessment, which offers a panorama of a
bridge condition. Can deal with both probabilistic and fuzzy uncertainties.
Limitations: requires careful identification of all bridge assessment factors.
Different sets of assessment grades for bridge elements need to be unified before
the implementation of the ER algorithm. Applicable only for bridge condition
assessment, not for the prediction of bridge condition ratings.

51
2.6 Challenges Requiring Further Research
The present review highlights some tangible findings including: (1) the existing
measurement methods for bridge displacement failed to realize long-term and real-time
dynamic monitoring of bridge structures, essentially because of their low degree of
automation and insufficient precision (Zhao et al., 2105); (2) there are discrepancies among
the different load rating methods where the reasons for these differences should be
addressed (Wang et al., 2011); (3) although NDT and SHM systems have become the most
effective and significant aids for managing bridge infrastructure, there are a limited number
of studies that address uncertainty in their measurements based on quantifiable data ( Hesse
et al., 2015); (4) further work should be undertaken to demonstrate the accuracy of
maturing and emerging sensors for use on SHM of bridge structures (Webb et al., 2015);
(5) at present, NDT methods, such as impact echo, radar, ultrasonic, resistivity and infrared
are being commonly used for quantitative evaluation of bridge condition to augment visual
inspection data (Gucunski et al., 2015); (6) most current research efforts aimed at verifying
the capability of integrating NDT techniques to have objective condition assessment
systems and determine bridge elements or components condition based on their resilience
(Pailes, 2014); (7) the Markovian and regression models have restrictive assumptions
implicit in their respective formulations; and (8) AI models can provide more reliable BCA
models, but require large bridge information input, while BMS software so far only has
very limited NDT and SHM results (Lee et al., 2015).
Bridge engineering is rapidly evolving and much work is ongoing in the specific matter of
bridge assessment. Figure 2-9 illustrates the developed conceptual framework to identify
challenges that require further concerted research efforts and development. The prospects
for improvement was identified as follows: (1) defining solid criteria for the assessment of
general bridge condition based on visual inspection; (2) advancing the use of NDT and
SHM in mainstream bridge engineering; (3) developing various fully automated data
collection systems based on integrated NDT techniques; (4) developing advanced and
simplified data analysis and interpretation; (5) integrating of diverse monitoring systems;
(6) developing innovative software for integrating SHM/NDT data and aiding in its
interpretation; (7) developing correlations between the bridge damage and internal

52
deterioration processes; (8) documenting the cost-benefit of the latest applied techniques
and augmenting their future study; (9) considering the structural robustness and
redundancy concepts in the bridge assessment process; and (10) focusing future research
studies on most relevant problems. Indeed, fully automated data collection and
interpretation analysis are the primary requirements to improve current BMSs. These will
provide rapid and accurate BCA and enable monitoring of deterioration progression
through periodical surveys and thus, allow the surveys of hundreds of bridges to become
feasible. Consequently, this should yield tremendous reduction in costs associated with the
application of NDT technologies and in the frequency and duration of traffic interruptions.
Figure 2-9: Conceptual framework to identify challenges that require further
research in bridge condition assessment.

53
2.6.1 Selection of Appropriate Condition Assessment Technique
As previously discussed, different deterioration processes lead to different types of bridge
component defects, which affect the ability of the evaluation techniques to detect and
characterize them. The decision of which technique is more appropriate for BCA is highly
dependent on the nature of the available data and is driven by certain factors: (a) the
mechanism of deterioration in the bridge being investigated, (b) expected output from the
evaluation method, (c) how the assessment data will be used, (d) level of complexity and
available time to conduct the evaluation, and (e) the geographic location as well as the
traffic density and environmental conditions. For instance, corrosion can be tracked by
monitoring the electrical outputs in a cathodic protection system, whereas scour monitoring
involves using acoustic, pier-mounted sensors to track scour depth in the regions of bridge
piers and abutments. Cameras are useful for displacement monitoring, whereas strain
gauges are suitable for deformations. For bridge decks, if delamination is of greatest
concern, impact echo or infrared with a higher degree of automation are appropriate, while
radar is suitable if corrosion of greatest concern. Table 2-10 recommends specific BCA
methods for some of the common deterioration mechanisms in different bridge structures.
Table 2-10: Appropriate investigation methods for some deterioration mechanisms
in RC bridges
Concerned Assessment Recommended Investigation Method
Map patterns of distress such as surface
cracks, spalling, scaling, and erosion
Scour damage
Integrated visual inspection and remote
sensing technologies.
Vibration based techniques, scour sensors.
Fatigue damage Acoustic emission techniques.
Breaks in cable-stayed RC bridges. Health monitoring (strain sensors).
Corrosion in prestressing strands (in
adjacent concrete box-beam bridges).
Magnetic techniques (magnetic reluctance
meters).
Damages in long-span suspension RC
bridges
Health monitoring techniques (strain
sensors & FEM).
Delamination and cracks in RC bridge
decks.
Potential of corrosion in concrete
bridges
Subsurface defects in superstructure
components of RC bridges.
Unknown bridge foundation depth,
integrity, type.
Air-coupled impact-echo and infrared
thermography.
Half-Cell Potential, electrical resistivity,
and ground penetrating radar technologies.
Remote sensing and health monitoring
technologies.
Parallel seismic and ultra-seismic
techniques.

54
2.7 Conclusions
Bridge condition assessment procedures have existed for many decades. It was
enlightening to realize the extent of ongoing work that is expanding rapidly considering
the staggering resources needed to repair ageing bridges, which often exceed the
capabilities of bridge owners. BCA is a scientific and technical procedure aimed at
producing evidence of bridge health, assessing its structural reliability, and tailoring
procedures to prolong its life. According to this framework, this study has provided a much
needed review of recent research accomplishments in this field. The reviewed body of
knowledge offers recent advances in VI, LT, NDT, SHM, and FEM techniques as well as
existing deterioration prediction models and achievements of AI technologies in BCA. The
review demonstrates clear need to upgrade existing BMSs to incorporate recent research
in this domain.
Future research should consider data that drive the decision making of bridge owners from
research planning to implementation, with particular focus on added value. Only then can
the use of these technologies in mainstream bridge engineering practice truly valuable.
Innovative design and construction methodologies should be also considered by
transportation owners along with improving existing BMSs. For instance, by verifying the
accuracy of a bridge FEM with NDT and SHM results, bridge owners can use analysis
output for bridge evaluation and decision making. An understanding of the range of
capabilities of different NDT techniques and SHM systems will be helpful in directing
bridge stakeholders to evaluate the output and, hence, value can actually be delivered.
Reliable bridge condition can be effectively achieved using several complementary NDT
technologies. Therefore, there is need for more research efforts to develop multi-NDT
models. However, caution is recommended before widely using any such methodology. A
method should be used only after careful cost-benefit analysis to determine its value in
both the short- and long-term. Lastly, the enormous amount of information and knowledge
that has already been produced in the BCA field must be integrated into comprehensive
decision making systems, which could be used by various participants in the field for
quality management and structural assessment purposes of ageing bridges.

55
2.8 References
AASHTO. (2011). “Manual for bridge evaluation.” 2nd Ed., Washington, DC.
Abu Dabous, S., Alkass, S. and Zaki, A. (2008). “A probabilistic methodology for bridge
deck condition assessment.” Bridge Structures, Vol. 4 (1), 49-56.
Abudayyeh, O., Al-Bataineh, M., and Abdel-Qader, I. (2004). “An Imaging Data Model
for Concrete Bridge Inspection.” Advances in Engineering Software, Vol. 35 (8),
473-480.
American Concrete Institute (2013). “NDT Methods for Evaluation of Concrete in
Structures.” Report 228.2R-13, 83 p.
Adhikari, S., Moselhi, O., and Bagchi, A. (2012). “Automated Prediction of Condition
State Rating in Bridge Inspection.” Gerontechnology, Vol. 11 (2), 81-88.
Agdas, D., Rice, J., Martinez, J., and Lasa, I (2015). “Comparison of VI and SHM as Bridge
Condition Assessment Methods.” Performance of Constructed Facilities, Vol. 30,
1-10.
Ahlborn, M., Vaghefi, K., and Harris, D. (2012). “Measurement and communication of
bridge performance with RS technologies.” Transportation Research Board, Vol.
2292 (1), 141-149.
Akula, M., Zhang, Y., Kamat, V., and Lynch, J. (2014). “Leveraging Structural Health
Monitoring for Bridge Condition Assessment.” Proc., Construction Research
Congress, ASCA, Atlanta, Georgia, 1159-1168.
Alampalli, S. (2012). “Special Issue on Non-destructive Evaluation and Testing for Bridge
Inspection and Evaluation.” Bridge Engineering, Vol. (17), 827-828.
Alani, A., Aboutalebi, M., and Kilic, G. (2013). “Integrated health assessment strategy
using NDT for reinforced concrete bridges.” NDT&E International, Vol. 61, 80-
94.
Algernon, D., Hiltunen, R., Ferraro, C., and Ishee, C. (2011). “Rebar detection with cover
meter and ultrasonic pulse echo combined with automated scanning system.”
Transportation Research Board, Vol. (2251), 123–131.
Alt, D., and Meggers, D. (1996). “Determination of bridge deck subsurface anomalies
using IRT and GPR.” Report FHWA-KS-96-2, Kansas, DOT, 18 p.
Amini, A., Melville, B., and Ali, T. (2014). “Local scour at piled bridge piers including an
examination of the superposition method.” Canadian J. Civil Engineering, Vol. 41,
461-471.
Anderson, N., Ismael, A., and Thitimakorn, T. (2007). “Ground-penetrating radar: a tool
for monitoring bridge scour.” Environmental and Engineering Geoscience, Vol. 13,
1-10.
Arndt, R., Jalinoos, F., Cui, J., Huston, D. (2010). “Periodic NDE for bridge maintenance.”
Proc., Structural Faults and Repair Conference, Edimburgh, 1-9.

56
Attary, N., Symans, M., and Nagarajaiah, S., (2013). “Performance Assessment of a
Highway Bridge Structure Employing Adaptive Negative Stiffness for Seismic
Protection.” Proc. Structures Congress, ASCE, 1736-46.
Barnes, C., and Trottier, J. (2000). “Ground-penetrating radar for network-level concrete
deck repair management.” Transportation Engineering, Vol. 126 (3), 257-262.
Bao, Y., Li, H., Sun, X., Yu, Y., and Ou, J. (2013). “Compressive sampling–based data
loss recovery for wireless sensor networks used in civil SHM.” Structural Health
Monitoring, Vol. 12, 78–95.
Bell, E., Peddle, J., and Goudreau, A. (2012). “Bridge Condition Assessment using Digital
Image Correlation and Structural Modeling.” Proc. 6th International IABMAS
Conference, Stresa, Lake Maggiore, Italy, 330-338.
Black, M., Brint, T., and Brailsford, R. (2005). “A Semi-Markov Approach for Modelling
Asset Deterioration.” Operational Research Society, Vol. 56 (11), 1241-1249.
Biondini, F., and Frangopol, D., (2013). “Time effects on robustness and redundancy of
deteriorating concrete structures.” Proc., 11th International Conference on
Structural Safety and Reliability, New York, USA, 1-13.
Bolar, A., Tesfamariam, S., and Sadiq, R. (2013). “Condition assessment for bridges: a
hierarchical ER framework.” Structure and Infrastructure Engineering, Vol. 9 (7),
648-666.
Briaud, L., Hurlebaus, S., Chang, K., Yao, C., Sharma, H., and Yu, O. (2011). “Real-time
monitoring of bridge scour using remote monitoring technology.” Project, Texas
Department of Transportation, Austin, USA.
Brown, D. (1980). “Mechanisms of corrosion of steel in concrete in relation to design,
inspection, and repair of offshore structures.” ACI, Special Publication, Vol. 65,
169-204.
Butt, S., Limaye, V., and Newhook, J., (2007). “Acoustic survey method to map damage
in concrete bridge deck slabs.” Acoustic Emission, Vol. 25, 373-378.
Cady, P. D., and Gannon, E. J. (1992). “Condition Evaluation of Concrete Bridges Relative
to Corrosion.” Procedure Manual, Vol. 8, SHRP-S/FR-92-110, NRC, 124 p.
Chan, T., Ashebo, D., Tam, H., Yu, Y., Chan, T., Lee, P. (2009). “Vertical displacement
measurements for bridges using optical fiber sensors and CCD cameras: A
preliminary study.” Structure Health Monitoring, Vol. 8 (3), 243–249.
Chen, Y., and Fan, P. (2011). “An improved one-dimensional optimization algorithm in
non-probabilistic reliability investigation and its application in bridge assessment.”
Gong Cheng Li Xue, Vol. 28 (5), 21-29.
Chen, Y., Feng, M., and Tan, C. (2009). “Bridge Structural Condition Assessment Based
on Vibration and Traffic Monitoring.” Engineering Mechanics, Vol. 135, 747-758.
Clark, M. R., McCann, D. M., and Forde, M. C. (2003). “Application of infrared
thermography to the non-destructive testing concrete and masonry bridges.”
NDT&E International, Vol. 36 (4), 265–275.
57
Coe, T. and Brandenberg, J. (2011). "P-wave Reflection Imaging of a Cast-In-Steel-Shell
Bridge Foundation." Proc., Geo-Frontiers Conference, Dallas, Texas, 1-9.
Cosser, E., Roberts, G., Meng, X., and Dodson, A. (2014). “The comparison of single
frequency and dual frequency GPS for bridge deflection and vibration monitoring.”
Proc., 11th International Symposium on Deformation Measure. Santorini, Greece,
1-8.
Cruz, J., Roca, J., Escusa, G., and Carvalho, J. (2015). “An alternative system for
measuring displacements in bridges by using displacement transducers.” Proc., 3rd
conference on Smart Monitoring Assess and Rehabilitation of Civil Structures,
Antalya, Turkey, 1-13.
Delatte, N. (2009). “Failure, distress and repair of concrete structures.” Woodhead
Publishing, Boca Raton, Fla, 335 p.
Deng, X., Hu, Y., and Deng, Y. (2014). “Bridge Condition Assessment Using D Numbers”
Scientific World, Vol. 2014, 1-11.
Do Hyung, L., Joonam, P., and Kihak, L. (2011). “Nonlinear seismic assessment for the
post-repair response of RC bridge piers.” Composites: Part B Engineering, Vol. 42
(5), 1318-1329.
Edalatmanesh, R. (2010). “Structural health monitoring model for fatigue assessment in
concrete bridge decks.” PhD. Thesis. Dalhousie University, Canada. 288 p.
Elbehairy, H., Hegazy, T., Elbeltagi, E., and Souki, K. (2006). “Comparison of Two
Evolutionary Algorithms for LCC Optimization of Bridge Deck Repairs.”
Computer-Aided Civil and Infrastructure Engineering, Vol. 21, 561-572.
Elsaid, A, and Seracino, R. (2014). “Rapid assessment of foundation scour using the
dynamic features of bridge superstructure.” Construction and Building Materials,
Vol. 50, 42-49.
Emily, W. (2011). “Artificial Neural Network Models for the Prediction of Bridge Deck
Condition Ratings.” Thesis, Michigan State University, 196 p.
Fisher, M., Chowdhury, N., Khan, A., and Atamturktur, S. (2013). “An evaluation of scour
measurement devices.” Flow Measurement and Instrumentation, Vol. 33, 55-67.
Flintsch, W. and Chen, C. (2004). ‘Soft Computing Applications in Infrastructure
Management.” Infrastructure Systems, Vol. 10 (4), 157-166.
Ghodoosi, F., Bagchi, A., and Zayed, T. (2015). “System-Level Deterioration Model for
Reinforced Concrete Bridge Decks.” Bridge Engineering, Vol. 20 (5), 1-10.
Ghodoosi, F., Bagchi, A., and Zayed, T. (2014). “Reliability-Based Condition Assessment
of an Externally Restrained Bridge Deck Considering Uncertainties in Key Design
Parameters.” Performance of Constructed Facilities, 1-10.
Glisic, B., Inaudi, D., and Nan, C. (2002). “Pile monitoring with fiber optic sensors during
axial compression, pullout, and flexure tests.” Transportation Research Board,
Vol. (1808), 11-20.

58
Gordon, S. J., and Lichti, D. D. (2007). “Modeling Terrestrial Laser Scanner Data for
Precise Structural Deformation Measurement.” Surveying Engineering, Vol. 133,
72–80.
Guan, S., Rice, J., Li, C., and Wang, G. (2014). “Bridge deflection monitoring using small,
low-cost radar sensors.” Proc., Structures Congress, ASCE, Boston, 2853-2862.
Gucunski, N., Kee, S., La, H., Basily, B., Maher, A., and Ghasemi, H. (2015).
“Implementation of a Fully Autonomous Platform for Assessment of Concrete
Bridge Decks RABIT.” Proc., Structure Congress, ASCE, Reston, VA, 367-378.
Gucunski, N., Imani, A., Romero, F., Nazarian, S., Yuan, D., Wiggenhauser, H., and
Shokouhi, P. (2013). “Non-destructive testing to identify concrete bridge deck
deterioration.” Proc., 92nd Meeting, TRB. SHRP 2 Report, 96 p.
Gucunski, N., and Nazarian, S. (2010). “Material Characterization and Condition
Assessment of Reinforced Concrete Bridge Decks by Complementary NDE
Technologies.” Proc., Structure Congress, ASCE, Orlando, Fl., USA, 429-439.
Guldur, B., Yan, Y., and Hajjar, J. (2015). “Condition Assessment of Bridges Using
Terrestrial Laser Scanners.” Proc., Structures Congress, ASCE, Portland, 355-367.
Hasan, M., Setunge, S., and Law, D. (2013). “Deterioration prediction of concrete bridges
with artificial neural network (ANN) derived from discrete condition data.” Proc.,
22nd Australian Conference on the Mechanics of Structure, and Materials, UK, 909-
914.
Hesse, A., Atadero, R., and Ozbek, M. (2015). “Uncertainty in Common NDE Techniques
for Use in Risk-Based Bridge Inspection Planning.” Bridge Engineering, Vol. 20
(11), 1-8.
Higuera, M., Rodriguez, L., Quintela, A., and Cobo, A. (2011). “Fiber optic sensors in
structural health monitoring.” Light wave Technology, Vol. 29 (4), 587–608.
Hinzen, G. (2013). “Support of Macroseismic Documentation by Data from Google Street
View.” Seismological Research Letters, Vol. 84 (6), 982-990.
Hu, X., and Wang, B. (2013). “A Wireless Sensor Network-Based SHM System for
Highway Bridges.” Computer-Aided Civil and Infrastructure Engineering, Vol
(28), 193-209.
Huang, H. (2010). “Artificial neural network model of bridge deterioration.” Performance
of Constructed Facilities, Vol. 24 (6), 597-602.
Huntley, S. A., and Valsangkar, A. J. (2014). “Behaviour of H-piles supporting an integral
abutment bridge.” Canadian Geotechnical J., Vol. 51 (7), 713-734.
Huston, D., Cui, J., and Burns, D. (2011). “Concrete bridge deck condition assessment with
automated multi-sensor techniques.” Structure and Infrastructure Engineering,
Vol. 7 (7), 1-11.
Jannaty, M. Eghbalzadeh, A., and Hosseini, S. (2016). “Using field data to evaluate the
complex bridge piers scour methods.” Canadian J. Civil Engineering, Vol. 43, 218-
225.

59
Kee, S., Oh, T., Popovics, J., Arndt, R., and Zhu, J. (2012). ” Nondestructive Bridge Deck
Testing with Air-Coupled IE and IRT.” Bridge Engineering, Vol. 17, 928-939.
Kishk, M., and Al-Hajj, A. (2002). “A fuzzy model and algorithm to handle subjectivity in
life-cycle costing based decision-making.” Financial Management and Property
Construction, Vol. 5 (1-2), 93–104.
Krause, M., Mayer, K., Friese, M., Milmann, B., Mielentz, F., Ballier, G. (2011). “Progress
in ultrasonic tendon ducts imaging.” European J. of Environmental and Civil
Engineering, Vol. 15 (4), 461-485.
Laory, I., Hadj, N., Trinh, T., and Smith, I. (2012). ” Measurement System Configuration
for Damage Identification of CMS” Bridge Engineering, Vol. 17, 857-866.
Lau, T., Waller, L., Vishnukanthan, K., and Sivathayalan, S. (2012). “Fragility
relationships for probabilistic performance-based seismic risk assessment of bridge
inventories.” Proc., Annual Conference CSCE, Vol. 4, 2765-2774.
Lee, J., Bu, G., Guan, H., Loo, Y. (2015). “Prediction of Long-Term Bridge Performance:
Integrated Deterioration Approach.” Performance of Constructed Facilities, Vol.
29 (3), 591-600.
Lee, J., Guan, H., Loo, Y., and Blumenstein (2012). “Refinement of Backward Prediction
Method for Reliable Artificial Intelligence-Based Bridge Deterioration Modelling.”
Advances in Structural Engineering, Vol. 15 (5), 825-836.
Li, Q., and Wang, K. (2011). “Pavement Smoothness Prediction Based on Fuzzy and Gray
Theories.” Computer-Aided Civil and Infrastructure Engineering, Vol. 26, 69-76.
Liang, T., Chang, W., and Li, F. (2002). “Grey and regression models predicting the
remaining service life of existing RC bridges.” Grey Systems, Vol. 14 (4), 291–310.
Lounis, Z. (2013). “Critical concrete infrastructure: extending the life of Canada’s bridge
network.” Construction Innovation, NRC, Canada. Vol. 18 (1), 34-49.
Lu, C., and Liu, R. (2010). “A model for predicting time to corrosion-induced cover
cracking in RC structures.” Fracture Mechanics of Concrete, Vol. 53 (4), 967-976.
Maekawa, K., and Fujiyama, C. (2013). “Crack Water Interaction and Fatigue Life
Assessment of RC Bridge Decks.” Proc., 5th Biot Conference on Poromechanics,
ASCE, Vienna, Austria, 2280-2289.
Moore, M., Phares, B., Graybeal, B., Rolander, D., and Washer, G. (2001). “Reliability of
visual inspection for highway bridges.” Final Report. No. FHWA-RD-01-020, Vol.
1, Federal Highway Administration (FHWA), 118 p.
Morcous, G., Lounis, Z., and Cho, Y. (2010). “An Integrated System for Bridge
Management Using Probabilistic and Mechanistic Deterioration Models:
Application to Bridge Decks.” KSCE J. Civil Engineering, Vol. 14 (4), 527-537.
Mosavi, A., Sedarat, H., O’Connor, M., Emami, A., and Lynch, J. (2014). “Calibrating a
high-fidelity finite element model of a highway bridge using a multi-variable
sensitivity-based optimization approach” Structure and Infrastructure
Engineering, Vol. 10, 627–42.

60
Moufti, S., Zayed, T., and Abu Dabous, S. (2014). “Defect Based Condition Assessment
of Concrete Bridges: A Fuzzy Hierarchical Evidential Reasoning Approach.”
Proc., Transportation Research Record, 93rd Annual Meeting, 88-96.
Muntasir, A., Billah, L., and Alam, M. (2015). “Seismic fragility assessment of highway
bridges: a state-of-the-art review.” Structure and Infrastructure Engineering, Vol.
11 (6), 804-832.
Nasrollahi, M., and Washer, G. (2014). “Estimating Inspection Intervals for Bridges Based
on Statistical Analysis of National Bridge Inventory Data.” Bridge Engineering,
Vol. 11, 1-11.
Nazarian, S., Baker, R., and Crain, K. (1993). “Development and Testing of a Seismic
Pavement Analyzer.” Report SHRP-H- 375, Strategic HRP, NRC, 169 p.
Newhook, P., and Edalatmanesh, R. (2013). “Integrating reliability and SHM in the fatigue
assessment of concrete bridge decks.” Structure and Infrastructure Engineering,
Vol. 9 (7), 619-633.
Newhook, J., Gaudet, J., and Edalatmanesh, R., (2011). “Investigation of an externally
restrained concrete bridge deck slab on a multi-girder bridge model.” Canadian J.
Civil Engineering, Vol. 38 (2), 233–241.
Nogami, Y., Akiyama, M., and Frangopol, D. (2013). “Seismic design of RC bridge piers
to ensure the post-disaster functionality of road network.” Proc., 11th International
Conference on Structure Safety and Reliability, ICOSSAR, 3581-3586.
Oh, T., Kee, S., Arndt, R., and Popovics, J. S. (2013). “Comparison of NDT methods for
assessment of a concrete bridge deck.” Engineering Mechanics, Vol. 139, 305-314.
Olsen, J., Chen, Z., and Hutchinson, T. (2013). “Optical Techniques for Multiscale Damage
Assessment.” Geomatics, Natural Hazards and Risk, Vol. 4 (1), 49-70.
Ontario Structure Inspection Manual-OSIM, (2008), Ontario Ministry of Transp., 394 p.
O’Connor, S., Zhang, Y., Lynch, J., Ettouney, M., and Linden, G. (2014). “Automated
Analysis of Long-Term Bridge Behavior and Health using a Cyber-Enabled
Wireless Monitoring System.” Proc., SPIE, Vol. 9063, 1-11.
O’Connor, S., Lynch, J., and Gilbert, A. (2012). “Compressed sensing embedded in an
operational wireless sensor network to achieve energy efficiency in monitoring
applications.” Smart Materials and Structure, Vol. 23, 1-17.
Ozbulut, E., and Hurlebaus, S. (2011). “Seismic assessment of bridge structures isolated
by a shape memory alloy/rubber-based isolation system.” Smart Materials and
Structures, Vol. 20 (1), 1-12.
Pailes, B. (2014). “Damage Identification, Progression, and Condition Rating of Bridge
Decks Using Multi-Modal Non-Destructive Testing.” Thesis, Rutgers, the State
University of New Jersey, 184 p.
Palazzo, D., Friedmann, R., Nadal, C., Santos, F. M., Veiga, L., and Faggion, P. (2006).
“Dynamic monitoring of structures using a robotic total station.” Proc., Shaping
the Change XXIII FIG Congress, Munich, Germany, 1-10.

61
Parisa, S., Julia, W., and Herbert, W. (2013). “Detection of Delamination in Concrete
Bridge Decks by Joint Amplitude and Phase Analysis of USA Measurements.”
Bridge Engineering, Vol. 19 (3), 1-11.
Park, K., Kim, S., Park, H., and Lee, K. (2005). “The determination of bridge displacement
using measured acceleration.” Engineering Structure, Vol. 27, 371-378.
Penttala, V. (2009). “Causes and mechanisms of deterioration in reinforced concrete.” In
book: Failure, distress and repair of concrete structures, first Edition, Chapter 1,
Woodhead Publishing, Editors: Norbert Delatte, 3-31.
Pradhan, B., and Bhattacharjee, B. (2009). “Half-Cell Potential as an Indicator of Chloride-
Induced Corrosion Initiation in RC.” Material in Civil Engineering, Vol. 21 (10),
543-552.
Prendergast, L., and Gavin, K. (2014). “A review of bridge scour monitoring techniques”
Rock Mechanics and Geotechnical Engineering, Vol. 6, 138-149.
Raghavan, A., and Cesnik, C. E. (2007). "Review of guided-wave structural health
monitoring." Shock and Vibration Digest, Vol. 39 (2), 91-116.
Ross, J. (2010). “Fuzzy Logic with Engineering Applications.” Book, 3rd edition, John
Wiley and Sons Ltd, UK, 707 p.
Sanayei, M., Phelps, J., and Sipple, J. (2012). “Instrumentation NDT & FEM Updating for
Bridge Evaluation Using Strain measurements.” Bridge Engineering, Vol. 17 (1),
130-138.
Sasmal, S., and Ramanjaneyulu, K. (2009). “Condition evaluation of existing RC bridges
using FAH approach.” Expert Systems with Applications, Vol. 35, 1430–1443.
Saviotti, A. (2014). “Bridge Assessment, Management & Life Cycle Analysis.” Modern
Applied Science, Vol. 8 (3), 167-183.
Scott, M., Rezaizadeh, A., Delahaza, A., and Santos, G. (2003). “A comparison of NDE
methods for bridge deck assessment.” NDT&E International, Vol. 36, 245–255.
Senouci, A., El-Abbasy, M., and Zayed, T. (2014). “Fuzzy-Based Model for Predicting
Failure of Oil Pipelines.” J. Infrastructure Systems, Vol. 20 (4), pp: 4014018 (1-
11).
Seong, K., Taekeum, O., and Popovics, S. (2012). “Non-destructive Bridge Deck Testing
with Air-Coupled IE and IR Thermography.” Bridge Engineering, Vol. 17 (6), 928-
939.
Shafei, B., and Alipour, A. (2014). “Life-Time Risk Assessment of RC Highway Bridges
under Deterioration Processes.” Proc., Structure Congress, No. 249, ASCE,
Boston, 1014-1025.
Sobanjo, J. (1997). “A Neural Network Approach to modeling bridge deterioration.” Proc.,
4th Congress on computing in Civil Engineering, Philadelphia, PA, 623- 626.
Sousa, H., Bento, J., and Figueiras, J. (2014). “Assessment and Management of Concrete
Bridges Supported by Monitoring Data-Based FEM.” Bridge Engineering, Vol. 19,
1-12.

62
Taner, Y., and Caner, A. (2011). “Target damage level assessment for seismic performance
evaluation of two-column RC bridge bents.” Bridge Structures, Vol. 8, 135-146.
Tarighat, A., and Miyamoto, A. (2010). “Fuzzy concrete bridge deck condition rating
method for practical bridge management system.” Expert Systems with
Applications, Vol. 36, 12077–12085.
Tee, B., Bowman, D., and Sinha, C. (1988). “A fuzzy mathematical approach for bridge
condition evaluation.” Civil Engineering Systems, Vol. 5 (1), 17-25.
Tokdemir, B., Ayvalik, C. and Mohammadi, J. (2000). “Prediction of Highway Bridge
Performance by Artificial Neural Networks and Genetic Algorithms.” Proc., 17th
International Symposium on Automation and Rob in Construction. (ISARC), Taipei,
Taiwan, 1-8.
Vaghefi, K., Oats, R., Harris, D., Ahlborn, T., Brooks, C., Endsley, K., Roussi, C., and
Shuchman, R. (2012). “Evaluation of Commercially Available Remote Sensors for
Highway Bridge Condition Assessment.” Bridge Engineering. Vol. 17, 886-895.
Varnavina, A., Khamzin, A., Torgashov, E., Sneed, L., Goodwin, B., and Anderson, N.
(2015). “Data acquisition and processing parameters for concrete bridge deck
condition assessment using GPR.” Applied Geophysics, Vol. 114, 123–133.
Wang, N., Ellingwood, R., and Zureick, H. (2011). “Bridge rating using system reliability
assessment.” Bridge Engineering, Vol. 16 (6), 863–871.
Wang, Y. and Elhag, T., (2008). “Evidential reasoning approach for bridge condition
assessment.” Expert Systems with Applications, Vol. 34 (1), 689–699.
Washer, G., Fenwick, R., Bolleni, N., and Harper, J. (2009). “Effects of environmental
variable on IR imaging subsurface features of concrete bridges.” Transportation
Research Board, 107-114.
Webb, G., Vardanega, P., and Middleton, C. (2015). “Categories of SHM deployments:
Technologies and capabilities.” Bridge Engineering, 1-15.
Wong, K. (2007). “Design of a structural health monitoring system for long-span bridges.”
Structural Infrastructure Engineering, Vol. 3 (2), 169–185.
Wood, J. C., and Rens, K. L. (2006). “Non-destructive testing of the Lawrence Street
Bridge.” Proc., Structures Congress: Structural Engineering and Public Safety, B.
Cross and J. Finke, eds., ASCE, Reston, VA, 1–15.
Xia, P., and Brownjohn, J. (2005). “Bridge Structural Condition Assessment Using
Systematically Validated Finite-Element Model.” Bridge Engineering, Vol. 9, 418-
423.
Yang, B., Wang, M., and Xu, L. (2006). “Environmental impact assessment using the ER
approach.” European J. Operational Research, Vol. 174 (3), 1885:1913.
Yehia. S., Abudayyeh, O., and Nabulsi, S. (2007). “Detection of Common Defects in
Concrete Bridge Decks Using NDE Techniques.” Bridge Engineering, Vol. 12,
215-225.

63
Yong Hao Z., and Kee Ee Ng. (2003). “Evaluation of concrete structures by advances non-
destructive test methods-impact echo, impulse response test and radar survey.”
Proc., NDT-CE conference, Berlin, 1-4.
Zadeh, L. (1965). “Probability theory and fuzzy logic are complementary rather than
competitive.” Technometrics, Vol. 37 (3), 271–276.
Zanjani, Z., and Patnaik, A. (2014). “Finite element modeling of the dynamic response of
a composite RC bridge for SHM.” International J. Advanced Structure
Engineering, Vol. 6 (55), 1-14.
Zarafshan, A., Iranmanesh, A., and Ansari, F. (2012). “Vibration-based method and sensor
for monitoring of bridge scour.” Bridge Engineering, Vol.17 (6), 829-38.
Zhang, L., Zhao, H., OBrien, E., Shao, X., and Tan, C. (2016). “The influence of vehicle–
tire contact force area on vehicle–bridge dynamic interaction.” Canadian J. Civil
Engineering, Vol. 43, 769–772.
Zhang, W., Cai, S., Pan, F., and Zhang, Y. (2014). “Fatigue life estimation of existing
bridges under vehicle and non-stationary hurricane wind.” Wind Engineering
Industrial Aerodynamic, Vol. 133 (10), 135-145.
Zhang, W., and Yuan, H. (2014). “Corrosion fatigue effects on life estimation of
deteriorated bridges under vehicle impacts.” Engineering Structures, Vol. 71, 128-
136.
Zhao, X., Liu, H., Yu, Y., and Xu, X. (2015). “Bridge Displacement Monitoring Method
Based on Laser Projection-Sensing Technology.” Sensors, Vo. 15 (4), 8444-8463.

64
Chapter 3
3. Performance of NDT Techniques in Appraising Condition of
Reinforced Concrete Bridge Decks
3.1 Introduction
As discussed in Chapter 2, the colossal backlog of deteriorated bridges draws attention to
the importance of NDT technologies as potential condition assessment tools. Many NDT
techniques have been developed and proven to be efficient and effective in enhancing the
bridge inspection process and make it faster and reliable. However, the selection of NDT
technique(s) to evaluate the current state of bridge(s) is a decision variable. There are
several research efforts that have attempted to compare several NDT techniques, relying
on physical measures via laboratory or field testing (e.g. Clark et al., 2003; Scott et al.,
2003; Wood and Rens, 2006; Yehia et al., 2007; Algernon et al., 2010; Oh et al., 2103;
Gucunski et al., 2013). These studies focused mainly on the accuracy and reliability of the
employed methods, regardless of other important performance indicators such as
simplicity, speed and cost. Furthermore, while the evaluated NDT technologies were
comparable in some of those studies, some other findings revealed considerable variation
between the NDT quantified results (Hesse et al., 2015).
Therefore, more comprehensive comparative studies need to be conducted to motivate
practical evaluation of NDT methods and their wider implementation in bridge inspection.
There are two strategies by which to carry out the performance evaluation process. The
first strategy is based on quantified data by utilizing the selected techniques and conducting
in-situ inspection on full-scale deteriorated bridges. The second strategy is based on
qualitative data through the response of competent bridge engineers and NDT experts on
an evaluation questionnaire to be formulated for an opinion survey given specific
performance indicators. Although the first approach can provide an objective evaluation,
there is limited quantifiable data available in the open literature on the NDT techniques for
bridges (Hesse et al., 2015). In addition, applying this approach requires substantial field
inspection work and the purchase of equipment for each technology, which is not a viable
option for many transportation agencies. Conversely, the second approach can benefit from

65
the knowledge gained by bridge and NDT engineers. Gathering such information from
experts with extensive experience in NDT can serve as a tool by which to construct a
decision-making procedure. Moreover, expert information cannot be obtained via analysis
of limited inspections conducted either in the field or in the laboratory.
In this Chapter, a rational decision-making framework to evaluate and rank the most
commonly used NDT techniques for detecting defects in RC bridge decks is developed.
The analysis and findings presented herein are accomplished through a literature review
and a structural survey questionnaire. The survey acquired an expert knowledge base
through soliciting broad information about the performance of NDT methods that have
been implemented by several transportation agencies. Although such data is qualitative in
nature, it could indicate the overall performance of the technologies based on a range of
well-defined performance measures that dominate their profession. Evaluating different
technologies in the framework allows for the detection of different types of bridge deck
health indicators. In order to make the evaluation more precise, fuzzy logic theory has
proved its ability to deal effectively with the inevitable uncertainties and subjectivities
inherent in human judgments. Consequently, the Fuzzy Analytical Hierarchy Process
(FAHP) is employed. The Fuzzy Preference Programme (FPP) nonlinear based method is
adopted to determine the relative weights.
Figure 3-1 illustrates the adopted systematic methodology by which to achieve the above-
mentioned objectives. It can be summarized as follows: (1) define and identify the NDT
alternatives to be apprised and ranked; (2) identify a set of flexible multi-attributed
performance criteria and sub-criteria required for the evaluation process; (3) develop an
analytical hierarchy model consisting of the identified performance criteria and sub-
criteria, and the selected NDT alternatives; (4) collect the degree of relative importance for
the different elements in the hierarchy using expert judgement; (5) apply a fuzzification
scale on the pair-wise comparison matrices using linear triangular fuzzy membership
functions; (6) calculate the relative weights of the “fuzzified” pairwise matrices applying
the FPP using Matlab software and check for any inconsistencies in the obtained results;
(7) rank NDT alternatives based on their calculated weights; and (8) validate the achieved
model results with the findings of other comparative studies found in the literature.

66
Figure 3-1: Methodology adopted for apprising and ranking NDT techniques.
3.2 Model Development
3.2.1 Selection of the Performance Measures
The performance measures to evaluate various alternatives could significantly influence
the ranking result. Thus, it is paramount to identify the most critical parameters in a
decision making problem. The five significant performance measures selected for ranking
NDT technologies in this study are: (1) capability of each technology based on its exploited
physical phenomena to detect at least one of the considered defects; (2) speed of applying
each technology; (3) simplicity of applying each technology; (4) accuracy of the obtained
results; and (5) the cost associated with applying each technology. Those parameters are
similar to those adopted in evaluating the results of nine RC bridge deck NDT methods, in
the SHRP2 project. The rationale used for considering only five performance measures is:
“although the description of a particular performance provides a more detailed description
of that performance in terms of a large number of measures, for most technologies there is
either no information regarding a specific performance measure or the measure is not

67
applicable to that particular technology”. In addition, analyses in terms of a smaller number
of performance measures are supposed to be of higher interest and practical value for
implementation by transportation agencies and industry (Gucunski et al., 2013).
To proceed with the ranking process against the five major performance criteria in an
accurate and feasible manner, they were further subdivided into 15 sub-criteria. For
example, the NDT technologies were evaluated against their capabilities for detection of
the most serious types of defects. Based on literature surveys, it appears that active
corrosion of steel reinforcement, propagation of vertical cracks, and delamination are the
most serious types of defects present in RC bridge decks. The rationale behind limiting the
deterioration types into only three categories is: “although there are different causes for
deterioration, in most cases the reasons cannot be determined by NDT technologies; only
their consequences can be determined”. For example, cracking induced by corrosion and
shrinkage will result in material degradation, which can be detected through reduced
velocity, stiffness, and so forth (Gucunski et al., 2013). In addition, from all the possible
deterioration types and mechanisms found in the literature, the three deterioration
categories are believed to be of the highest concern to transportation agencies.
The second performance measure (speed) is an important factor for transportation agencies
and NDT consultants. Thus, the NDT methods were evaluated against: (i) the speed of data
collection; (ii) speed of data analysis; and (iii) importance and potential of the different
technologies to be automated. For the third performance measure (simplicity), successful
application of these methods requires that those collecting and analyzing data have
adequate understanding of the principles of the methods, setting up data acquisition
parameters for optimum results, and interpreting the recorded data. Therefore, the NDT
methods have been evaluated against: (i) the need for experienced operators; (ii)
importance of having an experienced analyzer; and (iii) effects of the environment and
traffic on the process of data collection.
The fourth performance parameter (accuracy) of results obtained depends on the ability of
each NDT technology to accurately detect a specific defect type. Thus, the accuracy sub-
criteria were identified to detect precisely: (i) the extent and severity of delaminations; (ii)

68
depth and width of vertical cracks; and (iii) presence of active corrosion. Finally, the
associated cost of: (i) the required equipment including maintenance costs; (ii) data
collection including traffic control cost; and (iii) data analysis were compared among the
different NDT methods as sub-criteria of the last performance measure (cost).
3.2.2 Selection of the NDT Alternatives
Table 3-1 describes several applicable NDT methods for detecting the selected three
deterioration types. However, based on literature surveys and interviews with bridge
experts suggest that the most commonly used NDT methods in onsite assessment and
evaluation of RC bridge decks are: Impact Echo (IE), Ultrasonic Pulse Echo (UPE), Half-
cell Potential (HCP), Ground Penetrating Radar (GPR), and Infrared Thermography (IRT).
Consequently, they were selected as the NDT alternatives for the comparative analysis in
this study. Since there is no single technology that has the potential to evaluate all the
deterioration mechanisms, the five NDT technologies have been also selected based on
their potential for detecting and evaluating the three deterioration types. For instance, HCP
has a good potential to identify the probability of active corrosion, while GPR evaluates
the conditions for a corrosive environment. UPE and IE have a good potential to detect
vertical cracking, while IE, UPE, and IRT have a good potential to detect delamination.
Table 3-1: Applicable NDT methods to detect specific deterioration types
Defect Applicable NDT Method
Cracks and Voids
Acoustic Emission
Impact Echo
Ultrasonic Pulse Echo
Infrared Thermography
Impulse Response
Ultrasonic Surface Waves
Rebar Corrosion
Half-Cell Potential (corrosion probability)
Ground Penetrating Radar (corrosive environment)
Electrical Resistivity (corrosion probability)
Polarization Resistance (corrosion rate)
Delamination
Impact Echo
Ultrasonic Pulse Echo
Infrared Thermography
Ultrasonic Surface Waves
Impulse Response

69
3.2.3 Construction of Fuzzy Analytical Hierarchy Model
Multi-criteria decision-making methods such as analytic hierarchy process, multi-attribute
utility theory, and decision trees have the ability to account for multiple decision criteria
and address increasing complexity and associated uncertainties by providing clear and
easily interpretable results. The analytic hierarchy process (AHP) has been favored in
extensive application areas, such as bridge management, and thus gained ground against
conventional assessment methods. The AHP, developed by Saaty (1980), is based on
modeling decision problems into multiple layers of criteria and sub-criteria to form a
hierarchy and provide decision makers a systematic way to evaluate multiple decision
alternatives. This is followed by constructing a series of pairwise comparisons among the
model variables in the same layer, using the experts’ judgments, to decide on their relative
importance/influence. The pairwise comparisons are performed using a 9-point
fundamental scale of absolute values that represent the strength of judgements. The AHP
uses an eigenvalue method to determine the normalized weights of all criteria and sub-
criteria in the hierarchy where the intensities of the judgements are assembled in reciprocal
matrices. The AHP process has the advantage of allowing the decision maker to perform
consistency checks for the provided judgement regarding the relative importance among
the decision-making elements. However, the rankings produced by AHP are arbitrary
because they are produced by a subjective response. The use of the discrete scale of 1 to 9
does not account for the uncertainty and imprecision associated with judgment during the
pairwise comparison process (Sasmal and Ramanjaneyulu, 2008).
The natural top-down approach of the AHP method was utilized to construct the proposed
model as illustrated in Fig. 3-2. The model was organized into a four-level hierarchy
structure, which captures the performance parameters along with the evaluated NDT
alternatives. The first level of the hierarchy is the overall goal of the analysis process. The
second level contains the main performance measures needed to achieve the overall goal.
The third level of the hierarchy holds the sub-criteria to be used for evaluating the NDT
alternatives which were added at the bottom level. The model requires relative importance
weights to be assigned to the assessment elements, which were collected from bridge and
NDT experts and analyzed as described subsequently.

70
Figure 3-2: Hierarchy framework for ranking NDT techniques.
The FST, presented in Chapter 2 is mostly helpful when human judgment is predominant,
as is the case with decision making in the evaluation of alternatives. Thus, the FST was
introduced for the AHP to make up the deficiency of the conventional AHP modelling,
referred to as FAHP, which has been utilized and discussed by several researchers (e.g.
Chang, 1996; Huang et al., 2008; Bhattacharyya et al., 2011; Chang and Lee, 2012). The
application of FAHP enables taking into account group assessments and can deal
effectively with the inherent fuzziness and uncertainty in judgment during the pairwise
comparison process. There are various processing techniques based on the source of the
fuzziness or uncertainty in the data and analysis requirements (Wang and Elhag, 2008).

71
Fuzzy numbers can be represented by its membership function ranging between 0 and 1.
When comparing two elements, the uncertain numerical ratio is expressed in a fuzzy
manner. Membership functions can take various shapes. Linear approximations, such as
triangular or trapezoidal fuzzy numbers are frequently used in construction applications
(Sasmal and Ramanjaneyulu, 2008). The analysis of the fuzzified comparison matrices that
result from the application of the “fuzzification” scale has been the point of interest for
many researchers (e.g. Mikhailov, 2004; Sasmal and Ramanjaneyulu, 2008; Huo et al.,
2011). For instance, Van Laarhoven and Pedrycz (1983) suggested a fuzzy logarithmic
least squares method to obtain the fuzzy weights from a triangular fuzzy comparison
matrix. Buckley (1985) utilized the geometric mean method to calculate fuzzy weights.
Chang (1996) proposed an extent analysis method, which derives crisp weights for fuzzy
comparison matrices. Csutora and Buckley (2001) developed the Lambda-Max method,
which is the direct fuzzification of the well-known 𝑘𝑚𝑎𝑥 method. Mikhailov (2004)
developed a fuzzy preference programming method, which also derives crisp weights from
fuzzy comparison matrices using logarithmic nonlinear programming. Srdjevic (2005)
proposed a multicriteria approach for combining prioritization methods within the AHP,
including additive normalization, eigenvector, weighted least-squares, logarithmic least-
squares, and logarithmic goal programming (Zhou, 2012). These methods have
unquestionable potential in fuzzy modelling (Jakiel and Fabianowski, 2015).
3.2.4 Data Collection
3.2.4.1 Survey Questionnaire Design
A structured survey questionnaire was constructed to serve the purpose of the evaluation
analysis in this study. The survey targeted the participation of a wide spectrum of bridge
experts from Canadian ministries and US departments of transportation, NDT consultants,
and researchers. The domain includes bridge and NDT professionals from senior engineers
and project managers to project engineers and NDT technicians. The process was initiated
by soliciting 74 experts to participate in the survey and requesting them to indicate which
NDT techniques they were involved with. While 56 experts welcomed receiving the
questionnaire, only 35 experts were finally considered and invited. The reason was to
ensure that: (1) the experts are working in different departments; and (2) the experts have

72
experience with at least three of the evaluated techniques. The questionnaire was then
distributed using an online survey website service for ease of data collection and to
minimize the survey time. Of the 35 experts, a total of 27 responses were completed and
received, a 77% response rate. The relatively high response rate is a good indicator of
adequate survey design and the respondents’ interest in NDT techniques. This response
rate also complies with statistical analysis conducted by Baruch (1999), where a reasonable
response rate for an academic research was found to be about 60 +/- 20 (%).
The questionnaire consisted of four sections: (1) the first section aimed to obtain general
information of the participants’ contact information, organization and experience in the
bridge and NDT community; (2) the second section aimed to identify the frequency and
type of NDT method(s) being used in their bridge schemes; (3) to identify the significance
of the factors affecting the successful application of NDT methods, the third section was
divided into two parts: part (a) aimed to seek the degree of importance between the five
main performance parameters with respect to the selection of the NDT method, while part
(b) sensed the degree of importance between the sub-criteria with respect to the related
main performance parameter; and (4) the fourth section aimed to seek the degree of
importance of employing the selected NDT alternatives with respect to each of the fifteen
sub-criteria parameters.
For statistical analysis of the respondents, Table 3-2 illustrates a summary of information
based on the participants’ organizations and their experience. Three organization groups
were created: the first group included those bridge experts from transportation agencies
and represent an overall participation of 44%; the second group included bridge experts
from NDT contractors and consultants and represents 41% participation; and the third
group includes researchers, who are interested in NDT development, with an overall
participation of 15%. The gathered respondents from the three groups agreed on the relative
importance of the criteria and sub-criteria. With respect to the participants’ experience, the
highest participant rate belongs to senior bridge professionals with 41% responses,
followed by bridge managers who have 15 to 20 years of experience with 26% responses,
while 18% and 15% of the participants have a total of 10 to 15 years and 5 to 10 years of
experience, respectively in the bridge and NDT community.

73
Table 3-2: Organization and experience of participants in the survey questionnaire
Organization
Invitation
(35 total
experts)
No (%)
Participation
(27 total
experts)
No (%)
Experience of Participants
Over 20
Years
No (%)
15 to 20
Years
No (%)
10 to 15
Years
No (%)
5 to 10
Years
No (%)
Transport. Agencies 16 (46%) 12 (44%) 6 (22%) 3 (11%) 2 (7%) 1 (4%)
NDT Consultants 13 (37%) 11 (41%) 4 (15%) 3 (11%) 1 (4%) 3(11%)
Researchers 6 (17%) 4 (15%) 1 (4%) 1 (4%) 2 (7%) 0
Overall 41 % 26 % 18 % 15 %
Table 3-3 illustrates a summary regarding the frequency and type of NDT method(s) being
used by the participants in their bridge schemes. The HCP was reported as the most utilized
method with a percentage of 59% among the participants, followed by the IE method with
48%, and the GPR method with 37%. IRT and UPE methods received relatively low share
of utilization, with percentages of 22 and 11, respectively. It should be noted that each
participant utilized more than one NDT technique in his/her projects. The responses also
indicated that only 14% of the experts are utilizing NDT on a frequent basis, while NDT
methods were utilized for detailed investigations and for advanced assessments by 40%
and 46%, respectively. According to most of the commonly used bridge inspection
procedures, the detailed investigation focuses on those members for which adequate safety
was not confirmed by the preliminary evaluation and the advanced assessment only to be
conducted when a bridge component has major consequences in terms of risk. These
figures indicate the importance of incorporating NDT techniques in existing BMSs and
bridge inspection manuals.
Table 3-3: Results of respondents using NDT techniques
NDT Technique
Respondents
(27 total
experts)
No (%)
Frequency of Using NDT Technique
Frequently
Used
No (%)
Detailed
Investigation
No (%)
Advanced
Assessment
No (%)
Impact Echo (IE) 13 (48%) 2 (7%) 4 (15%) 7 (26%)
Ultrasonic Pulse Echo (UPE) 3 (11%) 0 2 (7%) 1 (4%)
Half-Cell Potential (HCP) 16 (59%) 3 (11%) 6 (22%) 7 (26%)
Ground Penetrating Radar (GPR) 10 (37%) 2 (7%) 3 (11%) 5 (19%)
Infrared Thermography (IRT) 6 (22%) 0 4 (15%) 2 (7%)
Overall 14 % 40% 46 %

74
3.2.4.2 Pairwise Comparison Matrices
The experts were asked to provide the relative importance among the selected performance
parameters, which is based on the 9-point Saaty’s linguistic scale for importance (1 being
the least favorable and 9 being the most favorable). For example, the experts were asked
to provide the degree of importance of accuracy compared with speed, simplicity, and cost
when selecting a technology. Another example is to provide the degree of importance for
utilizing the IE method if compared with utilizing the IRT method with respect to their
capabilities of detecting the extent and severity of delamination, and the degree of
importance of utilizing the GPR if compared with utilizing HCP with respect to their
potential in detecting the active corrosion. Figure 3-3 illustrates a snapshot for a survey
question to compare the capability performance parameter with the other main performance
measures in the evaluation process of NDT methods. The degree of relative importance
gathered from the questionnaire responses was utilized to construct a total of 567 pairwise
comparison matrices using an Excel worksheet.
Figure 3-3: Snapshot of a question in the survey questionnaire.

75
3.2.5 Data Analysis
3.2.5.1 Fuzzification of Collected Data
A fuzzy set is characterized by a membership function ranging between 0 and 1. A
triangular fuzzy number (TFN) M, as illustrated in Fig. 3-4 can be represented as (l, m, u),
which denote the smallest possible value, the most promising value, and the largest possible
value, respectively, that describe a fuzzy number. Each TFN has linear representations on
its left and right side such that its membership function can be defined as per Eq. 3-1.
𝑢𝑀 (𝑥) = {(𝑥 − 𝑙)/(𝑚 − 𝑙) 𝑙 ≤ 𝑥 ≤ 𝑚
(𝑢 − 𝑥)/(𝑢 − 𝑚) 𝑚 ≤ 𝑥 ≤ 𝑢 0 𝑂ℎ𝑒𝑟𝑤𝑖𝑠𝑒
Eq. 3-1
The triangular fuzzy scale, presented in Table 3-4, was adopted for the fuzzification
process where the difference between most probable (actual response received) with the
upper and lower values is equal to one. The fuzzification scale was applied to all of the
constructed 567 pairwise comparison matrices. Thus, for a (n x n) comparison matrix
shown below, there are (n + 1) variables representing n weights {𝑥(1), 𝑥(2), … 𝑥(𝑛)} and
a consistency index {𝜆 = 𝑥(𝑛 + 1)}.
{
(𝑙11,𝑚11, 𝑢11) (𝑙12,𝑚12, 𝑢12)(𝑙21, 𝑚21, 𝑢21) 𝑙22, 𝑚22, 𝑢22
⋯ ⋯⋯ ⋯
⋯ (𝑙1𝑛, 𝑚1𝑛, 𝑢1𝑛)⋯ (𝑙2𝑛, 𝑚2𝑛, 𝑢2𝑛)
⋮ ⋮ ⋮𝑙𝑛1,𝑚𝑛1, 𝑢𝑛1 (𝑙𝑛2, 𝑚𝑛2, 𝑢𝑛2) ⋯ ⋯ ⋯ (𝑙𝑛𝑛 , 𝑚𝑛𝑛, 𝑢𝑛𝑛)
}
Table 3-4: Linguistic comparison scales for importance
Linguistic scale for
importance
Triangular
fuzzy scale
Triangular fuzzy
reciprocal scale
Equally Important (1,1,1) (1,1,1)
Intermediate Level (1,2,3) (1/3,1/2,1)
Moderately Important
Intermediate Level
Important
Intermediate Level
Very Important
Intermediate Level
Extremely Important
(2,3,4)
(3,4,5)
(4,5,6)
(5,6,7)
(6,7,8)
(7,8,9)
(8,9,9)
(1/4,1/3,1/2)
(1/5,1/4,1/3)
(1/6,1/5,1/4)
(1/7,1/6,1/5)
(1/8,1/7,1/6)
(1/9,1/8,1/7)
(1/9,1/9,1/8)

76
Figure 3-4: A triangular fuzzy number M.
3.2.5.2 Relative Importance Weights
The Fuzzy Preference Programing (FPP), can acquire the consistency values and calculates
weights from a triangular fuzzy pairwise comparison matrix using a fuzzy prioritization
approach. Therefore, the FPP method was adopted in this study as a reasonable and
effective means to calculate the relative weights of the identified performance criteria and
sub-criteria and also for the NDT alternatives with respect to each sub-criterion. The
Matlab software has excellent performance in matrix operations and data processing and
thus, is suitable for solving fuzzy decision-making problems. Zhou (2012) implemented
the Mikhailov’s fuzzy prioritization approach and proposed a Matlab code to achieve the
weights of fuzzy pairwise comparison matrices using the FPP method. The proposed
Matlab code was modified and adopted in the analysis process to acquire the weights of
fuzzy pairwise comparison matrices as described below.
Considering a set F of fuzzy comparison judgments represented as triangular fuzzy
numbers �̃�𝑖𝑗, we need to derive a crisp priority vector 𝑤 = (𝑤1, 𝑤2, ……𝑤𝑛)𝑇, such that
the priority ratios 𝑤𝑖 𝑤𝑗⁄ are approximately within the scopes of the initial fuzzy judgments.
𝐹 = (�̃�𝑖𝑗) 𝑚 ≤ 𝑛(𝑛 − 1)/2 �̃�𝑖𝑗 = (𝑙𝑖𝑗, 𝑚𝑖𝑗, 𝑢𝑖𝑗) Eq. 3-2
𝑙𝑖𝑗 ≤̃𝑤𝑖
𝑤𝑗≤̃ 𝑢𝑖𝑗 𝑖 = 1,2, … 𝑛 − 1 𝑗 = 2,3, … 𝑛 𝑗 > 𝑖 Eq. 3-3

77
Each crisp priority vector w satisfies the double-side inequality (Eq. 3.3) with some degree,
which can be measured by a membership function, linear with respect to the unknown
ratio 𝑤𝑖 𝑤𝑗⁄ as shown in Eq. 3-4, and is linearly increasing over the interval (−∞,𝑚𝑖𝑗) and
linearly decreasing over the interval (𝑚𝑖𝑗, ∞). The function takes negative values when
𝑤𝑖 𝑤𝑗⁄ < 𝑙𝑖𝑗 or 𝑤𝑖 𝑤𝑗⁄ > 𝑢𝑖𝑗, and has a maximum value 𝑢𝑖𝑗 = 1 at 𝑤𝑖 𝑤𝑗⁄ > 𝑚𝑖𝑗. Over the
range (𝑙𝑖𝑗, 𝑢𝑖𝑗), the function coincides with the fuzzy triangular judgment
(𝑙𝑖𝑗, 𝑚𝑖𝑗 , 𝑢𝑖𝑗).
𝑢𝑖𝑗 (𝑤𝑖
𝑤𝑗) = {
(𝑤𝑖 𝑤𝑗)−𝑙𝑖𝑗⁄
𝑚𝑖𝑗−𝑙𝑖𝑗,𝑤𝑖
𝑤𝑗≤ 𝑚𝑖𝑗
𝑢𝑖𝑗−(𝑤𝑖 𝑤𝑗⁄ )
𝑢𝑖𝑗−𝑚𝑖𝑗,𝑤𝑖
𝑤𝑗≥ 𝑚𝑖𝑗
Eq. 3-4
The solution to the prioritization problem by the FPP method is based on two main
assumptions. The first one requires the existence of non-empty fuzzy feasible area P on the
(𝑛 − 1) dimensional simplex 𝒬𝑛−1, defined as an intersection of the membership
functions, similar to (Eq. 3-4) and the simplex hyperplane (Eq. 3-5).
𝒬𝑛−1 = {(𝑤1, 𝑤2, …… 𝑤𝑛)|𝑤𝑖 > 0, ∑ 𝑤𝑖 = 1𝑛𝑖=1 } Eq. 3-5
The membership function of the fuzzy feasible area is given by 𝑢𝑃(𝑤), as shown in Eq. 3-
6. If the fuzzy judgements are very inconsistent, then 𝑢𝑃(𝑤) could take negative values for
all normalized priority vectors 𝑤 ∈ 𝒬𝑛−1.
𝑢𝑃(𝑤) = min𝑖𝑗{𝑢𝑖𝑗(𝑤)|𝑖 = 1,2, …𝑛 − 1; 𝑗 = 2,3, … 𝑛; 𝑗 > 𝑖} Eq. 3-6
The second assumption of the FPP method specifies a selection rule, which determines a
priority vector, having the highest degree of membership in the aggregated membership
function (Eq. 3-6). It can be noted that 𝑢𝑃(𝑤) is a convex set, so there is always a priority
vector 𝑤∗ ∈ 𝒬𝑛−1 that has a maximum degree of membership:

78
𝜆⋆ = 𝑢𝑃(𝑤⋆) = max
𝑤∈ 𝒬𝑛−1min𝑖𝑗{𝑢𝑖𝑗(𝑤)} Eq. 3-7
The maximum prioritization problem in Eq. 3-7 can be represented as:
𝑀𝑎𝑥 𝜆𝜆 ≤ 𝑢𝑖𝑗(𝑤), 𝑖 = 1,2, … 𝑛 − 1; 𝑗 = 2,3, … 𝑛; 𝑗 > 𝑖
∑ 𝑤𝑘 = 1, 𝑤𝑘 > 0, 𝑘 = 1,2, … 𝑛𝑛𝑘=1
Eq. 3-8
Taking the specific form of the membership functions (Eq. 3-4) into consideration, the
problem (Eq. 3-8) can be further transformed into a bilinear program of the type:
𝑀𝑎𝑥 𝜆(𝑚𝑖𝑗 − 𝑙𝑖𝑗)𝜆 𝑤𝑗 − 𝑤𝑖 + 𝑙𝑖𝑗𝑤𝑗 ≤ 0,
(𝑢𝑖𝑗 −𝑚𝑖𝑗)𝜆 𝑤𝑗 + 𝑤𝑖 − 𝑢𝑖𝑗𝑤𝑗 ≤ 0,
∑ 𝑤𝑘 = 1, 𝑤𝑘 > 0, 𝑘 = 1,2, … 𝑛𝑛𝑘=1
𝑖 = 1,2, … 𝑛 − 1; 𝑗 = 2,3, … 𝑛; 𝑗 > 𝑖
Eq. 3-9
The optimal solution to the non-linear problem above (𝑤⋆, 𝜆⋆) can be obtained by
employing some appropriate numerical method for non-linear optimization. The optimal
value 𝜆∗, if it is positive (the maximum value is one), indicates that all solution ratios satisfy
the fuzzy judgment completely, which means that the initial set of fuzzy judgments is rather
consistent. A negative value of 𝜆∗ shows that the solutions’ ratios approximately satisfy all
double-side inequalities (Eq. 3-3). Therefore, the optimal value 𝜆∗ , can be used for
measuring the consistency of the initial set of fuzzy judgments.
Generally, optimization deals with maximizing or minimizing an objective function and
determining the optimum values for a set of variables so that a set of constraints are met.
The non-linear optimization problem was solved by employing a numerical method in
Matlab software. The optimization function “fmincon” is a medium-scale algorithm which
attempts to find a constrained minimum of a scalar function of several variables x (i)
starting at an initial estimate, generally referred to as constrained nonlinear optimization.

79
It was utilized to acquire the weights where the objective function and the constraints have
different formats based on the matrices’ sizes. The weight for each variable x (i) takes its
value in the range of [0, 1] and its sum is equal to 1, while the consistency index λ takes its
values in the range [-, 1]. The optimization process was created and when the total
constraints of a matrix are satisfied, the algorithm identifies the weights of its variables and
considers the results are acceptable if there is consistency.
The full expression of the function is fmincon (networkf, X0, A, B, Aeq, Beq, VLB, VUB,
nonlcon) where networkf represents the objective function and is predefined in the program
file as f (x) = x (n + 1); X0 is the initial estimates of the variables; A and B are the two
coefficients of linear inequality constraint and can be ignored or replaced with two empty
arrays [ ] in the FPP; Aeq and Beq are the two coefficients of linear equality constraint
Aeq*x = Beq, as the sum of local weights should be one, they are represented by Aeq = [1
1 … 1 0], and Beq = [1]; VLB is the lower bound of the variables and is represented by [0;
0;…; 0; -inf] because all the local weights have a lower bound of zero, and the lower bound
of the consistency index is negative infinity; VUB is the upper bound of the variables and
is represented by empty array [ ] since all the upper bounds are subject to the constraints;
and the nonlcon is the nonlinear constraints, including non-linear inequality constraint and
non-linear equality constraint for the cells above the diagonal as the triangular fuzzy
comparison matrix is symmetric, and thus, for a (3 x 3) fuzzy comparison matrix, only
three elements need to be taken into account, while for a (5 x 5) fuzzy comparison matrix,
ten elements need to be considered to identify the matrix constraints.
3.3 Model Implementation
In order to implement the presented fuzzy analysis model, Table 3-5 illustrates a fuzzified
pairwise comparison sample of one respondent for the main performance parameters with
respect to the selection of the NDT method. Each cell in the matrix has three values
obtained from the fuzzification process. The matrix has 6 variables in linear equality
constraint (5 local weights and a consistency index). According to the FPP method, every
triangular fuzzy number (𝑙𝑖𝑗 𝑚𝑖𝑗 𝑢𝑖𝑗) was first transformed into nonlinear two double-
side inequality constraints as represented in Equations 3-10 and 3-11.

80
(𝑚𝑖𝑗 − 𝑙𝑖𝑗) ∗ 𝑥(𝑛 + 1) ∗ 𝑥(𝑗) − 𝑥(𝑖) + (𝑙𝑖𝑗) ∗ 𝑥(𝑗) ≤ 0; Eq. 3-10
(𝑢𝑖𝑗 − 𝑚𝑖𝑗) ∗ 𝑥 (𝑛 + 1) ∗ 𝑥 (𝑗) + 𝑥(𝑖) − (𝑢𝑖𝑗) ∗ 𝑥(𝑗) ≤ 0 Eq. 3-11
Table 3-5: Pairwise comparison matrix of main performance parameters with
respect to the selection of NDT technique
Pairwise Comparison Among The Main Criteria
Main Criteria CAP SP SIM ACC CO
CAP 1,1,1 4,5,6 4,5,6 1/4,1/3,1/2 2,3,4
SP 1/6,1/5,1/4 1,1,1 1,1,1 1/9,1/9,1/8 3/8,3/5,3/2
SIM 1/6,1/5,1/4 1,1,1 1,1,1 1/9,1/9/1/8 3/8,3/5,3/2
ACC 2,3,4 8,9,9 8,9,9 1,1,1 8,9,9
CO 1/4,1/3,1/2 2/3,5/3,8/3 2/3,5/3,8/3 1/9,1/9,1/8 1,1,1
The weights of the matrix were calculated as follows: The below main program
“NDTcriteria.m” file was constructed in Matlab where the file name was chosen so that it
can easily be used when called:
[X, fval] = fmincon (‘NDTfcriteria’, X0, [ ], [ ], Aeq, Beq, VLB, VUB,
‘NDTnonlconcriteria’, OPT)
X0 = [0.3; 0.2; 0.2; 0.1; 0.2; 1]; Aeq = [1 1 1 1 1 0]; Beq = [1]; VLB = [0; 0; 0; 0; 0; -inf];
and VUB = [ ];
Where [X, fval] are the optimal solution for the local weights of the matrix and the optimal
value of the consistency index, respectively. The corresponding objective function file
“NDTfcriteria.m” and the nonlinear constraint function file “NDTnonlconcriteria.m” were
predefined by:
Function f = NDTfcriteria (x); f = x (6); Function [C, Ceq] = NDTnonlconcriteria (x);
Where the value of function f is related to n, the nonlinear inequality constraint ‘C’ is
presented as per Eq. 3-10 and 3-11, and the nonlinear equality constraint Ceq is represented
by an empty array [ ] as there is no nonlinear equality constraint for the FPP method. Thus,
the Function [C, Ceq] was given by:

81
C = [(5-4)*x (6)*x (2) – x (1) + 4*x (2); (6-5)*x (6)*x (2) + x (1) - 6*x (2); (5-4)*x (6)*x
(3) – x (1) + 4*x (3); (6-5)*x (6)*x (3) + x (1) - 6*x (3); (1/3-1/4)*x (6)*x (4) – x (1) +
1/4*x (4); (1/2-1/3)*x (6)*x (4) + x (1)1/2*x (4); (3-2)*x (6)*x (5) - x (1) + 2*x (5); (4-3)*x
(6)*x (5) + x (1) - 4*x (5); (1-1)*x (6)*x (3) - x (2) +1*x (3); (1-1)*x (6)*x (3) + x (2) - 1*x
(3); (1/9-1/9)*x (6)*x (4) - x (2) + 1/9*x (4); (1/8-1/9)*x (6)*x (4) + x (2) -1/8*x (4); (3/5-
3/8)*x (6)*x (5) - x (2) + 3/8*x (5); (3/2-3/5)*x (6)*x (5) + x (2) - 3/2*x (5); (1/9-1/9)*x
(6)*x (4) - x (3) + 1/9*x (4); (1/8-1/9)*x (6)*x (4) + x (3) - 1/8*x (4); (3/5-3/8)*x (6)*x (5)
- x (3) + 3/8*x (5); (3/2-3/5)*x (6)*x (5) + x (3) - 3/2*x (5); (9-8)*x (6)*x (5) - x (4) + 8*x
(5); (9-9)*x (6)*x (5) + x (4) - 9*x (5);];
Ceq = [ ];
The results after running the program are shown in Fig. 3-5, where the local weights x (1),
x (2), x (3), x (4), x (5) are 0.2572, 0.0614, 0.0614, 0.5526, and 0.0675, respectively. The
consistency index x (6) is 0.1888 > 0, which means the fuzzy comparison matrix has a good
consistency, and the results are acceptable.
Figure 3-5: Weights and consistency index of the comparison matrix in Table 3-5.

82
3.4 Evaluation and Ranking of NDT Techniques
The local weights were obtained for all participants’ fuzzified pairwise comparisons, and
then the calculated weights were averaged to obtain the final local weights for the main
performance criteria, sub-criteria and NDT alternatives. The obtained weights were
analyzed in order to check for inconsistency and unrealistic responses. The percent
difference between the relative weights obtained from each of the gathered responses and
the average weight was calculated. As a result, two of the questionnaires were discarded
due to the high percent difference. The final global weights for the sub-criteria were
obtained by multiplying the weights of the main performance criteria by the sub-criteria
local weights. The final score for each NDT alternative was then obtained by summing the
results of multiplying the weights of each method by the global weights of all sub-criteria.
Table 3-6 illustrates all the achieved weights and will be discussed below.
Table 3-6: Performance measures weights and ranking of NDT techniques
Pairwise Comparison Weights NDT Alternatives
Main
Criteria
Main
Criteria
Weight
Sub-Criteria
Sub-
Criteria
Weight
IE UPE GPR IRT HCP
Capability 0.40
Delamination 0.18 0.40 0.20 0.10 0.30 0
Vertical Cracks 0.07 0.45 0.55 0 0 0
Steel Corrosion 0.15 0 0 0.40 0 0.60
Speed 0.09
Data Collection 0.05 0.17 0.15 0.24 0.24 0.20
Data Analysis 0.03 0.15 0.14 0.21 0.23 0.27
Potential for Automation 0.01 0.20 0.20 0.20 0.20 0.20
Simplicity 0.06
Experience Operator 0.02 0.15 0.12 0.20 0.28 0.25
Experience Analyzer 0.03 0.15 0.12 0.20 0.25 0.28
Environment Effect 0.01 0.23 0.18 0.24 0.15 0.20
Accuracy 0.32
Extent of Delamination 0.13 0.38 0.22 0.13 0.27 0
Depth/Width of Cracks 0.08 0.45 0.55 0 0 0
Presence of Corrosion 0.11 0 0 0.40 0 0.60
Cost 0.13
Equipment 0.03 0.18 0.12 0.23 0.21 0.26
Data Collection 0.06 0.17 0.14 0.21 0.23 0.25
Data Analysis 0.04 0.13 0.10 0.21 0.26 0.30
SUM 1.00 1.00
Total Score 0.23 0.18 0.21 0.16 0.22
83
3.4.1 Weights of Main Performance Measures
As discussed above, each performance measure was assigned a weight value based on its
importance in ranking the NDT alternatives. It can be observed from Table 3-6 that the
capability of the NDT techniques to detect specific deterioration mechanism(s) attained the
highest weight of 40%, among all the five performance measures considered in this study.
Indeed, the participants considered “capability” as the most fundamental and important
performance measure for the evaluation of any NDT technology. This is because if a certain
defect cannot be detected by a given technology, the other four performance measures are
meaningless. Since the level of accuracy in the inspection result of any technology can be
used to more easily assess changes in the condition of a bridge deck over its service life,
the parameter “accuracy” obtained the second weight value of 32%. This emphasizes that,
without a high level of accuracy in detecting defects in bridge decks, remediation and
rehabilitation cannot be accomplished.
The performance parameter “cost” obtained the third priority after the capability and
accuracy parameters with a weight value of 13%. This is because the cost/effectiveness
ratio of a technique could directly affect its employment. In addition, a low cost technique
may be compelling for its application before more expensive means are employed. The
performance parameter “speed” of investigation using a technique is an advantage that
could add value for a technique. Thus, it obtained the fourth weight value of 9%. Lastly,
the performance parameter “simplicity” of employing a technique obtained a weight value
of 6%. Simplicity could be advantageous for a technique as long as it provides comparable
information to that achieved by other more sophisticated techniques. For a precise ranking,
the NDT methods were evaluated below with the perspective of the sub-criteria’s of the
main performance measures.
3.4.1.1 Evaluation of NDT Techniques from Perspective of Capability
The NDT techniques were evaluated in perspective of their capability to detect specifically
three types of defects: delamination, vertical cracking, and steel corrosion. The participants
considered the ability of detecting delamination as the primary significant factor, thus it
attained the highest weight value of 45%. The ability of the techniques to evaluate the

84
corrosive environment was the second significant factor with 38% weight value, while the
ability to detect vertical cracks obtained the least weight value of 17%. The achieved
weights of the different technologies with respect to these three factors are illustrated in
Fig. 3-6. Comparing the achieved results confirms that: (i) four technologies have the
capability of detecting delamination. The highest weight assigned for the IE method
followed by the IRT and UPE methods and lastly the GPR method; (ii) the two methods
having capability of detecting vertical cracks were UPE which obtained the highest weight,
followed by the IE method; and (iii) two methods have capability to evaluate active
corrosion of steel reinforcement: HCP and GPR, respectively. This complies with the
physics of these methods, making them attractive in bridge deck evaluation.
Figure 3-6: Evaluation of NDT technologies with respect to their capability of
specific defect detection.
3.4.1.2 Evaluation of NDT Techniques from Perspective of Speed
The NDT techniques were also evaluated in view of their speed during data collection and
processing of the collected raw data, as well towards their potential to have an automation
process. The participants considered the speed of data collection as the primary significant
factor, which thus attained the highest weight value of 55%. The importance of this factor
likely reflects the need to reduce the cost of traffic control and the inconveniences

85
associated with traffic interruptions during the data acquisition process. The speed of data
analysis was the second significant factor with 30% weight value, while the potential of
automation obtained the least weight value of 15%. The evaluation results of the five NDT
techniques with respect to these three performance factors (Fig. 3-7 ) indicate that: (i) the
GPR and IRT methods obtained the highest data collection weight since they are the fastest
technologies as they can collect data in a continuous manner, while other technologies
depend on spot measurements; (ii) HCP was identified as the technology that provides the
highest speed of data analysis and interpretation because it indicates the likelihood of
corrosion activity directly at the time of test; and (iii) based on the judgment of the
participants; all the technologies have equal potential of automation and hence obtained
equal weights.
Figure 3-7: Evaluation of NDT technologies with respect to their speed.
3.4.1.3 Evaluation of NDT Techniques from Perspective of Simplicity
The NDT techniques were evaluated in view of the required expertise for data collection
and analysis in addition to the effects of environmental conditions and traffic on the data
acquisition process. The participants considered the expertise for data analysis as the
primary significant factor, thus it attained the highest weight value of 45%. The expertise
for data collection was the secondary significant factor with 40% weight value, while the

86
effect of environmental conditions and traffic obtained the least weight value of 15%. The
achieved weights of the different technologies with respect to these three factors are
illustrated in Fig. 3-8. Comparing the achieved results confirms that: (i) IE and UPE are
the most sophisticated technologies that require a high level of expertise in both data
collection and data analysis and interpretation. Thus, they obtained the minimum weights
among the other technologies; (ii) the environmental conditions have a significant
influence on employing the IRT, thus it obtained the lowest weight. In fact IRT testing
typically requires clear skies, mild wind, dry concrete surface, and intense solar radiation
to achieve the heat-flow conditions needed to detect the presence of delaminations.
Figure 3-8: Evaluation of NDT technologies with respect to their simplicity.
3.4.1.4 Evaluation of NDT Techniques from Perspective of Accuracy
The NDT techniques were evaluated in perspective of their ability to accurately locate
defects. The participants considered the ability to detect the extent and severity of
delamination as the primary significant factor, thus it attained the highest weight value of
40%. The ability of the techniques to evaluate the intensity of active corrosion was the
second significant factor with 35% weight value, while the ability to detect the depth and
width of vertical cracks obtained the least weight value of 25%. Figure 3-9 illustrates the
evaluation results of the five NDT techniques with respect to these three performance

87
factors. The results indicate that: (i) IE was identified as the technology that provides the
highest accuracy in detecting the extent and severity of delamination, followed by the IRT,
UPE, and GPR technologies; (ii) UPE was identified as the technology that provides
highest accuracy in detecting crack depth and width, followed by the IE method; and (iii)
HCP was identified as the technology that provides highest accuracy in evaluating
corrosion activity, followed by the GPR method.
Figure 3-9: Evaluation of NDT technologies with respect to their accuracy.
3.4.1.5 Evaluation of NDT Techniques from Perspective of Cost
The NDT techniques were evaluated in perspective of the cost of equipment, including
maintenance costs; the cost of data collection including the number of operators, expertise
level, cost of traffic control, and time needed to collect data; and the cost associated with
data analysis and interpretation, including the number of analyzers, expertise level, and
time needed to analyze and interpret. The participants considered the cost of data collection
as the primary significant factor, thus it attained the highest weight value of 48%. The cost
of data analysis and interpretation was the second significant factor with 32% weight value,
while the cost of equipment obtained the least weight value of 20%. The achieved weights
of the different technologies with respect to these three factors are illustrated in Fig. 3-10.
Comparing the achieved results indicates that HCP is the lowest cost method with respect

88
to the three parameters, while IE and UPE are the most expensive methods. Thus, HCP
obtained the maximum weight among the other technologies, while IE and UPE obtained
the minimum weights.
Figure 3-10: Evaluation of NDT technologies with respect to their cost.
3.4.2 Overall Ranking of NDT Techniques
The overall ranking of the technologies was conducted from high to low. The final score
values are presented in Table 3-6. The results revealed that IE obtained the maximum score
of 23%, the HCP ranked second with 22% and GPR third with 21%, while UPE and IRT
received the minimum percentages of 18 and 16, respectively. It should be noted that this
overall ranking came from the assigned weights of all parameters and hence was affected
by the weights of the significant parameters, such as the capability and accuracy. The score
could be changed if the comparison was made only between each group of technologies
capable to detect a specific deterioration type. However, the results draw the attention to
the fact that, while IE and HCP are currently highly regarded as the most commonly used
methods to evaluate delaminations and the likelihood of rebar corrosion, respectively, there
is a high potential to increase the use of GPR technology in evaluating the conditions of
concrete bridge decks. It also indicates that most participants have concerns regarding IRT
results.

89
For more rational evaluation, Figure 3-11 illustrates the individual performance of the
technologies from the perspectives of the five performance measures considered in this
study. The figure indicates that the various NDT technologies are significantly different in
terms of a selected performance parameter. For instance, the IE was generally considered
by the participants as the most accurate technology. In fact several experts commented in
the questionnaire that IE was generally consistent with results from coring when they were
carefully performed, but it is also a time consuming method. They further mentioned that
GPR could obtain a higher relative importance weight if the delaminated areas under
investigation were moist. Evaluating IRT by the experts as the lowest accurate technology
could be due to its high sensitivity to the effects of environmental conditions, and thus it is
difficult to establish a rule-based criterion to evaluate its raw data. With respect to speed,
the figure indicates that the IRT, GPR, and HCP methods were generally considered as the
speediest technologies. Although different levels of expertise and experience are needed
for the compared technologies, the HCP and IRT were generally considered as the simplest
technologies. Similarly, the HCP and IRT were generally considered as the lowest cost
technologies followed by the GPR method.
Figure 3-11: Overall evaluation of NDT technologies with respect to the main
performance criteria.

90
3.5 Validation of Model Results
Indeed, comparing the different NDT techniques based on quantifiable data provides more
precise and objective evaluation. Therefore, the achieved results were validated through
the findings of some comparative research studies, identified in the open literature that
compared various NDT techniques qualitatively and quantitatively. In these comparative
studies, each technique has been compared to at least one other technique with respect to
different performance parameters. Table 3-7 summarizes the explored studies and their
major findings. For instance, Barnes and Trottier (2000) utilized the HCP and GPR
techniques to evaluate nine RC bridge decks and then compared the results with actual
recognized and repaired areas. They reported that accurate identification of the defects was
indicated by the HCP tests. Good spatial and quantitative correlation was also observed
between the GPR-predicted defect locations and the actual deterioration found on the nine
decks using the ground-truth survey methods.
Scott et al. (2003) applied IE and GPR testing on a full-scale RC bridge deck and reported
that all delaminations identified by the IE were validated by the results of core samples
extracted from the deck, while the GPR tests provided more rapid inspection, yet were not
able to consistently identify delaminations. Yehia et al. (2007) conducted a study to
determine the reliability of IE, GPR, and IRT technologies on concrete slabs fabricated
with three types of flaws (cracks, delaminations, and voids) of known location and
dimension. They reported that the IE results identified the extent and depth of all defects
efficiently, while the IRT only detected the shallower defects. GPR testing was fairly good
at detecting delaminations, but had difficulties with voids and could not detect cracks. Both
IRT and GPR testing provided rapid inspections, while the IE was a time-consuming
method. Oh et al. (2013) utilized air-coupled IE and IRT techniques to evaluate an in-
service RC bridge deck. The methods were compared across performance criteria,
considering accuracy, testing practicality and cost. They reported that IRT is a very
effective approach for rapid detection of shallow defects, although it is hindered by the
relatively high capital cost of equipment and high sensitivity to the ambient environment
and surface conditions. The air-coupled IE showed good performance and accurate results
for bridge decks under active ambient traffic noise and vibration conditions.

91
Gucunski et al. (2013) published a comprehensive study of nine NDT techniques that were
utilized in the SHRP2 project to identify typical deterioration mechanisms in RC bridge
decks. The evaluated techniques included those adopted in the present research. Ten
organizations (NDT service providers, research institutions, and consultants) conducted
validation testing in the field and laboratory. After completion of the testing, the data were
analyzed and quantitative results were used for the evaluation process in which five
performance measures were considered: accuracy, repeatability, ease of use, speed, and
cost. Evaluation of the technologies’ accuracy was limited by the extent of ground truth
information, and hence, was done only through laboratory testing. The report concluded
that IE was the most accurate technology in detecting delamination defects, followed by
the IRT method. The HCP and electrical resistivity were the two precise technologies to
measure the potential of corrosion activity. The surface wave transmission method was the
most approparite for measuring the depth of cracks, whereas the ultra-sonic surface wave
method was most successful in quantifying the degradation of concrete. The IE and GPR
were the two technologies that had highest potential of repeatability. The IRT testing
provided highest inspection speed, followed by the GPR and HCP techniques. In addition,
IRT was the easiest technology to use, followed by the HCP method, which was also
reported as the least expensive technology. These findings comply to a large extent with
the results obtained from the model developed in the present research.

92
Table 3-7: Comparative studies which utilized several NDT techniques on RC bridge decks
Reference Techniques Utilized Performance Indicator Outcomes
Alt and Meggers
(1996)
Barnes and
Trottier (2000)
Scott et al. (2003)
Clark et al. (2003)
Yong and Kee
(2003)
Yehia et al.
(2007)
Gucunski and
Nazarian (2010)
Algernon et al.
(2010)
Arndt et al.
(2010)
Oh et al. (2013)
Gucunski et al.
(2013)
IRT, GPR
GPR, HCP, CD
IE, GPR, CD
IRC,CD
GPR, IE, IR
IE, IRT, GPR
IE, GPR, HCP,
USW, ER
IE, UPE,
Covermeter
HCP, GPR, IRT,
IE, UPE
IE, IRT, CD
IE, GPR, HCP,
USW, ER, IRT,
UPE, IR
Capability, accuracy,
repeatability
Accuracy, variability
Capability, accuracy,
speed
Accuracy
Capability
Capability, accuracy,
speed, equipment cost
Capability, accuracy
Capability, accuracy
Capability,
repeatability
Accuracy, practicality,
cost
Accuracy,
repeatability, ease of
use, speed, cost
Both IRT and GPR were not able to identify all subsurface
anomalies due to the concrete and asphalt overlays.
GPR provided good spatial and quantitative correlation
compared with the HCP and ground-truth results.
IE results were consistent with coring results, while GPR did
not produce consistent responses to delamination.
IRT successfully identified most delaminations, even though
the survey conditions were imperfect.
IE and IR identified hidden anomalies (voids & delamination)
having good agreement with ground-truth results.
IE identified all defects, while IRT identified only shallower
defects. IRT was the faster method, followed by GPR and IE.
IE identified delaminations. HCP and ER enabled the
assessment of likelihood and severity of corrosion.
UPE identified accurate thicknesses of the concrete blocks and
IE efficiently located irregularities within the blocks.
The HCP/GPR testing monitored the probability of active
corrosion. IE identified the defects and the low stiffness areas.
IE enabled efficient detecting of delaminations. IRT detected
shallow delaminations only.
IE was the most accurate in detecting delaminations, HCP was
accurate in measuring potential of corrosion activity. Tests for
all techniques were relatively repeatable. IRT and HCP were
the easiest technologies and HCP was the least expensive.
Note: CD (Chain Drag); USW (Ultrasonic Surface Waves); ER (Electrical Resistivity); IR (Impulse Response)

93
3.6 Evaluation of the Proposed Model
This study attempts to provide a rational basis to transportation agencies guiding their
efforts to incorporate NDT techniques into bridge inspection procedures through the
evaluation of five NDT techniques. Because the data source used in the development of the
proposed evaluation methodology came from a survey of bridge owners, consultants and
researchers, it was important to only consider expertise with high level of interest in NDT
applications. For instance, expertise sourced from a certain network might have a common
perception of a particular performance parameter. Thus, including experts from different
agencies was considered beneficial to incorporate diversity and ensure representation of
different perspectives. It was unlikely that the respondents had experience or were familiar
with all the evaluated five NDT technologies. Thus, participation was considered only for
experts who had experience with at least three of the NDT of interest. Furthermore, the
experts were requested to have their evaluation based solely on evidence used to validate
the outcomes of the NDT techniques employed in their schemes (e. g. coring, chloride
content...etc). Such a plan was taken into account in order to ensure that the results of the
analysis represent the performance of the technologies rather than a popularity contest of
NDT alternatives.
The overall ranking of the technologies in this comparative study was, to some extent,
influenced by the selected performance measures and the applied weights in the evaluation
process. Therefore, some suggestions for improvement were received from the experts. For
example, three respondents highlighted that the performance measures should include
“commercial availability” since it might influence selection by bridge engineers for a
specific project. Another two participants highlighted that the ultrasonic pulse echo method
was not used frequently, while choosing surface wave methods could be more approparite.
Another respondent advised that low cost, commercially available remote sensing
technologies are an efficient solution to enhancing and monitoring the condition
assessment of bridge decks. Although such comments are valuable, it should be noted that
the idea here is to propose a methodology rather than apply the exact numbers achieved in
the present research. Moreover, the proposed hierarchy structure can be customized to
accommodate different transportation agency policies.

94
However, regardless of the accuracy of results in terms of the applied model and the
presented fuzzy analysis, it should be noted that there is no technology that is a "solve-all"
solution to assessing the condition of a bridge deck. Each of the evaluated technologies has
some drawbacks and is appropriate for a specific type of defect/problem. For instance, IE,
the technology which obtained the highest ranking in this study, requires many testing
points and inadequate receiver contact can yield inaccurate and false measurements.
Furthermore, testing rough concrete surfaces could affect the establishment of the low
impulse time necessary to detect small and shallow defects. The HCP testing does not
provide quantitative information on the corrosion rate. In addition, it cannot be used in the
presence of coated rebar and its measurements can be influenced by numerous material
properties. GPR can indirectly assess the potential of rebar corrosion, while the presence
of congested reinforcement can prevent GPR signal penetration. In addition, GPR does not
provide information on the corrosion rate. The results of the UPE technology could be
significantly affected by the attenuation of the transmitted pulses. The IRT as a remote
sensing technology could provide real-time results, but is dependent on ambient conditions
and its conventional inspection method cannot indicate the depth of delaminations and
voids. Recently, Washer (2016) introduced the ultra-time domain IRT technology based
on IR continuous monitoring and reported that applying long term measurements using IR
camera is capable of detecting the depth of delaminations in RC bridge decks.
The decision on which NDT technology to select or equipment to acquire for a specific
project depends primarily on the type of deterioration representing the highest concern to
the transportation agency and the degree of deterioration details required. Generally, an
optimal selection strategy would seek to minimize the costs of inspection, while still
ensuring an adequate accuracy and reliability of the NDT technique to be utilized.
However, the decision could be controlled by many other criteria, such as the size and
complexity level of the network, geographic location, traffic density, environmental
conditions, how the assessment data will be used, and available time to conduct the
evaluation. Moreover, the selection process should be accompanied by a comprehensive
cost-benefit analysis. It should be noted that, generally, to achieve a reliable evaluation of
a bridge deck condition, the selected NDT technique(s) must be suitable for the
components of the bridge deck under investigation. The testing must be performed by

95
qualified personnel with adequate knowledge of the requirements and specifications that
are relevant to their applications and limitations.
Indeed, integrating several NDT techniques has emerged to provide more reliable
evaluation on the condition of bridge decks. Therefore, research has attempted to integrate
two or more NDT techniques to detect all possible defects and improve the assessment
process. For example, the FHWA has recently developed the “RABIT” bridge deck
assessment device. RABIT (Robotics Assisted Bridge Inspection Tool) is a fully
autonomous robotic system for the condition assessment of concrete bridge decks using
the results of multi-model NDT, which utilizes the electrical resistivity, impact echo,
ultrasonic surface waves, and ground penetrating radar technologies. The robot’s data
visualization platform facilitates an intuitive 3-D presentation of three deterioration types
(rebar corrosion, delamination, and concrete degradation) and deck surface features
(Gucunski et al., 2015). However, because not all the transportation agencies employ fully
NDT evaluation due to the associated costs, they should have access to at least two of the
five technologies explored herein for a better understanding of a deck’s condition. This
will also make the assessment of a large population of bridge decks more feasible.
3.7 Conclusions
Transportation agencies have a great need to evaluate bridge deck conditions using NDT
techniques in order to optimize the effective timing, scope, and approaches for preventive
maintenance, repair, and replacement. An attempt has been made in the present research to
critically analysis the performance of commonly utilized NDT technologies to assess the
condition of RC bridge decks. Thus, hierarchical decision modeling was utilized as an
effective management tool to evaluate the performance of five NDT technologies. AHP,
which is a well-known multivariable decision making methodology, provides a basis for
group decision making and can utilize both qualitative and quantitative criteria in the same
framework. The proposed model was developed based on a combination of literature
review and questionnaire survey with subject matter experts representing different bridge
community organizations. The NDT methods were evaluated and ranked based on a set of
flexible multi-attributed criteria and sub-criteria, developed to form a hierarchical decision.
The different hierarchal elements were assigned pairwise comparisons using a fundamental

96
scale of absolute values that represent the strength of judgements by the participants. In
order to make the evaluation analysis more precise, the fuzzy set theory was adopted to
deal with vagueness and uncertainty in the decision making process. The results of the
developed model were validated through the findings of multiple research studies retrieved
from the open literature, which deployed physical laboratory and field NDT testing. The
outcomes revealed that no single technology is capable of recognizing all three primary
defect types, and that comprehensive condition assessment could be better conducted using
more than one technique to compensate for each single technique limitations. The factors
that could affect the selection of a NDT technique were discussed. Applying this
management aspect can assist bridge stakeholders in the appraisal and selection of different
NDT technologies to detect different types of bridge deck health indicators at both the
project and network levels.
3.8 References
Algernon, D., Hiltunen, D., and Ferraro, C. (2010). “Validation of nondestructive testing
equipment for concrete.” Department of Civil and Coastal Engineering, University
of Florida, Final Report, 142 p.
Alt, D., and Meggers, D. (1996). “Determination of bridge deck subsurface anomalies
using infrared thermography and ground penetrating radar.” Report FHWA-KS-
96-2, Kansas, DOT, 18 p.
Arndt, R., Jalinoos, F., Cui, J., Huston, D. (2010). “Periodic NDE for bridge maintenance.”
Proc., Structural Faults and Repair Conference, Edimburgh, 1-10.
Barnes, C. and Trottier, J. (2000). "Ground-Penetrating Radar for Network-Level Concrete
Deck Repair Management." Transportation Engineering, Vol. 126 (3), 257-262.
Baruch, Y. (1999). “Response rate in academic studies-A comparative analysis.” Human
Relations, Vol. 52 (4), 421-438.
Bhattacharyya, R., Kumar, P. and Kar, S. (2011). “Fuzzy R&D portfolio selection of
interdependent projects.” Computers and Mathematics with Applications, Vol. 62,
3857-3870.
Buckley, J. (1985). “Fuzzy hierarchical analysis.” Fuzzy Sets and Systems, Vol. 17, 233-
247.
Chang, Y., (1996). “Application of the extent analysis method on fuzzy AHP.” European,
Operational Research, Vol (95), 649–655.
Chang, T., and Lee, H. (2012). “A fuzzy DEA and knapsack formulation integrated model
for project selection.” Computers and Operations Research, Vol. 39, 112-125.

97
Clark, M. R., McCann, D. M., and Forde, M. C. (2003). “Application of infrared
thermography to the non-destructive testing concrete and masonry bridges.”
NDT&E International, Vol. 36 (4), 265–275.
Csutora, R., and Buckley, J. J. (2001). “Fuzzy hierarchical analysis: The Lamda-Max
method.” Fuzzy Sets and Systems, Vol. 120, 181-195.
Gucunski, N., Kee, S., La, H., Basily, B., Maher, A., and Ghasemi, H. (2015).
“Implementation of a Fully Autonomous Platform for Assessment of Concrete
Bridge Decks RABIT.” Proc., Structure Congress, ASCE, Reston, VA, 367-378.
Gucunski, N., Imani, A., Romero, F., Nazarian, S., Yuan, D., Wiggenhauser, H., Shokouhi,
P., Taffe, A., and Kutrubes, D. (2013). “NDT to identify concrete bridge deck
deterioration.” Proc., 92nd Annual Meeting, TRB, SHRP 2 Report, 96 p.
Gucunski, N., and Nazarian, S. (2010). “Material Characterization and Condition
Assessment of Reinforced Concrete Bridge Decks by Complementary NDE
Technologies.” Proc., Structures Congress, ASCE, Orlando, Fl., 429-439.
Hesse, A., Atadero, R., and Ozbek, M. (2015). “Uncertainty in Common NDE Techniques
for Use in Risk-Based Bridge Inspection Planning: Existing Data.” Bridge
Engineering, Vol. 20 (11), 1-8.
Huang, C., Chu, P., and Chiang, Y. (2008). “A fuzzy AHP application in government-
sponsored R&D project selection.” The International. Management Science, Vol.
36, 1038-1052.
Huo, L., Lan, J., and Wang, Z. (2011). "New parametric prioritization methods for an
analytical hierarchy process based on a pairwise comparison matrix." Mathematical
and Computer Modelling, Vol. 54 (11-12), 2736-49.
Jakiel, P., and Fabianowski, D. (2015). “FAHP model used for assessment of highway RC
bridge structural and technological arrangements.” Expert Systems with
Applications, Vol. 42, 4054-4061.
Mikhailov, L. (2004). "Group prioritization in the AHP by fuzzy preference programming
method." Computers and Operations Research, Vol. 31 (2), 293-301.
Oh, T., Kee, S.-H., Arndt, W., Popovics, S., and Zhu, J. (2013). “Comparison of NDT
methods for assessment of a concrete bridge deck.” Engineering Mechanics, Vol.
139 (3), 305-314.
Saaty. (1980). "The analytic hierarchy process: Planning, Priority Setting and Resource
Allocation." Book, Publisher: McGraw-Hill, New York, 237 p.
Sasmal, S., and Ramanjaneyulu, K. (2008). “Condition evaluation of existing reinforced
concrete bridges using fuzzy based analytic hierarchy approach.” Expert Systems
with Applications, Vol. 35 (3), 1430-1443.
Scott, M., Rezaizadeh, A., Delahaza, A., Santos, C., and Moore, M., Graybeal, B., Washer,
G. (2003). “A comparison of nondestructive evaluation methods for bridge deck
assessment.” NDT&E International, Vol. 36, 245-255.
98
Srdjevic, B. (2005). “Combining different prioritization methods in the-analytic hierarchy
process synthesis.” Computers and Operations Research, Vol. 32, 1897-1919.
Van Laarhoven, P. J. M. and Pedrycz, W. (1983). “A fuzzy extension of Saaty’s priority
theory.” Fuzzy Sets and Systems, Vol. 11 (1/3), 229-241.
Wang, Y. and Elhag, T., (2008). “Evidential reasoning approach for bridge condition
assessment.” Expert Systems with Applications, Vol. 34 (1), 689–699.
Washer, G. (2016). “Infrared Technologies for Bridge Maintenance.” University of
Missouri. Report, 35 p.
Wood, J. C., and Rens, K. L. (2006). “Nondestructive testing of the Lawrence Street
Bridge.” Proc., Structures Congress, ASCE, Reston, VA, 1–15.
Yehia, S., Abudayyeh, O., Nabulsi, S., and Abdel-Qader, I. (2007). “Detection of Common
Defects in Concrete Bridge Decks Using NDE Techniques.” Bridge Engineering,
Vol. 12, 215-225.
Yong Hao Z., and Kee Ee Ng. (2003). “Evaluation of concrete structures by advances non-
destructive test methods-impact echo, impulse response test and radar survey.”
Proc., NDT-CE conference, Berlin, 1-4.
Zhou, X. (2012). "Fuzzy Analytical Network Process Implementation with Matlab."
MATLAB - A Fundamental Tool for Scientific Computing and Engineering
Applications – Vol. 3", Book edited by Vasilios N. Katsikis, Open Access, Chapter
6, 133-160.

99
Chapter 4
4. Infrared Thermography Model for Rational Condition
Assessment of Reinforced Concrete Bridge Decks
4.1 Introduction
Subsurface delaminations are serious and common defects that affect the structural
integrity and reduce the service life of RC bridge decks. Delamination could also be
indicative of deterioration and potential active corrosion. Therefore, locating and defining
the extent of this damage in its initial stages is critical to ensure bridge safety and optimize
maintenance and repair needs. Detecting subsurface delaminations in RC bridge decks
without physical contact is a considerable advantage of infrared thermography (IRT). Such
subsurface anomalies can be detected on the basis of variable concrete properties, such as
density, thermal conductivity and specific heat capacity. Data collection using remote
sensing technology with thermal IR imagery can reduce traffic disruption and lane closures
on and underneath bridge decks, and thus it is less costly than other NDT methods.
Generally, IRT testing collects radiant temperature and visualizes the data in the form of
real-time thermal infrared images. However, the infrared images can be difficult to
interpret, and thus specific data acquisition training is often required (Vaghefi et al., 2012).
There is a dearth of research on the interpretation process of IRT data. In the majority of
IRT analyses, the post-processing of IR images depends on the analyzer’s personal
experience since defective areas are usually identified and calculated based on a visual
interpretation approach. Such qualitative and subjective analyses provide quick decisions
using the difference in the temperature of the region of interest and a reference region but
can lead to inconsistency in the obtained results. Therefore, overcoming the obstacles of
IRT data analysis is necessary to tailor this rapid and reliable evaluation technique for RC
bridge decks. In this Chapter, a novel procedure to detect and classify subsurface
delamination in full-scale RC bridge decks under passive IRT testing is developed. To
achieve this goal, the following objectives are pursued throughout the chapter sections: (1)
studying the working principles of IRT and the current methods to analyze and interpret
the IR thermal data; and (2) developing an automated procedure to: (a) generate a

100
mosaicked thermogram of the entire bridge deck from individual IR images, (b) identify
objective thresholds in order to recognize the sound and defective deck areas and to classify
the severity of the defective regions, (c) produce a condition map of the entire bridge deck,
delineating the sound and different classes of defects, and (d) quantify the detected
delamination defects in each category.
Figure 4-1 illustrates the adopted systematic methodology to achieve the above-mentioned
objectives. It can be summarized as follows: (1) conducting a passive IRT survey in-situ
on a full-scale deteriorated concrete bridge deck using an advanced thermal camera; (2)
initializing acquisition and storage of the IRT data using the Matlab image acquisition
toolbox; (3) enhancing the images’ resolution by increasing its dynamic range and reducing
the inherent noise using the Flir software; (4) developing a stitching algorithm to create a
mosaicked thermogram of the entire bridge deck using especially written Matlab codes; (5)
constructing a framework to determine the number of defects’ condition categories
(clusters) of the subsurface anomalies; (6) segmenting the mosaic to determine the
threshold values using the k-means clustering algorithm, a machine learning unsupervised
technique, in the Matlab software; (7) creating an IR condition map delineating different
categories of the delamination severity using a commercial mapping software; (8)
implementing the developed procedure in four full-scale bridge decks; and (9) validating
the condition maps with results provided by other technologies on the same bridge decks.
Figure 4-1: Methodology adopted in developing IRT model to detect and classify
subsurface delamination in RC bridge decks.

101
4.2 Infrared Thermography Technology
This section provides an introduction to the theory of IRT technology along with its
application to the in-situ inspection of RC bridges. A brief review of the basic principles
of heat transfer and thermal imaging, a review of IR cameras, and application and
interpretation of passive IRT testing are presented.
4.2.1 Basic Principles of IRT
4.2.1.1 IR Radiation
Any object at a temperature above the absolute zero (-273.15 degrees Celsius or 0 Kelvin)
emits infrared radiation (below red). Infrared radiation lies between the visible and
microwave portion of the electromagnetic spectrum where the usable part is approximately
defined from 0.8 to 14 μm. This range can be further subdivided into near-infrared (0.8-1.5
μm), short-wavelength infrared (1.5-2.5 μm), mid-wavelength infrared (2.5-8 μm), and
long-wavelength infrared (8-14 μm). We experience infrared radiation every day. For
instance, the heat that we feel from sunlight, a fire or a radiator is all infrared. Although
our eyes cannot see it, the nerves in our skin can feel it as heat. The intensity of the infrared
radiation emitted by objects is mainly a function of their temperatures and radiation
wavelengths. Figure 4-2 illustrates the infrared region in the electromagnetic spectrum.
Figure 4-2: Infrared region in the electromagnetic spectrum (FLIR Guidebook).
In the thermal radiation theory, there are three ways by which the radiant energy striking
an object can be dissipated: absorption, transmission and reflection (Robert, 1982). IRT

102
employs infrared sensors to detect thermal radiation emitted from materials, and creates an
image of surface temperatures based on the emitted radiation. In addition to emitting
radiation, an object reacts to incident radiation from its surroundings by absorbing and
reflecting a portion of it, or allowing some of it to pass through. From this physical
principle, the radiation law is derived as per Equation 4-1, which can be simplified as per
Equation 4-2.
𝐸 = 𝛼𝐸 + 𝛽𝐸 + 𝜏𝐸 Eq. 4-1
𝛼 + 𝛽 + 𝜏 = 1 Eq. 4-2
The coefficients 𝛼, 𝛽, 𝑎𝑛𝑑 𝜏describe the object’s incident energy absorption (𝛼), reflection
(𝛽), and transmission (𝜏). Each coefficient can have a value from zero to one, depending
on how well an object absorbs, reflects, or transmits incident radiation. Stefan-Boltzmann
further developed the formula presented in Equation 4-3, where the intensity of the
infrared radiation emitted by objects was directly proportional to the fourth power of its
absolute temperature (Robert, 1982). As per the formula, the amount of radiation increases
with temperature. Therefore, the warmer the object the greater the intensity of the emitted
infrared radiation.
𝐸𝑟𝑎𝑑 = 휀 𝜎 𝑇4 Eq. 4-3
Where: E is the radiation energy (W·m⁻²), is Stefan-Boltzmann constant (5.67 ×
10−8 𝑊 𝑚−2 𝐾−4), T is the surface temperature (Kelvin), and ε is the object’s emissivity
(unit-less value). A material’s emissivity is the ability of its surface to emit energy by
radiation relative to a black body. In other words it is the ratio of the radiant energy emitted
by the body to the radiant energy emitted by a black body at the same temperature. A
blackbody is considered as a hypothetical object which absorbs all incident radiations (the
transmissivity and the reflectivity are null) and radiates a continuous spectrum. For a
perfect blackbody, emissivity is unity, but for real surfaces it is always less than unity. For

103
concrete, this property is typically greater than 0.92 (Meola, 2012). Emissivity is important
in terms of analyzing thermographic images, because different materials may emit
radiation at different rates, even though they may be at the same temperature. However,
the surface roughness and moisture content of the concrete can influence its emissivity
value. The presence of other materials on the surface of the concrete (e.g. staining, water,
lane markings, etc.), which have different emissivity properties, can result in apparent
temperature variations in the IR image and possibly mask the thermal contrasts created by
subsurface anomalies (Clark et al., 2003).
4.2.1.2 Heat Transfer
Heat energy moves by conduction, convection and radiation. The thermal energy, received
by the concrete surface due to the sun’s rays, depends on the concrete absorptivity and the
solar radiation on the concrete surface as per Equation 4-4. The solar radiation depends
on geographical location and the position of the sun relative to the surface of the concrete,
whereas absorptivity is a measure of the efficiency of receiving radiated heat.
𝐸𝑠 = 𝛼𝑠 𝐼𝑠 Eq. 4-4
Where 𝛼𝑠 is the absorptivity of concrete and 𝐼𝑠 is the solar radiation on the concrete surface.
The thermal energy, transfer by convection as a result of temperature differences between
the concrete surface and the surrounding air, is given by Newton’s law of cooling according
to Equation 4-5.
𝐸𝑐𝑜𝑛𝑣 = ℎ (𝑇𝑠 − 𝑇𝑎) Eq. 4-5
Where ℎ is a convection coefficient, 𝑇𝑎 is the ambient temperature, and 𝑇𝑠 is the surface
temperature of the concrete. The convection coefficient depends on many factors, such as
surface roughness and surface area of the concrete, wind velocity, and thermal properties
of the air. The convective heat transfer is positive when the ambient temperature is less
than the temperature of the concrete, for example, when radiant heating from the sun warms

104
the concrete above the ambient temperature. In this case, increased wind speed will result
in increased energy transfer from the concrete to the surrounding environment.
Accordingly, the thermal gradients in the concrete reduces (Washer et al., 2013). In other
words convective cooling for solar exposed surfaces may counteract the radiant heating of
the sun, and reduce the thermal gradient in the concrete. Conversely, if the ambient
temperature is warmer than the concrete, for example, when ambient temperatures are
increasing but there is no heating from the sun, then the convective heating transfer is
negative. In this case, increased wind speed will accelerate the heat transfer to the concrete,
and increase the thermal gradients in the concrete, thereby increase the detectability of a
subsurface delamination.
Within the concrete solid, heat transfer via conduction occurs and is affected by its thermal
conductivity, which indicates how quickly heat flows through the concrete. It depends on
the aggregate types used in the concrete mixture. The thermal diffusivity is the thermal
conductivity divided by the volumetric heat capacity. A high thermal diffusivity means that
heat transfer through a material will be rapid and the amount of storage will be small.
Conversely, low thermal diffusivity indicates a slower rate of heat transfer and a large
amount of heat storage (Bagavathiappan et al., 2014). Heat capacity is defined as the
amount of heat needed to raise the temperature of a unit mass of a material by one degree
and describes its ability to store heat. For the one dimensional plane, the thermal energy
transfer by conduction is expressed according to Equation 4-6, while the ability of the
concrete to conduct and store heat is commonly represented by its thermal inertia,
computed as the square root of the product of its thermal conductivity, density, and heat
capacity as per Equation 4-7.
𝐾𝑐𝑜𝑛𝑑 = 𝐾 {𝑇𝑠− 𝑇𝑎
𝐿} Eq. 4-6
𝐼 = √𝐾 𝜎 𝐶 Eq. 4-7
Where 𝐾 is the thermal conductivity, 𝐿 is the concrete thickness in the direction of heat
flow, 𝜎 is the density, and 𝐶 is the heat capacity.

105
4.2.2 Infrared Cameras
IR cameras are designed for a specific range of the IR spectrum. An IR camera measures
the intensity of emitted infrared radiation from an object and converts it into a visible
image. The fact that radiation is a function of object surface temperature makes it possible
for the camera to calculate and display this temperature. However, the radiation measured
by the camera not only depends on the temperature of the object, but is also a function of
the emissivity. Radiation also originates from the surroundings and is reflected in the
object. The radiation from the object and the reflected radiation will also be influenced by
the absorption of the atmosphere. To measure temperature accurately, it is therefore
necessary to compensate for the effects of a number of different radiation sources. The
object parameters that must be supplied for the camera include the emissivity of the object,
the reflected apparent temperature, the distance between the object and the camera, the
relative humidity, and the temperature of the atmosphere.
The main components of IR cameras are a lens that focuses IR onto a detector, plus
electronics and software for processing and displaying the signals and images. The
configuration of a typical IR camera is shown in Fig. 4-3. Infrared energy (A) coming from
an object is focused by the optics (B) onto an infrared detector (C). The detector sends the
information to sensor electronics (D) for image processing. The electronics translate the
data coming from the detector into an image (E) that can be viewed in the viewfinder or on
a standard video monitor or LCD screen.
Figure 4-3: General configuration of a typical IR camera (FLIR Guidebook).

106
IRT is the art of transforming an infrared image into a radiometric one, which allows
temperature values to be read from the image. So every pixel in the radiometric image is
in fact a temperature measurement. In order to do this, complex algorithms are incorporated
into the thermal imaging camera. However, the optics and detectors are the heart of IRT
systems and must be selected for the desired range (Rinaldi, 2012). Because IR has the
same properties as visible light regarding reflection, absorption, and transmission, the
optics for thermal cameras are designed in a fashion similar to those of a visual wavelength
camera. However, the types of glass used in optics for visible light cameras cannot be used
for optics in an infrared camera, as they do not transmit IR wavelengths well enough.
Conversely, materials that are transparent to IR are often opaque to visible light. IR camera
lenses typically use silicon and germanium materials. Normally silicon is used for medium
wavelength IR camera systems, whereas germanium is used in long wavelength cameras.
Both materials have good mechanical properties, e.g., they do not break easily, they are
non-hygroscopic, and they can be formed into lenses with modern turning methods. As in
visible light cameras, IR camera lenses have antireflective coatings. With proper design,
IR camera lenses can transmit close to 100% of incident radiation.
The IR camera detector is a focal plane array (FPA) of micrometer-sized pixels made of
various materials sensitive to IR wavelengths. FPA resolution can range from about 160 ×
120 pixels up to 1024 × 1024 pixels. Some IR cameras have built-in software that allows
the user to focus on specific areas of the FPA and calculate the temperature. Other systems
utilize a computer or data system with specialized software that provides temperature
analysis. Both methods can supply temperature analysis with better than ± 1° C precision.
However, the FPA technologies are broken down into two categories: thermal detectors
(uncooled microbolometers) and quantum detectors, which are generally faster and more
sensitive than thermal detectors. On the other hand, thermal detectors have a lower cost
and broader IR spectral response than that of quantum detectors, which also require a
cooling system using either liquid nitrogen or a small stirling cycle refrigerator unit
(Vladimir, 2014). However, advances in the field of solid state technology have paved the
way for the development of newer types of uncooled infrared detectors with better
resolution and accuracy. Nowadays, the thermal sensitivity of the uncooled cameras is
about 0.03 ⁰C compared to 0.01 ⁰C of the cooled ones (Bagavathiappan et al., 2014).

107
The most important parameters that must be considered before choosing an IR camera
include the spectral range, spatial resolution, temperature range and frame rate. For
observing objects at ambient temperature, long wave length band (8–14 μm) is preferable
to detect small thermal contrast and reduce the effects of direct solar radiation during
daytime testing. The spatial resolution of an IR camera primarily depends on the object-to-
camera distance, lens system and detector size. The spatial resolution decreases with
increasing object-to-camera distance, while lens systems with a small field of view (FOV)
have higher spatial resolution (Usamentiaga et al., 2014).
4.2.3 Application of IRT for Concrete Bridge Inspection
IRT has been applied for several decades to detect corrosion-induced delaminations in RC
bridges (Manning and Holt, 1982). Previous studies highlighted that the immense
difference between the volumetric heat capacity of solid concrete and that of the air voids
within the concrete element results in warmer delaminated areas than the sound concrete
when exposed to solar heating. They further suggested that more severely delaminated
regions have stronger thermal contrast values. There are two testing approaches for IRT
based on the heat source. The active approach uses an external thermal stimulus to induce
the required heat flow condition in the concrete being tested. The passive approach uses
natural heat sources, such as solar heating and ambient temperature changes (Robert,
1982). Based on the external stimulus, different methods of active IRT have been
developed, such as pulse thermography, step heating, lock-in thermography, and vibro-
thermography.
The application of passive IRT testing in full-scale bridge decks relies on detecting
characteristic thermal signatures associated with subsurface anomalies since solar loading
can provide a strong radiant heating source. When the ambient air temperature is higher
than the concrete temperature, heat is transferred into the concrete to bring it toward
thermal equilibrium with its surroundings through a thermal gradient. Subsurface defects,
such as delaminations, disrupt the heat transfer through the concrete. If a sufficient thermal
gradient exists, defects can be detected by measuring the difference in surface temperature
that exist between a region of sound concrete and a defected region of concrete under
certain environmental conditions (Manning and Holt, 1982). For instance, when the

108
temperature of the concrete increases, such as during daytime when the sun and ambient
environment are heating the concrete, the area above a subsurface delamination warms up
at a faster rate than that of surface areas where the concrete is intact. Delaminations can
then be detected as “hot spots” on the surface of the material, relative to the intact concrete.
Conversely, during nighttime, the air temperature usually decreases and the material cools.
Thus, the surface area above delaminations cools at a faster rate than that of the intact
concrete and appears as “cold spots” relative to the intact concrete. Figure 4-4 illustrates
the IR emitted from a concrete bridge deck during the day and night.
Figure 4-4: Infrared energy emitted from concrete bridge deck during day and
night.
However, there has been limited application of the IRT technology to inspect full-scale
deteriorated RC bridge decks outside the laboratory environment. This could be due to the
fact that the technology must be used in controlled environmental conditions to obtain
precise evaluations. Environmental conditions such as solar loading, ambient temperature,
relative humidity and wind speed affect the accuracy of passive IRT measurements. The
effects of these environmental factors can be difficult to characterized and vary over time,
such that it can be difficult to determine if the existing environmental conditions at a given
point in time are adequate to produce a high quality image. Favorable environmental
conditions include sufficient solar loading or changes in ambient temperature to produce a
thermal gradient in the concrete, where the concrete surface heats up at a much higher rate
than the concrete core. ASTM D4788-03 (Standard Test Method for Detecting

109
Delaminations in Bridge Decks Using IRT) describes the appropriate environmental
conditions necessary for conducting passive IRT inspections. For instance, a minimum of
3-hr direct sunshine is required to create a temperature difference of at least 0.5°C. In
addition, IRT testing shall not be carried out when ambient air temperatures are less than
0°C (32°F) and when the wind velocity exceeds 50 km/hr (30 mph).
In addition, characteristics of the subsurface defect (e.g. delamination depth, delamination
thickness, materials present in delamination, concrete properties, and asphalt overlays) also
affect the test response. In a study by Hiasa et al. (2017), they reported that the area of
delamination was found to be the most critical factor that directly affects the thermal
contrast measures during IRT testing. Kee et al. (2012) reported that overnight cooling
effect can be used to detect both shallow and deep delaminations, providing clearer images
than using the morning heating effect. Watase et al. (2015) recommended to predict the
thermal contrast first based on actual sensor readings in order to determine the suitable
time window for conducting IRT bridge inspections. Maser and Roddis (1990) reported
that detection of defects in the presence of an asphalt overlay is difficult because the
overlay dampened the thermal contrasts achieved due to the thermal mass above a potential
delamination, and the thicker the overlay, the greater the damping effect. A major concern
for the reliability of IRT through asphalt overlay is the possible presence of a debonded
area which could mislead interpretation. The debonded area could appear as a flaw in the
IR image, in addition to the actual delaminations in the concrete. To distinguish debonding
for delaminations, Maser and Roddis (1990) suggested that the delaminated areas appear
as circular and uniform while the debonded areas present as large, non-circular, and non-
uniform.
4.2.4 Interpretation of Passive IRT Data
A main challenge in IRT is how to recognize delaminations in IR images since it can be
rather subjective to judge whether color contrast of the image is an indication of damage
or not. The location of subsurface delaminations can be identified by analyzing the surface
temperature variations. The measured thermal contrasts, defined in Equation 4-8, are
commonly examined to perform qualitative assessment of the thermographic images in an
attempt to identify subsurface deterioration.

110
∆𝑡 = 𝑇𝑑𝑒𝑓𝑒𝑐𝑡𝑖𝑣𝑒 𝑐𝑜𝑛𝑐𝑟𝑒𝑡𝑒 − 𝑇𝑠𝑜𝑢𝑛𝑑 𝑐𝑜𝑛𝑐𝑟𝑒𝑡𝑒 Eq. 4-8
Where: 𝑇𝑑𝑒𝑓𝑒𝑐𝑡𝑖𝑣𝑒 𝑐𝑜𝑛𝑐𝑟𝑒𝑡𝑒 is the surface temperature above a delaminated area and
𝑇𝑠𝑜𝑢𝑛𝑑 𝑐𝑜𝑛𝑐𝑟𝑒𝑡𝑒 is the surface temperature in the intact area of the concrete. Manning and
Holt (1982) pointed out that thermal contrast could occur at any ambient temperature, but
is greatest during a period of rapid heating and cooling. They also reported that the
maximum thermal contrast occurs at a distinct time over the course of a typical day. It
should be noted that the thickness of concrete cover may affect the inspection capability of
IRT due to the increased weakness of thermal contrasts with increased target depths. In
addition, Maldague (2000) correlated the depth of a defect with observation time and
proposed that the deeper defects will be detected at a later time with a reduced contrast,
where observation time is a function of the square of the depth as indicated in Equation 4-
9. He further suggested a relationship between the loss of contrast and increasing depth,
where the loss of thermal contrast is proportional to the cube of the target depth, as per
Equation 4-10.
𝑡 ~ 𝑧2
𝛿 Eq. 4-9
𝐶 ~ 1
𝑧3 Eq. 4-10
Where 𝑡 is the observation time, 𝑧 is the depth of the target, 𝛿 is the thermal diffusivity,
and 𝐶 is the thermal contrast loss due to defect depth.
Preprocessing of IR images may include pixel enhancement and noise smoothing, while
image processing is commonly conducted using a variety of image segmentation
techniques (Qianqian and Youna, 2003). IR image mosaics are commonly used to obtain a
global view of a bridge deck through stitching individual images. There are several
commercially available stitching software tools that can be utilized for creating this mosaic
view of a bridge deck. The majority of their algorithms rely on capturing images from a
fixed location in order to stitch them together. This allows projection onto the image plane

111
to go through the same focal point in all of the images. However, parallax and geometric
distortions, which often occur when an image is captured while the IR camera is moving,
make the creation of such a mosaic from the large numbers of images a problem because
the background appears to shift and automated feature detection methods could stitch the
background instead of the foreground (Brown and Lowe, 2007).
Displaying field deployment IR images into a geospatial format is another approach that
has been widely adopted by several researchers (e.g. Jiang and Li, 2008; Wu et al., 2012;
Vaghefi et al., 2015). For instance, ArcGIS (geographic information system) and the GE
(Google Earth) software can register images to produce GIS thermal IR maps, which allow
the analyst to explore data and make measurements. Although this procedure is useful in
detecting and calculating delaminated and spall areas present in bridge decks, it usually
requires manual editing and relies on the user interpretation, often resulting in undesired
subjectivity.
4.3 Un-Supervised Machine Learning
Machine learning is a predictive modeling analysis that constructs algorithms capable of
learning from and making prediction of data. The algorithms operate by building a model
from example inputs to predict data or decisions, rather than strictly following static
programme instructions (Melhem and Cheng, 2003). It can be classified based on the nature
of input and feedback signals as supervised learning, where the goal is to learn general
rules to map inputs and known desired outputs, and un-supervised learning, where no
output labels are given and the data are left on its own to find structure in its inputs (Jain,
2010). It can be also statistically categorized as classification, regression and clustering
techniques. Clustering methods partition a set of objects into clusters such that objects in
the same cluster are more similar to each other than objects in different clusters according
to some defined criteria (Huang, 2010). Therefore, clustering analysis can be defined as a
statistical technique for discovering whether the individuals of a population fall into
different groups by making quantitative comparisons of multiple characteristics (Melhem
and Cheng, 2003). The k-means clustering, which is employed in the present research, is
briefly described below.

112
4.3.1 k-Means Clustering
k-means clustering is a partitioning technique that was independently discovered in various
scientific fields (Dinh et al., 2014). In spite of the fact that k-means was proposed over 50
years ago and thousands of clustering algorithms have been published since then, k-means
algorithm is well known for its efficiency in clustering large data sets. As the most
commonly used method for statistical data analysis, the k-means procedure divides N-
dimensional population into k sets clusters such that the squared error between the
empirical mean of a cluster and the points in the cluster is minimized. According to Jain
(2010), data clustering has been used for three main purposes: (i) to gain insight into data,
generate hypotheses and identify salient features; (ii) to identify the degree of similarity
among forms or organisms; and (iii) as a method for organizing the data and summarizing
it through cluster prototypes. With respect to the computation algorithm, k-means
clustering proceeds by randomly selecting k initial cluster centers (cᵢ), and then iteratively
refining them according to two steps: (i) each data point is assigned to the data set
associated with the nearest centroid, where the Euclidean distance between the data point
xᵣ and the centroid cᵢ of cluster c is calculated using Equation 4-11; (ii) each cluster center
cᵢ is updated to be the mean of its constituent data points. The two steps are repeated until
the centroids and data points no longer move and the clustering process stops (Wagstaff et
al., 2011).
𝑑(𝑥ᵣ, 𝑐ᵢ) = (∑ |𝑥ᵣᵤ − 𝑐ᵢᵤ|𝑈𝑢=1 )0.5 Eq. 4-11
Where U is the dimension of data needed to be categorized. The number of clusters (k) is
the user defined parameter to perform k-means clustering for a data set.
However, this technique has some inherent shortcomings. For example, the number of
clusters must be set in advance; different initializations can lead to different final
clustering; the data must be numerical and comparable via Euclidean distance and thus, the
algorithm works best on data containing spherical clusters; and is sensitive to points that
do not belong to any cluster. Thus, it could distort the centroid positions and a cluster with

113
empty or few objects may occur in the final result. The k-means algorithm has been
extended in many different ways to improve its performance. Some of these extensions
deal with additional heuristics involving the minimum cluster size and merging and
splitting clusters (Jain, 2010). For instance, in the fuzzy c-means, each data point can be a
member of multiple clusters with a membership value. Replacing the means of clusters
with modes or medians of the data, by introducing some additional algorithmic parameters,
are some of other modifications that have been made by several researchers. The k-modes
algorithm enables the clustering of categorical data in a fashion similar to k-means. The k-
prototypes algorithm, through the definition of a combined dissimilarity measure, further
integrates the k-means and k-modes algorithms to allow for clustering objects described by
mixed numeric and categorical attributes.
4.4 IRT Model Development
IRT testing was conducted onsite in a real-world application. An in-service RC bridge deck
in Quebec, Canada was scheduled, by the Quebec Ministry of Transportation (MTQ) for
rehabilitation. Delaminations, extent of corrosion and high chloride ions content in the
bridge were recently outlined by a condition survey. Thus, the bridge was considered as a
good candidate and selected for the IRT survey. The bridge was constructed in 1969. Its
deck is connected directly to the supporting abutments with no provision in the form of
bearings. The critical deck characteristics include a total length of 44.8 m with a transverse
width of 9.1 m, which translates into 8 m of drivable surface (supports one lane of traffic
in each direction) with one side shoulder. The deck exhibited scaling and pop-outs
throughout, with presence of numerous transverse, longitudinal and diagonal cracks.
Figure 4-5 illustrates the location of the surveyed bridge.
Figure 4-5: Illustration of the selected concrete bridge located in Montreal, Quebec.

114
4.4.1 Data Collection
The IRT survey was carried out according to ASTM D4788-03 using a vehicle-based IRT
system. The utilized thermal IR camera was FLIR T650sc. The camera is equipped with
an uncooled microbolometer detector capable of detecting the IR radiation in the spectral
range of 7.5-14 μm, with thermal sensitivity of 0.03˚C at 30⁰ C. It displays thermal images
with a resolution of 640 x 480 pixels and has a built-in dual 5 Mpixel digital camera and
GPS system. The camera is accommodated with a 25˚ x 19˚ FOV. Its features and
specifications are summarized in Table 4-1.
Table 4-1: Features and specifications of the utilized thermal camera
Characteristic Specification
Detector Type Uncooled Microbolometer
Spectral Range 7.5μm – 13μm
Thermal Resolution 640 x 480
Thermal Sensitivity
Frame Rate
Field of View
Temperature Range
Focus
Accuracy
Built-in Digital Camera
0.03⁰ C at 30⁰ C
30 Hz
25⁰ x 19⁰
-40⁰C to 2000⁰C
Automatic
+/- 1⁰ C, +/- 1% of reading
5 MP
Collecting thermal IR images over the entire bridge deck area is highly dependent on the
camera’s FOV and lens. The ideal option for data collection is to scan one lane on each
pass. However, obtaining such horizontal FOV is not always achievable in the field.
Therefore, to reduce the number of survey passes, a calibrated 13.1 mm focal lens was
utilized. Using this lens means that this camera needed to be located 5.2 m above the
concrete bridge deck to cover an entire lane width of 4 m in a single image, which was not
a practical solution. Subsequently, for this field deployment, the IR camera was mounted
at a height of 2.6 m and oriented facing straight-down to the concrete deck surface to reduce
distortion along the image edges. Thus, the angle of the images would be consistent from
one image to the next. This allows a 2.13 m x 1.62 m FOV for each image and to survey
each single lane with only two passes. Figure 4-6 illustrates the vehicle mounted setup.
The survey was carried out according to ASTM D 4788-03 (2013), where the vehicle

115
mounted thermal IR camera was driven at a low driving speed of 20 km/hr. over the center
of each pass assisted by traffic control. The IR camera was triggered to acquire data every
0.91 m (3 ft.) over the entire deck length. Hence, a total of 392 thermal and digital images
were collected, which cover the entire bridge deck. The survey of the deck top surface was
conducted twice: The first survey was done on October 23rd, 2015 at 9 PM, two hours after
sunset. The second survey was conducted on October 27th, 2015 at 1 PM, six hours after
sunrise. In addition, the bridge soffit was surveyed on October 24th, 2015 at 2 PM, seven
hours after sunrise, to maximize contrast on the images. IR images were captured for the
bridge soffit from the ground level, without need for a bridge access vehicle or controlling
traffic under the bridge. The images were taken as snapshots using the available 13.1 mm
focal lens. This allowed a 6.4 m x 5.18 m FOV and hence, a total of 28 thermal and digital
images were collected, which covers the entire bridge soffit.
Figure 4-6: Illustration of the FLIR T650sc IR camera and vehicle mounted setup
system utilized to survey Montreal bridge.
The concrete emissivity of 0.95, distance between the front lens of the camera and the
concrete deck, actual ambient temperature, reflected temperature, and humidity at the
beginning of the data collection were input into the camera software to calibrate the
temperature measurements and compensate for the radiation being absorbed in the

116
atmosphere. Bridge deck dryness was considered during data collection since surface
moisture can reduce the thermal contrast on the IR images. Sun direction was also
considered during the second data collection survey to avoid shadows on images. The total
time of data collection for each survey was approximately two hours. Table 4-2
summarizes the environmental conditions during both surveys, as well as the ambient
temperature variation over the time period the images were captured. The Matlab image
acquisition toolbox was utilized to initialize acquisition and storage of the IR and digital
images. The digital images were used to separate patches and surface defects from
subsurface anomalies.
Table 4-2: Environmental conditions during IR surveys of Montreal bridge
Bridge
Element
Survey
Date
Time of
Data
Collection
Ambient
Temperature
(⁰ F)
Ambient
Temperature
Variation (⁰ F)
Wind
Speed
(mph)
Humidity
(%)
Deck 23/10/2015 9.00 PM 39 - 6 11.3 37
27/10/2015 1.00 PM 56 - 5 8.1 26
Soffit 24/10/2015 2.00 PM 60 - 7 6 32
Data on thermal cameras appears as a color-coded image in which a color palette is
assigned to temperatures at a certain “level” and across a certain “span” determined by the
user. The span of the image is the difference between the minimum and maximum
temperature displayed in the image, and the “level” is the center of the span. Figure 4-7
shows two typical thermal images taken during the conducted survey at two different times.
Based on the visual interpretation, which is a subjective technique, the defective area can
be identified and quantified. For example, the image on the left shows a delamination after
several hours of exposure to sunlight being much warmer than the surrounding concrete.
The image on the right was taken two hours after sunset and shows a delamination cooling
faster than the surrounding solid concrete. It should be noted that it is important to take
optical images of the bridge deck during IRT surveys in order to provide a preliminary
assessment of the surface deck condition. Consequently, the visual interpretation of the
captured thermal images could highlight and separate patches and surface defects from
actual subsurface anomalies.

117
Figure 4-7: Delamination at (a) daytime; and (b) nighttime surveys.
Extracting quantitative information, such as size and location of defective areas from a set
of IR images, is one of the critical components of thermal data analysis. The challenge here
is to develop an automated procedure capable of detecting subsurface defects regardless of
the difference in the temperature ranges between various IRT surveys taken at different
times and environmental conditions. The developed procedure to achieve this goal consists
of several steps as described below.
4.4.2 Image Pre-Processing
In this step, the quality of the thermal images was improved. Three functions in The FLIR
Tools+ and ResearchIR software were utilized to enhance the images. For instance, the
Gaussian smoothing filter was used to reduce the level of images’ background noise where
the software selects the size of the filter automatically. Thus, improving the images’
resolution, which facilitated the view of small objects. The histogram equalization function
was used to distribute the intensities on the histogram, which in turn increased the dynamic
range and enhanced the image’s thermal contrast. The multi-spectral dynamic imaging
function was also utilized. It is a fusion algorithm that embosses visible spectrum details
(from the digital camera) onto the infrared image, enabling sharper-looking and quicker
target orientation. This phase is useful to differentiate delaminated areas from surface
features appearing in the infrared image (e.g. discoloration, oil stains and rust deposits,
etc.), yet are unrelated to subsurface conditions. The temperature data of each image was
then saved in a separate Excel file using the ResearchIR software.

118
4.4.3 Image Registration
The purpose of this step is not to transform the images into one coordinate system, as
commonly processed, but to combine the enhanced IR images together to create a plan-
view mosaic of the entire bridge deck (mosaicked thermogram). The stitching algorithm to
be applied depends on comparing the pixels’ features in the images to be grouped and
requires exact overlap. However, parallax and geometric distortions, which often occur
when an image is captured while the vehicle is moving, makes the creation of such a mosaic
from the large numbers of images a difficult task. In addition, commercial software capable
of stitching images produce non-radiometric mosaic images, which could lose its dynamic
range. To overcome this problem, an algorithm was developed as illustrated in Fig. 4-8.
Figure 4-8: Developed algorithm for condition assessment of concrete bridge decks.

119
The analysis process starts by extracting a selected window from each image and stitching
it together with the extracted window from the next image and so on as per Equation 4-
12. This procedure requires the collection of IR images with sufficient overlap and at
known traveled spacing based on the camera’s FOV. However, the height of each stitched
window was the number of pixels that are equivalent to the images’ spacing. Hence, this
appending process produced continuous data for each survey pass. The dimension in pixels
of each window depends on the resolution of the camera and the image spacing. A special
Matlab code was written to extract and stitch the selected pixels from each image where
the number of the first image, the last image, and the selected pixels were maintained as
variable to automate the selection process with any other survey data.
{
𝑓𝑜𝑟 𝑖 = 1 → 𝑁
𝛼1 = (𝑁 − 1) (𝑟2 − 𝑟1) + 𝑟1𝛼2 = (𝑁 − 1) (𝑟2 − 𝑟1) + 𝑟2𝛽1 = (𝑁 − 1) (𝑐2 − 𝑐1) + 𝑐1𝛽2 = (𝑁 − 1) (𝑐2 − 𝑐1) + 𝑐2}
Eq. 4-12
𝐸𝑖 (𝑅, 𝐶)𝑅= 𝑟1 → 𝑟2𝐶= 𝑐1 → 𝑐2
∈ 𝑂𝑖(𝐼, 𝐽)𝐼=1 → 𝑚𝐽=1 → 𝑛
𝑎𝑛𝑑 𝑀 (𝛼, 𝛽)𝛼= 𝛼1 → 𝛼2𝛽= 𝛽1 → 𝛽2
Where:
𝑂𝑖: 𝑂𝑟𝑖𝑔𝑖𝑛𝑎𝑙 𝑚𝑎𝑡𝑟𝑖𝑥 𝑜𝑓 𝑒𝑛ℎ𝑎𝑛𝑐𝑒𝑑 𝑖𝑚𝑎𝑔𝑒 𝑖 𝑖 ∈ (1,2,3… .𝑁)
𝑁: 𝑛𝑢𝑚𝑏𝑒𝑟 𝑜𝑓 𝑖𝑚𝑎𝑔𝑒𝑠
𝐸𝑖 : 𝐸𝑥𝑡𝑟𝑎𝑐𝑡𝑒𝑑 𝑚𝑎𝑡𝑟𝑖𝑥 𝑓𝑟𝑜𝑚 𝑜𝑟𝑖𝑔𝑖𝑛𝑎𝑙 𝑚𝑎𝑡𝑟𝑖𝑥 𝑂𝑖
𝑟1 , 𝑟2 ∶ 𝑆𝑡𝑎𝑟𝑡 𝑎𝑛𝑑 𝑒𝑛𝑑 𝑟𝑎𝑤𝑠 𝑜𝑓 𝑎𝑛 𝑒𝑥𝑡𝑟𝑎𝑐𝑡𝑒𝑑 𝑚𝑎𝑡𝑟𝑖𝑥 𝐸𝑖
𝑐1 , 𝑐2 ∶ 𝑆𝑡𝑎𝑟𝑡 𝑎𝑛𝑑 𝑒𝑛𝑑 𝑐𝑜𝑙𝑢𝑚𝑛𝑠 𝑜𝑓 𝑎𝑛 𝑒𝑥𝑡𝑟𝑎𝑐𝑡𝑒𝑑 𝑚𝑎𝑡𝑟𝑖𝑥 𝐸𝑖
𝑀 ∶ 𝑀𝑜𝑠𝑎𝑖𝑐 𝑚𝑎𝑡𝑟𝑖𝑥 𝑜𝑓 𝑡ℎ𝑒 𝑒𝑛𝑡𝑖𝑟𝑒 𝑏𝑟𝑖𝑑𝑔𝑒 𝑑𝑒𝑐𝑘
For visualization and to facilitate further processing, it was necessary to scale-down the
data dimension of the mosaic. This was achieved by assuming that the entire deck was
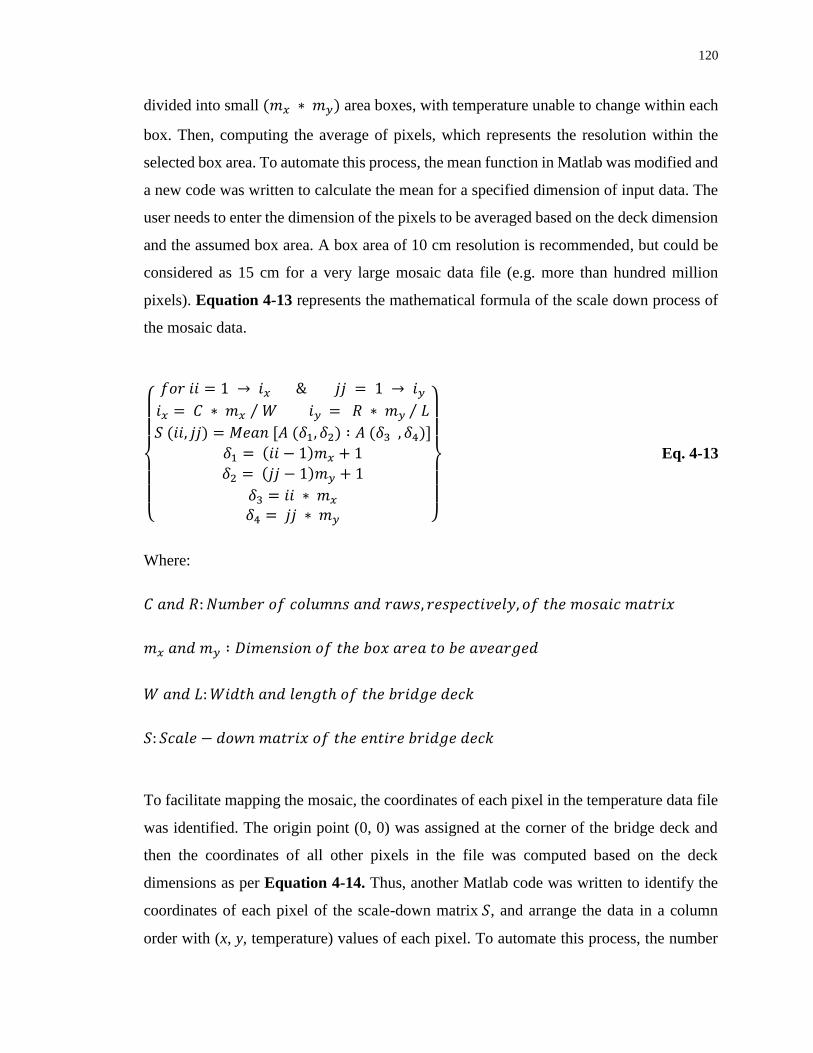
120
divided into small (𝑚𝑥 ∗ 𝑚𝑦) area boxes, with temperature unable to change within each
box. Then, computing the average of pixels, which represents the resolution within the
selected box area. To automate this process, the mean function in Matlab was modified and
a new code was written to calculate the mean for a specified dimension of input data. The
user needs to enter the dimension of the pixels to be averaged based on the deck dimension
and the assumed box area. A box area of 10 cm resolution is recommended, but could be
considered as 15 cm for a very large mosaic data file (e.g. more than hundred million
pixels). Equation 4-13 represents the mathematical formula of the scale down process of
the mosaic data.
{
𝑓𝑜𝑟 𝑖𝑖 = 1 → 𝑖𝑥 & 𝑗𝑗 = 1 → 𝑖𝑦𝑖𝑥 = 𝐶 ∗ 𝑚𝑥 𝑊⁄ 𝑖𝑦 = 𝑅 ∗ 𝑚𝑦 𝐿⁄
𝑆 (𝑖𝑖, 𝑗𝑗) = 𝑀𝑒𝑎𝑛 [𝐴 (𝛿1, 𝛿2) ∶ 𝐴 (𝛿3 , 𝛿4)]
𝛿1 = (𝑖𝑖 − 1)𝑚𝑥 + 1
𝛿2 = (𝑗𝑗 − 1)𝑚𝑦 + 1
𝛿3 = 𝑖𝑖 ∗ 𝑚𝑥
𝛿4 = 𝑗𝑗 ∗ 𝑚𝑦 }
Eq. 4-13
Where:
𝐶 𝑎𝑛𝑑 𝑅:𝑁𝑢𝑚𝑏𝑒𝑟 𝑜𝑓 𝑐𝑜𝑙𝑢𝑚𝑛𝑠 𝑎𝑛𝑑 𝑟𝑎𝑤𝑠, 𝑟𝑒𝑠𝑝𝑒𝑐𝑡𝑖𝑣𝑒𝑙𝑦, 𝑜𝑓 𝑡ℎ𝑒 𝑚𝑜𝑠𝑎𝑖𝑐 𝑚𝑎𝑡𝑟𝑖𝑥
𝑚𝑥 𝑎𝑛𝑑 𝑚𝑦 ∶ 𝐷𝑖𝑚𝑒𝑛𝑠𝑖𝑜𝑛 𝑜𝑓 𝑡ℎ𝑒 𝑏𝑜𝑥 𝑎𝑟𝑒𝑎 𝑡𝑜 𝑏𝑒 𝑎𝑣𝑒𝑎𝑟𝑔𝑒𝑑
𝑊 𝑎𝑛𝑑 𝐿:𝑊𝑖𝑑𝑡ℎ 𝑎𝑛𝑑 𝑙𝑒𝑛𝑔𝑡ℎ 𝑜𝑓 𝑡ℎ𝑒 𝑏𝑟𝑖𝑑𝑔𝑒 𝑑𝑒𝑐𝑘
𝑆: 𝑆𝑐𝑎𝑙𝑒 − 𝑑𝑜𝑤𝑛 𝑚𝑎𝑡𝑟𝑖𝑥 𝑜𝑓 𝑡ℎ𝑒 𝑒𝑛𝑡𝑖𝑟𝑒 𝑏𝑟𝑖𝑑𝑔𝑒 𝑑𝑒𝑐𝑘
To facilitate mapping the mosaic, the coordinates of each pixel in the temperature data file
was identified. The origin point (0, 0) was assigned at the corner of the bridge deck and
then the coordinates of all other pixels in the file was computed based on the deck
dimensions as per Equation 4-14. Thus, another Matlab code was written to identify the
coordinates of each pixel of the scale-down matrix 𝑆, and arrange the data in a column
order with (x, y, temperature) values of each pixel. To automate this process, the number

121
of rows and columns of the data file and the dimension of the deck were maintained as
variables in the code to accommodate any other survey data. The final output was an excel
file containing pixel information (coordinates and temperature) with no change in the
thermal contrast values over the entire deck.
{
𝑓𝑜𝑟 𝐼 = 1 ∶ 𝐶𝐽 = 1 ∶ 𝑅
𝑥 = (𝑊
𝐶)𝑋 (𝐼 − 1)
𝑦 = 𝐿 − (𝐿
𝑅)𝑋 (𝐽 − 1)}
Eq. 4-14
Where:
𝐶 𝑎𝑛𝑑 𝑅:𝑁𝑢𝑚𝑏𝑒𝑟 𝑜𝑓 𝑐𝑜𝑙𝑢𝑚𝑛𝑠 𝑎𝑛𝑑 𝑟𝑎𝑤𝑠, 𝑟𝑒𝑠𝑝𝑒𝑐𝑡𝑖𝑣𝑒𝑙𝑦, 𝑜𝑓 𝑡ℎ𝑒 𝑠𝑐𝑎𝑙 − 𝑑𝑜𝑤𝑛 𝑚𝑎𝑡𝑟𝑖𝑥
𝑊 𝑎𝑛𝑑 𝐿:𝑊𝑖𝑑𝑡ℎ 𝑎𝑛𝑑 𝑙𝑒𝑛𝑔𝑡ℎ 𝑜𝑓 𝑡ℎ𝑒 𝑏𝑟𝑖𝑑𝑔𝑒 𝑑𝑒𝑐𝑘
4.4.4 Image Segmentation
The output file from the stitching step can be uploaded in image software, such as ImageJ
or AutoPano, to produce a composed mosaic thermogram for the entire deck. However,
further analysis depends on the segmentation technique to be used. Many image
segmentation algorithms have been widely used in the image processing field. The purpose
of the segmentation process is to partition the image into regions of constituent objects
based on the concept of point-based segmentation (e.g. value-based technique), object-
based segmentation (e.g. region growing technique), or edge-based segmentation (e.g. edge
detection technique). Subjective selection of threshold values remains a limitation in
applying point-based segmentation, while the simplest type of region growing technique is
to specify some “seed” points as initial regions, and then to aggregate pixels around these
regions into bigger and bigger connected regions based on similarity of defined properties.
However, thresholding classification is adopted herein.
The un-supervised thresholding classification using the k-means clustering function in
Matlab was implemented in the present research to determine objective thresholds. As
previously introduced, the k-means clustering algorithm arbitrarily specifies an initial

122
mean vector for each k cluster. Each pixel is then assigned to the class whose mean vector
is closest to the pixel vector, thus forming the first set of decision boundaries. The new set
of cluster mean vectors is then calculated from this classification and the pixels are
rearranged. The iterations are continued until there is no significant change in pixel
assignments from one iteration to the next or a maximum number of iterations is achieved.
It should be noted that there is no established mathematical criterion to identify significant
change in data point assignment or the maximum number of iterations. Data was
characterized in this study based on one feature vector, which is the pixel numerical
temperature values.
4.4.4.1 Identifying the Number of Clusters (Categories)
The k-means clustering requires defining the number of clusters before the algorithm starts.
Figure 4-9 illustrates a rational approach to determine the appropriate number of condition
categories (clusters). The flowchart is based on the age of the bridge deck, the thermal
contrast values obtained from the thermal images, and the existing deterioration condition
of the bridge deck, which can be determined from digital images and visual inspection of
the deck. Newly constructed bridges typically experience few problems during their first
decade of service, and thus, it is unlikely that deterioration initiates in bridge decks under
10 years of age. This can justify the selected 10-year decision point in the flowchart. ASTM
D4788-03 indicates that a temperature difference between the delaminated or debonded
area and the adjacent solid concrete of at least 0.5°C must exist to identify delamination by
an imaging infrared scanner. This value was adopted herein to differentiate between the
sound and deteriorated concrete in order to determine the number of clusters as illustrated
in the flowchart. With respect to the deterioration criteria, delamination is defined as a
discontinuity of the surface concrete, which is substantially separated but not completely
detached from the concrete below or above it and hence, it is invisible. Spalling was chosen
from the defects commonly occurring in concrete bridge defects because it is often the
continuation of the delamination process, which represents distressed areas. The pressure
exerted by corrosion of reinforcement or by the formation of ice in the delaminated area
results in the breaking off of the delaminated concrete. Spalling may also occur due to
continued deterioration of the old concrete. The Ontario Structure Inspection Manual

123
(OSIM, 2008) differentiates between light, medium and severe spalling based on defined
measures of the spalling areas. These measures were used in the flowchart to determine the
number of clusters.
Consequently, the k-means clustering algorithm in Matlab was applied and objective
thresholds were identified. It should be noted that the flowchart was developed for concrete
bridges with bare decks, while for paved bridge decks the thermal contrast of 0.5°C could
be due to the effect of pavement thickness. In addition, spalling could be hidden under the
asphalt layer. Therefore, a higher thermal contrast value and visual condition of the deck
should be considered in such cases, which requires further research involving scanning of
paved bridge decks.
Figure 4-9: Flowchart for determining number of condition categories (k).

124
4.4.5 IRT Condition Mapping
Based on the threshold value of each condition category, the temperature values were
grouped into the same number of clusters. Accordingly, a condition map was plotted using
a commercial mapping software to reconstruct a high contrast composite image accurately
delineating the severity of subsurface defects. Such a delamination map created from the
output of IRT bridge inspection can be used to determine the total percentage area of
delamination in each category over the entire bridge deck.
4.5 IRT Model Implementation
The procedure proposed in the present research was implemented on the surveyed deck
and can be summarized as follows: (i) the images were enhanced using FLIR+ and
ResearchIR software and the data was then saved as .csv files; (ii) a selected window of
600 x 270 pixels, which represents 0.91m spacing of the images, was extracted from each
image and stitched with the extracted window from the next image using an especially
developed Matlab code. For a 44.8 m long bridge, the dimension of the stitched strip was
600 x 13,230 pixels and 2400 x 13,230 = 31.75 million pixels for the entire two lane deck;
(iii) the data dimension was scaled-down using the Matlab code assuming that the entire
deck was divided into small 10x10 cm area boxes, with temperature unable to change
within each box, and thus, this resulted in a reduced file with 80 x 450 = 36,000 pixels; (iv)
the coordinates of each pixel were identified, and the pixels were arranged in a column
order with (x, y, temperature) values of each pixel, using the Matlab code; and (v) the k-
means clustering algorithm in Matlab was run to identify the thresholds.
The number of clusters (k) for this bridge was determined as three, considering the
developed flowchart, where the bridge deck being considered is about 47 years old, its
recorded thermal contrast was higher than 0.5⁰ C, and maximum spalling of 225 mm was
measured. The condition maps of the deck were plotted and illustrated in Fig. 4-10 and
Fig. 4-11, delineating the severity of the subsurface defects at the daytime and nighttime
surveys, respectively.

125
Figure 4-10: Condition map of the daytime IRT survey of bridge deck in Montreal
indicating the severity of the identified delaminated areas.
Figure 4-11: Condition map of the nighttime IRT survey of bridge deck in Montreal
indicating the severity of the identified delaminated areas.
As previously discussed, the thermal energy transferred via conduction is affected by the
thermal properties of the concrete, while the thermal conductivity of concrete is dependent
on the type of aggregate used in the concrete mixture. However, for concrete bridge
components outdoors, convective heat transfer can play a significant role.
The developed procedure for producing a mosaic plan of the bridge deck was not applicable
for the soffit case as the images were taken at different angles. Therefore, the images of the
bridge soffit were processed individually to identify the delaminated areas in each image.

126
Having a camera with a larger field of view can solve this issue to some extent, and having
less images on the overall bridge soffit can make the data procedure faster and more
practical. However, caution must be taken in using the wide-angle lens for the thermal IR
camera as the edges of the thermal IR images may be distorted and become not viable for
calculating the number of pixels and area of delamination. Figure 4-12 displays a subset
of thermal and related digital images, which were captured by the infrared camera on the
bridge soffit, delineating the potential of delaminated areas. Vladimir (2014) reported that
the temperature contrasts in soffits are smaller than those for solar exposed surfaces. This
was confirmed via the thermal images of the bridge soffit in Fig. 4-12.
Figure 4-12: Thermal and digital images of potential delaminated areas in the
bridge soffit.
In order to validate the model thus developed in the present research, the analysis procedure
was implemented on three bridge decks located in the state of Wisconsin, USA. The
bridges’ description, IRT data collection methodology, adopted analysis procedure and
results are briefly discussed below.

127
4.5.1 Bridge (A)
The bridge was constructed in 1963, and consists of seven spans of continuous concrete
box girders with a 367.5 mm RC slab deck. The bridge was scanned on July 15, 2010 using
IRT. The critical deck characteristics include a total length of 296.9 m with a transverse
width of 10.7 m, which translates into 9 m of drivable surface with two side shoulders. The
IRT survey was conducted by Infrasense, a consulting firm specializing in NDT of bridge
decks. The infrared data was collected with corresponding high resolution video at a low
driving speed of 20 km/hr. using a vehicle-based system. The IR camera model used was
FLIR A41 (M). The camera displays thermal images with a resolution of 320 x 240 pixels.
Its features and specifications are summarized in Table 4-3. The camera was fixed at 45⁰
to have a FOV that covers one lane per driving pass. The images were taken every 0.305-
m (1 ft.) over the 296.9 m of the deck length, hence a total of 1,948 images were collected,
which cover the entire two-lane bridge deck. The environmental conditions during the
survey are shown in Table 4-4.
Table 4-3: Features and specifications of the utilized thermal camera
Characteristic FLIR A40(M)
Detector Type Uncooled Microbolometer
Spectral Range 7.5μm – 13μm
Thermal Resolution 320 x 240
Thermal Sensitivity
Frame Rate
Field of View
Temperature Range
Focus
Accuracy
Built-in Digital Camera
0.08⁰ C at 30⁰ C
60 Hz
24⁰ x 18⁰
-40⁰C to 200⁰C
Automatic
+/- 2⁰ C, +/- 2% of reading
N/A
Table 4-4: Environmental conditions during IR surveys of Wisconsin bridges
Bridge
Survey
Date
Time of
Data
Collection
Ambient
Temperature
(⁰ F)
Ambient
Temperature
Variation
(⁰ F)
Wind
Speed
(km/h)
Humidity
(%)
Br. (A) 15/07/2010 2.00 PM 84 - 9 12.9 38
Br. (B) 31/05/2011 1.30 PM 80 - 10 16.1 51
Br. (C) 02/07/2015 12.45 PM 76 - 8 9.7 43

128
The developed analysis procedure was implemented as follows: (i) the images were
enhanced using FLIR software and the temperature data was then saved as .csv files of all
images; (ii) a selected window of 320 x 25 pixels, which represents one foot image spacing
was extracted from each image and stitched with the extracted window from the next
image. The dimension of the final stitched file was 640 x 24350 = 15.584 million pixels
for the entire two lane deck; (iii) the data dimension was scaled-down and resulted in a
reduced file with 60 x 1980 = 118,800 pixels; (iv) since the deck is too long compared with
its width, the data was divided into three sections, where each section represents one third
of the bridge length; (v) the co-ordinates of each pixel were identified and then arranged in
a column order with (x, y, temperature) values of each pixel; (vi) the k-means clustering
algorithm in Matlab was applied to identify the thresholds. The number of clusters (k) for
this bridge was determined as three, based on the developed flowchart in Fig. 4-9; and (vii)
the condition map was plotted. Figure 4-13 illustrates the condition map of the first bridge
deck section (dimensions in meter) delineating the severity of the subsurface defects based
on the developed system. Figure 4-14 illustrates the IRT delamination map of the same
section (dimensions in feet) as per the record of the Wisconsin DOT.
Figure 4-13: Condition map of bridge (A) indicating the identified delaminated
areas using the developed IRT system.
Figure 4-14: Condition map of bridge (A) indicating the identified delaminated area
as per the record of MOT, Wisconsin (Omar et al., 2018).

129
4.5.2 Bridge (B)
The bridge was constructed in 1965. It consists of three spans of continuous concrete box
girders with a 350.2 mm RC slab deck. The bridge was scanned on May 31, 2011 by
Infrasense using IRT, as part of a condition survey. The critical deck characteristics include
a total length of 26.3 m with a transverse width of 9.15 m, which translates into 8.36 m of
drivable surface (supports a lane of traffic in each direction) with one side shoulder. The
IRT survey methodology was carried out similarly to bridge (A) where the same IR camera
was utilized. The survey conducted in three passes to include the side shoulder. The images
were taken every 0.305 m (1 ft.) over the deck length, hence a total of 261 images were
collected, which cover the entire two lanes and the shoulder of the bridge deck. The
environmental conditions during the survey are shown in Table 4-4. The data was analyzed
similar to the previous cases. The dimensions of the final mosaic were 960 x 2175 = 2.08
million pixels and was scaled down to 90 x 260 = 23,400 pixels. The clustering process
resulted in thresholds, which represent three condition categories. The condition map was
plotted delineating the severity of the subsurface defects as illustrated in Fig. 4-15
(dimensions in meter). Figure 4-16 exhibits the IRT delamination map of the deck as per
the record of the Wisconsin DOT (dimensions in feet).
Figure 4-15: Condition map of bridge (B) indicating the identified delaminated
areas using the developed IRT system.

130
Figure 4-16: Condition map of bridge (B) indicating the identified delaminated area
as per the record of MOT, Wisconsin (Omar et al., 2018).
4.5.3 Bridge C
This bridge was constructed in 1967. It consists of four spans of continuous prestressed
girders with a 362.9 mm RC slab deck. The south and north abutments, as well as the bridge
piers are supported by driven treated temper piles. The bridge was scanned on July 02,
2015 by Infrasense using IRT and GPR as part of a condition survey. The critical deck
characteristics include a total length of 94.5 m with a transverse width of 12.8 m, which
translates into 8.6 m of drivable surface (supports a lane of traffic in each direction) with
two side shoulders. The IRT survey methodology was carried out similarly to bridges (A)
and (B) where the same IR camera was utilized. For this bridge deck with two lanes and
left and right shoulders, the survey was carried out in four passes: one in each lane and one
in each shoulder. The IRT survey produced a series of infrared images across the length of
the deck. The images were taken every 0.305 m (1 ft.) over the deck length, thus a total of
1,240 images were collected. The environmental conditions during the survey are shown
in Table 4-4. The data was analyzed similar to the previous cases. The dimension of the
final stitched file was 1280 x 7750 = 9.92 million pixels and was scaled down to 128 x 945
= 120,960 pixels. The clustering process resulted in thresholds, which represent three
condition categories. The condition map was plotted delineating the severity of the
subsurface defects as illustrated in Fig. 4-17.

131
Figure 4-17: Condition map of bridge C indicating the severity of the identified
delaminated areas using the developed IRT system.
4.6 Evaluation of the Proposed IRT Model
Transportation agencies need more conclusive information as to which exact part of a
structure should be left intact, repaired, or demolished and replaced during the
rehabilitation decision making process. Therefore, creating an accurate condition map with
highlighted delamination categories from thermal IRT data is useful to the bridge
management team and bridge inspectors responsible for ratings. The classification process
adopted for the four bridge cases presented herein resulted in a segmented map for each
deck of the surveyed bridges, clearly distinguishing the severity of identified
delaminations. Sound concrete areas were represented by a green color, concrete areas that
require close monitoring were represented by a yellow color, and warning concrete areas
that require repair were represented by a red color. The thresholds between the three
condition categories were determined based on the developed clustering process without
analyst interference and, thus providing objective classification.
For the surveyed bridge deck in Montreal, the temperature differential between the sound
and unsound areas of the concrete deck in the daytime survey was about 8 ⁰C, as shown in
in Fig. 4-10. During the nighttime survey of the same deck, the image temperature range
was reduced to about 5.2⁰ C, as shown in Fig. 4-11. The sound concrete areas had the
lowest temperature values and the warning concrete areas had the highest temperature
values during the daytime survey. Conversely, the sound concrete areas had the highest

132
temperature values and the warning concrete areas had the lowest temperature values
during the nighttime survey. The reason for this is that, during the day, a warming trend
existed such that the targets had positive thermal contrasts, which meant that the
delaminated regions were at a temperature higher than that of the sound concrete.
Conversely, during the night, a cooling trend existed resulting in the targets having a
negative thermal contrast, which meant that the delaminated regions were at a temperature
lower than that of the sound concrete. In other words, the defective regions warmed at a
faster rate in the daytime survey and cooled at a faster rate in the nighttime survey than
sound concrete. This is the anticipated behavior based on the fundamental heat transfer
theories and complies with previous results reported by Washer et al. (2013) and Chase et
al. (2015). It is also interesting to observe that both daytime and nighttime surveys
identified considerably similar locations and geometries of subsurface defected regions.
However, some defects were not revealed in the nighttime survey. This is most likely due
to the transition between heating and cooling, where there may have been situations where
a defect was not detected due to changes in the heat flow regime. In addition, the ambient
temperature differential during the conducted nighttime survey was only -6⁰ F, while
negative thermal contrast takes a much longer time to develop at the targets (Washer et al.,
2009). Hence, conducting the survey at midnight could produce similar results to the
daytime survey. Yet the veracity of this assumption has not yet been proven. Nonetheless,
it is more common to inspect bridge decks during the day, since the thermal contrast for
defects would be much greater.
For bridges (A), (B), and (C), the temperature differentials between the sound and unsound
regions of the concrete decks were 12.5 ⁰C, 11.9 ⁰ C, and 10.8⁰ C, respectively, as shown
in Figs. 4-13, 4-15, and 4-17, respectively. Regardless of the various thermal contrasts and
the environmental conditions during each survey time, the severity of the delamination was
classified in each case. Again, the sound concrete areas had the lowest temperature values,
while the warning concrete areas had the highest temperature values, since all surveys were
conducted between 1 to 2 PM to ensure maximum thermal contrast. The produced
delamination maps in Figs. 4-13 and 4-15 generally follow the same trend as the
delamination maps in Figs. 4-14 and 4-16, respectively, which were produced by

133
Infrasense using their proprietary software. The location and geometry of subsurface
defected regions were identified with considerably comparable results.
It should be noted that it is common for the identified thresholds in the presented cases to
differ because the IR images were taken at different times and environmental conditions,
especially given the difference in the temperature range over the data collection period.
This variety did not affect the condition categories that identify the severity of
delaminations. However, it was observed that the threshold values, obtained for the four
analyzed data, indicated that sound concrete as it stands for thermal contrast varies from 1
to 2.5⁰ C. These results reinforce the fact that, for outdoor surveys, many factors alter the
concrete surface temperature of the deck under investigation. Consequently, it is suggested
that the ASTM standard should reconsider the specified thermal contrast value (0.5⁰ C) to
differentiate between sound and delaminated areas in a passive IRT testing. It should also
be noted that the developed analysis procedure is capable to identify and classify
delaminated areas at any environmental condition provided that the testing meets the
minimum environmental conditions’ requirements to conduct IRT surveys as specified in
ASTM D4788-03. However, the quantified delaminated area in each condition category
could be influenced to some extent by the recorded thermal contrast at the time of survey.
Further surveys at different times of the year could validate such impact and also evaluate
the accuracy of the achieved results. It is recommended to measure the environmental
variables, such as wind speed, ambient temperature, solar loading and rainfall on site before
the start of each survey.
4.7 Validation of IRT Model Results
4.7.1 Hammer Sounding Test Results
Hammer sounding was conducted on the surveyed bridge deck in Montreal by a bridge
inspector from MTQ, before the IR survey. The created IR delamination map of the bridge
deck was compared with the hammer sounding results and it was found that the two
methods provided very similar sizes and shapes of deck defects. Similarly, the location of
the detected delaminated areas revealed by the IRT result for bridges (A), (B), and (C) were
confirmed by hammer sounding, which was conducted by the inspection team from

134
Infrasense. In addition, the delaminated areas, which were not detected by sounding, were
subsequently clarified through impact echo testing. The non-detected defects over the piers
in bridge (B), were due to the congested steel as indicated in the structural drawings.
Calculating the total delaminated areas in different categories from the mosaicked
thermograms provides a quantified basis for powerful decision making and hence, can be
paramount in prioritizing alternatives for bridge deck repair. The percentage of
delaminated areas in each condition category was calculated by computing the total pixels
in the same category over the total pixels in the entire deck area. Table 4-5 summarizes
the results for the surveyed bridge in Montreal and for bridges (A), (B), and (C). The IRT
delamination maps for bridges (A) and (B), as per the record of the Wisconsin DOT, does
not differentiate the severity of the delaminated areas. Hence, the total percentage of
delaminated areas in the entire bridge decks was indicated. Similarly, the total percentage
of delaminated areas resulting from hammer sounding tests for all bridges were indicated.
The total percentage of delaminated areas in the Montreal bridge soffit was also presented.
It was computed for each image, similar to the procedure adopted for the bridge deck.
The daytime condition map of the Montreal bridge deck showed 42% total delaminated
areas, whereas the total delaminated areas calculated from the nighttime survey was 36%.
Indeed, the concrete mass, thermal inertia and conductivity affect the rate of the transition
process. Thus, some delaminated areas in the daytime survey appeared as sound areas in
the nighttime survey. The hammer sounding results showed 38% total delaminated areas
on the bridge deck and thus, 36% of the total delaminations is common between these two
surveys. Similarly, 32% and 28% total delaminated areas on the bridge soffit were
identified by the hammer sounding and IRT, respectively. However, it should be noted that
it was very hard to locate delaminations at the intersection of the bridge soffit and the
abutments. The delaminations in these areas had very small temperature differences from
the sound concrete. A reason for this is the amount of concrete present in these areas acts
as a large heat sink. Hence, a large temperature change is required to sufficiently affect the
temperature of the concrete and allow easy detection of delaminations using IR cameras.

135
The analysis of IRT data of bridges (A), (B), and (C) showed 39%, 37%, and 28%
respectively, of total delaminated areas on the bridge decks, whereas the total delaminated
areas for Bridges (A) and (B) as per the records of Wisconsin DOT, were 41% and 40%,
respectively from the IR survey and were 37% and 35%, respectively from the hammer
sounding tests. Thus, the developed analysis procedure in this research can define the
location and extent of delaminations in RC bridge decks with considerably high accuracy.
4.7.2 GPR Test Results
The Montreal bridge investigated by IRT in the present research was surveyed using GPR
scanning in September, 2015 (one month before the IR survey) by Radex Detection Inc., a
consulting firm specializing in concrete structure scanning, as part of a condition survey
program. GPR evaluates the condition of concrete bridge decks based on the difference
between reflection amplitudes of the top rebar layer, where strong reflection indicates
sound concrete, while the area with high amplitude attenuation is commonly associated
with the corrosion of steel reinforcement. Details on the utilized equipment and data
acquisition are presented in Chapter 5. The GPR profiles were analyzed based on a line
scan (B-scan) visual image analysis technique. The analyst scrolls through each GPR
profile and marks visible anomalies based on known criteria of deterioration. The
processed profiles are then combined by a proprietary software to create a corrosion map
delineating the corrosion severity as illustrated in Fig. 4-18. In addition, three core drilling
concrete samples for visual and chloride ion concentration analysis were taken from the
bridge deck where two cores were taken at corrosion areas and one core was taken at a
sound concrete area. For the two cores located at corrosion areas, the chloride ion
concentrations were detrimental to the concrete when they were 0.04% by concrete mass,
while the commonly accepted chloride threshold that facilitates rebar corrosion in ordinary
portland cement concrete is 0.025%. This result could validate corrosion identified by the
analysis of GPR scan data. It should be noted that the chloride threshold value could change
in blended cements owing to its enhanced corrosion resistance properties (e.g. lower
chloride and oxygen diffusion coefficients, lower water penetration, etc.).

136
Figure 4-18: Condition map indicating the severity of corrosion for the surveyed
bridge deck in Montreal (Omar et al., 2018).
The GPR scan for bridge C was carried out by Infrasense at the driving speed using a GPR
vehicle-based system for data collection. Details on the utilized equipment and data
acquisition are presented in Chapter 5. The corrosion map as per the records of the
Wisconsin DOT is illustrated in Fig. 4-19. This map was produced by Infrasense
proprietary software after analyzing the GPR scan data. It indicates the location and
geometry of the corroded areas without differentiating their severity.
Figure 4-19: Corrosion map of bridge C as per the record of Wisconsin DOT (Omar
et al., 2018).
In spite of the different mechanisms of both IRT and GPR techniques and their capabilities
of detecting different deterioration types, the IRT delamination map achieved by the
developed analysis in Fig. 4-10 was compared with the corrosion map provided by the
GPR scanning in Fig. 4-18. Though the shapes (geometry) of the two analyses do not match
exactly, the areas in which delaminations/corrosion were detected are mostly the same. The
percentages of the delaminated and corroded areas in both maps were computed and are
presented in Table 4-5. The GPR results showed 38% total corroded areas on the bridge
137
deck, whereas the total delaminated area calculated from the IRT results was 42% (about
10% difference in total defects between the IRT and GPR surveys). This complies with the
results of previous studies. For instance, Maser (2009) reported that in most bridge
structures, areas of corrosion are associated with delamination even if cracks are not
detected directly. Washer et al. (2013) reported that not all delamination can be observed
in GPR images and both GPR and IRT can be used together for accurate identification of
anomalies in highway bridges.
For further verification, the IRT delamination map achieved from the thermal analysis of
bridge C in Fig. 4-17 was compared with the corrosion map provided by the GPR scanning
in Fig. 4-19 since both surveys were conducted on the same day. It can be observed that
all corrosion areas identified by the GPR scan were also indicated by the IRT result.
Conversely, not all the IRT identified delaminated areas were indicated by the GPR result.
The percentages of the delaminated and corroded areas in both maps were computed and
are presented in Table 4-5. The total defected areas in the bridge deck identified by the
GPR and IRT are 23% and 28%, respectively (about 22% difference in total defects
between GPR and IRT surveys). This variance could be due to the identification of only
highly advanced corrosion areas by GPR scanning. It should be noted that while corrosion
is the primary reason leading to delamination in RC bridge decks, there are other possible
causes, such as freezing and thawing cycles and poor quality concrete. Thus, this could be
another reason for obtaining potential corrosion areas smaller than the detected
delaminated areas. However, further evidence from sounding, IE testing and/or core
drilling of concrete samples is required to confirm the detected defects in this case study
before final conclusions can be made.
Generally, any measurement is susceptible to error. Therefore, the results of IRT and GPR
testing presented in Table 4-5 could have some uncertainties in the quantified defective
percentages. For instance, while the utilized camera has a thermal sensitivity of 0.03˚C,
which is a benefit when temperature differences are low, it has a margin of temperature
measurement error up to +/- 1⁰ C. This could affect the maximum thermal contrast recorded
during the survey. Therefore, it is more approparite to evaluate the achieved results in terms
of their precision rather than their accuracy where precision often refers to the closeness of

138
two or more measurements to each other. However, to verify the actual size and shape of
the delamination identified by the proposed analysis procedure, the performance of the
thermal camera could be firstly tested in laboratory validation experiments, to assess how
well it could detect and map delaminations under controlled conditions. Then, error
analysis should be conducted to evaluate the magnitude of variations between the in-situ
scanning and experimental test results. This calibration process should give an overall
measurement accuracy and thus evaluate the accuracy of the proposed analysis procedure.
Table 4-5: Percentage of defective areas in the investigated bridges
Bridge NDT Survey
Type Survey Result
Concrete Condition
Sound Monitoring Warning
Montreal
Surveyed
Bridge
IRT
Nighttime (Deck) 64% 15% 21%
Daytime (Deck) 58% 17% 25%
Daytime (Soffit) 28% Total Delaminated Areas
Hammer Sounding MTQ Record (Deck) 38% Total Delaminated Areas
MTQ Record (Soffit) 32% Total Delaminated Areas
GPR MTQ Record 62% 16% 22%
Bridge
Deck (A)
IRT Present Research 61% 16% 23%
DOT Record 41% Total Delaminated Areas
Hammer Sounding DOT Record 37% Total Delaminated Areas
Bridge
Deck (B)
IRT Present Research 63% 19% 18%
DOT Record 40% Total Delaminated Areas
Hammer Sounding DOT Record 35% Total Delaminated Areas
Bridge
Deck (C)
IRT Present Research 72% 12% 16%
Hammer Sounding DOT Record 25% Total Delaminated Areas
GPR DOT Record 23% Total Corroded Areas
4.8 Further Research to Improve the Proposed IRT Analysis
The IRT analysis procedure developed in this study has some drawbacks that need further
research. For instance, the magnitude of thermal contrast for a set of IR images could be
affected by several factors, such as the thickness of the delamination, the spatial extent of
the delamination and its depth. The presented methodology only considered the spatial
extent of the delamination. While this factor was found to have the most direct and

139
significant effect on the thermal contrast values (Hiasa et al., 2017), the other two factors
need further consideration. In addition, the thermal data was characterized based on one
feature vector (using the pixel numerical values in the IRT images). Other features, such
as the shape and texture were not utilized. Hence, applying other image segmentation
techniques could improve the classification process. Likewise, the k-means technique
employed to identify the threshold values has inherent shortcomings. For instance, it
neglects the stochastic nature of the threshold values. Therefore, some recommendations
to overcome these limitations include: (i) utilizing the ultra-time domain IRT technique
introduced by Washer (2016) through continuous monitoring for detecting the depth and
thickness of delaminations in full-scale RC bridge decks; (ii) applying the region growing
segmentation technique based on similarity of defined pixel properties to provide more
objective classification; (iii) integrating the k-means and k-modes algorithms to allow for
clustering pixels described by mixed numeric and categorical attributes; and (iv) employing
fuzzy c-means technique to consider the uncertainty in pixel assignment where each data
point can be a member of multiple clusters with a membership value.
4.9 Conclusions
The detection of concealed subsurface fracture planes is necessary to determine repair
priorities of bridge decks. IRT enables recording dynamical variations of temperature in
real-time and has been evolved as an effective and well-established non-destructive tool
with the ability to provide meaningful condition information in a non-contact manner for
bridge inspectors and management teams. The present study developed an easily
deployable procedure and a less subjective IRT image analysis to classify the subsurface
defects in concrete bridge decks and present the findings in terms of condition maps
delineating the identified delaminations in different categories. The results obtained on four
full-scale bridge decks demonstrated that temperature differences between delaminations
in the same environment can be detected and categorized using the utilized clustering
technique. Once the IRT images become available, the developed automated procedure can
analyze and determine whether a defect exists with minimum human interference. The
subsurface defected regions identified by the developed analysis provided satisfactory and

140
acceptable results and were confirmed by other NDT techniques including hammer
sounding and GPR scans.
A key finding is that the applied methodology allows for the detection of subsurface
anomalies at different survey times and environmental conditions. The attention herein has
been mainly devoted to the condition evaluation of concrete bridge decks, while an infrared
camera can be advantageously exploited with other bridge components. In future work, the
authors plan to explore the applicability of the developed analysis to bridge soffit areas.
While the developed procedure accurately identified the location and geometry of the
subsurface defects, it did not indicate the depth or thickness of such defects. This could be
another objective of future research. In addition, the application of further developed image
processing tools on the acquired infrared thermal images, along with artificial intelligence-
based approaches, can augment the decision making process to make it faster and fully
automated without human interference. The present study confirms previous findings and
contributes additional evidence, which suggests expanding the use of IRT as a reliable and
rapid condition assessment tool for bridge inspections on both bridge and network levels.
This will help transportation authorities in optimizing resources for bridge inspection, in
prioritizing maintenance needs, and in improving the safety and serviceability of bridges.
4.10 References
ASTM. D4788-03 (2013). “Standard Test Method for Detecting Delaminations in Bridge
Decks Using Infrared Thermography.” ASTM International, West Conshohocken,
PA. www.astm.org.
Bagavathiappan, B., Lahiri, T., Philip, J. and Jayakumar, T. (2014). “Infrared
thermography for condition monitoring – A review.” J. Infrared Physics and
Technology. Vol. 60, pp: 35–55.
Brown, M., and Lowe, D. (2007). “Automatic panoramic image stitching using invariant
features.” International J. Computer Vision. Vol. 74 (1), 59-73.
Chase, S., Adu-Gyamfi, Y., and Tunuguntla, P. (2015). “Bridge Deck Sub-Surface Defect
Detection using Time-lapse Thermography.” Proc., 94th Annual Meeting, TRB,
Washington, D.C. pp: 1-22.
Clark, M., McCann, D., and Forde, M. (2003). “Application of infrared thermography to
the non-destructive testing of concrete and masonry bridges.” NDT&E
International, Vol. 36, 265-275.

141
Dinh, K., Zayed, T., Moufti, S., Shami, A., Jabri, A., Abouhamad, M., and Dawood, T.
(2014). “Clustering-based Threshold Model for Condition Assessment of Concrete
Bridge Decks using Ground Penetrating Radar.” Proc., 93rd Annual Meeting, TRB,
Washington, DC, Vol. No. 2522, 1-11.
Hiasa, S., Birgul, R., and Catbas, F. (2017). “Investigation of effective utilization of
infrared thermography (IRT) through advanced finite element modeling.”
Construction and Building Materials, Vol. 150, 295-309.
Huang, H. (2010). “Artificial neural network model of bridge deterioration.” Performance
of Constructed Facilities, Vol. 24 (6), 597-602.
Jain, K. (2010). “Data clustering: 50 years beyond K-means.” Pattern Recognition Letters,
Vol. 31 (8), 651-666.
Jiang, M., and Li, L. (2008). “Split-window algorithm for land surface temperature
estimation from MSG1-SEVIRI data.” International Journal of Remote Sensing,
Vol. 29 (20), 6067–6074.
Kee, S., Oh, T., Popovics, J., Arndt, R., and Zhu, J. (2012). “Nondestructive Bridge Deck
Testing with Air-Coupled Impact-Echo and Infrared Thermography. Bridge
Engineering, Vol. 17 (6), 928-939.
Maldague, X. (2000). "Applications of Infrared Thermography in Nondestructive
Evaluation". Trends in Optical Nondestructive Testing, 591-609.
Manning, D., and Holt, F. (1982). “Detecting Delaminations in Concrete Bridge Decks.”
Concrete International, ACI, Vol. 2 (11), 1-8.
Maser, K. (2009). “Integration of Ground Penetrating Radar and Infrared Thermography
for Bridge Deck Condition Testing.” Materials Evaluation. Vol. 66, 1130-1136.
Maser, K., and Roddis, W. (1990). "Principles of Thermography and Radar for Bridge
Deck Assessment." Transportation Engineering. Vol. 116 (5), 583-601.
Melhem, H. and Cheng, Y. (2003). “Prediction of Remaining Service Life of Bridge Decks
Using Machine Learning.” Computing in Civil Engineering, Vol. 17 (1), 1-9.
Meola, C., (2012). “Origin and theory of infrared thermography.” Published by Bentham
eBooks: Infrared Thermography Recent Advances and Future Trends, C. Meola
(Ed.), 3-28.
Omar, T., Nehdi, M., and Zayed, T. (2018). “Infrared Thermography Model for Rational
Condition Assessment of Concrete Bridge Decks.” J. of Construction and Building
Materials. Vol. 168, pp: 313-327. DOI: 10.1016/j.conbuildmat.2018.02.126.
Qianqian, W., jinghai, L., Youna, L. (2002). “Segmentation of infrared image using
adaptive thresholding.” Proc. SPIE, Vol. 4925: Electronic Imaging and Multimedia
Technology III, 265-269.
Rinaldi, R. (2012). “Infrared devices: short history and new trends.” Published by
Bentham eBooks: Infrared Thermography Recent Advances and Future Trends, R.
Rinaldi (Ed.), 29-59.

142
Robert, M. (1982). “Science behind Thermography-Thermal Infrared Sensing for
Diagnostics and Control.” Thermosense, Vol. 371, 2-9.
Usamentiaga, R., Venegas, P., Guerediaga, J., Vega, L., and Molleda, J. (2014). “Infrared
Thermography for Temperature Measurement and Non-Destructive Testing.”
Sensors, Vol. (14), 305-348.
Vaghefi, K., Ahlborn, T., Harris, D., and Brooks, C. (2015). Combined imaging
technologies for concrete bridge deck condition assessment.” Performance of
Constructed Facilities, Vol. 29 (4), 1-8.
Vaghefi, K., Oats, R., Harris, D., Ahlborn, T., Brooks, C., Endsley, K., Roussi, C., and
Shuchman, R. (2012). “Evaluation of Commercially Available Remote Sensors for
Highway Bridge Condition Assessment.” Bridge Engineering, Vol. 17, 886-895.
Vladimir V. (2014). “Thermal NDT: historical milestones, state-of-the-art and trends.”
Quantitative Infrared Thermography. Vol. 11 (1), 66–83.
Wagstaff, K., Cardie, C., Rogers, S., and Schrödl, S. (2011). “Constrained k-means
clustering with background knowledge.” Proc., 18th International Conference on
Machine Learning, Vol. 1, 577-584.
Washer, G., Fenwick, R., and Nelson, S. (2013). “Guidelines for the Thermographic
Inspection of Concrete Bridge Components in Shaded Conditions.” Proc., 92nd
Annual Meeting, TRB, Washington, D.C., 1-14.
Washer, G., Fenwick, R., and Harper, J. (2009). “Effects of Environmental Variables on
Infrared Imaging of Subsurface Features in Concrete Bridges.” Transportation
Research Board, Vol. No. 2108, 107-114.
Watase, A., Birgul, R., Hiasa, S., Matsumoto, M., and Catbas, N. (2015). “Practical
identification of favorable time windows for infrared thermography for concrete
bridge evaluation.” Construction and Building Materials, Vol. 101, 1016-1030.
Wu, X., Yao, H., Xie, D., and Xu, Z. (2012). “Developing of management information
system of road and bridge infrastructure based on ArcGIS engine.” Proc., 2nd
International Conference, Remote Sensing Environment and Transportation
Engineering (RSETE), IEEE, 1-3.

143
Chapter 5
5. Condition Assessment of Reinforced Concrete Bridge Decks
Using Infrared Thermography and Ground Penetrating
Radar
5.1 Introduction
Corrosion of reinforcing steel has been identified as a significant contributor to RC bridge
deck deterioration that can affect bridge deck integrity, and thus is one of the greatest
concerns in bridge engineering. Precise evaluation of the condition of RC bridge decks,
particularly for corrosion induced delaminations, is essential for ensuring bridge
performance and safety. Ground penetrating radar (GPR) is one of the most appropriate
NDT technologies for inspecting concrete bridge decks subjected to this deterioration
mechanism. GPR testing has many advantages, such as its capability to evaluate the
conditions for a corrosive environment, its inspection process, which does not require
expertise, its relatively inexpensive cost compared with other NDT technologies, its high
ability to rapidly survey large areas with full coverage, and its ability to achieve rapid data
analysis. GPR uses electromagnetic (EM) signals for subsurface imagery. Several
researchers investigated the materials characteristics recognized by EM signals either in
the laboratory or in-service bridge decks. The raw GPR data is commonly represented as
images that can be processed using several methods to obtain condition maps of the entire
bridge decks that indicate the potential of active corrosion areas.
A new approach to NDT has been made in that it is recognized that making use of a
combination of NDT methods will give the best possible harvest of information. Alani et
al. (2013) reported that extra financial implications of using a combination of NDT
techniques is acceptable if the evaluation outcome can be seen to have been enhanced.
Indeed, GPR and IRT represent two technologies that can provide the needed information.
Each technology has been developed and enhanced by improvements in hardware,
software, and understanding of the interpretation of data. However, cogent procedures for
deciphering their data have yet to be developed. In addition, little effort has been devoted
to integrating the two technologies into a system that benefits from the strengths of both

144
(Maser, 2009). For instance, Maser and Roddis (1990) presented results of field studies
using GPR and IRT on asphalt overlaid bridge decks and reported that the combined
techniques were able to predict the total area of deterioration to within 5% of what was
actually measured. Currently, there is limited research work describing the combined use
of the results of these two methods.
In Chapter 4, an objective analysis for detecting and classifying delaminations in full-scale
concrete bridge decks using passive IRT testing was developed and demonstrated through
several case studies. In this Chapter, a robust procedure for uniting the IRT and GPR test
results is developed. To achieve this goal, the following objectives are pursued throughout
the chapter sections: (1) studying the working principles of GPR and its application for
concrete bridge inspection as well as current analysis and interpretation methods of GPR
scan data; (2) analyzing GPR data and identifying objective thresholds to produce a
condition map that defines the severity levels of potential active corrosion in RC bridge
decks; (3) analyzing IRT data and identifying objective thresholds for creating a condition
map that designates the severity levels of delaminations in RC bridge decks; and (4)
combining IRT and GPR results to produce an integrated condition map for aging RC
bridge decks which classifies the severity levels of detected subsurface defects.
Figure 5-1 illustrates the adopted systematic methodology to achieve the above-mentioned
objectives. It can be summarized as follows: (1) conducting GPR scanning and passive IRT
testing on two deteriorated full-scale concrete bridge decks; (2) analyzing the GPR data to
extract the amplitude of the reflected waves using the conventional numerical amplitude
method; (3) analyzing the IRT data to produce a thermal thermogram for the entire bridge
deck from the IR images using the developed automated procedure presented in Chapter 4;
(4) applying the k-means classification technique to determine objective thresholds for both
GPR and IRT test results; (5) producing bridge deck condition maps identifying the
severity levels of delaminations and the potential active corrosion areas from the IRT and
GPR testing, respectively; and (6) integrating the analyzed GPR and IRT data using a
specially written Matlab code to produce a condition map of the entire bridge deck. To
verify the results, the detected defects were quantified and compared with results on the
same bridge decks provided by other technologies.

145
Figure 5-1: Methodology adopted to evaluate RC bridge deck condition using the
integration of IRT and GPR testing results.
5.2 Ground Penetrating Radar (GPR)
5.2.1 Basic Principle of GPR
GPR emits short pulses of EM waves for subsurface imagery to detect anomalies in
concrete bridge components. Electric conductivity, permittivity and permeability of the
concrete are properties that have the greatest effect on the penetration depth of GPR signals
and its resolution (Barnes et al., 2008). The electric conductivity of a material is its ability
to conduct the electric portion of an EM wave and is affected by the moisture content of
the concrete. The higher the moisture content, the higher the conductivity, resulting in
shallower GPR signal penetration depth. Dielectric permittivity is the ability of a material
to store and transmit an electric charge induced by an EM field. Permeability is the ability
of the material to become magnetized in the presence of an EM field. However, when EM
energy goes through an interface between two materials of different dielectric properties,
the intensity of reflection is determined by the change in the dielectric permittivity and
conductivity of materials, where strong reflections indicate higher change in the electrical

146
properties at interfaces. The relationships between the received signal and the dielectric
permittivity and conductivity of materials are described in Equations 5-1 and 5-2.
𝑅 = √휀1 − √휀2
√휀2 + √휀1 𝐄𝐪. 𝟓 − 𝟏
𝛼 = 1.69 × 10³ 𝜎
√휀 𝐄𝐪. 𝟓 − 𝟐
Where: R is the reflection coefficient; 휀1 and 휀2 are the dielectric constant of the first and
second material, respectively; 𝛼 is the signal attenuation; and 𝜎 is the conductivity of the
material. When the dielectric constant of the first material is smaller than the dielectric
constant of the second material, the result of Equation 5-1 will be negative. Although the
shape of reflection waveform looks the same as the original pulse, their directions (or
polarity) are different. This effect, in radar theory, is called change in polarity or phase
reversal and should be considered when analyzing GPR signals. It should also be noted
that the conductivity of concrete increases with the increasing frequency. Thus, the EM
wave of a lower frequency can penetrate deeper inside the structure than that of a higher
frequency (Halabe et al., 1993).
Generally, a GPR system includes data collection units and antennas, of which there are
two types: mono-static and bi-static. Mono-static antennas consist of one antenna that
performs both transmitting and receiving functions, while bi-static antennas include
separate antennas for transmitting pulses and receiving those that are reflected (Belli et al.,
2011). However, a transmitter antenna emits EM pulses from the surface of the concrete
member being investigated at a desired frequency, and then these pulses propagate through
the member. The receiving antenna collects the reflected pulses and records their
properties, such as wavelength, two-way travel time and amplitude, to analyze and interpret
the potential of subsurface corrosion (Gucunski et al., 2013). The changes between
transmitted and reflected pulses indicate a change in the materials’ properties. Typically,
the corroded rebar area in concrete structures has a low dielectric constant, producing

147
weaker reflected pulses. Therefore, the amplitude of reflection and attenuation are
measured as an indication of potential rebar corrosion (Alani et al., 2013).
The evaluation of GPR system performance depends on the ability of the EM signals to
propagate to the required depth and the resolution of the resulting “images”. Therefore, the
frequency of the antenna is a critical parameter that should be carefully selected to suit the
survey’s objective. The propagation depth and resolution are both based on the wavelength
of the transmitted signal because the frequency is inversely related to the wavelength.
Higher frequency will have shorter wavelengths that produce a narrow cone of transmitted
waves, which can focus on smaller areas. To obtain high-quality images, the wavelength
should be short, which means that the frequency will be high. In other words, the higher
the frequency, the better the resolution, and the shallower will be the propagation depth.
5.2.2 Application of GPR for Concrete Bridge Inspection
GPR scanning has been applied for several decades to evaluate the corrosive environment
in RC bridge decks with and without overlays. Based on the operation methods, there are
two types of GPR systems: air-coupled and ground-coupled. An air-coupled system is
connected to a moving vehicle for rapid survey of highways with minimum traffic
interruption. Yet, this scheme reduces the quality of the scanned images. Conversely, a
ground-coupled system is dragged manually on a pushing cart and requires direct contact
with the concrete bridge surface under investigation, usually providing better quality scans.
GPR images can be divided into three types: A scan, a one-dimensional plot represents
amplitude vs. time; B scan, a two-dimensional image created from a gathering of A-scans.
The horizontal axis represents the position of the scan, while the vertical axis represents
the two-way travel time; and C scan, a three-dimensional presentation of GPR data formed
from a collection of B-scans. C-scans provide a block view for GPR data and are helpful
for providing a good image for specific targets. For bridge decks, GPR data is usually
analysed based on interpretation of many B-scans (Bostanudin, 2013).
Maser and Rawson (1993) scanned 72 bridge decks after removal of the asphalt overlay
using a 1 GHz air coupled GPR acquisition unit, and reported that a correlation of 0.83 was
found between the predicted deterioration and the known conditions, with a standard error

148
of ±4.1% of the total deck area. Barnes and Trottier (2000) conducted a GPR survey on 24
asphalt covered bridge decks using a 1 GHz air coupled horn antenna and verified the
obtained results using half-cell potential testing that was conducted after the asphalt
pavement was removed from each deck. They reported that significant agreement was
found between the two methods where the average difference between their results was 2.2
%. They also found that the decks which had less than 10% or more than 50% deterioration
lacked contrast in between the regions which were perceived as deteriorated or sound,
making it difficult to obtain accurate results with GPR. Cardimona et al. (2000)
investigated 11 bridge decks using a 1.5 GHz ground coupled antenna and presented the
results in terms of contour plots. Their results indicated that GPR has a good correlation
with several ground truth methods and can accurately estimate the total deteriorated area
of bridge decks. Gucunski and Nazarian (2010) evaluated 9 bridge decks with various NDT
technologies, including GPR and half-cell potentials, and found very good correlation in
zones of the highest deterioration. However, several other authors (e.g. Hong et al., (2012);
Lai et al., (2013); and Dinh et al., (2014)) evaluated the condition of RC bridge decks using
GPR technology and achieved reasonable results.
5.2.3 Interpretation of GPR Scan Data
The ASTM D6087-08 (Standard Test Method for Evaluating Concrete Bridge Decks Using
GPR) has evolved from a recommended practice for assessing asphalt-overlaid decks to a
specification referenced regardless of the type of deck surface being evaluated. It describes
the standard procedure for conducting GPR testing as well as data processing
methodologies. The most common analysis method, the numerical amplitude method,
depends on the value of the amplitude of the reflected waves from the top layer of
reinforcing bars. The rationale behind this analysis method is based on known effects of
moisture, chloride content and rust on the recorded GPR signals. The signal reflections at
the rebar level are dominant and produce clear hyperbolic shapes. The shape is a hyperbola
because the farther the antenna is away from the rebar, the longer it takes for the signal to
travel to and from the rebar. Therefore, if the antenna is located directly over the rebar, it
will have the shortest travel path. Data in regions with high corrosion will result in very
“blurry” hyperbolas. Conversely, the higher the amplitudes of the reflected waves, the

149
better the condition of the bar. Because the reflection amplitude at each rebar depends on
the distance (depth) from concrete surface to the rebar, depth correction through amplitude
reduction should be considered in the analysis process (Barnes et al., 2008).
Considering a GPR scan output as an image rather than an amplitude measuring tool,
several research efforts have aimed to implement image processing methods. These
methods include edge detection, or thresholding an image based on local extrema of
intensity, to preprocess the image and isolate potential hyperbola regions. The presence of
noise and image blurring can affect the edge detection results, while thresholding requires
manually selected parameters that must be tuned to a given dataset. Another approach is
template matching to identify hyperbolic regions based on predefined templates stored in
a library. The type of concrete, rebar depth and noise are some obstacles to obtaining sound
matching of templates with a GPR image.
Visual interpretation is another widely used technique to process GPR data. An
experienced analyst scrolls through GPR data profiles and marks attenuated areas and thus,
the boundaries of damaged zones can be located (Tarussov et al., 2013). Such an approach
is time-consuming and provides qualitative analysis depending on the analyzer’s
experience. For instance, it may be difficult for the analyzers to clearly define the border
between sound and deteriorated regions or to maintain consistent judgement when they
switch between profiles. This subjectivity effect is not desired. In addition, thresholds are
commonly utilized to identify the boundaries of different levels of deterioration severity.
In many instances, these thresholds are defined based on the personal judgment of the
analyst, and thus, the subjective selection of threshold values is another limitation in
interpreting GPR data (Dinh et al., 2014).
Currently, the analysis and evaluation of GPR data for bridge deck condition assessment
is mostly done after data collection. There has been interest by many researchers in
developing automated GPR data acquisition and analysis. Indeed, an automated system can
help improve the efficiency, reliability and repeatability of GPR data interpretation. For
instance, an arc segment finding algorithm was suggested by Krause et al. (2007), which
successfully finds the rebars and classifies them as good (true-positives) and good-minus

150
(false-positives). However, their method requires manual computation of threshold
parameters to reject low quality rebar signatures and does not interpret the condition of
bridges from the rebar detection results. Although, this approach has been successful on
simulated defects in the laboratory, it has not yet been employed in full-scale bridge decks.
5.3 IRT/GPR Model Development
Field testing in a real-world application was conducted on two in-service RC bridge decks
using both IRT and GPR techniques. The bridges are located in Montreal, Canada and
Wisconsin, USA, respectively. The developed IRT/GPR model will be introduced first for
the Montreal bridge, and then will be implemented on the Wisconsin bridge.
5.3.1 Data Collection
The IRT survey was carried out for the Montreal bridge using a vehicle-based system with
mounted thermal camera. The bridge characteristics, the features of the utilized thermal
camera, the vehicle mounted set-up, and the data acquisition procedure have been
presented in detail in Chapter 4. As previously discussed, there are several factors affecting
the accuracy of passive IRT testing that can be classified into three principal categories:
procedural (e.g. thermographer experience), technical (e.g. camera-to-object distance,
depth and thickness of the delaminated areas), and environmental conditions (e.g. solar
loading, ambient temperature and wind speed). However, all these factors were addressed
in the conducted survey and the Matlab image acquisition toolbox was utilized to initialize
acquisition and storage of high resolution thermal data. The same bridge deck was
previously GPR scanned, one month before the IRT survey, by Radex Detection Inc., a
consultant firm specializing in concrete structure scanning, as part of a condition survey
program and the procedure adopted for the GPR scan is discussed below.
As per ASTM D6087-08 (2010), it is required for the GPR scan to form an orthogonal grid
along the entire length of the bridge deck, with less than 0.91 m (3 ft.) spacing. The
direction of scan paths depends on the direction of the primary steel in the deck. For bridge
decks with primary steel in the transverse direction, the scan can be done along the lanes
of travel. Conversely, for bridge decks with primary steel in the longitudinal direction, the
deck would need to be scanned transverse to the travel lanes. A few settings must initially

151
be adjusted on the data acquisition unit, such as applying a gain at particular points, usually
at the location of the rebar, in order to force subtle variations in weaker data to be more
visible, and deciding whether the user wants to collect data according to time or distance.
The pushing cart for a ground-coupled GPR system is commonly equipped with a
calibrated distance wheel, enabling the distance option during the survey of bridge decks.
Thus, it allows data to be mapped out spatially with respect to the actual coordinates of the
deck (Tarussov et al., 2013). This can also help the analyzer identifying which part of the
bridge deck must be repaired or rehabilitated.
The bridge deck was scanned with a ground-coupled radar system using a pushing cart.
After studying the bridge deck plan, a grid of scanning paths with 50 cm spacing and 25
cm offset from the curb was established using water soluble paint dots. For each path, its
two ending points were determined by a survey tape, measuring from curb to curb. Then,
these points were marked. To move the machine in accurate straight lines by an operator,
a survey string was used between the points of each path. The scan was conducted using a
GSSI-SIR3000 GPR data acquisition unit with 1600 MHz antenna frequency. Figure 5-2
illustrates the data acquisition unit and grid pattern used. The GPR unit was calibrated
before scanning the bridge deck to ensure accurate measurements. Data collection was
made longitudinally on the deck and hence, a total of 16 profiles were collected for the
entire bridge deck (8 profiles for each direction) where each profile represented a width of
500 mm. The pass direction was selected so that the antenna crosses over the primary top
layer of reinforcing steel at a 90° angle. The first scan path was done in one direction and
the second in the reverse direction and so on. The profiles conducted in the reverse direction
were reversed during the analysis. Road closure was performed, giving adequate access to
the bridge deck.
Figure 5-2: Illustration of GPR travel paths and the utilized data acquisition unit.

152
Detailed information regarding the equipment used and data settings are summarized in
Table 5-1.
Table 5-1: Features and specifications of the utilized GPR equipment
Characteristic Specification
SIR System SIR - 3000
Antenna Frequency 1600 MHz
Scans / m 100
Samples / Scan
Bits / Sample
Gain (No of Point)
Gain Value
High Pass Filter
Low Pass Filter
256
16
1
- 5 dB
470 MHz
1930 MHz
5.3.2 Data Analysis
The developed automated procedure to analyze the thermal images was presented in
Chapter 4. As previously discussed, the methodology includes image preprocessing to
enhance the captured images by reducing noise and improving the images’ thermal
contrasts, image registration that involves a developed stitching algorithm. All the
customized Matlab codes that were developed to extract and stitch the selected pixels from
each image, to scale-down the mosaic dimension, and to identify the coordinates of each
pixel in the mosaic were written with variables to automate the analysis process. Hence,
the developed procedure was implemented on the captured thermal images and produced
a mosaic thermogram of the entire bridge deck as presented in Chapter 4. However, the
procedure adopted to analyze the GPR data of the same bridge deck is presented below.
The conventional numerical amplitude analysis method is based on the effects of moisture,
chloride ions content and rust on the recorded GPR signals. This method was utilized in
the present research. The scanning profiles were post-processed using the commercial
software RADAN 7 (a GPR data analysis software developed by GSSI) to extract important
information for further analysis. First, each profile was cut down to ensure that it only
includes the bridge deck length. Next, the top reinforcing steel bars were selected (peak of
the parabolic shapes). When the entire bars were selected, the software generated an Excel

153
sheet containing the scan number, amplitude, and two-way travel time for each point (bar).
This step was repeated for the entire bridge deck’s profiles. Figure 5-3 illustrates the
picked top reinforcing bars, represented as red points, in a B-scan GPR profile.
Figure 5-3: Picking top reinforcing bars in a B-scan profile.
Reinforcing steel is not always placed at an exact depth throughout the deck during
construction. It also may not be located at a constant depth due to defects, variable surface
milling depth or due to surface wearing. Thus, the thickness of the concrete cover to the
reinforcing steel may vary across the deck and this can lead to variance in the amplitude of
the reflected waves because the GPR signal attenuates with depth. Accordingly, deeper
rebar has lower amplitudes than rebar located at shallower depths due to the dissipation of
energy as the signal travels through concrete. Therefore, to relate deterioration of concrete
using the attenuation of the signal at the rebar level, the varying depths of rebar must be
accounted for using an analytical approach. Depth correction for GPR data has been a point
of interest for many researchers. For instance, Barnes et al. (2008) normalized the depth of
all reinforcing bars based on the relation between the amplitudes of the reflected waves

154
and the corresponding two-way travel time. They proposed to plot the recorded amplitude
versus two-way travel time values to determine a best-fit linear trend and then remove it
from the plot by altering the amplitude, thereby assigning all reflections to a constant depth.
Consequently, after the processing of all profiles and generating of Excel sheets were
completed, the saved data were imported to a commercial software where a quantile linear
regression fitting was performed at 90th percentile, and then subtracted from the depth-
dependent amplitude in order to perform a depth correction for the reinforcing bars. After
normalization was completed, variations in reflection amplitudes were expected to
correspond to the deterioration only. The final output was an Excel file containing the
coordinates and amplitude of the selected reinforcing bars.
5.3.3 Deterioration Condition Maps
5.3.3.1 Thresholding Classification
Thresholding classification was adopted in the proposed methodology to identify objective
thresholds for both IRT and GPR data. As previously discussed, classification is the task
of organizing data into categories. The k-means clustering function in Matlab that was
introduced in Chapter 4 was implemented in the developed model to perform this task. The
number of clusters is the user defined parameter to perform k-means clustering for a data
set. A developed framework was presented in Chapter 4 to determine the number of clusters
for IRT data. However, the AASHTO guide manual for bridge element inspection
implements four categories (good, fair, poor, and severe) to represent the condition of each
bridge element, all of which have been introduced into the AASHTOWare™ bridge
management software BrM, which is currently the primary bridge management software
used by transportation agencies across the USA. Similarly, in the Ontario Bridge
Management System (OBMS), defects are recorded in four condition categories (excellent,
good, fair, and poor) for each bridge component and performance deficiencies for each
component where a bridge element will remain in each condition category a period of time
during its service life. The severity degrees of a defect in the material condition rating index
for the Quebec Ministry of Transportation are defined as light, medium, severe, and very
severe. Consequently, the number of clusters herein was considered four to represent the
severity levels of potential deterioration identified by the IRT and GPR testing.

155
5.3.3.2 Delamination Condition Map
The k-means clustering algorithm in Matlab was first applied to identify the thresholds of
the IRT data. For the bridge deck being considered and based on the identified thresholds,
the temperature values in each severity level were grouped and uploaded into a commercial
mapping software to construct a high contrast composite condition map accurately
delineating the different severity levels of subsurface delaminations, as illustrated in Fig.
5-4. The area of very severe delamination was very small and, hence, has been combined
with the areas of severe delaminations for visualization. This will also ensure an identical
degree of attention with respect to the preservation or maintenance actions to be taken for
these areas.
Figure 5-4: IRT condition map of Montreal’s bridge deck indicating different
severity levels of delaminations.
5.3.3.3 Corroded Corrosion Map
Similarly, for the GPR data and upon completion of the numerical amplitude analysis and
the depth correction process, the k-means clustering algorithm in Matlab was applied to
identify the thresholds. Based on the identified thresholds, the amplitude values in each
severity level were grouped and uploaded in a commercial mapping software to construct
a high contrast composite condition map accurately delineating the different severity levels
of potential active corrosion, as illustrated in Fig. 5-5.

156
Figure 5-5: GPR condition map of Montreal’s bridge deck indicating different
severity levels of potential active corrosion.
The GPR profiles were also analyzed by Radex Detection Inc., the firm who collected the
data based on the line scan (B-scan) visual image analysis technique. The experienced
analyst scrolls through each GPR profile and marks the attenuated areas manually while
considering some factors, such as the presence of beams or tightly spaced steel
reinforcement. The boundaries of damaged zones are located in each profile and then
combined by the firm’s proprietary software to create a condition map delineating the
different severity levels of potential active corrosion, as illustrated in Fig. 5-6.
Figure 5-6: GPR corrosion map of Montreal’s bridge deck as per the record of
MOT, Quebec (Omar et al., 2018).

157
5.3.3.4 Combined Condition Map
To obtain a precise evaluation of the bridge deck condition, the results of the deployed
NDT techniques were combined. The Excel sheets, resulting from the analysis of the IRT
and GPR data, are two matrices 𝐴 (𝑎 𝑥 𝑏) and 𝐵 (𝑐 𝑥 𝑑), respectively where matrix (A)
represents the temperature values, and matrix (B) represents the reflected amplitude values
after applying the depth correction. The integration process consists of two steps. First, the
largest matrix (A) was scaled-down to have a size similar to that of the smallest matrix (B)
as per Equation 5-3, and then both matrices were combined as per Equation 5-4 using a
consistency factor, which accounts for the difference in their data range. A Matlab code
was written for this purpose where the code can accommodate any other survey data, and
thus, automate the combination process. The integrated data was uploaded into a
commercial mapping software to produce a final condition map of the entire bridge deck,
as illustrated in Fig. 5-7.
𝑆𝑘𝑙 = ∑ ∑ 𝐴𝑖𝑗
𝐽𝑗=1
𝐼𝑖=1
[𝐼 × 𝐽] 𝐄𝐪. 𝟓 − 𝟑
Where:
𝑆𝑘𝑙 𝑎𝑟𝑒 𝑡ℎ𝑒 𝑒𝑙𝑒𝑚𝑒𝑛𝑡𝑠 𝑜𝑓 𝑡ℎ𝑒 𝑠𝑐𝑎𝑙𝑒𝑑 − 𝑑𝑜𝑤𝑛 𝑚𝑎𝑡𝑟𝑖𝑥 𝑆 = (𝑐 × 𝑑)
𝑘 = 1 → 𝑐 𝑙 = 1 → 𝑑
𝐴𝑖𝑗 𝑎𝑟𝑒 𝑡ℎ𝑒 𝑒𝑙𝑒𝑚𝑒𝑛𝑡𝑠 𝑜𝑓 𝑚𝑎𝑡𝑟𝑖𝑥 𝐴 𝑖 = 1 → 𝑎 𝑗 = 1 → 𝑏 [𝐴 > 𝐵]
[𝐼 × 𝐽] 𝑖𝑠 𝑡ℎ𝑒 𝑤𝑖𝑛𝑑𝑜𝑤 𝑖𝑛 𝑚𝑎𝑡𝑟𝑖𝑥 𝐴 𝑡𝑜 𝑏𝑒 𝑎𝑣𝑒𝑟𝑎𝑔𝑒𝑑 𝐼 = 𝑎 𝑐⁄ 𝐽 = 𝑏 𝑑⁄
𝐷𝑘𝑙 = 𝐶𝑘𝑙 + (𝛼
𝛽) × 𝐵𝑘𝑙 𝐄𝐪. 𝟓 − 𝟒
Where:
𝐷𝑘𝑙 𝑎𝑟𝑒 𝑡ℎ𝑒 𝑒𝑙𝑒𝑚𝑒𝑛𝑡𝑠 𝑜𝑓 𝑡ℎ𝑒 𝑐𝑜𝑚𝑏𝑖𝑛𝑒𝑑 𝑚𝑎𝑡𝑟𝑖𝑥 𝐷 = (𝑐 × 𝑑)

158
(𝛼
𝛽) 𝑖𝑠 𝑎 𝑐𝑜𝑛𝑠𝑖𝑠𝑡𝑒𝑛𝑐𝑦 𝑓𝑎𝑐𝑡𝑜𝑟
𝛼 = 𝑎𝑣𝑒𝑟𝑎𝑔𝑒 𝑜𝑓 𝑚𝑎𝑡𝑟𝑖𝑥 𝐴𝑖𝑗 = ∑𝐴𝑖𝑗(𝑎 × 𝑏)
𝛽 = 𝑎𝑣𝑒𝑟𝑎𝑔𝑒 𝑜𝑓 𝑚𝑎𝑡𝑟𝑖𝑥 𝐵𝑘𝑙 =∑𝐵𝑘𝑙(𝑐 × 𝑑)
Figure 5-7: Integrated condition map of Montreal’s bridge deck based on the IRT
and GPR results.
5.4 IRT/GPR Model Implementation on a Second Case Study
The integration procedure outlined above was also implemented on the Wisconsin bridge.
The IRT survey and GPR scanning were conducted on July 02, 2015 by Infrasense, a
consultant firm specializing in concrete structure scanning, as part of a condition survey
program. The IRT survey was carried out using a vehicle-based system with mounted
thermal camera. The bridge characteristics, the features of the utilized thermal camera, the
vehicle mounted set-up, the environmental conditions during the survey, and the data
acquisition procedure have been presented in details for the case study of bridge C in
Chapter 4. The GPR scan was carried out at driving speed using a GSSI vehicle-based
system. Hence, no road closure was required and traffic flow was not disrupted. The GPR
data was collected longitudinally on the deck with 0.91 m (3 ft.) spacing between the GPR
profiles and hence, a total of 14 profiles were collected for the entire bridge deck (7 profiles
for each traffic direction). The data was collected with a combination of a 1-GHz horn and
a 1600-MHz ground-coupled antenna.

159
The developed automated procedure to analyze the thermal images was adopted as follows:
(i) the images were enhanced and the temperature data was saved as .csv files for all
images; (ii) a selected window of 320 x 25 pixels, which represents 0.305 m (1 ft.) image
spacing, was extracted from each image and stitched with the extracted window from the
next image. The dimension of the final stitched file was 1280 x 7750 = 9.92 million pixels
for the entire two lane deck and two shoulders; (iii) the data dimension was scaled-down
resulting in a reduced file with 128 x 945 = 120,960 pixels; (iv) the co-ordinates of each
pixel were identified and then arranged in a column order with (x, y, temperature) values
of each pixel; (v) the k-means clustering algorithm in Matlab was applied to identify the
thresholds; and (vi) the condition map was plotted delineating the different severity levels
of the subsurface delaminations, as illustrated in Fig. 5-8.
Figure 5-8: IRT condition map of Wisconsin’s bridge deck indicating different
severity levels of delaminations.
The GPR data was analyzed based on the conventional numerical amplitude analysis
method and the applied clustering technique. The scanned profiles were post-processed
using the commercial radar software RADAN (a GPR data analysis software developed by
GSSI), where the top reinforcing steel bars were selected and an Excel sheet containing the
scan number, amplitude, and two-way travel time for each bar was generated. This step
was repeated for the entire bridge deck’s profiles. Depth correction for the reinforcing bars
was then applied using a commercial software. The final output was an Excel file
containing the coordinates and amplitude of the selected reinforcing bars. The k-means

160
clustering algorithm was applied to identify the thresholds. Accordingly, the condition map
was plotted delineating the different severity levels of potential active corrosion, as
illustrated in Fig. 5-9. The corrosion map as per the records of the Wisconsin DOT is
illustrated in Fig. 5-10. This map was produced by the Infrasense proprietary software
(dimensions in feet).
Figure 5-9: GPR condition map of Wisconsin’s bridge deck indicating different
severity levels of potential active corrosion.
Figure 5-10: GPR corrosion map of Wisconsin’s bridge deck as per the record of
Wisconsin DOT (Omar et al., 2018).
The integration process was then carried out using the written Matlab code. The
temperature matrix was first scaled-down to have a size similar to the amplitude matrix,
then both matrices were combined. The k-means clustering algorithm was subsequently
applied to identify the thresholds. The final condition map of the bridge deck was plotted
delineating the integration of the detected delaminations and potential active corrosion
areas in different severity levels, as illustrated in Fig. 5-11.

161
Figure 5-11: Integrated condition map of Wisconsin’s bridge deck based on the IRT
and GPR results.
5.5 Evaluation of the Proposed IRT/GPR Model
The presented integration analysis of IRT and GPR data aims to rationalize their use as
reliable NDT tools for bridge deck inspection. IRT can highlight overlay and rebar-level
delamination, while GPR can delineate areas where corrosion could be active as explained
earlier. When testing full-scale bridges, extracting quantitative measures of subsurface
defective areas in different severity levels using both techniques remains a challenge.
Creating a plan view mosaic of the entire bridge deck from the individual IR images
facilitated the application of thresholding classification to identify and categorize
subsurface delaminated areas. The thermal contrast developed from the concrete
subsurface provided numerical values for the color contrasts that were used to process data
more effectively than simply comparing multiple images. This procedure was useful in
detecting and calculating delaminated areas present in the bridge decks.
On the other hand, when conducting GPR testing, the relationship between GPR
measurements and the real condition of decks is still not well understood. Although the
amplitude analysis provides an objective and detailed decibel scale, subjective selection of
threshold values remains a limitation. The corrosion maps created in this study categorized
the potential corroded areas based on the relative difference between the amplitude values
of the reinforcing bars. Maser et al. (2012) developed a model to find a threshold for
determining whether the concrete is sound or deteriorated by making a correlation between
GPR and half-cell potential. Martino et al. (2014) developed another model, which is also
based on a correlation between GPR and half-cell potential records. Both models determine
one threshold to differentiate only between sound and corroded areas. Dinh et al. (2014)

162
developed a threshold model to classify the corroded areas in RC bridge decks based on a
GPR scan. Their applied methodology in identifying the number of condition categories
was based on visual interpretation of the GPR images, which is rather subjective.
The IRT delamination map achieved from the thermal analysis in Fig. 5-4 was compared
with the corrosion map provided by the GPR analysis in Fig. 5-5 and also with the GPR
map as per the records of the Quebec MOT in Fig. 5-6. The three condition categories,
which distinguish the severity of delaminations and corrosion, are presented in the three
figures as: sound concrete, concrete areas with moderate defects that require close
monitoring, and concrete areas with severe defects that give a warning to consider a repair
action. The sound concrete areas had the lower temperature values and higher amplitude
measures, while the warning concrete areas had the higher temperature values and
amplitude attenuation measures. In spite of the different mechanisms of the IRT and GPR
techniques and their capabilities of detecting different deterioration types, their bridge deck
condition maps established in this case study are comparable. Though the locations and
geometry of the defects do not match exactly, the areas in which potential delaminations
and corrosion were identified have reasonable correlation. In addition, hammer sounding
was conducted on the bridge deck by an MTQ bridge inspector before the IRT survey. The
created IRT delamination map of the bridge deck was compared with the hammer sounding
results. It was found that the two methods provided similar sizes and shapes of deck defects.
The quantified defective areas by the three techniques are discussed below.
Similarly, the IRT delamination map achieved from the thermal analysis of the Wisconsin
bridge in Fig. 5-8 was compared with both the corrosion map provided by the GPR analysis
in Fig. 5-9 and the Wisconsin DOT GPR map in Fig. 5-10. It can be observed that all
corrosion areas identified by the GPR scan were again indicated by the IRT result.
Conversely, not all the identified delaminated areas were indicated by the GPR result. This
indicates that only highly advanced corrosion areas were identified by GPR scanning. For
more verification, the produced IRT delamination map was compared with the hammer
sounding results as per the record of Wisconsin DOT and generally followed similar trend.
However, the threshold classification technique adopted in the present research, not only
resolves the subjectivity problem in selecting threshold values, but also facilitates the

163
calculation of area percentage for each condition category. Calculating the total
delaminated and corroded areas in different categories from these thermal and corrosion
maps provides a quantitative basis for powerful decision making. Thus, prioritizing
alternatives in bridge deck rehabilitation plans is facilitated. The percentage of the
delaminated and corroded areas in both bridge deck cases were computed and presented in
Table 5-2. The total percentage of delaminated areas resulting from hammer sounding tests
were also indicated.
Table 5-2: Percentage of defective areas in the analyzed bridge decks
Bridge
Deck NDT Survey Type Survey Result
Concrete Condition
Sound Monitoring Warning
Montreal's
Bridge
IRT
Present Research
58% 17% 25%
GPR 64% 15% 21%
Combined (IRT & GPR) 53% 19% 28%
Hammer Sounding MTQ Record
38% Total Delaminated Areas
GPR 37% Total Corroded Areas
Wisconsin's
Bridge
IRT
Present Research
72% 12% 16%
GPR 76% 10% 14%
Combined (IRT & GPR) 68% 14% 18%
Hammer Sounding DOT Record
25% Total Delaminated Areas
GPR 23% Total Corroded Areas
For the Montreal bridge, the analysis of the IRT data indicated 42% total delaminated areas
in the bridge deck, while the hammer sounding results showed 38% total delaminated areas.
Hence, the difference between the findings of the two methods is in the range of about
10%. The GPR analysis showed 36% total areas of potential active corrosion, whereas this
percentage as per the records of MOT Quebec, is 37%. For the Wisconsin bridge, the
analysis of the IRT data indicated 28% total delaminated areas in the bridge deck, whereas
the total delaminated areas identified by hammer sounding as per the records of Wisconsin
DOT, were 25%. The GPR analysis showed 24% total areas of potential active corrosion,
while as per the DOT Wisconsin records, the corroded areas represent 23%. Thus, the
analysis procedure developed herein can precisely define the extent of delamination and
the potential locations of active corrosion in concrete bridge decks.

164
Combining the results of various inspection techniques could provide more reliable
evaluation and prevent overestimating or underestimating a bridge deck condition. Thus,
relevant research efforts have recently attempted to integrate multiple NDT technologies
to assess the overall bridge structural capacity as well as automate the data collection and
analysis processes (Gucunski et al., 2013). Adopting this approach during a real field
deployment is vital to achieving an efficient bridge condition. Figures 5-7 and 5-11
demonstrate the importance of the integration concept. For instance, the integrated IRT and
GPR results indicated that 53% of the Montreal bridge deck area was sound, while the IRT
and GPR separate evaluations were 58% and 64% of the deck’s area, respectively, as
presented in Table 3. Thus, evaluating the bridge deck condition based solely on IRT or
GPR could overestimate the sound area by about 11% and 23%, respectively. Similarly,
for the Wisconsin bridge deck, the integrated IRT and GPR results indicated that 68% of
the deck’s area was sound, while the IRT and GPR separately evaluated the sound deck’s
area as 72% and 76%, respectively. These results could significantly affect any
maintenance actions to be taken and should draw attention to the importance of integrating
IRT and GPR results.
However, it is important to highlight that the reliability of the integrated IRT and GPR
results depends on the accuracy of data collection and analysis. Indeed, each technique has
its own strengths and limitations. For example, IRT has several advantages over other NDT
techniques, such as being able to scan a large area in a non-contact manner. It is much
faster than conventional methods and has a potential to be applied at near highway speed
over a bridge deck, thus mitigating traffic disruption. In addition, the IRT testing can be
conducted during both day and night time. Conversely, IRT is dependent upon
environmental conditions and can become ineffective if such conditions are unfavorable to
produce a thermal gradient in the concrete. For instance, clouds reduce the intensity of
incident solar radiation during the day and reflect infrared radiation at night, thus slowing
heat transfer at the concrete surface. Rain could lead to concrete surface cooling, thus
masking thermal effects from the surface. For decks with a concrete overlay, IRT can
clearly reveal the overlay de-bonding, but may have limitations in detecting deeper rebar-
level delamination. In addition, factors such as moisture, oil spills, surface texture and
staining on the concrete surface can create high noise level in the thermal images.
165
Similarly, GPR scan of RC bridge decks can cover large areas in a short time and easily
penetrate through asphalt layers. Despite its valuable advantages, GPR has limitations,
such as its incapability to provide information on corrosion rates or mechanical properties
of the tested concrete. GPR cannot directly detect thin or in contact cracks and
delaminations. Extreme cold weather can negatively influence GPR results because frozen
water is relatively transparent to electromagnetic waves in the frequency range typically
used for bridge scans. In addition, de-icing agents can limit the ability for GPR signal to
penetrate the deck, and electromagnetic waves from mobile phones can cause noise in GPR
results. Therefore, combining the two technologies in inspecting deteriorated bridge decks
is very powerful, allowing to maximize the capabilities of each method and compensate
for mutual limitations.
5.6 Conclusions
An accurate condition assessment of the extent and severity of bridge deck deterioration is
essential for transportation agencies in prioritizing preventive maintenance and
rehabilitation to preserve and extend the deck life and reduce its life cycle costs. IRT and
GPR represent two NDT technologies that can provide reliable, rapid and cost-effective
bridge deck evaluation. Hence, they were employed in the present research on two full-
scale bridge decks. Both methods require post-processing analysis of the acquired data to
reveal subsurface anomalies. A simple analysis procedure of IRT and GPR data was
developed herein to detect and classify the severity of subsurface defects in RC bridge
decks and integrate IRT and GPR data. The findings are presented in terms of condition
maps delineating the different severity levels of subsurface delaminations and potential
active corrosion. The boundaries between the condition categories were determined based
on the threshold clustering technique applied on the recorded concrete surface temperature,
the reflected amplitudes of reinforcing rebar, and the integrated data, thus providing
objective thresholds and accurate classification. Accordingly, the percentages of
delaminated and potential corroded areas in the bridge decks were quantified in the
different categories.
As a surface temperature method, the detection capability of delamination using IRT
testing is depth limited. While it is very effective for non-overlaid decks, the IRT

166
effectiveness can decrease in the presence of overlays. Also, IRT data requires adequate
solar radiation and weather conditions to produce the required temperature differentials.
The sensitivity of GPR to the presence of chlorides and concrete corrosion makes the
technology an ideal tool to identify the potential of corroded areas in RC bridge decks.
However, GPR is not as strong at precisely locating delaminated areas. In addition to rebar
depth variation, there are several other factors that can jeopardize the efficiency of
analyzing GPR reflection amplitudes, including variation of rebar spacing, surface
properties, structural variation and construction quality. Currently, rebar depth variation is
the only factor that has been taken into account. GPR surveys require dry pavement
conditions, but are not temperature or weather dependent.
While both IRT and GPR testing have strengths and limitations, the findings of this study
demonstrate that combing the results of the two technologies is effective in evaluating the
condition of deteriorated RC bridge decks. Accordingly, integrating the defective areas
identified by both methods could provide important information for maintenance decision
makers. The methodology proposed herein provides rapid and reliable analysis and hence,
could enable the monitoring of deterioration progression through periodical surveys, thus,
enabling the effective, rapid and economical surveying of hundreds of bridges.
5.7 References
Alani, A., Aboutalebi, M., and Kilic, G. (2013). "Applications of ground penetrating radar
(GPR) in bridge deck monitoring and assessment." Application Geophysics, Vol.
97, 45-54.
Barnes, C., Trottier, J., and Forgeron, D. (2008). “Improved Concrete Bridge Deck
Evaluation Using GPR by Accounting for Signal Depth-Amplitude Effects.” NDT
& E International, Vol. 41 (6), 427-433.
Barnes, C. and Trottier, J. (2000). "Ground-Penetrating Radar for Network-Level Concrete
Deck Repair Management." Transportation Engineering, Vol. 126 (3), 257-262.
Belli, K., Wadia, S., and Rappaport, C. (2011). "Integrated Sensor and Media Modeling
Environment Developed and Applied to Ground-Penetrating Radar Investigation of
Bridge Decks." Computing in Civil Engineering, Vol. 25 (1), 10-20.
Bostanudin, N. (2013). "Computational methods for processing ground penetrating radar
data". PhD Thesis. University of Portsmouth, England, 288 p.
Dinh, K., Zayed, T., Moufti, S., Shami, A., Jabri, A., Abouhamad, M., and Dawood, T.
(2014). "Clustering-based Threshold Model for Condition Assessment of Concrete

167
Bridge Decks using Ground Penetrating Radar." Proc., 93rd Annual Meeting, TRB,
Washington, DC, Vol. No. 2522, 1-11.
Gucunski, N., Imani, A., Romero, F., Nazarian, S., Yuan, D., Wiggenhauser, H., Shokouhi,
P., Taffe, A., and Kutrubes, D. (2013). “Non-destructive testing to identify concrete
bridge deck deterioration.” Proc., 92nd Annual Meeting, TRB, Washington, DC,
SHRP 2 Report, 96 p.
Gucunski, N., and Nazarian, S. (2010). “Material Characterization and Condition
Assessment of Reinforced Concrete Bridge Decks by Complementary NDE
Technologies.” Proc., Structure Congress, ASCE, Orlando, Fl., USA, 429-439.
Halabe, U., Sotoodehnia, A., Maser, K. and Kausel, E. (1993). "Modeling the
Electromagnetic Properties of Concrete." ACI Materials Journal, Vol. 90, 552-63.
Hong, S., Lai, W. and Helmerich, R. (2012). “Monitoring Accelerated Corrosion in
Chloride Contaminated Concrete with Ground Penetrating Radar.” Proc. IEEE 14th
International Conference on Ground Penetrating Radar, Shanghai, China, 1-9.
Krause, V., Abdel-Qader, I., Abudayyeh, O., and Yehia, S. (2007). “An image
segmentation algorithm for the detection of rebar in bridge decks from GPR scans,”
Proc. IEEE International Conference in Electro/Information Technology, Chicago,
IL, USA, 114-119.
Lai, W., Kind, T., Stoppel, M., and Wiggenhauser, H. (2013). “Measurement of
Accelerated Steel Corrosion in Concrete Using Ground-Penetrating Radar and a
Modified Half- Cell Potential Method.” Infrastructure Systems, Vol. 19, 205-220.
Maser, K., Martino, N., Doughty, J. and Birken, R. (2012). “Understanding and Detecting
Bridge Deck Deterioration Using Ground Penetrating Radar.” Transportation
Research Record No. 2313, TRB, 116-123.
Maser, K. (2009). "Integration of Ground Penetrating Radar and Infrared Thermography
for Bridge Deck Condition Testing." Materials Evaluation, Vol. 66, 1130-1136.
Maser, K., and Rawson, A. (1993). “Network Bridge Deck Surveys Using High Speed
Radar: Case Studies of 44 Decks,” Transportation Research Board No. 1347, TRB,
1018-1025.
Maser, K., and Roddis, W. (1990). "Principles of Thermography and Radar for Bridge
Deck Assessment." Transportation Engineering, Vol. 116 (5), 583-601.
Martino, N., Birken, R., Maser, K., and Wang, M. (2014). “Developing a deterioration
threshold model for assessment of concrete bridge decks using ground penetrating
radar.” Proc., 93rd Annual Meeting, TRB, No. (14-3861), 1-10.
Omar, T., Nehdi, M., and Zayed, T. (2018). “Infrared Thermography Model for Rational
Condition Assessment of Concrete Bridge Decks.” J. of Construction and Building
Materials. Vol. 168, pp: 313-327. DOI: 10.1016/j.conbuildmat.2018.02.126.
Tarussov, A., Vandry, M. and De La Haza, A (2013). “Condition assessment of concrete
structures using a new analysis method: GPR computer-assisted visual
interpretation.” Construction and Building Materials, Vol. 38, 1246-1254.

168
Chapter 6
6. Integrated Condition Rating Model for Reinforced Concrete
Bridge Decks Using NDT and Visual Inspection
6.1 Introduction
Developing reliable evaluation and condition rating methodologies is paramount for
efficient BMSs. For instance, combining various inspection techniques could prevent
underestimating or overestimating a bridge deck condition. However, most commonly used
bridge condition rating systems utilize data emanating from visual inspection reports
inevitably associated with considerable uncertainty. This could possibly lead to
unnecessary repair actions or overlooking critical problems. Although the advent of NDT
technologies has significantly aided more precise assessment of bridge decks, such
techniques have not received due attention in the bridge rating process. Thus, relevant
research efforts have recently attempted to integrate multiple NDT technologies to assess
the overall bridge structural capacity as well as automate the data collection and analysis
processes (Gucunski et al., 2015). Adopting this approach during a real field deployment
is vital to achieving an efficient health indicator of bridge condition.
A review of current bridge condition rating systems reveals several drawbacks. For
instance, they do not account for subjective information in the assessment process. Indeed,
a considerable amount of uncertainty in the current bridge assessment practice stems from
ignorance, lack of data, or inability to precisely assess bridge elements with subsurface
deterioration. There exists little or no direct incorporation of structural defects’ measurements
in the overall bridge condition rating process. Common rating practices do not account for the
structural role and relative importance of different bridge components and deterioration
mechanisms towards the overall evaluation (Wang and Elhag, 2008). In addition, they employ
solid linguistic grades that do not take into consideration gradual transition from one
condition category to another. Therefore, a superior rational condition rating procedure is
needed to capture the results of commonly employed NDT techniques, along with the
relative importance of bridge deck different defects. Uncertainty in the evaluation process
could be remediated via a set of elaborated fuzzy linguistic variables.

169
In this Chapter, a systematic integrated condition rating procedure for concrete bridge
decks using fuzzy mathematics is developed. To achieve this goal, the following objectives
are pursued throughout the chapter sections: (1) study the current bridge condition rating
practices, (2) identify and quantify the extent of severity for delaminated and potential
corroded areas in RC bridge decks based on IR thermal imaging and GPR scanning, and
(3) develop an integrated condition rating model using the fuzzy approach to consider the
uncertainty in the IRT, GPR, and visual inspection measurements. Figure 6-1 illustrates
the adopted systematic methodology to achieve the above-mentioned objectives, which
consists of four phases. The goal of the first phase is to identify and quantify the severity
degrees of defects. This is achieved by conducting in-situ inspection on full-scale
deteriorated RC bridge decks using IRT, GPR, and visual inspection. Visual inspection will
evaluate the extent and severity of surface defects, while IRT and GPR data will be
analyzed to identify the extent and severity of potential subsurface defects. The goal of the
second phase is to pursue bridge experts’ judgement to provide: (i) degree of relative
importance for defects, and (ii) numerical values to identify the boundaries of bridge deck
condition categories. This will be acquired through interviews with experts having
comprehensive bridge experience.
The goal of the third phase is to convert the identified and quantified defects into bridge
deck condition categories. This is achieved by employing the fuzzy synthetic evaluation
(FSE) approach to: (i) construct defect linear triangular fuzzy membership functions, (ii)
calculate the relative importance weights of defects using the fuzzy preference programme
(FPP), (iii) translate the fuzzy defects to fuzzy condition categories, and (iv) integrate the
condition categories belonging to each defect type into overall condition categories of the
bridge deck. The goal of the last phase is to develop a bridge deck condition index (BDCI)
as follows: (i) construct fuzzy membership functions for the condition categories using
linear regression analysis; (ii) utilize the area percentage in each condition category to
aggregate their membership functions using a fuzzy union operation; and (ii) utilize a
defuzzification method to obtain a final crisp value. Then, the developed rating procedure
and its application will be demonstrated through a case study on a full-scale reinforced
concrete bridge deck. A brief description of the current practices of bridge condition rating,
as well as their main drawbacks, will be presented first.

170
Figure 6-1: Methodology of model development adopted in this study.
6.2 Existing Bridge Condition Rating Systems
Bridge condition data are generally categorized into condition ratings and condition
categories. Condition ratings are codes describing the in-place versus the as-built bridge.
Condition categories describe the condition of bridge elements (Nasrollahi and Washer,
2014). The national bridge inventory (NBI) rating system requires condition ratings for
three major bridge structural components: (i) deck; (ii) superstructure; and (iii) substructure
using a 0 to 9 point scale (9 being excellent condition and 0 implies absolute failure). The
FHWA (1995) classifies deficient bridges into two categories: structurally deficient and
functionally obsolete. One of the conditions to consider a bridge as structurally deficient is
having at least one of its components with a condition rating value of 4 or less. The scale
of this condition rating system indicates the urgency of an impending loss of structural
integrity, but does not consider a detailed inspection of bridge elements, and thus provides
little information about the type and location of possible failure. Hence, it is insufficient to
formulate repair strategies, or to estimate costs (Bektas et al., 2013).

171
The bridge sufficiency rating (BSR) system evaluates bridge data by calculating four rating
factors. It starts with a value of 100, then deductions are made for bridge deficiencies down
to a potential lowest value of 0. The four rating components are comprised of structural
adequacy and safety (S1) which has a value of 55%, serviceability and functional
obsolescence (S2) accounting for a value of 30%, essentiality for public use (S3) that
receives a value of 15%, and finally special reductions (S4) with a value of 13% (FHWA,
1995). Bridge rehabilitation is determined when BSR ≤ 80, whereas eligibility for
replacement is indicated by BSR< 50 and structural deficiency or functional obsolescence.
The main problem associated with the BSR system is that it is based on NBI condition
ratings. To overcome some of the drawbacks of the NBI condition rating, the commonly
recognized (CoRe) element condition rating system was developed. It consists of more than
one hundred standardized element-level conditions. The ratings of all the elements can be
integrated through a weighted aggregation process to compute the overall bridge health
index (BHI) that represents the health of the entire bridge structure (Thompson and
Shepard, 2000). The BHI ranges from 0 to 100, where 100 indicates the best state, whereas
0 indicates failure condition. BHI is calculated as the ratio of the sum of the current element
value to the sum of the total element value. It can be calculated for an element, a single
bridge, or a group of bridges. Although the BHI has been considered by the bridge
community as an excellent performance measure, it does not take into consideration
inherent uncertainties during the inspection process and its calculation method makes it a
deterministic process.
However, to improve the CoRe system of bridge elements, a detailed bridge element
inspection system called the AASHTO Guide Manual for Bridge Element Inspection
(MBEI) was developed in 2011. The manual was built on the concept of element-level
condition rating and further improvement was implemented in 2013 to include National
Bridge Elements (NBEs), Bridge Management Elements (BMEs), and Agency-Developed
Elements (ADEs). All elements are assigned a standard number representing one of four
condition states: good, fair, poor, and severe. NBEs represent the primary structural
components of bridges (decks and slabs, superstructure, substructure, railings, bearings,
and culverts) necessary to determine the overall condition and safety of the primary load
carrying members. BMEs include components of bridges such as joints, wearing surfaces,

172
protective coating systems and deck/slab protection systems that are typically managed by
agencies utilizing BMS. ADEs provide the ability to define custom sub-elements in
accordance with the NBEs or BMEs. The new elements contained within the MBEI have
been introduced into AASHTOWare™ Bridge Management software BrM, formerly
known as Pontis, which is currently the primary bridge management software used by
transportation agencies across the USA (Reardon and Chase, 2016).
6.2.1 Bridge Condition Rating Systems in Canada
Each Canadian provincial bridge inspection manual has its own condition rating system.
For example, in the Ontario Bridge Management System (OBMS), defects are recorded in
each of 4 condition states (excellent, good, fair, and poor) for each bridge component and
performance deficiencies for each component (OSIM, 2008). The British Columbia bridge
condition index (BCI) is a weighted average of the condition state distribution for various
elements where the element replacement cost is used as the weighting factor. BCI is
calculated for various strategies as well as for each budget scenario so that bridge network
performance can be compared for different funding levels (Reed et al., 2008). Similarly in
Quebec, element, bridge, and network levels are considered where the material condition
of a bridge element is assessed based on the severity and extent of the detected defects
according to a 4-level grading system (A, B, C, and D). Similar to the condition rating
systems developed in the USA, the Canadian bridge condition rating systems do not
account for fuzzy information in the evaluation process.
6.2.2 Bridge Condition Assessment Using IRT and GPR
IRT and GPR are widely accepted to augment visual inspection data from bridge decks.
Consequently, several researchers proposed objective bridge condition assessment systems
utilizing these technologies (e.g. Yehia et al., 2007; Maser, 2009; Gucunski et al., 2013;
Matsumoto and Mitaini 2013; Dinh et al., 2015). For instance, Maser (2009) employed
both IRT and GPR and proposed a two-level bridge deck condition assessment system.
Matsumoto and Mitaini (2013) utilized IRT to determine the AASHTO element level
condition state for bridge decks, railings and beams, where distressed areas were presented
into three classification categories. Dinh et al. (2015) utilized GPR to evaluate the

173
condition of RC bridge decks and proposed a condition rating index based on GPR results.
Their proposed rating index only considers corrosion defects and does not consider
uncertainty in GPR measurements.
6.3 Fuzzy Bridge Deck Condition Rating Model Development
In this section, a novel fuzzy condition rating model is proposed based on the integration
of NDT and visual inspection results to identify an overall condition index for existing RC
bridge decks (BDCI). The rational behind using a fuzzy approach is that: “Assessment of
a bridge deck’s defects using visual inspection involves subjectivity and uncertainty.
Although assessing bridge decks using NDT techniques provides objective defect
measurements with less ambiguity, many factors can also influence the accuracy of the
results for the applied technique, such as the experience of the operator and data analyzer.
Thus, uncertainty in the severity and extent of measured defects has utmost importance in
both visual inspection and NDT”. Therefore, a valid approach to consider uncertainty and
integrate both techniques is to establish a uniform fuzzy defect and condition category
scheme to achieve the proposed BDCI as elaborated below.
6.3.1 Fuzzy Synthetic Evaluation (FSE)
The Fuzzy Synthetic Evaluation (FSE) approach is capable of dealing with uncertainties in
data sampling and can synthesize the evaluation of defects. The FSE was utilized in this
study for fuzzifying and translating each detected defect to an order of descending
condition categories and then integrating the condition categories of all defects to obtain
overall fuzzy condition categories for a bridge deck. The integration process requires
relative importance weights of the various defects based on their effect on the health of a
bridge deck. The Fuzzy Preference Programing (FPP) was adopted for this task based on a
fuzzy prioritization approach. The applied procedure is described in the following steps.
6.3.1.1 Construction of Defect Fuzzy Membership Functions
Inaccurate evaluation of the extent and severity degree of a defect will influence the final
rating and thus, the measured defects should be treated. Fuzzification of the measured
defects requires the construction of defect membership functions. Therefore, each

174
measured defect was assumed to be associated with an underlying fuzzy set F, defined by
four fuzzy linguistic condition categories ranging over the defect extent. The four condition
categories were represented as excellent (E), good (G), fair (F), and poor (P), similar to the
Ontario bridge condition states, where a RC bridge deck will remain in each condition
category a period of time during its service life. Thus, the fuzzy set can be recognized as F
= [E, G, F, P]. The 2012 MTQ (Ministry of Transportation of Quebec) material condition
rating index for bridge primary elements (Fig. 6-2) implements the extent values for each
of the four condition categories based on the severity degree of a defect. Consequently,
linear triangular fuzzy membership functions have been constructed for each severity
degree (light, medium, severe, and very severe) based on the defect extent (% of deck area
affected by the related severity degree). Figure 6-3 illustrates the constructed membership
functions that assisted in handling the fuzzy overlapping nature of the four linguistic
condition categories. Reasonable interval values of the specified boundaries of the affected
area were considered to determine zones related to each condition category. A membership
function of a severity degree represents the extent of a measured defect over the interval
[0, 1], indicating its degree of belonging to each of the four condition categories.
Figure 6-2: Condition category’s map utilized for the construction of defects’
membership functions (Omar et al., 2017).

175
Figure 6-3: Triangular fuzzy membership functions for various severity of bridge
deck’s defects.
6.3.1.2 Determination of Defect Relative Importance Weights
Figure 6-4 illustrates a simple hierarchy of the common defects occurring in RC bridge
decks. Relative importance weights representing the effect of these defects on the health of
RC bridge decks were determined, relying on experts’ judgment through semi-structured
interviews. A total of 17 expert interviews were undertaken with engineers from different
Canadian ministries of transportation having extensive bridge experience and knowledge.
The experts were asked to provide the degree of relative importance among the considered
defects based on the 9-point Saaty’s linguistic scale of absolute values, developed by Saaty
(1980), representing the strength of judgements. Comparing surface defects was done at
first; the experts were asked to provide the degree of importance of surface scaling if
compared with spalling, pop-outs, and cracking on the health of RC bridge decks. Then the
experts were asked to provide the degree of importance with regards to the health of a RC

176
bridge deck of delamination defects if compared with corrosion, and surface defects. The
degree of relative importance gathered from the experts was utilized to construct pairwise
comparison matrices.
Figure 6-4: Common bridge deck defects and related investigation techniques
utilized in this study.
Due to uncertainties associated with experts’ judgments, the linear triangular fuzzy scale,
presented in Chapter 3 (Table 3-4), was applied to all the constructed pairwise comparison
matrices. The difference between most probable (actual response received) with the upper
and lower values is equal to one. Thus, for a (n x n) comparison matrix, there are (n + 1)
variables representing n weights (𝑥1, 𝑥2, … … 𝑥𝑛) and a consistency index (λ
= 𝑥(𝑛+1)). Table 6-1 illustrates a fuzzified pairwise comparison sample of one respondent
for the relative importance of the considered surface defects on the health of a bridge deck.
Each cell in the matrix has three values obtained from the fuzzification process. The matrix
has 5 variables in linear equality constraint (4 local weights and a consistency index). The
FPP method presented in Chapter 3 was employed to acquire the consistency values and
calculate weights from the triangular fuzzy pairwise comparison matrices using the Matlab
fuzzy optimization algorithm “fmincon”, generally referred to as constrained nonlinear
optimization function. It is a medium-scale algorithm that attempts to find a constrained
minimum of a scalar function of several variables. Table 6-2 summarizes the achieved
average weights of the various defects considered in this study.

177
Table 6-1: Example for a fuzzy pairwise comparison matrix of a participated expert
Pairwise Comparison of Common Surface Defects in Concrete Bridge Decks
Defect Type Scaling Cracking Spalling Pop-out
Scaling 1,1,1 3/10,3/7,3/4 1/8,1/7,1/6 5/12,5/7,5/2
Cracking 4/3,7/3,10/3 1,1,1 1/4,1/3,1/2 2/3,5/3,8/3
Spalling 6,7,8 2,3,4 1,1,1 4,5,6
Pop-out 2/5,7/5,12/5 3/8,3/5,3/2 1/6,1/5,1/4 1,1,1
Table 6-2: Final weights of bridge deck defects investigated in this study
Relative Weights of Common Defects in Concrete Bridge Decks
Main Defect Weight Sub-Defect Sub-Weight
Sub-surface Delamination
(IRT) 0.382 N/A N/A
Surface Defects
(Visual Inspection) 0.354
Scaling 0.185
Cracking 0.237
Spalling 0.363
Pop-out 0.215
Sub-surface Rebar
Corrosion (GPR) 0.264 N/A N/A
6.3.1.3 Translation of Fuzzy Defects into Condition Categories
Each fuzzy measured defect using both NDT and visual inspection (e.g. delamination,
scaling, cracking, spalling, pop-out, and corrosion) was translated into the bridge deck’s
four condition categories. Consequently, the percentage of extent of each defect was
converted to a percentage of the defect in the four condition categories. Equation 6-1
represents the implemented translation formula.
𝐶𝑖 = [𝑃𝑖𝑙 𝑃𝑖𝑚 𝑃𝑖𝑠 𝑃𝑖𝑣𝑠] ∙
[ 𝜆𝐸(𝑃𝑖𝑙) 𝜆𝐺(𝑃𝑖𝑙) 𝜆𝐹(𝑃𝑖𝑙) 𝜆𝑃(𝑃𝑖𝑙)⋮ ⋮ ⋮ ⋮⋮ ⋮ ⋮ ⋮⋮ ⋮ ⋮ ⋮⋮ ⋮ ⋮ ⋮
𝜆𝐸(𝑃𝑛𝑣𝑠) 𝜆𝐺(𝑃𝑛𝑣𝑠) 𝜆𝐹(𝑃𝑛𝑣𝑠) 𝜆𝑃(𝑃𝑛𝑣𝑠)]
𝐄𝐪. 𝟔 − 𝟏
Where:

178
𝐶𝑖: % of defect i in each condition category [E, G, F, P]
i ∈ (1, 2,..... , n) n = number of defects.
𝑃𝑖: % of defect i in the four severity degrees (Light, Medium, Severe, Very Severe).
𝜆𝐹(𝑃𝑖𝑙): Membership function for the light severity of defect i to the condition category (e.g.
Fair).
6.3.1.4 Integration of Condition Categories Belonging to Different
Defects
To obtain overall condition categories for a bridge deck, the condition categories translated
from various defects were integrated using the identified relative importance weight of
each defect. Initially, the condition categories of surface defects (e.g. scaling, cracking,
spalling, and pop-out) were aggregated and then integrated with the condition categories
of the delamination and corrosion defects, identified by IRT and GPR testing. Equation 6-
2 represents the implemented integration formula.
𝐷𝑐 = [𝑤1 𝑤2 … 𝑤𝑖 … 𝑤𝑛] ∙
[ 𝐶𝐸(1) 𝐶𝐺(1) 𝐶𝐹(1) 𝐶𝑃(1)⋮ ⋮ ⋮ ⋮⋮ ⋮ ⋮ ⋮
𝐶𝐸(𝑖) 𝐶𝐺(𝑖) 𝐶𝐹(𝑖) 𝐶𝑃(𝑖)⋮ ⋮ ⋮ ⋮⋮ ⋮ ⋮ ⋮
𝐶𝐸(𝑛) 𝐶𝐺(𝑛) 𝐶𝐹(𝑛) 𝐶𝑃(𝑛)]
𝐄𝐪. 𝟔 − 𝟐
Where:
𝐷𝑐: % of overall bridge deck area in each condition category.
i ∈ (1, 2,..... , n) n = number of defects.
𝑤𝑖: weight of defect i.
𝐶𝐸(𝑖): % of defect i in the condition category (e.g. Excellent).

179
6.3.2 Weighted Fuzzy Union (WFU) Operation
The proposed condition rating model utilizes a numerical scale from 0 to 100 to represent
the overall bridge deck condition index (BDCI); 0 being failure condition and 100 being
excellent condition. The scale is divided into the four condition categories previously
mentioned: excellent (E), good (G), fair (F), and poor (P). The application of the FSE
process explained above resulted in area percentages of various condition categories of a
bridge deck that need to be converted into a numerical BDCI value. Therefore, during
interviews with the bridge experts, the principle of the proposed condition rating model
was introduced and the experts were asked to identify the values regarding the boundaries
of each condition category in the BDCI scale in order to provide specific percentages for
k₁, k₂, and k₃ illustrated in Fig. 6-5.
Figure 6-5: Conception of the proposed bridge deck condition index (BDCI).
Due to the uncertainty associated with experts’ judgments, fuzzy modelling was necessary
to represent these boundaries and solve the aggregation process. The weighted Fuzzy
Union (WFU) operation is a basic operation for aggregating fuzzy sets. It provides an
"optimistic" aggregate by assuming credibility in opinions expressed in the two fuzzy sets
to be aggregated. WFU was utilized to aggregate the membership functions of the condition
categories, which was then defuzzified to determine the BDCI. The fuzzification,
aggregation and defuzzification processes are described below.
6.3.2.1 Construction of Condition Categories Fuzzy Membership
Functions
The fuzzification process requires the construction of a fuzzy membership function for the
zone of each of the four condition categories. As previously discussed, several techniques
for generating membership functions have been proposed in the literature based on the

180
nature of the related application. The values of k₁, k₂ and k₃ proposed by the bridge experts
are presented in Table 6-3 and were utilized to construct the membership functions of the
four condition categories. Primarily, it was necessary to verify the consistency of the
experts’ opinions. Figure 6-6 illustrates a histogram and assumed normal distribution
fitting, which confirms that no individual expert provided inconsistent judgment.
Table 6-3: Experts’ replies for boundaries identification of the condition categories
Response No. 𝒌𝟏 𝒌𝟐 𝒌𝟑
1 85 70 50
2 75 60 35
3 80 65 50
4 85 65 50
5 80 60 45
6 75 55 35
7 85 60 45
8 80 65 40
9 85 70 45
10 90 60 40
11 85 65 35
12 90 70 50
13 85 55 35
14 85 65 35
15 80 60 40
16 75 55 35
17 85 65 45
Figure 6-6: Histogram and normal distribution curve of k₁, k₂, and k₃.

181
Subsequently, the membership functions were assumed to be piecewise linear. Linear
regression analysis was conducted and the boundaries of each condition category were
determined as illustrated in Fig. 6-7. The final constructed membership functions of the
four condition categories are shown in Fig. 6-8 where the area percentage in each condition
category would be utilized to aggregate these functions towards a numerical BDCI value.
Figure 6-7: Boundaries of condition categories membership functions using linear
regression method.
Figure 6-8: Condition categories membership functions based on k₁, k₂, and k₃.

182
6.3.2.2 Weighted Aggregation of Fuzzy Condition Categories
The WFU method is an appropriate operation when the importance coefficients are
considered as fuzzy modifiers. The fuzzy modifier is a fuzzy logic operator which may be
used to change the characteristic function by spreading out the transition between full
membership and nonmembership, by sharpening the transition, or by moving the position
of the transition region. Equation 6-3 represents the mathematical formula of the WFU
operation.
Ᾱ = ∪ [∑𝐹𝑖 𝑋𝑖
𝑖=𝑛
𝑖=1
] 𝐄𝐪. 𝟔 − 𝟑
Where:
Ᾱ = output fuzzy set
U = fuzzy union operator
𝐹𝑖 = nonfuzzy weighting factors
𝑋𝑖 = fuzzy set # i i ∈ (1, 2,....., n) n = number of fuzzy sets
To demonstrate how the WFU works, assume a bridge deck has area percentages of the
four condition categories as: [E (26.7%), G (42.5%), F (21.3%), P (9.5%)], then the
aggregated fuzzy membership functions of the four condition categories was represented
by a thick line as illustrated in Fig. 6-8.
6.3.2.3 Bisector Defuzzification to Identify Bridge Deck Condition Index
(BDCI)
The output obtained from the WFU operation is a fuzzy set that needs to be defuzzified to
have a crisp value representing the BDCI. There are several defuzzification methods
supported in the Matlab fuzzy logic toolbox such as the middle, smallest, and largest of
maximum value assumed by the aggregate membership function, the bisector and centroid

183
defuzzification methods. The most commonly used methods are the centroid and bisector
defuzzification methods. The centroid defuzzification returns the center of area under the
shape, while bisector is the vertical line that divides the possibility distribution of the output
fuzzy set into two sub-regions of equal area. The bisector defuzzification method was
utilized in this study where the intersection of the bisector line with the condition rating
scale axis is the numerical output represents the BDCI value as illustrated in Fig. 6-8 for
the above example.
6.4 Bridge Deck Condition Rating Model Implementation
6.4.1 Data Collection and Analysis
As explained in the research methodology, field deployment is required to build the
proposed model. The field deployment includes IRT testing, GPR scanning, and visual
inspection to identify both surface and subsurface defects, gain a broader insight into the
overall bridge deck condition and assign a reliable rating value. Guidelines for visual
inspection of existing bridges have been developed in many countries and the use of bridge
inspection reporting software has been explored by several asset management software
developers and adopted for element-level inspection. Thus, surface defects can be extracted
from the inspection reports where the extent and severity degrees are registered.
In this section, the proposed condition rating model was implemented as a proof of concept
on an in-service RC bridge deck located in Montreal, Canada. Visual inspection was carried
out by an experienced bridge inspector from the Ministry of Transportation, Quebec and
the surface defects were quantified and recorded along with their severity degrees. Field
testing was conducted using IRT and GPR. The IRT data collection and analysis were
presented in Chapter 4, while the GPR data collection on the same bridge deck and its
analysis were presented in Chapter 5. The IRT and GPR analyses located the delamination
and the potential of rebar corrosion sub-surface defects as previously presented in Fig 5-4
and Fig. 5-5, respectively. These quantified subsurface defects were then integrated with
the surface defects to identify the BDCI. Table 6-4 summarizes the area percentages of the
different detected defects in each severity degree (light, medium, severe, very severe)
resulting from visual inspection, IRT survey, and GPR scan.

184
Table 6-4: Summary of severity and extent of defects in the inspected Montreal’s
bridge deck
Defect Inspection
Technique Severity and Extent
Delamination IRT Light 108m² (30%), Medium 61.2m² (17%), Severe 90m² (25%)
Scaling
Visual
Inspection
Light 158m² (44%), Medium 108m² (30%), Severe 36m² (10%)
Cracking Light 158m² (44%), Medium 90m² (25%), Severe 54m² (15%)
Spalling Light 115m² (32%), Medium 30.6m² (8.5%), Severe 25m² (7%)
Pop-out Light 144m² (40%), Medium 28.8m² (8%), Severe 21.6 m² (6%)
Corrosion GPR Light 144m² (40%), Medium 54m² (15%), Severe 75.6m² (21%)
6.4.2 Developing BDCI of Bridge Deck
The BDCI of the surveyed bridge deck was identified as follows: (i) each defect type in the
four severity degrees was fuzzified using the constructed defects’ fuzzy membership
functions in Fig. 6-3; (ii) the extent of each fuzzy defect was then translated to an area
percentage in the four condition categories (excellent, good, fair, poor) using Eq. 6-1; (iii)
the area percentages in the four condition categories resulting from the surface defects were
combined using Eq. 6-2 to represent the overall deck condition based solely on the visual
inspection technique; (iv) the area percentages in the four condition categories resulting
from both IRT and GPR testing, respectively, were integrated with the area percentages in
the four condition categories resulting from the visual inspection using Eq. 6-2 to have an
overall integrated area percentage of the bridge deck in the four condition categories.
Figure 6-9 illustrates the condition of the surveyed bridge deck in the four categories as
indicated by the IRT, GPR, and visual inspection, as well as the overall integrated condition
of the deck; (v) the area percentages in the four condition categories were utilized to
aggregate the constructed fuzzy membership functions using WFU operation. For
comparison purposes, the thick colored lines in Fig. 6-10 represent the aggregated fuzzy
membership functions of the deck condition as determined by the IRT, GPR, and visual
inspection techniques, along with the overall integrated condition of the deck; (vi) bisector
defuzzification was applied and the BDCI was determined for each inspection technique
as well as for the overall integrated condition of the deck as illustrated in Fig. 6-10.

185
Figure 6-9: Aggregated condition categories of Montreal’s bridge deck based on
defects measured using different techniques.
Figure 6-10: Condition rating index of Montreal’s bridge deck based on the
proposed model in this study.

186
6.5 Evaluation of the Proposed BDCI Model
Integrating the deficiency areas identified by visual inspection and NDT technologies
would yield both surface and subsurface indicators of condition for a variety of bridge
decks in the network and thus, provides meaningful information for maintenance decision
makers. As previously discussed, the differences between the IRT and GPR area
percentages in the different condition categories shown in Fig. 4-9 could be due to the fact
that not all delaminations can be observed in GPR images and only highly advanced
corrosion areas were identified by the GPR scanning. In addition, corrosion is among the
primary reasons that could lead to delaminations in RC bridge decks. It should be noted
that the delaminated and corroded area percentages identified by analyzing the IRT and
GPR survey data have been validated by other NDT techniques and chloride ion
concentration analyses in some cores taken from the deck as presented in Chapter 5.
However, the main concern of this study is to apply a management aspect by utilizing the
NDT results in the proposed condition rating procedure.
Figure 6-9 demonstrates the importance of the integration concept in having a reliable
condition rating of a bridge deck. For instance, the visual inspection does not consider any
area of the deck in a poor condition and indicated that only 8.3% of the deck’s area is in a
fair condition, while the IRT and GPR considered that 31% and 23.3% of the deck’s area,
respectively, are in fair and poor conditions. In addition, the deck’s area in good condition
was evaluated as 47.3% by visual inspection, while the IRT and GPR evaluations were
40.2% and 37.1%, respectively. Similarly, visual inspection indicated that 44.4% of the
deck’s area is in excellent condition, while the IRT and GPR evaluated the deck’s area in
the same condition category as 28.8% and 39.6%, respectively. Consequently, visual
inspection indicated a BDCI value of 80.05, while the IRT and GPR indicated values of
66.76 and 69.35, respectively as shown in Fig. 6-10. The condition rating index based on
the IRT and GPR results was about 16.6% and 13.4%, respectively, lower than the
condition rating index indicated by visual inspection results. The overall integrated area
percentages in the four condition categories from the three inspection technologies
identified a final BDCI value of 72.05 for the surveyed deck, about 10% less than the value
if the deck were evaluated based solely on visual inspection.

187
These results could significantly affect maintenance actions to be taken and should draw
attention to the importance of integrating the results of different technologies. With respect
to how the proposed index can be used by maintenance decision makers, this study does
not enforce strict actions. In fact, the conducted interviews with bridge experts indicated
various opinions regarding the action needed for a bridge deck with a specific BDCI. For
instance, some experts proposed repair or partial deck replacement, while others proposed
full replacement of a deck with the same BDCI value. Thus, each transportation agency
can apply its maintenance strategy in rating the achieved BDCI and select the appropriate
action. However, based on discussions with the bridge experts and the maintenance
strategies of the Ontario Bridge Condition Index (OBCI) and other preservation guides in
the literature, ratings and recommended actions for the proposed BDCI in this study were
summarized in Table 6-5. The proposed actions aim at having reliable and safe bridge
conditions. It should be noted that the maintenance actions in the majority of existing BMSs
are based on optimization models to determine the most cost-effective maintenance
strategies.
Table 6-5: Recommended actions for the proposed BDCI in this study
BDCI
Range
Deck
Rating Recommended Action
80 - 100 Excellent Maintenance is not required within the next five years.
70 - 80 Good Frequent monitoring and repair defects within the next five to ten
years.
60 - 70 Fair Major repairs should take place within the next five years. NDT
using IRT and GPR should be conducted after five years.
50 - 60 Poor Immediate maintenance is required. Total deck replacement to
take place within the next five to ten years.
Less than 50 Very Poor Immediate rehabilitation is required. Total deck replacement to
take place within the next five years but if the BDCI < 30,
immediate closure to traffic.
Considering the relative importance of defects on the health of a bridge deck, applying
NDT techniques and addressing the fuzzyness of the detected defects were paramount in
developing the proposed procedure, which can be used for evaluating an individual or a

188
network of bridge decks. It should be noted that the main idea here is to propose a
methodology rather than apply the exact numbers achieved in this study. The model data
can be retrieved from in-depth bridge inspection reports, where visual inspection could be
supplemented by NDT methods. Indeed, employing several NDT techniques will reduce
the uncertainty inherent in the defect measurements and provide more reliable condition
rating indices. For instance, it would be objective to detect possible defects using the results
of multi-model NDT, such as the recently developed “RABIT” system. RABIT (Robotics
Assisted Bridge Inspection Tool) is a fully autonomous robotic system for the condition
assessment of concrete bridge decks using multiple NDT technologies (Gucunski et al.,
2015). However, because not all transportation agencies employ NDT evaluation due to
the associated costs, the model proposed herein integrates visual inspection, being the
commonly used inspection method, with only two NDT techniques.
The selection of IRT and GPR in this study was based on their ability to rapidly survey
large with minimum traffic disruption, lane closures, and exposure of personnel to traffic,
thus saving significant time and labor costs. However, the proposed procedure provides a
platform for continuous updates on a bridge deck’s condition as more related data become
available. The model could also be amended by increasing the hierarchy layers through
involving more defects, other deck elements, such as the drainage system and wearing
surface or other bridge components, such as the superstructure and substructure.
Consequently, the proposed rating procedure if flexible and can accommodate future
upgrading.
6.6 Conclusions
An attempt has been made in the present research to develop a novel condition rating
methodology for existing RC bridge decks by integrating the results of NDT and visual
inspection. Fuzzy set theory has been utilized to account for uncertainties and imprecision
in the measurements of common subsurface and surface bridge deck defects detected by
NDT such as IRT and GPR along with bridge inspector observations recorded through
visual inspection. Using fuzzy membership-based defect measurement in combination with
the importance relative weighting approach, the proposed procedure translated uncertain
measurements of surface and subsurface defects into fuzzy bridge condition categories.

189
The Fuzzy Preference Programme (FPP) based nonlinear method was adopted to calculate
the relative defects’ weights using the Matlab software. Considering the uncertainty
inherent in determining the zone of each condition category, a fuzzy condition category
scheme was built where the weighted fuzzy union (WFU) technique was employed to
aggregate the fuzzy membership functions of the condition categories towards a bridge
deck condition index (BDCI). A case study was provided to illustrate the process of
implementing the proposed approach. The advantages of the developed system include the
utilization of various inspection technologies, employment of the knowledge provided by
bridge engineers with extensive experience and intuition, and conducting the analysis in a
fuzzy domain. The proposed model could be upgraded to include other bridge elements
and components, consider more possible defects, and employ other NDT techniques. Thus,
it would be an effective tool for transportation agencies to prioritize repair and
rehabilitation efforts and focus limited funding on most deserving bridge decks.
6.7 References
ASTM Standard D4788-03 (2013). “Standard Test Method for Detecting Delaminations in
Bridge Decks Using Infrared Thermography.” ASTM International, West
Conshohocken, PA.
ASTM D6087-08 (2010). “Standard Test Method for Evaluating Asphalt-Covered
Concrete Bridge Decks Using Ground Penetrating Radar,” ASTM International,
West Conshohocken, PA.
Bektas, B., Carriquiry, A., and Smadi, O. (2013). “Using Classification Trees for Predicting
National Bridge Inventory Condition Ratings.” Infrastructure Systems, Vol. 19 (4),
425-433.
Dinh, K., and Zayed, T. (2015). “GPR-Based Fuzzy Model for Bridge Deck Corrosiveness
Index.” Performance of Constructed Facilities, Vol. 30 (4), 1-14.
FHWA (1995). “Recording and Coding Guide for the Structure Inventory and Appraisal
of the Nation’s Bridges.” FHWA-PD-96-001, Federal Highway Administration,
U.S Department of Transportation.
Gucunski, N., Kee, S., La, H., Basily, B., Maher, A., and Ghasemi, H. (2015).
“Implementation of a Fully Autonomous Platform for Assessment of Concrete
Bridge Decks RABIT.” Proc., Structure Congress, ASCE, Portland, Oregon, 367-
378.
Gucunski, N., Imani, A., Romero, F., Nazarian, S., Yuan, D., Wiggenhauser, H., Shokouhi,
P., Taffe, A., and Kutrubes, D. (2013). “Non-destructive testing to identify concrete
bridge deck deterioration.” Proc., 92nd Annual Meeting, TRB, Washington, DC,
SHRP 2 Report, 96 p.

190
Maser, K. (2009). "Integration of Ground Penetrating Radar and Infrared Thermography
for Bridge Deck Condition Testing." Materials Evaluation. Vol. 66 (11), 1130-
1136.
Matsumoto, M., Mitani, K. and Catbas, F. (2013): Bridge Assessment Methods Using
Image Processing and Infrared Thermography Technology.” Proc., 92nd Annual
Meeting, TRB, Washington, DC, 1-9.
Nasrollahi, M., and Washer, G. (2014). “Estimating Inspection Intervals for Bridges Based
on Statistical Analysis of National Bridge Inventory Data.” Bridge Engineering,
Vol. 11, 1-11.
Ontario Structure Inspection Manual-OSIM, (2008), Ontario Ministry of Transportation,
the Queen's Printer for Ontario, 394 p.
Omar, T., Nehdi, M., and Zayed, T. “Integrated Condition Rating Model for Reinforced
Concrete Bridge Decks.” J. of Performance of Constructed Facilities. DOI:
10.1061/(ASCE)CF.1943-5509.0001084. Reardon, M. F., and Chase, S. (2016). “Migration of Element-Level Inspection Data for
Bridge Management System.” Proc., 95th Annual Meeting, TRB, Washington, DC,
1-15.
Reed, M., Thompson, M., and Gagnon, R. (2008). “Design and Implementation of a New
Bridge Management System for the Québec Ministry of Transport.” Proc., 10th
International Conference on Bridge and Structure Management, Buffalo, New
York, 77-86.
Saaty. (1980). "The analytic hierarchy process: Planning, Priority Setting and Resource
Allocation." Book, Publisher: McGraw-Hill, New York, 237 p.
Thompson, P., and Shepard, R. (2000). “AASHTO commonly recognized bridge elements,
successful applications and lessons learned.” Prepared for the national Workshop
on Commonly Recognized Measures for Maintenance. Paul D. Thompson
Consultant, 1-13.
Wang, Y. and Elhag, T., (2008). “Evidential reasoning approach for bridge condition
assessment.” Expert Systems with Applications, Vol. 34 (1), 689–699.
Yehia. S., Abudayyeh, O., Nabulsi, S., and Abdel-Qader, I. (2007). “Detection of Common
Defects in Concrete Bridge Decks Using NDE Techniques.” Bridge Engineering,
Vol. 12, 215-225.

191
Chapter 7
7. Remote Sensing of Reinforced Concrete Bridge Decks Using
Unmanned Aerial Vehicle Infrared Thermography
7.1 Introduction
There is a need to develop cost-effective and innovative solutions to evaluate bridge deck
conditions on regular time intervals, without interrupting traffic. This makes remote
sensing technologies viable options in the field of bridge inspection. As previously
discussed, IRT as a remote sensing technology does not require direct access to the surface
under inspection since the images can be captured from distance using appropriate optical
lenses. However, conducting ground IRT testing in-situ on full-scale bridge decks requires
mounting the IR camera on a vehicle. The ideal option for data collection is to scan one
traffic lane on each pass. Obtaining such horizontal field of view is not always achievable
in the field as it may require to mount the camera at a high level. Thus a number of survey
passes should be adopted to cover the entire bridge deck area. In addition, the requirements
of ASTM D4788-03 (2013), ground IRT testing in-situ on full-scale RC bridges should be
conducted at low driving speeds of no greater than 20 km/h. Thus, the arrangements of
traffic control is necessary to conduct IRT survey on the field.
The generic definition of remote sensing technologies allows for a variety of deployment
platforms including satellites, aerial inspection using fixed wing aircrafts, or vehicle
mounted systems, making remote sensing potentially valuable in the field of inspection and
monitoring (Harris et al., 2016). The main limitation to perform a manned aircraft scanning
is to maintain a fixed distance from the structure, which can be mitigated using an
unmanned aerial vehicle (UAV) equipped with a GPS system (Chen et al., 2011). In recent
years, UAV technology has increasingly been used in various application areas such as
monitoring construction and operation of buildings and other types of engineering systems.
The improvements in navigation and sensor technology have made UAVs more reliable in
terms of flight control. In addition, the advanced telecommunication technologies permit
their flying at different altitudes over considerable distances (Chen et al., 2011). Operating
UAVs at lower altitudes than piloted aircrafts, result in a higher spatial resolution.

192
Compared with satellite remote sensing and aerial photogrammetry, UAV has several
merits, which makes it a reliable and cost-effective technology for data acquisition.
Therefore, remote sensing UAV equipped with high definition photo and video cameras
can facilitate the inspection tasks of bridge infrastructure. The limitations of applying
ground IRT could motivate the pursuit of this technology for bridge inspection. A UAV-
borne imaging system with a high resolution digital and thermal cameras can be deployed
frequently to provide rapid condition assessment and enable monitoring of deterioration
progression through periodical surveys and thus, allow the surveys of hundreds of RC
bridge decks to become feasible. Consequently, considerable reductions in costs associated
with the inspection processes of bridge decks and in the frequency and duration of traffic
interruptions can be achieved. However, the ability to extract quantitative information of
subsurface anomalies from images captured by a UAV-IRT system is still needed to fully
realize its potential in detecting these defects.
In this Chapter, the potential application of a UAV-borne thermal imaging system for the
condition assessment of full-scale RC bridge decks is investigated and the reliability of the
achieved results is evaluated. To achieve this goal, the following objectives are pursued
throughout the chapter sections: (1) studying the working principles of aerial UAV remote
sensing technology; and (2) utilizing a UAV thermal imaging system for the detection of
subsurface delaminations in RC bridge decks. Figure 7-1 illustrates the adopted systematic
methodology to achieve the above-mentioned objectives. It can be summarized as follows:
(1) conducting UAV-borne thermal imaging in-situ on two deteriorated full-scale RC
bridge decks; (2) collecting thermal images via low altitude flights using a high resolution
thermal camera; (3) producing a mosaicked thermogram for the entire bridge decks from
the IRT data using especially developed Matlab codes; (3) segmenting the mosaic to
determine objective thresholds using the k-means clustering algorithm in the Matlab
software; (4) creating a condition map delineating different categories of the delamination
severity using a commercial mapping software; and (5) validating the detected delaminated
areas using the results provided by other testing technologies on the same bridge decks. A
brief description of the UAV remote sensing technology and its current practices of bridge
condition inspection as well as its main drawbacks will be presented first.
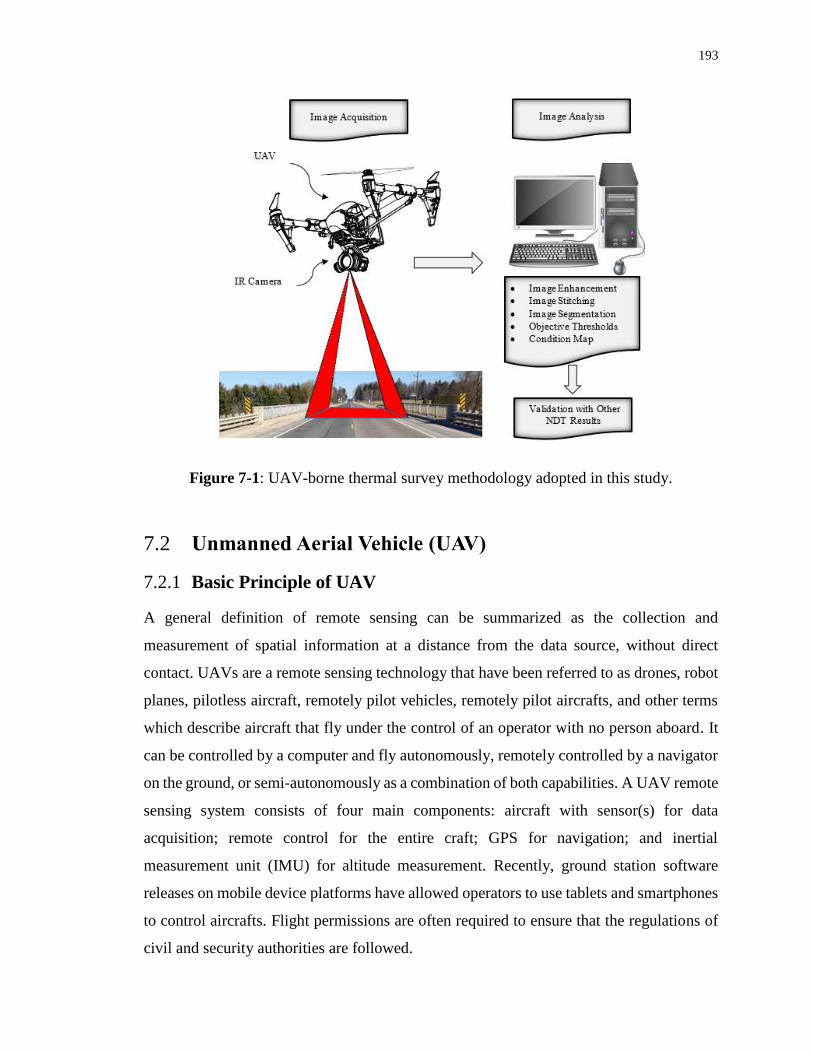
193
Figure 7-1: UAV-borne thermal survey methodology adopted in this study.
7.2 Unmanned Aerial Vehicle (UAV)
7.2.1 Basic Principle of UAV
A general definition of remote sensing can be summarized as the collection and
measurement of spatial information at a distance from the data source, without direct
contact. UAVs are a remote sensing technology that have been referred to as drones, robot
planes, pilotless aircraft, remotely pilot vehicles, remotely pilot aircrafts, and other terms
which describe aircraft that fly under the control of an operator with no person aboard. It
can be controlled by a computer and fly autonomously, remotely controlled by a navigator
on the ground, or semi-autonomously as a combination of both capabilities. A UAV remote
sensing system consists of four main components: aircraft with sensor(s) for data
acquisition; remote control for the entire craft; GPS for navigation; and inertial
measurement unit (IMU) for altitude measurement. Recently, ground station software
releases on mobile device platforms have allowed operators to use tablets and smartphones
to control aircrafts. Flight permissions are often required to ensure that the regulations of
civil and security authorities are followed.

194
UAVs can be equipped with different high definition cameras to offer several mapping
applications in the field of photography, geology, geography, meteorology or in agriculture
and forestry (Hallermann and Morgenthal, 2013). The most critical factor in the UAV
imaging applications is the movement of the camera directly caused by the movement of
the flight system, which reacts to changes in wind conditions due to its low weight
(Hallermann and Morgenthal, 2013). All flight parameters (e.g. longitude, latitude, time,
GPS altitude, position etc.) are usually stored in a log-file together with the aircraft status
parameters (e.g. battery status, flight modus and GPS signal quality). Additionally, the
camera parameters (position, image number, altitude relative to launching area etc.) are
also stored in the log-file, and thus are available for processing the individual images
(Vasterling and Meyer, 2013). During the UAV operations, the acquired images are
commonly stored on the SD card of the camera. The flight time of a UAV depends on its
payload and is also strongly influenced by wind conditions (Vasterling and Meyer, 2013).
7.2.2 UAV Applications in Civil Engineering
UAVs have potential applications in a variety of civil engineering tasks owing to its ability
of pre-programmed flight paths and collecting data at low altitudes. In construction
engineering, a large variety of commercial, small and very light UAVs have been recently
developed and used in surveying construction sites, monitoring work-in-progress, and
inspecting existing structures, especially inaccessible areas. These UAVs are able to take
off and land vertically, requiring less area to operate, and can hover over fixed areas.
During flight, operators can view live video from the camera on a monitor. The gathered
data can be geo-referenced so as to offer the possibility of 3D-modelling of structures.
Vaghefi et al. (2012) argued that many aspects of bridge inspection could be aided by UAV
remote sensing, including remote inspection and producing close up and high-resolution
still and video imagery of bridges from multiple viewing angles. The inspection results can
be related to locations on the bridge in relation to a direct visualisation of the detected
damage. Thus, UAVs can greatly change how bridge infrastructures are assessed and how
their maintenance can be prioritized (Ellenberg et al., 2016).
A UAV-borne thermal imaging system utilizes an infrared thermal camera to provide
information of the ground surface temperature, without the need to access the ground.

195
Thermal imaging with a UAV has several advantages compared to satellite and ground-
based measurements. It generates spatial data with good geometric resolution without the
need to interpolate the data which might cause errors. Satellite imaging, in contrast,
requires very high resolution data in order to obtain a high geometric accuracy. Hence, it
could play a major role in bridge condition assessment. Several researchers have
investigated the use of UAV in inspecting bridge decks. For example, Khan et al. (2015)
collected thermal images of a mock up bridge to demonstrate the types of data that can be
collected with a UAV and were able to detect possible delaminations in the concrete bridge
deck. Brooks et al. (2015) investigated several applications of UAV technology, including
bridge inspection. They used the UAV to capture imagery, both digital and thermal, of the
bridge deck and applied some algorithms to detect surface defects on the deck.
7.2.3 Successful Application of UAV-IRT System
Vasterling and Meyer (2013) addressed some critical parameters that should be considered
to successfully apply a UAV-borne thermal imaging to bridge inspection. For instance, the
camera should be sufficiently lightweight due to the limited payload of the UAV. It also
must be robust (e.g. insensitivity towards vibrations and dust). Although thermal cameras
for the (8-14) μm bandwidth generally do not have a cooled sensor, resulting in low signal
to noise ratio, they are relatively lightweight, which is an essential advantage for use in
UAV. It should also be noted that some lightweight infrared cameras do not have an
autofocus. Thus, before mounting the camera onto the UVA the focus has to be adjusted
manually by focusing at an object at the same distance as the planned flight altitude.
Additionally, visual images or video recorded at the same time as the thermal image allow
mapping thermal subsurface anomalies and differentiating the surface defects.
The flight altitude is another parameter that has to be selected via a compromise between
resolution and efficiency. In addition, satisfactory mosaicking a set of thermal images is
not fully resolved to date. Therefore, if the data are not recorded continuously (video), then
the overlap of individual images should be at least 50%. Thus, only the central part of the
images is used, which improves the quality of the composite image. Setting ground control
points for further processing is another consideration. These points should preferably be
visible in both the thermal and visual bandwidths. Therefore, a material with an emissivity

196
as well as visual contrast to the survey area has to be chosen (e.g. aluminum foil). These
marker points have to be positioned in the field accurately. The images can then be stitched
to fit with the markers at the respective coordinates (Gillins et al., 2016).
7.3 UAV/IRT Model Development
To investigate the feasibility of using UAV technology for inspecting bridge decks, two
full-scale in-service RC bridge decks (named herein bridge (A) and bridge (B)), located on
the same highway in north London, Ontario, Canada were surveyed using a UAV-born
thermal imaging system. The bridges were scheduled, by the Ministry of Transportation
Ontario (MTO) for rehabilitation because delaminations were recently identified by a
condition survey. Thus, they were considered as good candidates and selected for the UAV
thermal survey. Both bridges were constructed in 1965. Either bridge is a single span RC
frame passing over a watercourse, supported directly on abutments, and paved with about
100 mm asphalt wearing surface. The bridge structures have a north-south orientation and
their external limits have concrete curbs and steel handrails. The structural drawings of
both bridges indicate a deck slab thickness varying from 900 mm at the abutments to 480
mm at the mid-span of the deck with a parabolic soffit. The span of each bridge is 15.24 m
with a roadway width of 12.18 m carrying one lane of traffic (3.65 m) and a shoulder (2.44
m) in each direction. Both bridges were rehabilitated in 1985 and 2007, including repair of
the spalled and delaminated areas. The bridge decks exhibited the presence of numerous
transverse, longitudinal and diagonal cracks. A west elevation of bridge (A) and a view of
the condition of its deck are displayed in Fig. 7-2.
Figure 7-2: Illustration of the surveyed concrete bridge (A) and an overview of the
deck surface condition.

197
7.3.1 Planning and Preparation Phase
7.3.1.1 Selection of IR Thermal Camera
The testing involves collecting thermal images from the concrete surface using an IRT
camera. As previously discussed, the key parameters in choosing an IR camera include the
spectral range, spatial resolution, temperature range and frame rate. For observing objects
at ambient temperature, a long wave length band (8–14 μm) is preferable to detect small
thermal contrasts and reduce the effects of direct solar radiation during daytime testing.
The spatial resolution of an IRT camera decreases with increasing object-to-camera
distance, while lens systems with a small field of view have higher spatial resolution. An
advanced thermal camera (FLIR Vue Pro) was utilized in this survey with its settings
optimized for airborne operation. The camera is compatible with the flight system and has
an uncooled micro-bolometer detector. It a displays thermal images with a resolution of
640 x 512 pixels. The camera weighs 113 grams, which makes it ideal for UAV
applications. When connected to the flight control system, it automatically considers the
aircraft geo-location. Thus, it facilitates further stitching of the captured still images and
recorded thermal videos. The IRT camera records the surface temperature using automatic
gain control and saves the image data on a micro CD card in JPEG, TIFF or FFF format,
so that it could be further processed using the FLIR software. Each image contains a
maximum of 256 gray shades, each representing a different temperature range in the same
scene. The features and specifications of the thermal camera are summarized in Table 7-1.
Table 7-1: Features and specifications of the utilized camera (FLIR Vue Pro)
Characteristic Specification
Size
Weight
Detector Type
62.7 mm x 44.5 mm
101 g to 122 g
Uncooled Micro-bolometer
Spectral Band 7.5μm – 13.5μm
Thermal Resolution 640 x 512
Full Frame Rate
Field of View
Input Supply Voltage
On-board Storage
Operating Temperature Range
Operational Altitude
Polarity Control
30 Hz
9-mm lens (69⁰ x 56⁰)
4-6 VDC
MicroSD
-20⁰C to 50⁰C
+40,000 feet
Yes

198
7.3.1.2 Selection of UAV
The (Inspire 1 Pro) UAV from DJI was utilized in this study. The features and
specifications of the utilized aircraft are summarized in Table 7-2. The components of the
utilized flight system as well as the thermal camera are illustrated in Fig. 7-3. The aircraft
is equipped with retractable landing gear and its camera has an integrated 3-axis stabilized
gimbal to provide a steady platform and maximize stability and weight efficiency during
flight. The aircraft boasts a maximum flight speed of 18 m/s and a maximum flight time of
20 minutes using a fully charged battery. It uses a global positioning system (GPS) and a
vision positioning system (VPS) to fly as per predefined paths, pinpoint its position and
stabilize each flight. The GPS is capable of correcting for altitude and coordinate positions
to allow systematic image acquisition, as well as aiding in producing 3D models, if
required, from the imagery. The flight remote controller has three flight modes, which
could be automatically selected based on the strength of the GPS signal and the sensors of
the VPS. The GPS has the capability to control the aircraft orientation and to assist in
holding its position, while maintaining the desired altitude. It allows the system to hold
position with ± 2.5 m horizontal and ± 0.5 m vertical accuracy. The remote controller also
has three safe modes to ensure safe return and landing of the aircraft to the last recorded
home point if the control signal is lost or if low battery warning is triggered. The flight
system has a flight recorder which stores data for each flight (e.g. duration, orientation,
speed, etc.).
Table 7-2: Features and specifications of the utilized UAV (Inspire 1 Pro)
Characteristic Specification
Aircraft/Motor Model
Propeller Model
Maximum Take-off Weight
Vertical Hovering Accuracy
Horizontal Hovering Accuracy
Maximum Aircraft Speed
Maximum Altitude
Maximum Flight Time
Maximum Wind Speed Resistance
T600/DJI 3510 H
DJI 1345 T
3500 g
0.5 m
2.5 m
18 m/s
120 m (from take-off point)
18-22 Minutes
10 m/s
Operating Temperature Range
Maximum transmitting Distance
Mobile Device Holder
-10⁰C to +40⁰C
3.5 km
Tablet or Smart Phone

199
Figure 7-3: Illustration of the UAV-borne thermal system utilized to scan two RC
bridge decks.
7.3.1.3 Setting up UAV-borne Thermal System
It is required to have a registered UAV and a certificate describing the operation of a
particular UAV for a particular purpose and in a specific area. In addition, the Canadian
Aviation Regulations (CAR) require training of UAV pilots to comply with safety
requirements and hold a special flight operation certificate (SFOC) for Transport Canada
to ensure UAV reliable and safe operation. Therefore, the UAV-borne thermal imaging in
the present research was conducted by a consultant specializing in aerial photography,
videography and thermography who has completed UAV training, IRT training, pilot
licensing, and acquired special risk aviation insurance and gained a SFOC. The pre-flight
preparation includes the setup of both the drone and thermal camera. The four propellers
were installed and fixed firmly to the drone (a quadcopter). The DJI Go app and FLIR Vue
Pro app were downloaded to link the drone and the camera to the flight controller. The DGI
Go App controls the drone and allows the user to see a live video stream on a supported
mobile device, which further allows the pilot to determine when images can be taken. The
FLIR Vue Pro app allows the setup of the image format, orientation, shutter speed, camera
focus adjustment, shooting mode, and color palette and communication options with the
mobile device. An IPad Mini 4 device was utilized to display the live streaming video of
the flight information on its LED screen. All batteries and iPad were fully charged and the
camera was mounted on the drone and oriented facing straight-down to be perpendicular
to the concrete deck surface being surveyed. Fixing the camera at the bottom of the drone
200
assists flight stability. The operator controlled the drone to maintain altitude and position.
GPS positioning was activated and the compass was recalibrated before every flight.
7.3.2 Data Acquisition Phase
The flights were initiated on May 24th, 2016 at 1 PM, six hours after sunrise. During the
survey, the ambient temperature was 79⁰ F, relative humidity was 22%, and wind speed
was 8 km/hr. Bridge deck dryness was considered during data collection since surface
moisture can reduce the thermal contrast on thermal IR images. Sun direction was also
considered to avoid shadows on images. It is important to note that traffic on the bridge
was not interrupted during data collection. The total flight time was about three minutes
for each bridge deck. The total time taken to complete a bridge deck inspection from setup
to tear-down was approximately 20 minutes. A calibrated 9 mm focal lens (69⁰ x 56⁰) was
utilized. This allowed a large Field-of-View (FOV) of 13.74 m (horizontally) x 10.62 m
(vertically) for each image to be taken at 10 m altitude. Hence, a total of only four thermal
images, at spacing of 5 m, were collected with an overlap of 50% to cover the entire deck
length. Each image covers the entire deck width and shoulders, in addition to 0.78 m side
walk at both sides. It should be noted that the flight altitude could be increased to survey
longer bridge decks utilizing an ultra-wide angle lens which will result in larger FOV.
The utilized drone can hover in place and is capable of vertical take-offs and landings. Its
platform was placed closely to the bridge deck being investigated, while ensuring sufficient
stand-off distance of about 5 m from the outside kerb line. The flight paths were predefined
for the two bridge decks as two straight line passes in opposite directions at the center of
each deck. The drone was stable and controlled by the pilot during tests. The survey was
started by hovering the drone from its platform after recording the home point and then
pointing it to the top of the bridge deck at a maintained altitude of 10 m using the remote
controller. The flight path was displayed in real-time on the LED. The still images were
captured at the center of the bridge deck with several snapshots at each position. The
images were taken perpendicular to the bridge deck to minimize the effects of possible lens
distortion. Since it was not possible to measure the angle while flying, an estimation of the
drone’s perpendicular position to the deck surface was made from the view displayed on
the screen. The drone was landed after each flight and all equipment was turned off.

201
In addition to thermal images, various digital images of the bridge decks were taken as
snapshots from the ground using a high resolution (16.1 megapixel) digital camera. These
images allowed providing preliminary assessment of the surface deck condition.
Consequently, visual interpretation of the captured thermal images could highlight and
separate patches and surface defects from actual subsurface anomalies in order to provide
accurate estimation of the detected subsurface defects.
7.3.3 Data Analysis Phase
As discussed in Chapter 4, data on thermal cameras appears as a color-coded image in
which a color palette is assigned to temperatures at a certain “level” and across a certain
“span” determined by the user. The span of the image is the difference between the
minimum and maximum temperature in the image, and the “level” is the center of the span.
Figure 7-4 shows a snapshot of the UAV and a typical thermal image taken during the
conducted survey. Based on visual interpretation, which is inherently subjective, the
potential of delaminated areas can be identified as displayed in the figure. The image shows
a delamination being much warmer than the surrounding sound concrete after several hours
of exposure to sunlight. However, it should be noted that the transverse, longitudinal and
diagonal lines displayed with a lighter color could be misinterpreted as a delamination area,
whereas the digital images indicate that they are sealed surface cracks. Thus, taking optical
images of the bridge deck is key for IR data collection and analysis.
Figure 7-4: Snapshot of the UAV during the flight to scan bridge (A) and a captured
thermal image indicating potential delaminated areas.

202
7.3.3.1 UAV/IRT Delamination Maps
The captured raw images could be post-processed using a variety of commercial image
processing software, such as Pix4D, ImageJ, and Matlab image processing toolbox. For
example, importing the thermal images onto the Pix4D mapper software can provide highly
precise georeferenced 2D maps and 3D models. This requires to use the Pix4D app to
automatically capture the images in predetermined routes in order to create the model.
However, this option was not available, and hence the captured IR images of each bridge
deck were first enhanced using several functions in the ImageJ software to improve its
quality. The thermal data was then analyzed similar to the developed procedure for ground
IRT presented in Chapter 4 as follows: (i) the scaled temperature data of each image was
first saved as .csv in a separate Excel file; (ii) a selected window was extracted from each
image and stitched with the extracted window from the next image. The dimension of the
final mosaic, for each of the entire two lane decks, was 640 x 780 = 499,200 pixels; (iii)
the data dimension was scaled-down and resulted in a reduced file with 128 x 156 = 19,968
pixels; (iv); the co-ordinates of each pixel were identified and then arranged in a column
order with (x, y, scaled temperature) values of each pixel. The final output was an excel
file containing pixel information (coordinates and scaled temperature) with no change in
thermal contrast values over the entire deck; (v) the k-means clustering algorithm in Matlab
was applied to identify objective thresholds. The number of clusters (k) for both surveyed
bridge decks was considered as four to represent the level of severity of potential
deterioration identified by the UAV-borne thermal testing.
For the bridge decks being considered and based on the identified thresholds, the
temperature values in each severity level were grouped and uploaded in a commercial
mapping software to construct high contrast composite condition maps accurately
delineating the severity levels of potential subsurface delaminations, as illustrated in Figs.
7-5 and 7-6. The area of very severe delamination was very small and hence, has been
combined with the areas of severe delaminations in order to ensure identical degree of
attention with respect to the maintenance actions to be taken for these areas. Sound concrete
areas were represented by a green color, concrete areas that require close monitoring were
represented by a yellow color, and warning concrete areas that require repair were

203
represented by a red color. The sound concrete areas had the lowest scaled temperature
values, while the warning concrete areas had the highest scaled temperature values since
the surveys were conducted during daytime. During the day, a warming trend existed such
that the targets had positive thermal contrasts, which meant that the delaminated regions
were at a temperature higher than that of the sound concrete. As previously discussed, this
is the anticipated behavior based on fundamental heat transfer theories and complies with
previous results reported for instance by Washer et al. (2013).
Figure 7-5: Condition map of bridge (A) indicating the severity of the identified
delaminated areas for the bridge deck and curbs using UAV-borne thermal
imagery system.

204
Figure 7-6: Condition map of bridge (B) indicating the severity of the identified
delaminated areas for the bridge deck and curbs using UAV-borne thermal
imagery system.
7.3.3.2 Quantification of Defects
Calculating total delaminated areas in different categories from the mosaicked thermogram
can provide a quantified basis for powerful decision making. It would hence be useful in
prioritizing alternatives for bridge deck repair. The percentage of bridge deck area in each
condition category was calculated by computing the total pixels in the same category over
the total pixels in the entire deck area. Since k-means clustering neglects the stochastic

205
nature of the threshold values, the calculated area percentage in each condition category
was considered as a variable. Generally, a probability distribution describes the
probabilities associated with all values of a random variable. For example, if the random
variable is a threshold value, then the probabilities associated with all of its values are
described by a probability distribution function rather than a deterministic value. There is
a wide range of possible statistical techniques that can be used to perform this task.
However, to highlight the influence of the identified threshold values on the calculated
delaminated areas, a statistical analysis was conducted considering a consistent ± 5%
change in the threshold values and computing the corresponding area percentage in each
condition category. Then, the two primary parameters (mean and standard deviation) of the
obtained values were calculated. Table 7-3 shows the results of the statistical analysis for
the two surveyed bridge decks. The basic assumption is that the data has a normal
probability or Gaussian distribution. The obtained low standard deviation, which indicates
the average spread around the mean, implies that the percentages of defective areas do not
change significantly with the change in the identified thresholds. Consequently, the mean
values were considered as final percentages of bridge deck areas in each condition category
and were employed to compare the results of the UAV-thermal image analysis with that of
other NDT techniques conducted on the same bridge decks.
Table 7-3: Statistical analysis for the influence of IR threshold on the identified
defective areas
Change in
Threshold (%)
Bridge (A) Bridge (B)
Bridge Deck Condition (%) Bridge Deck Condition (%)
Sound Monitoring Warning Sound Monitoring Warning
-20 31 52.4 16.6 4.5 64.9 30.6
-15 31.5 52.4 16.1 4.9 65 30.1
-10 32.1 52.1 15.8 5.2 65.1 29.7
-5 32.4 52 15.6 5.4 65.1 29.5
+5 32.9 51.8 15.3 5.7 65.2 29.1
+10 33.2 51.7 15.1 5.9 65.3 28.8
+15 33.6 51.7 14.7 6.4 65.3 28.3
+20 34.1 51.8 14.1 7.2 65.2 27.6
Mean 32.6 52.0 15.4 5.7 65.1 29.2
Standard Deviation 1.05 0.29 0.79 0.86 0.14 0.97

206
7.4 Validation of UAV/IRT Model Results
UAV-borne thermal imaging can be used to delineate surface temperature of concrete
structures from thermal infrared measurements. The present research aimed to rationalize
the use of this technology for bridge deck inspection. The resulting detection of subsurface
delaminations in RC bridge decks using remote sensing and data collection without
physical contact can be a substantial advantage of this system. When testing full-scale
bridge decks, quantifying subsurface defective areas at different severity levels remains a
challenge. The defective areas in UAV-borne thermal imaging are commonly identified
based on a visual interpretation of the captured IR images. Therefore, the thermal contrast
developed from the concrete subsurface provided numerical values for the color contrasts
that were used in the present research to process data more effectively than simply
comparing multiple images. The created 2D mosaic of the entire bridge deck facilitated the
application of a thresholding classification technique to identify objective thresholds and
distinguish the severity of subsurface delaminated areas without interference of the analyst.
However, to validate the reliability of the achieved results, the produced delamination
condition maps and the subsequent quantified defects were verified through the results of
other NDT methods, as discussed below.
7.4.1 Hammer Sounding Test Results
Hammer sounding was conducted on the bridge decks by a bridge inspector from the
Ontario Ministry of Transportation (MTO). Delaminations in the bridge decks were
detected by striking the surface with a heavy hammer and noting the type of sound being
emitted. The areas and locations of patches, spalls, delaminations, honey-combing, wet
areas, scaling and other observed defects were recorded. The created IR delamination maps
of the two surveyed bridge decks in Figs. 7-5 and 7-6 were compared with the hammer
sounding results. It was found that the location and geometry of severely delaminated
subsurface regions identified by the two methods were considerably similar. However,
hammer sounding results did not indicate the warning regions that were identified by IRT.
The quantified delaminated areas as identified by the UAV-borne thermal imaging system
are presented in Table 7-4. The total percentage of delaminated areas resulting from
hammer sounding tests were also indicated. For bridge (A), the analysis of the thermal data

207
indicated that 15.4% of the total deck area had subsurface severe delamination defects that
require repair and 52% of the total deck area requiring close monitoring, while the hammer
sounding results unveiled 17% total delaminated areas. For bridge (B), the analysis of the
thermal data indicated that 29.2% of the total deck area had subsurface severe delamination
defects that require repair and 65.1% of the total deck area requiring close monitoring,
whereas the total delaminated areas identified by hammer sounding was 32%. Thus, the
analysis procedure proposed herein could precisely define the location and extent of
delaminations in bridge decks. It was also necessary to validate the identified warning
regions using the results of a different technique as presented subsequently.
Table 7-4: Percentage of defective areas in the analyzed two bridge decks
Bridge
Deck NDT Survey Type Survey Result
Concrete Condition
Sound Monitoring Warning
Bridge (A)
UAV-borne Thermal Present Research 32.6% 52% 15.4%
Hammer Sounding MTO Record
17% Total Delaminated Areas
HCP 29.7% 56.2% 14.1%
Bridge (B)
UAV-Borne Thermal Present Research 5.7% 65.1% 29.2%
Hammer Sounding MTO Record
32% Total Delaminated Areas
HCP 8.9% 63.7% 27.4%
7.4.2 Half-Cell Potential Test Results
A corrosion survey was carried out on both bridge decks by a consulting firm specializing
in NDT of concrete structures, as part of a condition survey program with MTO. This
survey was conducted one month before the UAV thermal imaging. The principle of HCP
testing was presented in Chapter 2. HCP Testing is usually performed at points arranged in
a grid. HCP testing was performed on the surveyed bridge decks including the concrete
curbs, in accordance with the requirements of ASTM C876 and the MTO structure
rehabilitation manual. A positive ground connection was made directly to the reinforcing
steel at predefined locations and the quantified results are presented in Table 7-4. For
bridge (A), the tests indicated that 29.7% of the deck area likely had no corrosion activity,
with corrosion potential values between 0.000 V and -0.199 V. The survey identified

208
uncertain low corrosion activity for 56.2% of the deck area, with values ranging from -
0.200 V to -0.349 V. Probable active corrosion was detected for 14.1% of the deck area,
with corrosion potential values more negative than -0.350 V. These results confirm the
presence of the warning areas identified by IRT results. It should be noted that HCP results
vary with moisture conditions, temperature and ion concentration.
Figure 7-7 illustrates the corrosion potential readings for the bridge deck and curbs. The
high corrosion potential areas were mostly found along the curbs. Three drilled concrete
core specimens for chloride ion concentration analysis were retrieved from each bridge
deck. Two cores were taken at corrosion areas and one core was taken at a sound concrete
area. Evidence of corrosion was not observed on the reinforcement encountered in the cores
extracted from the deck. The chloride content at the level of the reinforcing steel was below
the chloride threshold level of 0.025% in all tested cores. The average compressive strength
of the hardened concrete for these cores was 27.1 MPa. The design drawings specified a
minimum 28-day strength of 20.7 MPa (3000 Psi) for the concrete deck. The core samples
also indicated actual overlay thickness of about 50-60 mm, while the delamination layers
were observed at about 45-50 mm depth from the concrete surface.
Figure 7-7: Condition map of bridge deck (A) indicating the potential corrosion
readings for the bridge deck and curbs using HCP testing (Omar and Nehdi, 2017).

209
For bridge (B), the results indicated that 8.9% of the deck area likely had no corrosion
activity, with corrosion potential values between 0.000 V and -0.199 V. The survey
identified uncertain low corrosion activity for 63.7% of the deck area, with potential values
ranging from -0.200 V to -0.349 V. Probable active corrosion was detected for 27.4% of
the deck area with corrosion potential values of more negative than -0.350 V. The high
corrosion potential areas were mostly found along the center line of the bridge deck and
for all curb areas. It was also observed that 13% of the deck and curb areas showed
corrosion potential values more negative than -0.450 V, and thus would require immediate
attention. These results confirm the presence of the warning areas identified by IRT results.
The areas of potential active corrosion, as indicated by the HCP testing, have been
validated by chloride ion concentration analysis. The core samples extracted from this
bridge were located at areas prone to salt exposure (e.g. high corrosion potential areas,
construction joints, low points of the deck near the curbs). For the two cores located at
corrosion areas, the chloride ion concentrations were detrimental reaching 0.033% by
concrete mass. Visual inspection results of the core samples indicated that chloride
contamination has extended to the upper layer of reinforcing in some areas of the deck,
particularly in areas with higher exposure to salt contamination. The average compressive
strength of the hardened concrete for these cores was 29.4 MPa. Figure 7-8 illustrates the
corrosion potential readings for the bridge deck and curbs. The core samples also indicated
actual overlay thickness and delamination depth similar to those indicated in Bridge (A).
Figure 7-8: Condition map of bridge deck (B) indicating the potential corrosion
readings for the bridge deck and curbs using HCP testing (Omar and Nehdi, 2017).

210
7.5 Evaluation of the Proposed UAV/IRT Model
The delamination maps achieved from the thermal analysis in Figs. 7-5 and 7-6 were
compared with the corrosion maps provided by the HCP testing results in Figs. 7-7 and 7-
8. It should be noted that IRT and HCP have different working mechanisms, and thus are
associated with capability of detecting different deterioration defects. In addition, corrosion
is among several reasons that could lead to delaminations in RC bridge decks. Despite such
differences, their condition maps were comparable. Though the locations and shapes
(geometry) of the defects do not match exactly, the areas in which potential
delaminations/corrosion activity were identified had reasonable correlation. Comparing the
area percentages as indicated by both techniques, it can be observed from Table 7-4 that
all areas which had potential active corrosion as identified by the HCP testing were also
indicated by IRT results. Conversely, not all the identified delaminated areas were
indicated by the HCP results. This indicates that only areas with high probability of
advanced corrosion activity were identified by the HCP testing. Such results comply with
that of previous studies, which indicated that in most bridge structures, areas of corrosion
are usually associated with delamination even if cracks are not detected directly. Thus, the
analysis procedure proposed in the present research could define the potential location and
extent of delaminations in concrete bridge decks with acceptable accuracy.
Despite the accuracy of the developed analysis procedure in detecting and quantifying
delaminated areas in the surveyed bridge decks, the results could be affected by the
precision of the UAV-thermal system orientation during flying. Therefore, a more rigorous
analysis could be achieved based on a photogrammetric 3D reconstruction and generation
of orthophotos, in which the internal and external orientation, triangulation and bundle
adjustment could be considered. There are several commercial software capable of
producing accurate 3D stereomodels, orthophotos and orthomosaics from data collected by
various sensor systems. These orthophotos and mosaics are geographically referenced and
commonly created using automated tools for tie-point matching, orthorectification, relative
orientation, and color-balancing. However, it should be noted that inaccuracies in input
control values could cause problems in the photogrammetric modeling process, and thus it
is preferable to employ the capture app belonging to the utilized software in the data

211
acquisition process to ensure adequate quality imagery and accurate geospatial control in
order to facilitate the creation of such orthomosaics.
7.6 Further Research to Improve the Proposed System
Wireless connectivity and maneuverability are two key parameters that can facilitate using
UAV systems in inspections of bridge components thus enhancing bridge inventory
management. For instance, using a UAV equipped with different sensors (e.g. LiDAR,
thermal and optical cameras, etc.) should allow the collection of imagery that highlights
surface (e.g. spalls and patches) and sub-surface (delamination) defects in bridge decks and
soffits. Using such UAV multi-sensors along with inertial and spatial sensors could assist
in producing geo-registered 3D data for bridges. UAVs can also be effectively utilized for
determining stream or river bank conditions at bridge ends. They can serve for monitoring
specific geotechnical assets related to bridges, including slope stability assessment,
dynamic bank erosion and lateral scour conditions (Otero et al., 2015). Despite these
benefits, UAV systems have some limitations. For example, due to their small payload,
only small and light digital and thermal cameras can be used for photo or video
documentation. The limited payload allows only small battery packs, which causes a
relatively short flight time. Furthermore, due to the low weight, the flight system is very
sensitive to changes in weather conditions, especially during high wind speeds, which can
compromise image quality or impose a change from automatic to manual flight mode,
which requires especially well-trained operators (Hallermann and Morgenthal, 2013).
Such considerations mandate concerted research efforts for instance to: (1) enhance UAV
performance in various wind conditions that can be experienced during bridge inspections;
(2) investigate the relation between the flight altitude and the accuracy of detecting
subsurface anomalies; (3) study the effects of vibration which camera gimbals could be
exposed to during flights; (4) explore the effects of using different propeller types on the
UAV stability; (5) conduct cost estimation studies that consider parameters associated with
operating UAVs during bridge inspection, such as data collection and operator’s time costs,
equipment costs including batteries, and the maintenance or repair costs; (6) develop
several effective image post-processing algorithms for defect detection and classification;
and (7) establish a guide for practical implementation in order to incorporate the UAV

212
technology in bridge inspection manuals. It should also be noted that to utilize UAVs as an
effective tool in bridge inspection, qualified bridge inspectors should be trained to operate
such UAV systems in order to ensure high flight performance and objective inspection
processes. Other options that may be desirable by bridge owners include conducting
inspections through partnerships with private companies that offer UAV-based data
collection services.
7.7 Conclusions
The UAV technology is evolving at a rapid pace, becoming more reliable and efficient.
UAVs allow remote imaging, which can be useful in infrastructure condition evaluation.
The present research demonstrates the applicability of UAV and associated thermal
imaging for quantitative measurements of delaminations in RC bridge decks. Two bridge
deck case studies demonstrated the potential of using UAV-borne thermal imaging in fast
and safe data acquisition for the condition assessment of RC bridge decks. The subsurface
defect regions identified by the proposed system were confirmed through the results of
other NDT techniques including hammer sounding and HCP testing. Thus, UAVs could
provide reliable, rapid and cost-effective bridge deck evaluation compared with
conventional methods, which involve laborious inspections of bridge decks, especially at
the network-level. The remote sensing feature of UAV avoids traffic disturbance and
mitigates risk associated with bridge inspections.
The proposed methodology allows post-flight data processing. A robust analysis procedure
was developed herein to detect and classify the severity of subsurface delaminations in RC
bridge decks. Thus, UAV could become a preferred method for IR imaging of bridge decks.
This would enable monitoring the progression of deterioration through regular surveys and
facilitate surveying hundreds of bridges. Consequently, this could yield sizeable reductions
in costs associated with the application of NDT technologies and in the frequency and
duration of traffic interruptions. Periodic UAV-borne thermal imaging surveys can help
bridge owners assess bridge condition at all service life stages, thus making repair decisions
based on actual condition data by tracking areas of anomalies and prioritizing maintenance
needs. While the attention herein has been mainly devoted to the condition evaluation of
RC bridge decks, UAV-borne thermal imaging can be advantageously exploited on other

213
bridge components. In future work, the authors plan to explore the applicability of the
deployed system to bridge soffit areas. In addition, the application of further developed
image processing tools on the infrared thermal data, along with artificial intelligence-based
approaches, can result in full automation of the analysis and augmentation of the decision-
making process to make it more effective.
7.8 References
ASTM. D4788-03 (2013). “Standard Test Method for Detecting Delaminations in Bridge
Decks Using Infrared Thermography.” ASTM International, West Conshohocken,
PA. www.astm.org.
ASTM. C876-09 (2009). “Standard Test Method for Corrosion Potentials of Uncoated
Reinforcing Steel in Concrete.” ASTM International, West Conshohocken, PA.
www.astm.org.
Brooks, C., Dobson, R., Banach, D., Dean, D., Oommen, T., Wolf, R., Havens, T.,
Ahlborn, T., and Hart, B. (2015). “Evaluating the Use of Unmanned Aerial Vehicles
for Transportation Purposes.” Michigan Tech Research Institute, Report, 201 p.
Chen, E., Rice, C., Boyle, C., and Hauser, E. (2011). “Small-format aerial photography for
highway-bridge monitoring.” Performance of Constructed Facilities, Vol. 25 (2),
105-112.
Ellenberg, A., Kontsos, A., Moon, F., and Bartoli, I. (2016). “Bridge related damage
quantification using unmanned aerial vehicle imagery.” Structure Control Health
Monitoring, Vol. 23 (9), 1168 – 1179.
Gillins, M., Gillins, D., and Parrish, C. (2016). “Cost-Effective Bridge Safety Inspections
Using Unmanned Aircraft Systems (UAS).” Proc., Geotechnical and Structural
Engineering Congress, Phoenix, Arizona, United States, 165-177.
Harris, D., Brooks, C., and Ahlborn, T. (2016). “Synthesis of Field Performance of Remote
Sensing Strategies for Condition Assessment of In-Service Bridges in Michigan.”
Performance of Constructed Facilities, Vol. 30 (5), 1-19.
Hallermann, N., and Morgenthal, G. (2013). “Unmanned Aerial Vehicles (UAV) for the
Assessment of Existing Structures.” Proc., IABSE Conference, Rotterdam,
Netherlands, Vol. 101(14), 1-8.
Khan, F., Ellenberg, A., Mazzotti, M., Kontsos, A., Moon, F., Pradhan, A., and Bartoli, I.
(2015). “Investigation on Bridge Assessment Using Unmanned Aerial Systems.”
Proc., Structures Congress, ASCE, Portland Oregon, United States, 404-413.
Omar, T., and Nehdi, M. (2017). “Unmanned Aerial Vehicle Infrared Thermography
Remote Sensing for Condition Assessment of Concrete Bridge Decks.” J. of
Automation in Construction. DOI: 10.1016/j.autcon.2017.06.024.

214
Vaghefi, K., Oats, R., Harris, D., Ahlborn, T., Brooks, C., Endsley, K., Roussi, C., and
Shuchman, R. (2012). “Evaluation of Commercially Available Remote Sensors for
Highway Bridge Condition Assessment.” Bridge Engineering, Vol. 17 (6), 886-
895.
Vasterling, M., and Meyer, U. (2013). “Challenges and Opportunities for UAV-Borne
Thermal Imaging.” In book: Thermal Infrared Remote Sensing, Chapter 4,
Publisher: Springer, Editors: Claudia Kuenzer and Stefan Dech, 69-93.
Washer, G., Fenwick, R., and Nelson, S. (2013). “Guidelines for the Thermographic
Inspection of Concrete Bridge Components in Shaded Conditions.” Proc., 92nd
Annual Meeting, TRB, Washington, DC, 1-14.

215
Chapter 8
8. Summary, Conclusions and Recommendations
8.1 Summary and Conclusions
Subsurface delamination, which is primarily caused by the corrosion of steel
reinforcement, is the most common damage mechanism that can compromise the service
life of RC bridge decks. Visual inspection is still the most used method for bridge condition
assessment. Research results have shown that assessing the condition of a bridge deck by
visual inspection is unreliable, as it often does not reveal real conditions, nor does it point
to correct priorities when decisions about repair works are made. IRT has gradually gained
wider acceptance as a NDT and evaluation tool in the civil engineering field. Therefore,
the main goal of this dissertation is to develop an automated condition assessment
procedure for RC bridge decks based on the IRT technology. The research also aimed to
develop a combination process between the IRT and the GPR survey results to provide
more precise assessments of RC bridge deck conditions. In addition, the research aimed to
develop a new bridge deck rating index as a health indicator of the overall bridge deck
condition based on the integration of IRT, GPR, and visual inspection defects’
measurement. Another focus of the research program was to explore the feasibility of using
UAVs for detecting hidden defects in RC bridge decks.
In Chapter 2, state-of-the-art of bridge condition assessment was appraised. To proceed
with this task, a comprehensive review was undertaken aiming to gain a perspective on
technical issues associated with bridge condition assessment techniques and deterioration
prediction tools that have been used successfully. Current practices and other advanced
evaluation methodologies, which employ artificial intelligence techniques, were examined.
The review indicated a clear need to upgrade existing BMSs to incorporate recent research
in the bridge condition assessment domain. Also, the review demonstrated that reliable
bridge condition assessment can be effectively achieved using several complementary
NDT technologies. Thus, this dissertation pursued such approach.
In Chapter 3, an evaluation of the capabilities and limitations of the most common NDT
techniques used to detect and characterize typical deterioration mechanisms in concrete

216
bridge decks was carried out. A fuzzy hierarchical decision-making model was developed
to evaluate the techniques from the perspectives of capability, speed, simplicity, accuracy,
and cost. The results revealed that no single technology is capable of recognizing all
deterioration types. IRT was identified as the most rapid technology capable of detecting
delaminations in RC bridge decks accurately. Yet, it is the NDT technology of choice by
transportation agencies due to the difficulty of establishing a rule-based criterion by which
to evaluate its raw data. Thus, automation of the analysis process of the IRT survey was
one of the main objectives of this dissertation.
In Chapter 4, a robust automated analysis procedure for detecting and classifying
delaminations in RC bridge decks using IRT technology was developed. The developed
approach resulted in effective identification of delaminated areas within the bridge decks
of several full-scale case studies. It allows for the detection of subsurface delaminations at
different survey times and environmental conditions, and hence, solves a major concern
that has been of interest to many researchers in the NDT community for a long time. The
developed system could stimulate wider acceptance of IRT as a rapid, systematic and cost-
effective evaluation technique for critical bridge deck subsurface deficiencies.
Consequently, adding this invaluable technique to the bridge inspector’s tool box
encourages a focus on the maintenance and repair budgets of the most deserving bridge
decks.
In Chapter 5, IRT and GPR testing were employed to survey full-scale RC bridge decks
and their results were combined to maximize the capabilities of each method and
compensate for the limitations. The developed integration analysis aimed to rationalize
their combined use as reliable NDT tools for bridge deck inspection. The developed
integration methodology produced condition maps that delineate the different severity
levels of subsurface delaminated and potential active corroded areas. The achieved results
provided a great degree of confidence in the overall identified deterioration quantities.
Consequently, employing the developed approach could provide rapid and reliable
analysis, and an excellent harvest of information for maintenance decision makers.

217
In Chapter 6, an integrated bridge deck condition rating system based on the results of
visual inspection, IRT, and GPR techniques was developed. The developed computational
algorithms link technology-based (NDT) and inspector findings in an objective manner,
while preserving the uncertain properties of the deterioration processes of bridge decks.
The relative importance of the deterioration mechanisms and the gradual transition from
one condition category to another were considered in the rating process. The developed
model accounts for both surface and hidden quantified defects. The accuracy of the model
was improved by combining NDT and visual inspection results in an uncertainty fuzzy-
based mathematical methodology. Thus, a unique and useful integration process was
developed, which should be emulated by other researchers in the bridge infrastructure field.
In Chapter 7, the potential for using thermal imaging with remote sensing unmanned aerial
vehicles as carrying devices to evaluate the sub-surface conditions of RC bridge decks was
demonstrated. Thus, UAV equipped with high definition photo and thermal cameras can
facilitate the inspection tasks of bridge infrastructure. The proposed UAV-IRT system is
capable of frequent bridge deck inspection at low cost, rapid and safe data collection, and
provides reliable quantitative results. The proposed system could help transportation
agencies in identifying critical deficiencies at various service life stages, and thus, apply
proactive maintenance actions. In addition, considerable reductions in costs associated with
the inspection processes of bridge decks and in the frequency and duration of traffic
interruptions can be achieved.
8.2 Recommendations for Future Research
The current thesis discusses several topics related to bridge condition assessment and
highlights some challenges that require further concerted research efforts as follows:
1. Exploring the applicability of the automated IRT analysis procedure developed in this
research to bridge soffit areas; correlating the findings of daytime and nighttime survey
results; and studying the reliability of the developed system in detecting defects in the
presence of asphalt overlays.

218
2. Investigating the capability of applying an IRT continuous monitoring system for
detecting the depth and thickness of delaminations in full-scale RC bridge decks.
3. Studying the characterization of IRT data using several feature vectors of the recorded
pixel readings in the thermal images. For example, using the pixel shape and texture
instead of relying only on the pixel numerical values.
4. Advancing the application of other IRT image processing techniques, along with
artificial intelligence-based approaches, to provide more objective classification of the
detected delamination categories and augment a faster decision-making process.
5. Conducting extensive NDT comparative studies on full-scale deteriorated bridges and
quantifying the achieved results to motivate practical evaluation of the employed
methods and their wider implementation in bridge inspection.
6. Developing various fully automated data acquisition and analysis processes using
several complementary NDT techniques to improve the efficiency, reliability and
repeatability of NDT data collection and interpretation.
7. Developing computational algorithms for integrating various NDT accomplished
results in order to have fully objective condition assessment systems.
8. Improving the bridge condition rating model developed in this research by utilizing
various NDT techniques, including other bridge elements and components, and
considering more possible deterioration mechanisms.
9. Developing correlations between the bridge element damage and internal deterioration
processes and investigating the structural robustness and redundancy concepts in the
assessment process in order to determine bridge elements’ or components’ conditions
based on their resilience.
10. Studying the rebar spacing variation, surface properties, and structural variation and
construction quality on the efficiency of analyzing GPR reflection amplitudes.

219
11. Utilizing UAV multi-sensors along with inertial and spatial sensors for producing geo-
registered 3D data for bridges and detecting surface and subsurface defects in bridge
decks as well as inaccessible areas, such as bridge soffits.
12. Exploring the use of UAV multi-sensor systems for determining stream or river bank
conditions at bridge ends and for monitoring specific geotechnical assets related to
bridges, including slope stability assessment, dynamic bank erosion and lateral scour
conditions.
13. Establishing a guide for practical implementation of UAV multi-sensor systems in
order to incorporate this emerging technology in bridge inspection manuals.

220
Appendix A (Questionnaire Survey)
221

222

223

224

225

226

227

228
Appendix B (Copyright Permissions)

229

230

231

232
CURRICULUM VITAE
Name: Tarek Omar, P.Eng.
Post-secondary Ain Shams University
Education and Cairo, Egypt
Degrees: 1979-1984 B.Sc.
The University of Western Ontario
London, Ontario, Canada
2012-2013 M.Sc.
The University of Western Ontario
London, Ontario, Canada
2014-2017 Ph.D.
Honours and Alexander Graham Bell Canada Graduate Scholarships (NSERC)
Awards: 2016-2017, 2017-2018
Doctoral Excellence Research Award (UWO)
2016-2017
Province of Ontario Graduate Scholarship (OGS)
2015-2016
Transportation Association of Canada Scholarship (TAC)
2015-2016
Academic Achievement Scholarships (UWO)
2014-2015, 2015-2016, 2016-2017
Related Work Research and Teaching Assistant
Experience University of Western Ontario
2012-2017
Project Director / Independent Reviewer
Hyder International Consulting, UK
1998-2011
Project Manager
Dorsch International Consultant, Germany
1990-1998
Executive Engineer
Arab Contracting “Osman Ahmed Osman”, Egypt
1984-1990

233
Publications:
Articles Published in Refereed Journals:
Omar, T., Nehdi, M., and Zayed, T. (2018). “Infrared Thermography Model for
Automated Detection of Delamination in RC Concrete Bridge Decks.” J. Construction and
Building Materials. Vol. 168, pp: 313-327. DOI: 10.1016/j.conbuildmat.2018.02.126
(Ph.D. work).
Omar, T., and Nehdi, M., (2017). “Unmanned Aerial Vehicle Infrared Thermography
Remote Sensing for Condition Assessment of Concrete Bridge Decks.” J. Automation in
Construction. Vol. 83, pp: 360-371. DOI: 10.1016/j.autcon.2017.06.024 (Ph.D. work).
Omar, T., Nehdi, M., and Zayed, T. (2017). “Integrated Condition Rating Model for
Reinforced Concrete Bridge Decks.” J. Performance of Constructed Facilities. Vol. 31
(5), pp: 04017090 (1-14). DOI: 10.1061/(ASCE)CF.1943-5509.0001084 (Ph.D. work).
Omar, T., Nehdi, M., Zayed, T. (2017). “Rational Condition Assessment of Reinforced
Concrete Bridge Decks Subjected to Corrosion-Induced Delamination.” J. Materials in
Civil Engineering. DOI: 10.1061/(ASCE)MT.1943-5533.0002114 (Ph.D. work).
Omar, T., Nehdi, M., and Zayed, T. (2017). “Performance of NDT Techniques in
Appraising Condition of Reinforced Concrete Bridge Decks.” J. Performance of
Constructed Facilities. Vol. 31 (6), 04017104 (1-16). DOI: 10.1061/(ASCE)CF.1943-
5509.0001098 (Ph.D. work).
Omar, T., and Nehdi, M. (2017). “Thermal Detection of Sub-Surface Defects in
Concrete Bridge Decks Using Unmanned Ariel Vehicle.” In Press, American Concrete
Institute (ACI) Special Publication. (Ph.D. work).
Omar, T., and Nehdi, M. (2016). “Data Acquisition Technologies for Construction
Progress Tracking.” J. Automation in Construction. Vol. 70, pp: 143-155.
DOI: 10.1016/j.autcon.2016.06.016 (Ph.D. work).
Omar, T., and Sadrekarimi, A. (2015). “Effect of Triaxial Specimen Size on Engineering
Design and Analysis.” International J. of Geo-Engineering, Vol. 6 (1); pp: 1-17.
DOI: 10.1186/s40703-015-0006-3 (M.E.Sc. work).
Omar, T., and Sadrekarimi, A. (2015). “Specimen Size Effects on the Behaviour of
Loose Sand in Triaxial Compression Tests.” Canadian Geotechnical Journal, Vol. 52
(6), pp: 732-746. DOI: 10.1139/cgj-2014-0234 (M.E.Sc. work).
Omar, T., and Sadrekarimi, A. (2014). “Effects of Multiple Corrections on Triaxial
Compression Testing of Sands.” J. of GeoEngineering, Vol. 9 (2), pp: 33-40.
DOI: 10.6310/jog.2014.9(2).3 (M.E.Sc. work).
Articles Submitted to Refereed Journals:
Omar, T., Nehdi, M., Zayed, T. (2017). “Condition Assessment of Reinforced Concrete
Bridges: Current Practice and Research Challenges.” Canadian Journal of Civil
Engineering. Submission ID #: cjce-2017-0339 (Ph.D. work).

234
Papers Published in Peer-Reviewed Conference Proceedings:
Omar, T., and Nehdi, M. (2017). “Clustering-Based Threshold Model for Condition
Assessment of Concrete Bridge Decks Using Infrared Thermography.” Chapter. In book:
“Facing the Challenges in Structural Engineering, Sustainable Civil Infrastructures”, pp:
242-253. H. Rodrigues et al. (eds.), Springer International Publishing AG. Switzerland.
DOI: 10.1007/978-3-319-61914-9_19
Omar, T., and Nehdi, M. (2017). “Automated Data Collection for Progress Tracking
Purposes: A Review of Related Techniques." Chapter. In book: “Facing the Challenges in
Structural Engineering, Sustainable Civil Infrastructures”, pp: 391-405. H. Rodrigues et
al. (eds.), Springer International Publishing AG. Switzerland.
DOI: 10.1007/978-3-319-61914-9_30
Omar, T., and Nehdi, M. (2016) “Non-Destructive Testing of Bridge Deck Using Passive
Infrared Thermography & Ground Penetrating Radar.” In Proceedings, Annual Conference
of the Transportation Association of Canada (TAC), Toronto, Canada, Sep 25-28.
Omar, T., and Nehdi, M. (2016) “Application of Passive Infrared Thermography for the
Detection of Defects in Concrete Bridge Elements.” In Proceedings, Annual Conference
of the Transportation Association of Canada (TAC), Toronto, Canada, Sep 25–28.
Omar, T., and Nehdi, M. (2016) “Condition Assessment and Deterioration Prediction
Tools for Concrete Bridges: A New Look.” In Proceedings, Annual Conference of the
Canadian Society of Civil Engineering (CSCE), London, Ontario, Canada, June 1-4.
Omar, T., and Nehdi, M. (2016) “Evaluation of NDT Techniques for Concrete Bridge
Decks Using Fuzzy Analytical Hierarchy.” In Proceedings, Annual Conference of the
Canadian Society of Civil Engineering (CSCE), London, Ontario, Canada, June 1-4.
Omar, T., and Nehdi, M. (2015) “Learned Lessons from Adelaide Desalination Project.”
In Proceedings, Annual Conference of the Canadian Society of Civil Engineering (CSCE),
Regina, Saskatchewan, Canada, May 27–30.
Omar, T., and Sadrekarimi, A. (2015). “Corrections Effect on Shear Strength Parameters
of Loose Ottawa Sands.” In Proceedings, Annual Conference of the Canadian Society of
Civil Engineering (CSCE), Regina, Saskatchewan, Canada, May 27–30.
Omar, T., and Sadrekarimi, A. (2014) “Specimen Size Effect on Shear Behaviour of Loose
Sand in Triaxial Testing and its Implication in Engineering Design and Analysis.” In
Proceedings, Annual Conference of the Canadian Geotechnical Society (CGS),
GeoRegina, Regina, Saskatchewan, Canada. September 27-30.
Omar, T., Osouli, A., and Sadrekarimi, A. (2014). “Influence of Specimen Size in
Engineering Practice.” In Proceedings, Geotechnical Special Publication, Geo-Congress
(ASCE), Atlanta, Georgia, USA. February 23-26. DOI: 10.1061/9780784413272.287